Embed Size (px)
Citation preview
1
Why We Need More Coal Based Electricity: Energy Realities Facing the United States
Frank Clemente Ph.D.Senior Professor of Social Science & Energy PolicyPenn State [email protected]
22
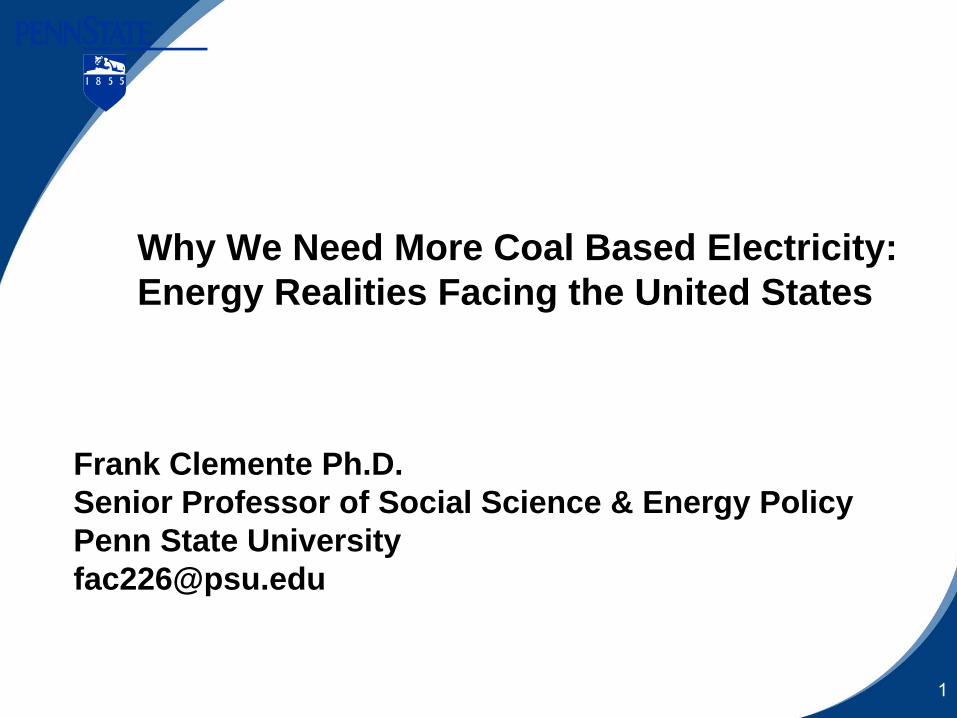
Energy is GoodPeople in Societies with Greater Access to Electricity:
25% 90% average percent of population with access to electricity
3
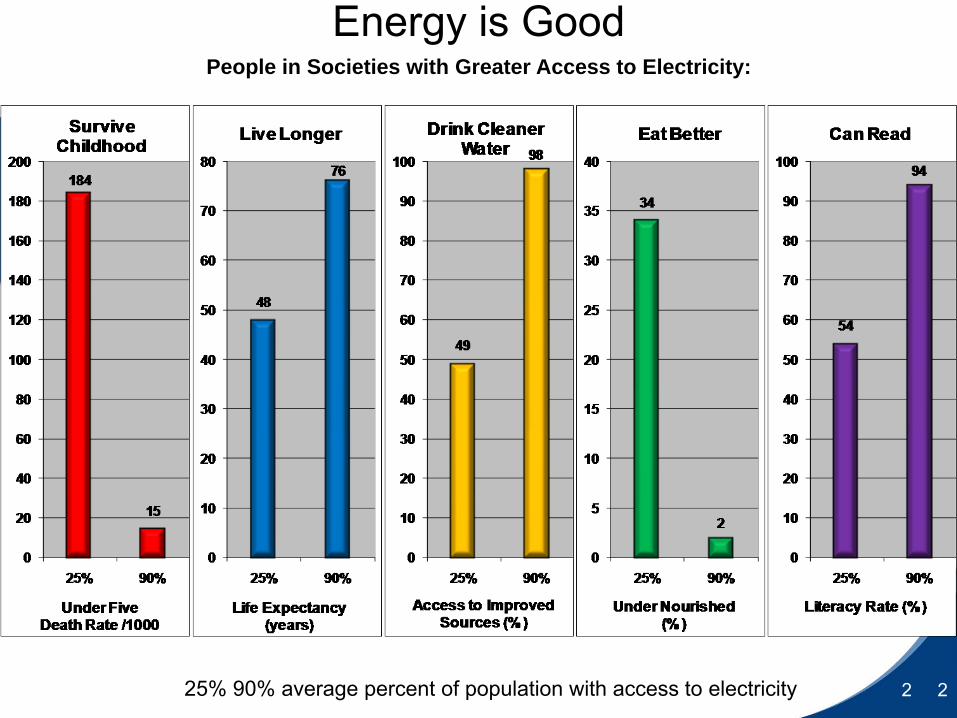
SCALE SETS THE CONTEXT: If Current Electricity Demand Was a 6 Foot Tall Man
Global Electricity Consumption-1970-2030
44
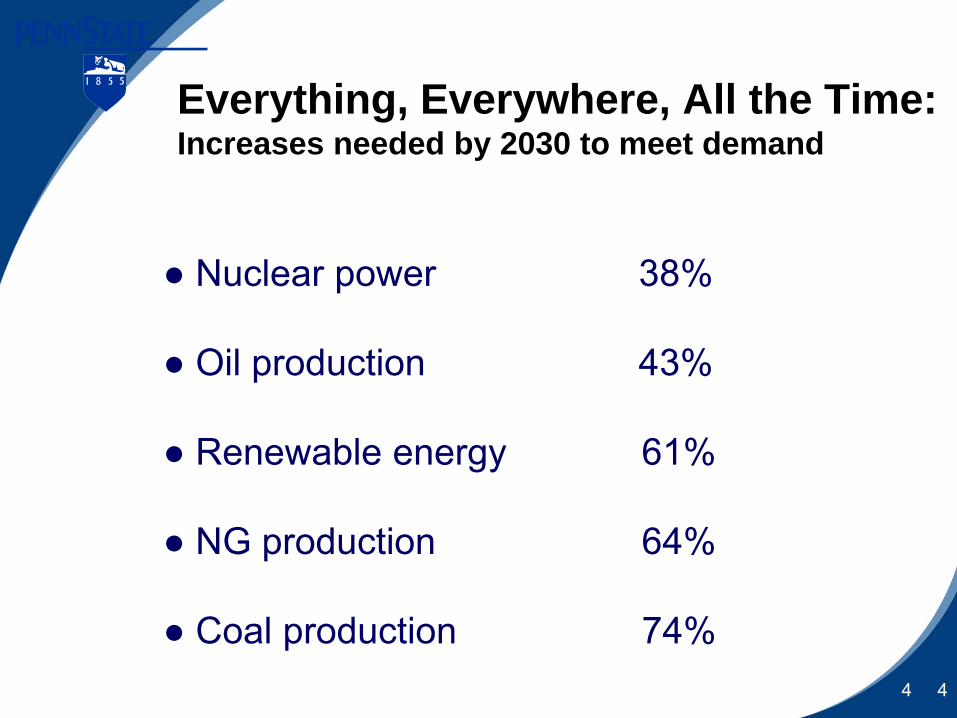
Everything, Everywhere, All the Time:Increases needed by 2030 to meet demand
● Nuclear power 38%
● Oil production 43%
● Renewable energy 61%
● NG production 64%
● Coal production 74%
5555
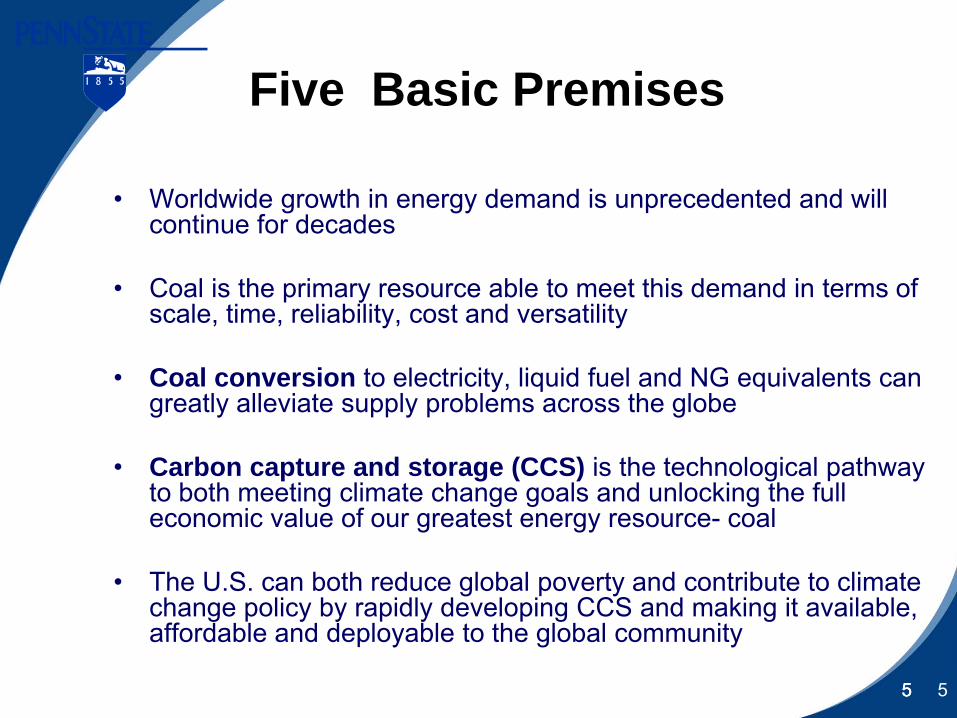
Five Basic Premises
• Worldwide growth in energy demand is unprecedented and will continue for decades
• Coal is the primary resource able to meet this demand in terms of scale, time, reliability, cost and versatility
• Coal conversion to electricity, liquid fuel and NG equivalents can greatly alleviate supply problems across the globe
• Carbon capture and storage (CCS) is the technological pathway to both meeting climate change goals and unlocking the full economic value of our greatest energy resource- coal
• The U.S. can both reduce global poverty and contribute to climate change policy by rapidly developing CCS and making it available, affordable and deployable to the global community
6
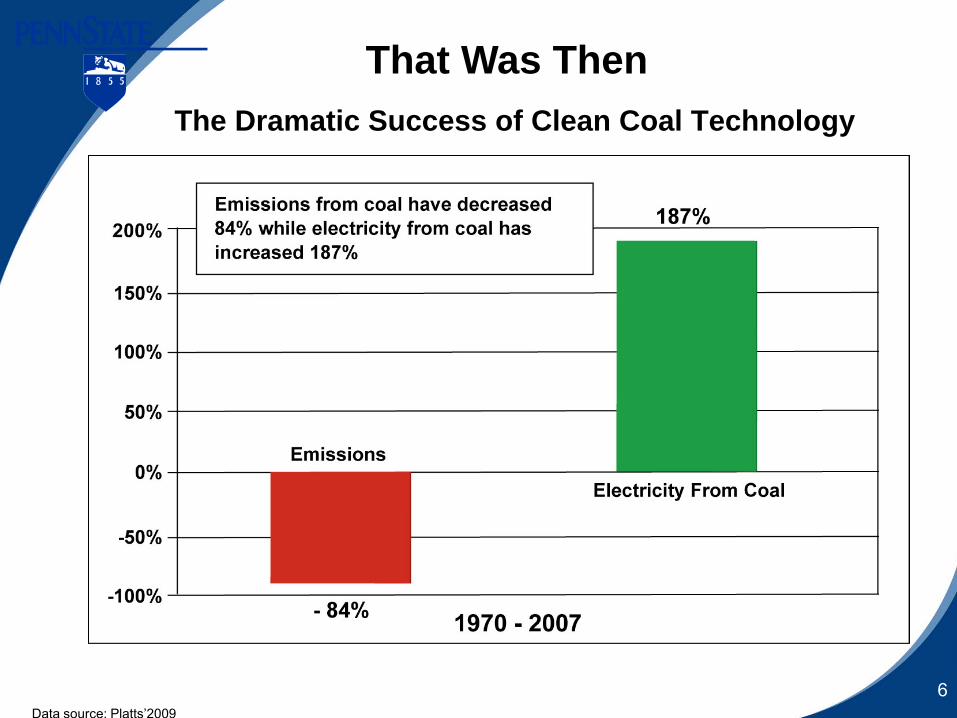
The Dramatic Success of Clean Coal Technology
Data source: Platts’2009
That Was Then
7
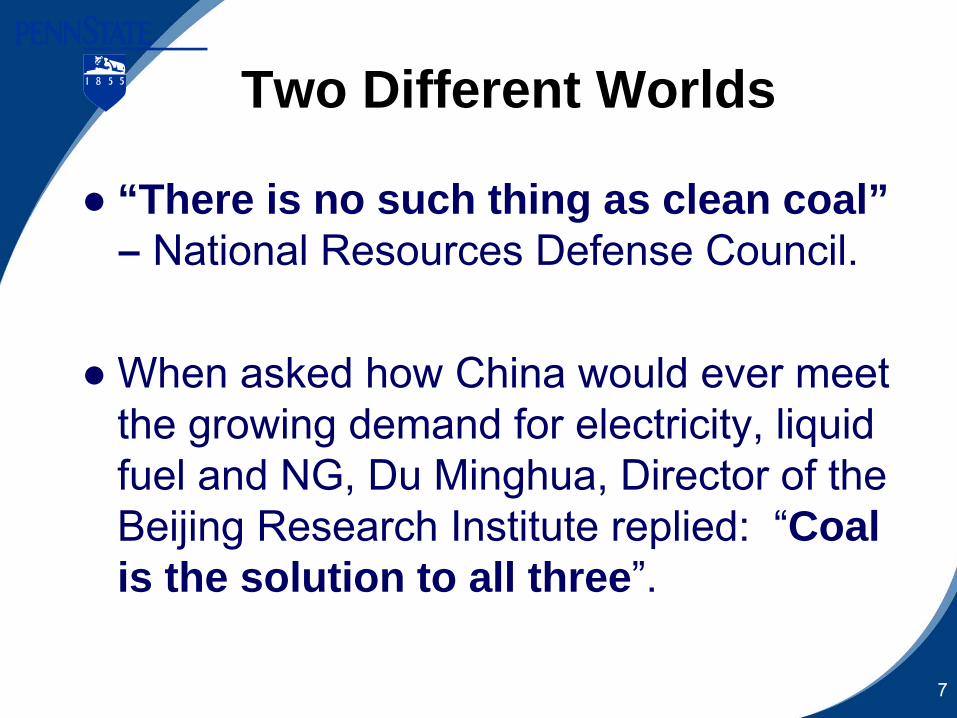
Two Different Worlds
● “There is no such thing as clean coal” – National Resources Defense Council.
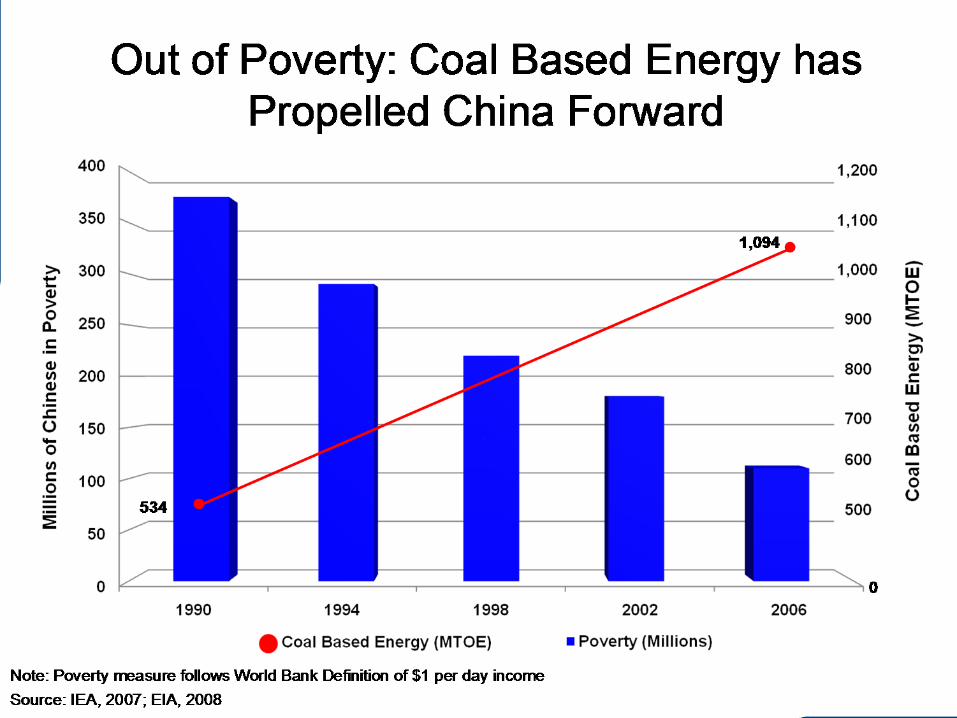
● When asked how China would ever meet the growing demand for electricity, liquid fuel and NG, Du Minghua, Director of the Beijing Research Institute replied: “Coal is the solution to all three”.
88
9
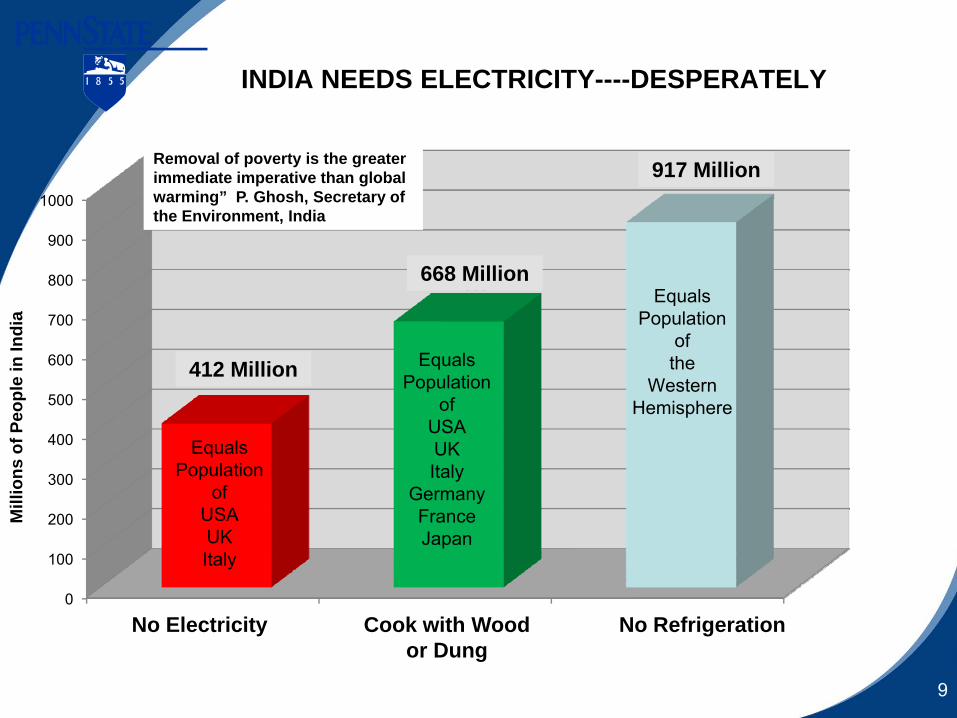
INDIA NEEDS ELECTRICITY----DESPERATELY
0
100
200
300
400
500
600
700
800
900
1000
No Electricity Cook with Wood or Dung No Refrigeration
412
668
917
Mill
ions
of P
eopl
e in
Indi
a
EqualsPopulation
of USA UK Italy
EqualsPopulation
ofUSAUKItaly
GermanyFranceJapan
EqualsPopulation
ofthe
WesternHemisphere
No Electricity
Removal of poverty is the greater immediate imperative than global warming” P. Ghosh, Secretary of the Environment, India
Cook with Wood or Dung
No Refrigeration
412 Million
668 Million
917 Million
1010
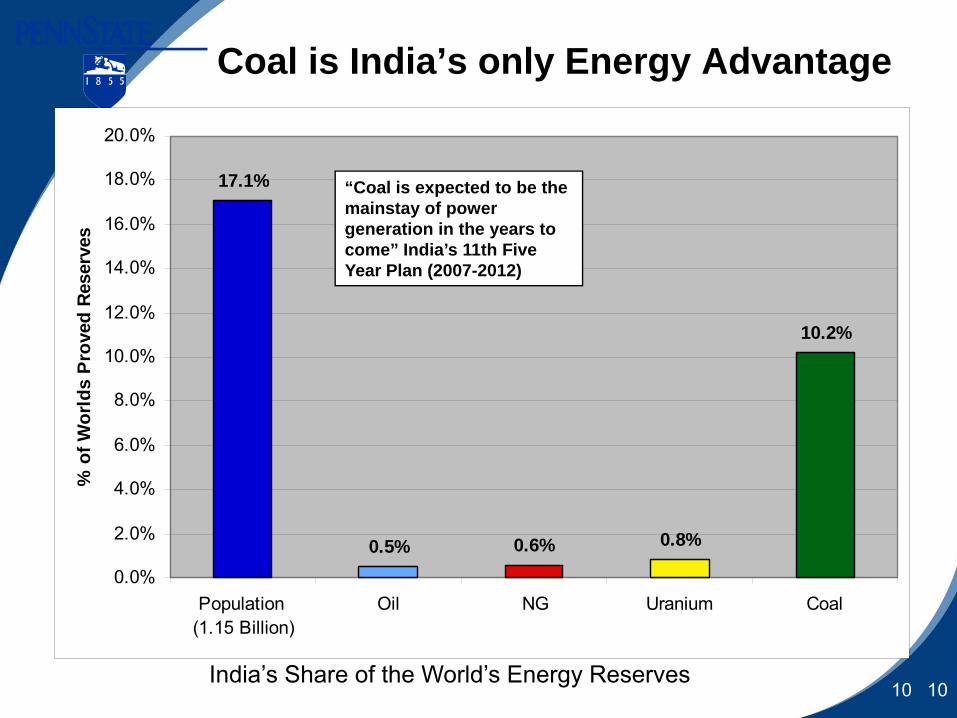
17.1%
0.5% 0.6% 0.8%
10.2%
0.0%
2.0%
4.0%
6.0%
8.0%
10.0%
12.0%
14.0%
16.0%
18.0%
20.0%
Population (1.15 Billion)
Oil NG Uranium Coal
% o
f Wor
lds
Prov
ed R
eser
ves
Coal is India’s only Energy Advantage
India’s Share of the World’s Energy Reserves
“Coal is expected to be the mainstay of power generation in the years to come” India’s 11th Five Year Plan (2007-2012)
1111
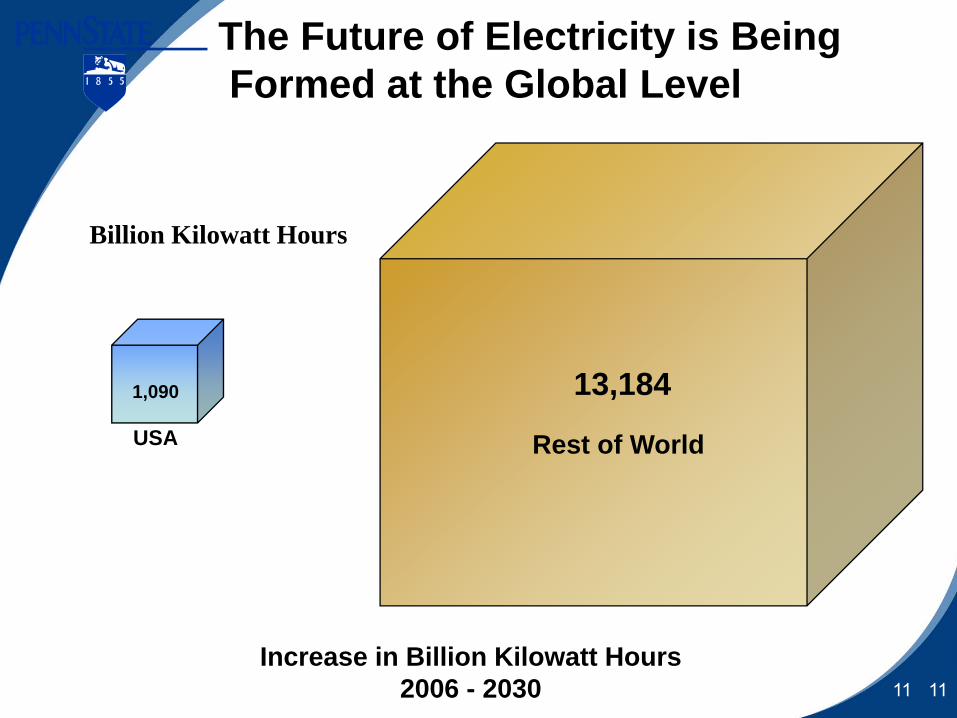
The Future of Electricity is BeingFormed at the Global Level
Rest of World
13,184
Increase in Billion Kilowatt Hours2006 - 2030
USA
1,090
Billion Kilowatt Hours
12
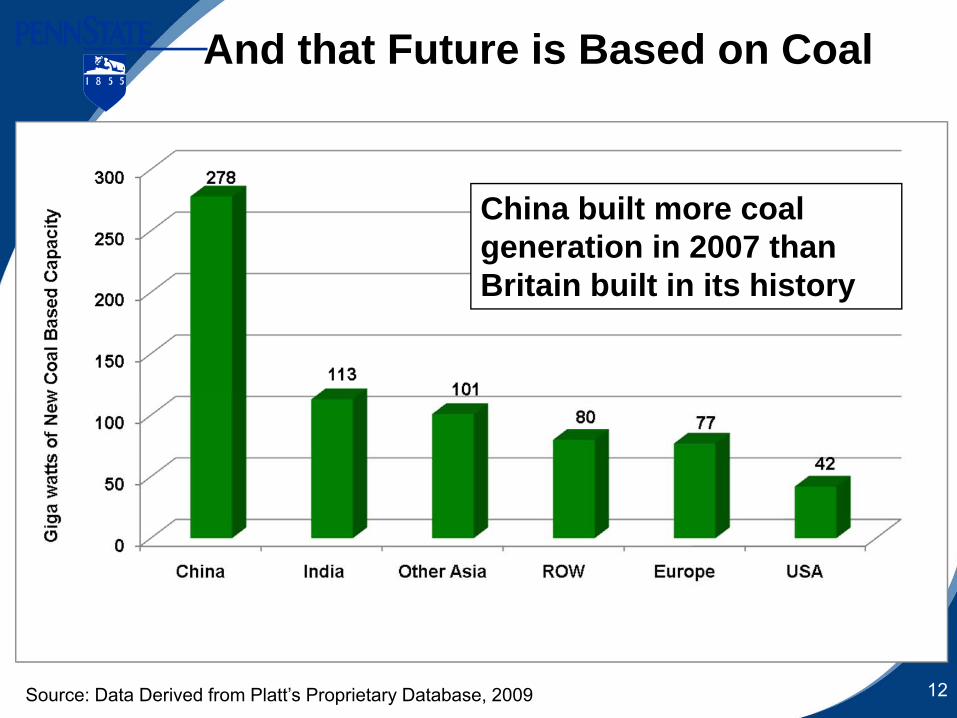
And that Future is Based on Coal
Source: Data Derived from Platt’s Proprietary Database, 2009
China built more coal generation in 2007 than Britain built in its history
13
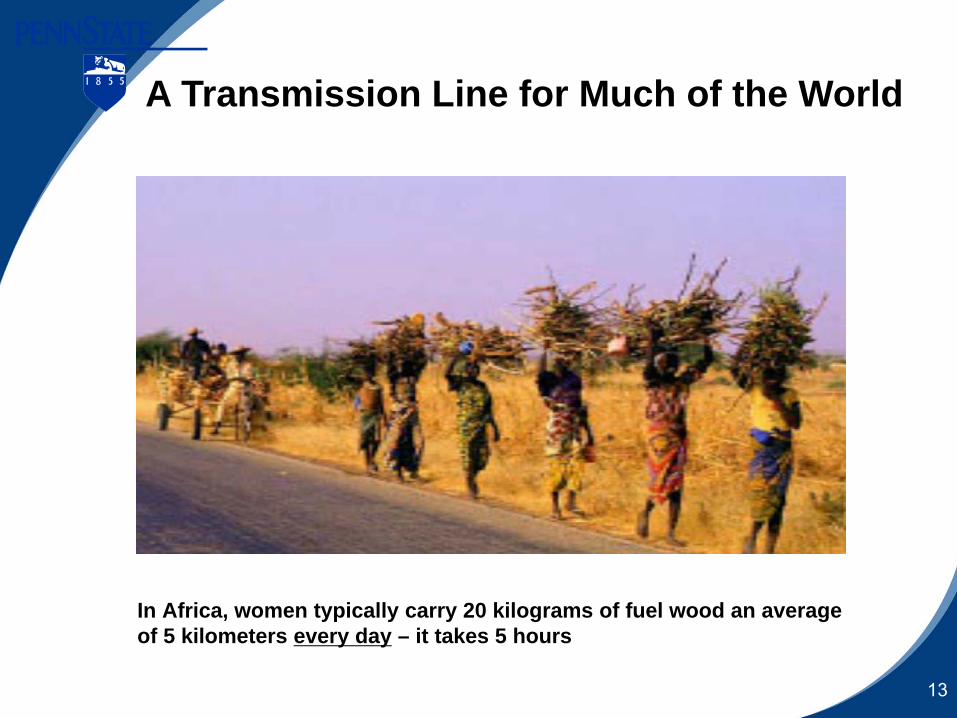
In Africa, women typically carry 20 kilograms of fuel wood an average of 5 kilometers every day – it takes 5 hours
A Transmission Line for Much of the World
14
WHERE WILL THE ELECTRICITY COME FROM IN THE UNITED STATES?
1515
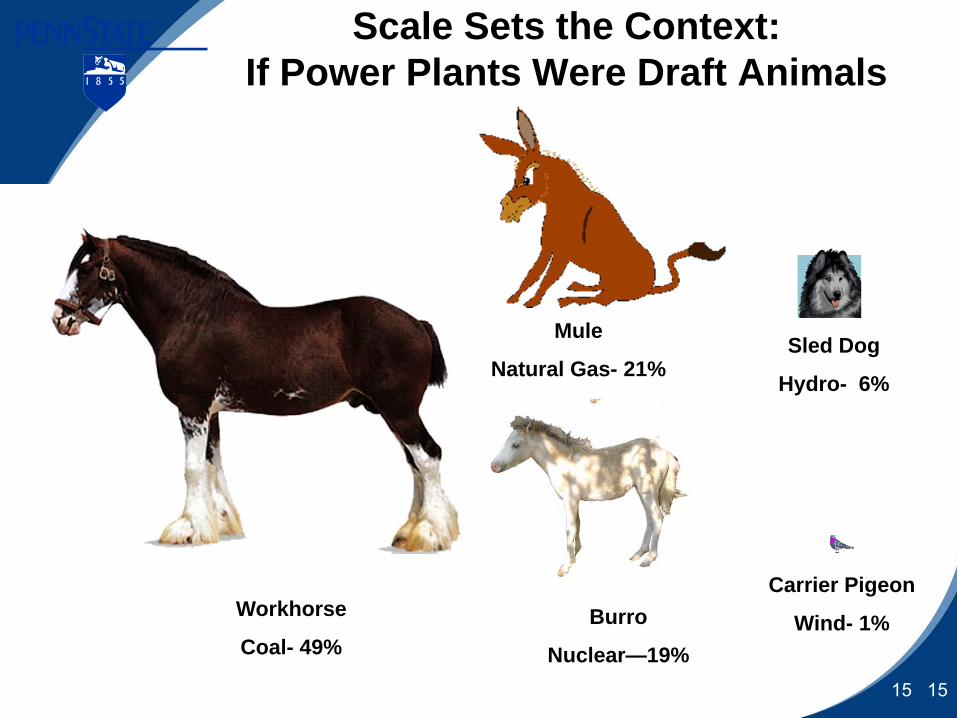
Scale Sets the Context:If Power Plants Were Draft Animals
Workhorse
Coal- 49%Burro
Nuclear—19%
Mule
Natural Gas- 21%Sled Dog
Hydro- 6%
Carrier Pigeon
Wind- 1%
1616
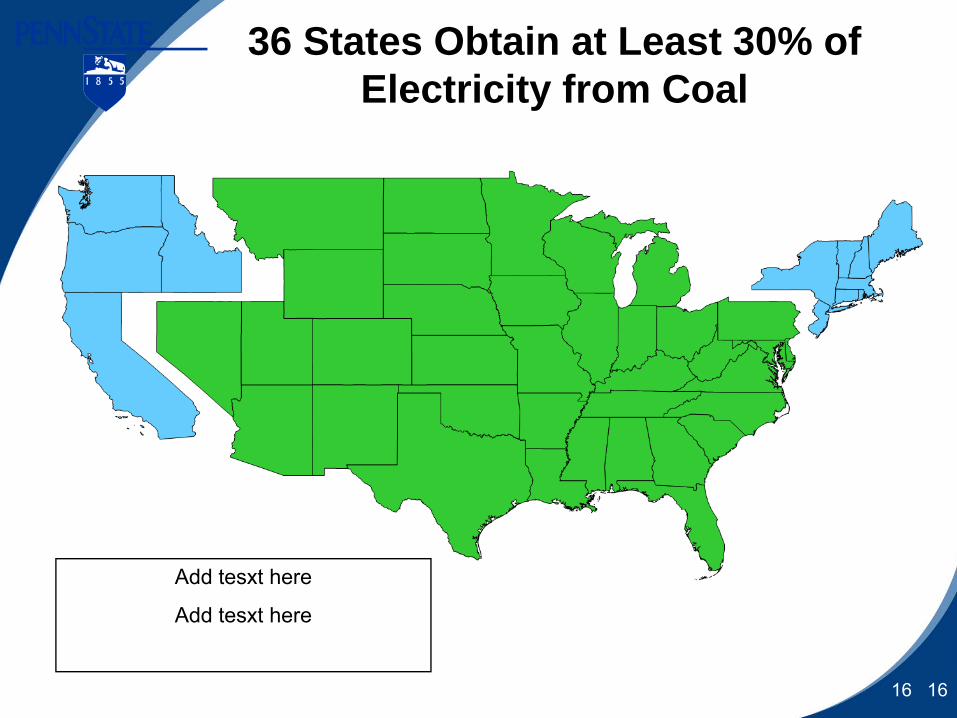
36 States Obtain at Least 30% of Electricity from Coal
Add tesxt here
Add tesxt here
1818
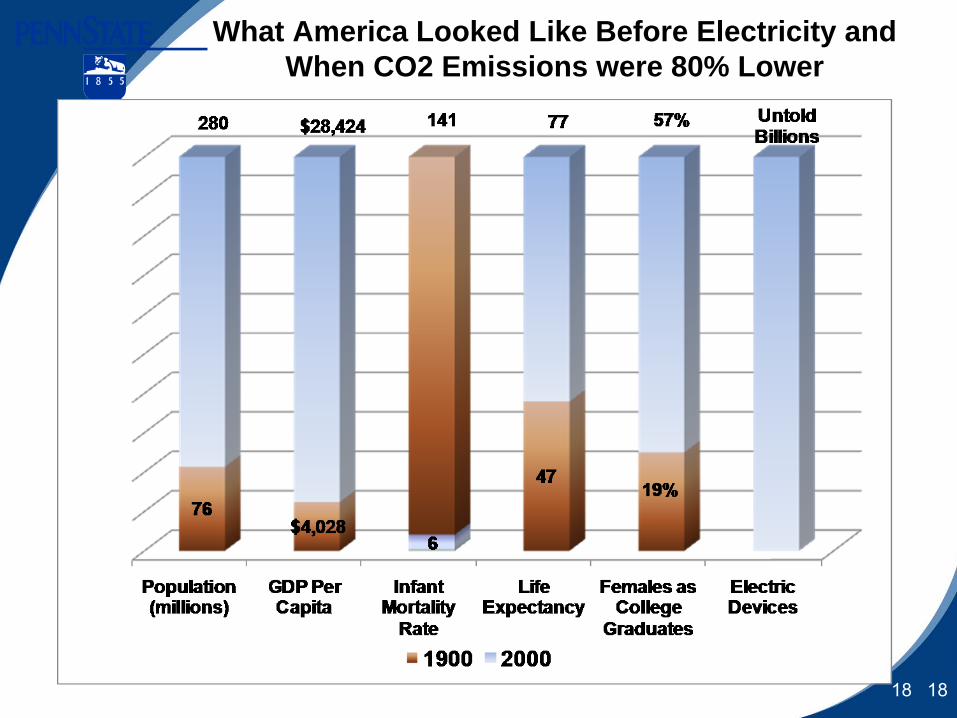
What America Looked Like Before Electricity and When CO2 Emissions were 80% Lower
1919
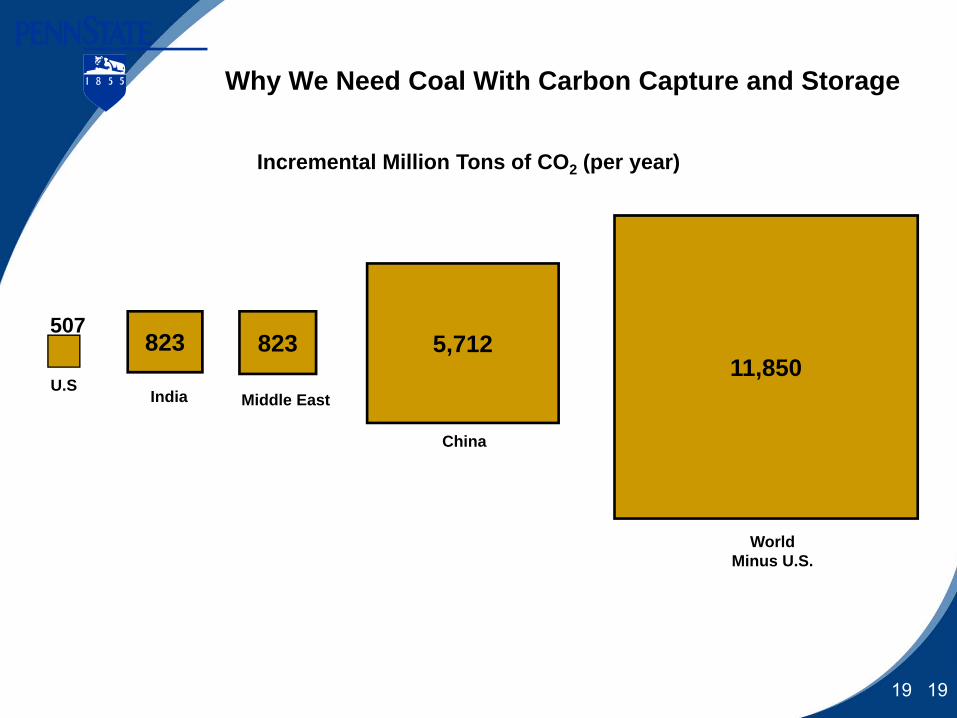
Why We Need Coal With Carbon Capture and Storage
11,8505,712823
U.SIndia
507
China
World Minus U.S.
Incremental Million Tons of CO2 (per year)
823
Middle East
2020
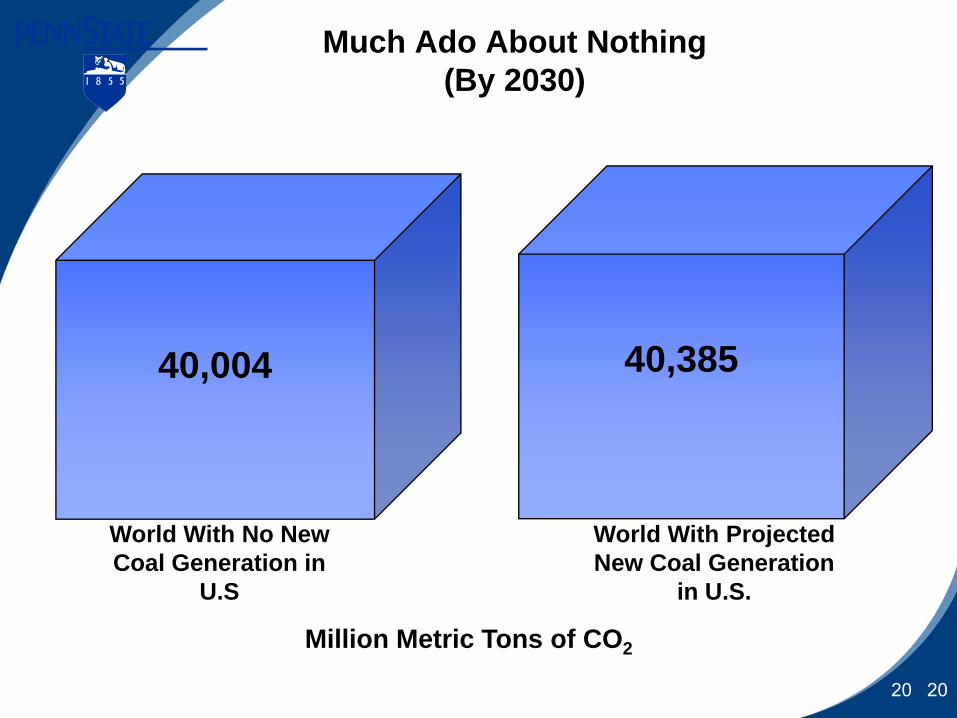
Much Ado About Nothing(By 2030)
World With Projected New Coal Generation
in U.S.
Million Metric Tons of CO2
40,38540,004
World With No New Coal Generation in
U.S
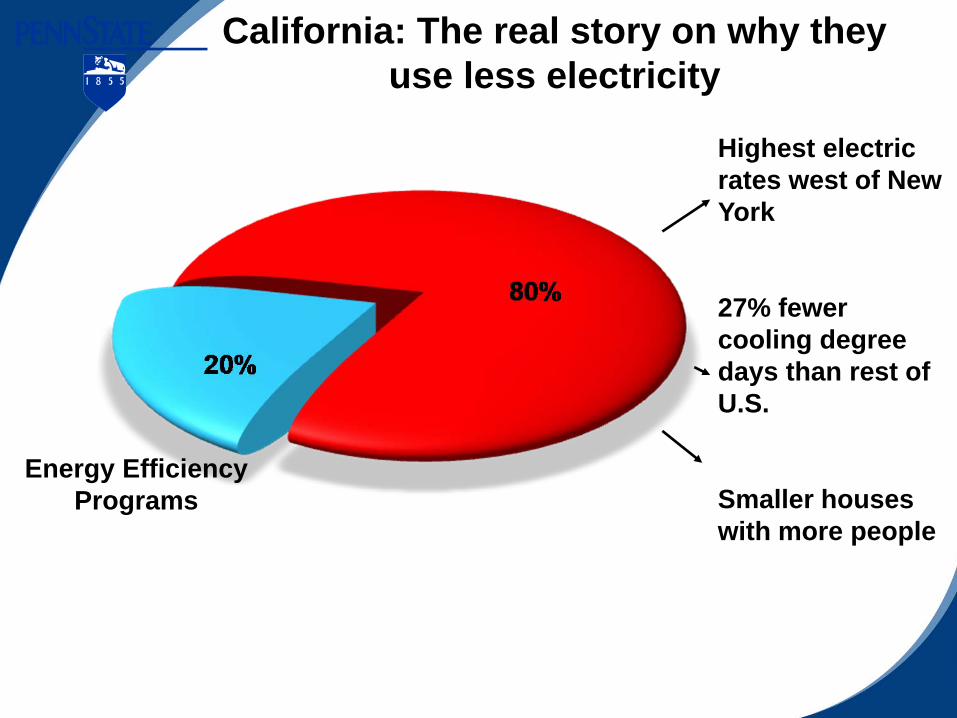
Energy EfficiencyPrograms
Highest electric rates west of New York
27% fewer cooling degree days than rest of U.S.
Smaller houses with more people
California: The real story on why they use less electricity
22
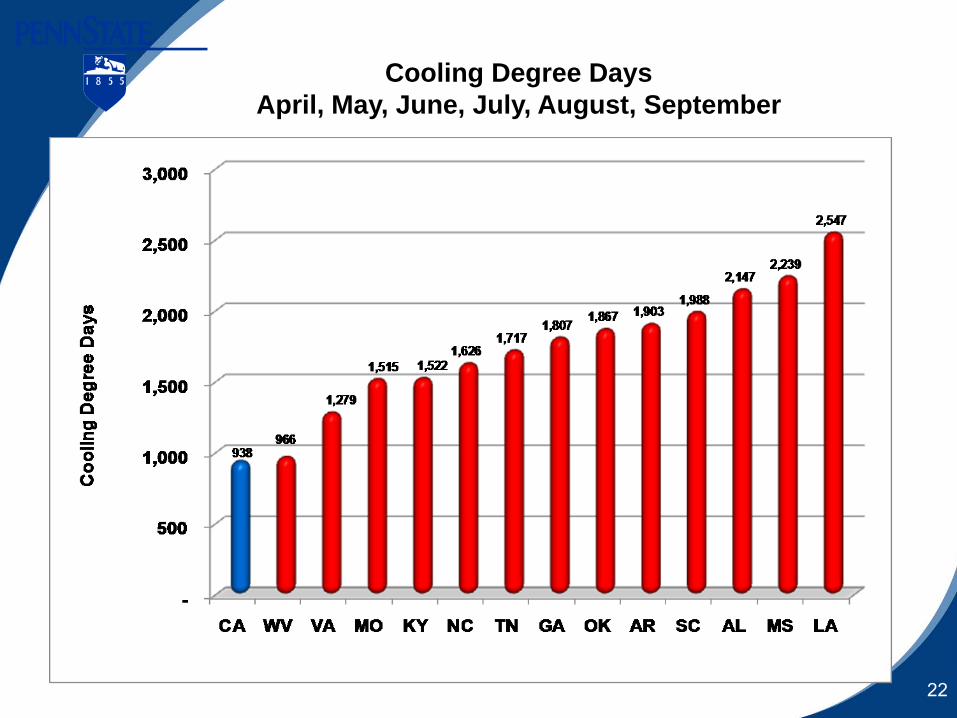
Cooling Degree DaysApril, May, June, July, August, September
23
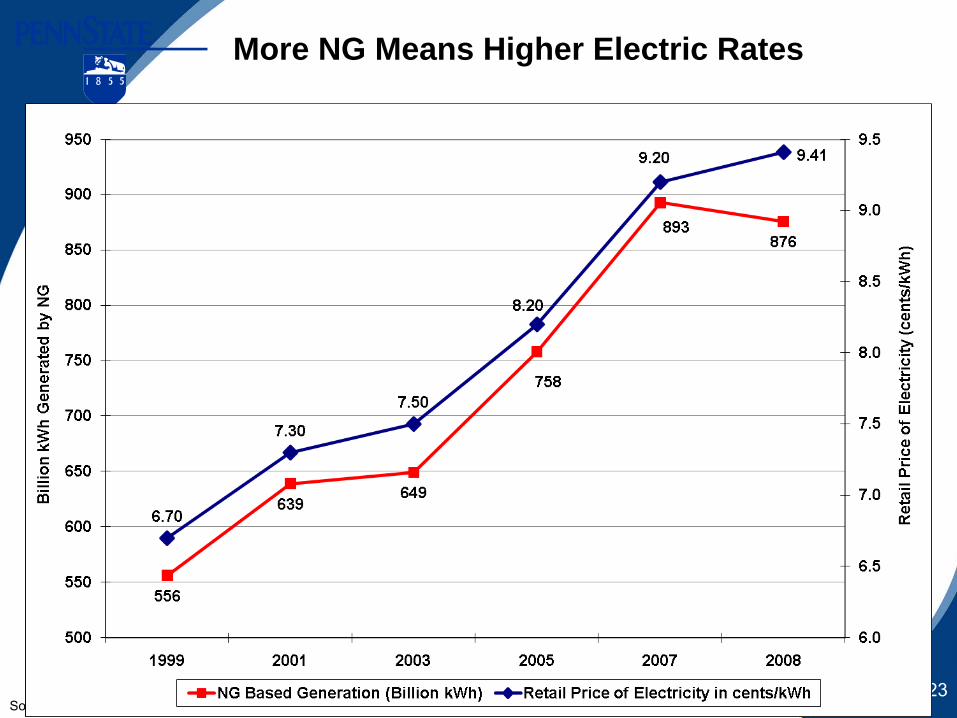
More NG Means Higher Electric Rates
Source: EIA, 2009
24
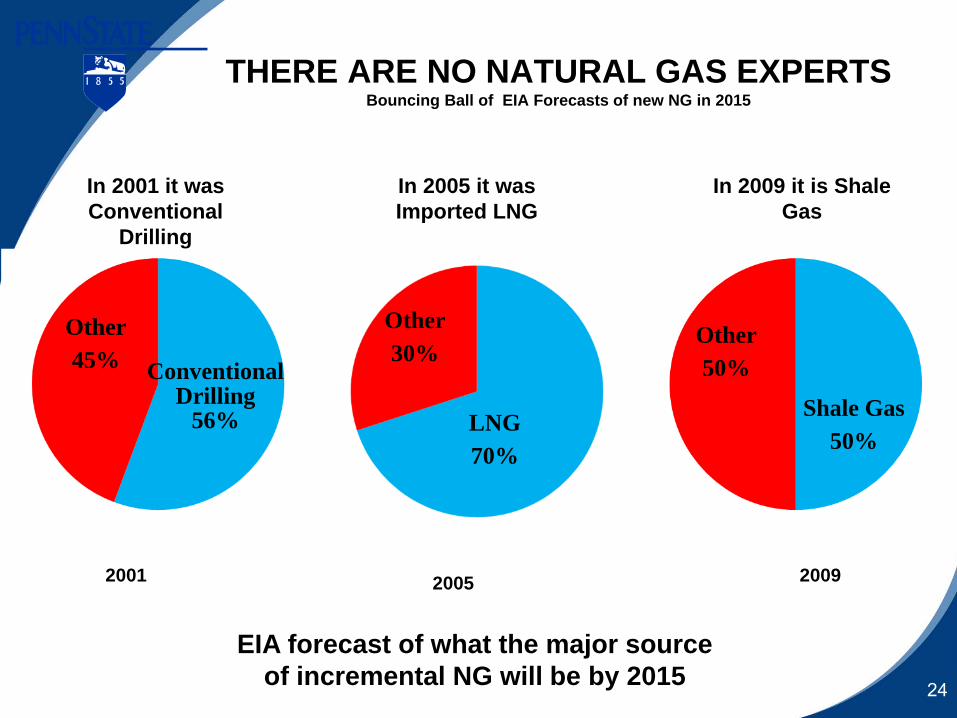
THERE ARE NO NATURAL GAS EXPERTSBouncing Ball of EIA Forecasts of new NG in 2015
2001 2005 2009
In 2001 it was Conventional
Drilling
In 2005 it was Imported LNG
In 2009 it is Shale Gas
EIA forecast of what the major source of incremental NG will be by 2015
Conventional Drilling
56%
Other30%
Other45%
LNG70%
Other50%
Shale Gas50%
2525
Why the Validity of EIA Forecasts is Crucial
EIA Data Projections are Used
1. By energy policy makers throughout the U.S. and other countries
2. To estimate the impact of climate change policy
3. To develop renewable portfolio standards
4. To justify cancelation of coal based generation
26262626
Impact of Coal Plant Cancellations
• Increase time NG sets the price of electricity
• Significantly increase NG consumption
• Increase NG prices over 175%
• Have minimal impact on CO2 emissions from the electricity sector
27272727
ALTERNATIVE FUELS: The Scale Needed to Replace Coal in the U.S.
● NUCLEAR: 250 more reactors
● NATURAL GAS: 17 more Trillion Cubic Feet
● HYDRO: 500 facilities size of Hoover Dam.
The reality of physics is that electricity cannot be stored in large quantities – an inevitable constraint on solar and wind generation.
28
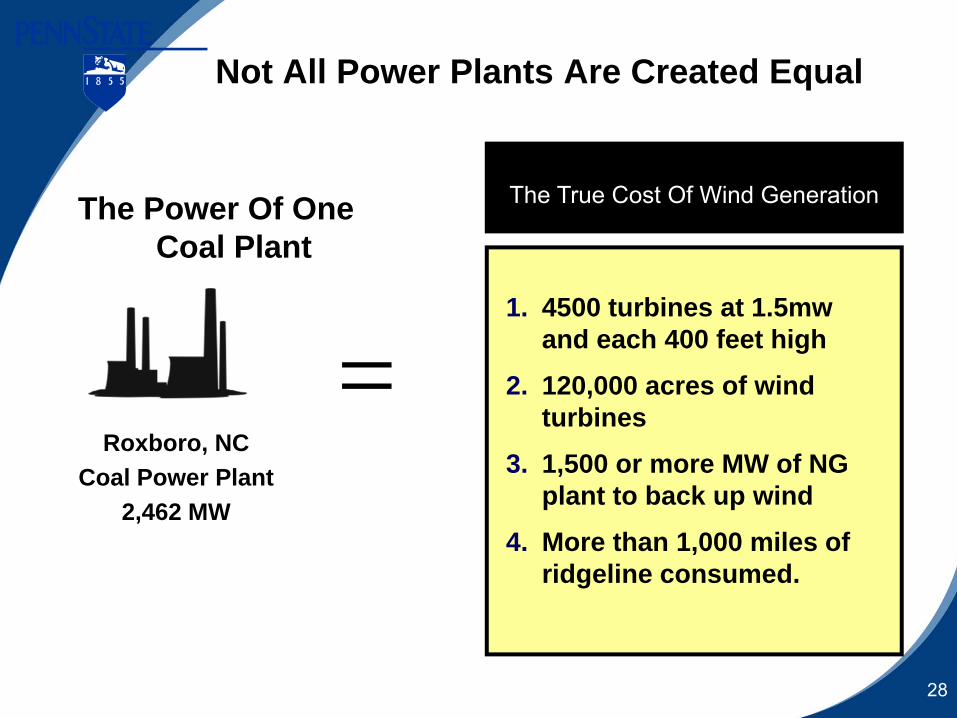
Not All Power Plants Are Created Equal
Roxboro, NC Coal Power Plant
2,462 MW
The True Cost Of Wind GenerationThe Power Of One Coal Plant
1. 4500 turbines at 1.5mw and each 400 feet high
2. 120,000 acres of wind turbines
3. 1,500 or more MW of NG plant to back up wind
4. More than 1,000 miles of ridgeline consumed.
=
2929
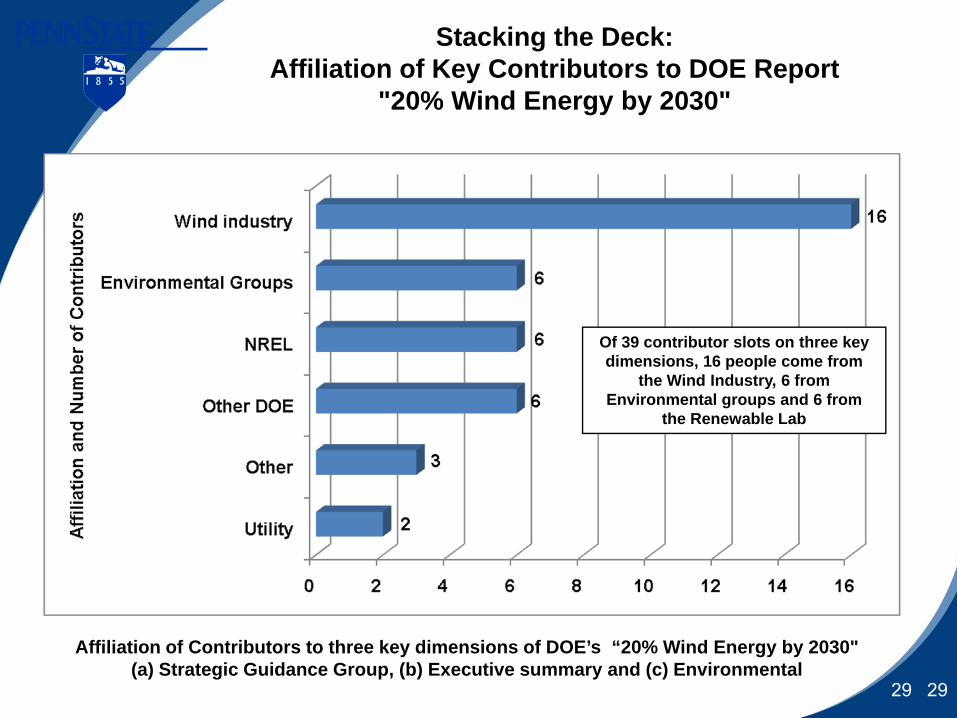
Stacking the Deck:Affiliation of Key Contributors to DOE Report
"20% Wind Energy by 2030"
Of 39 contributor slots on three key dimensions, 16 people come from
the Wind Industry, 6 from Environmental groups and 6 from
the Renewable Lab
Affiliation of Contributors to three key dimensions of DOE’s “20% Wind Energy by 2030" (a) Strategic Guidance Group, (b) Executive summary and (c) Environmental
30
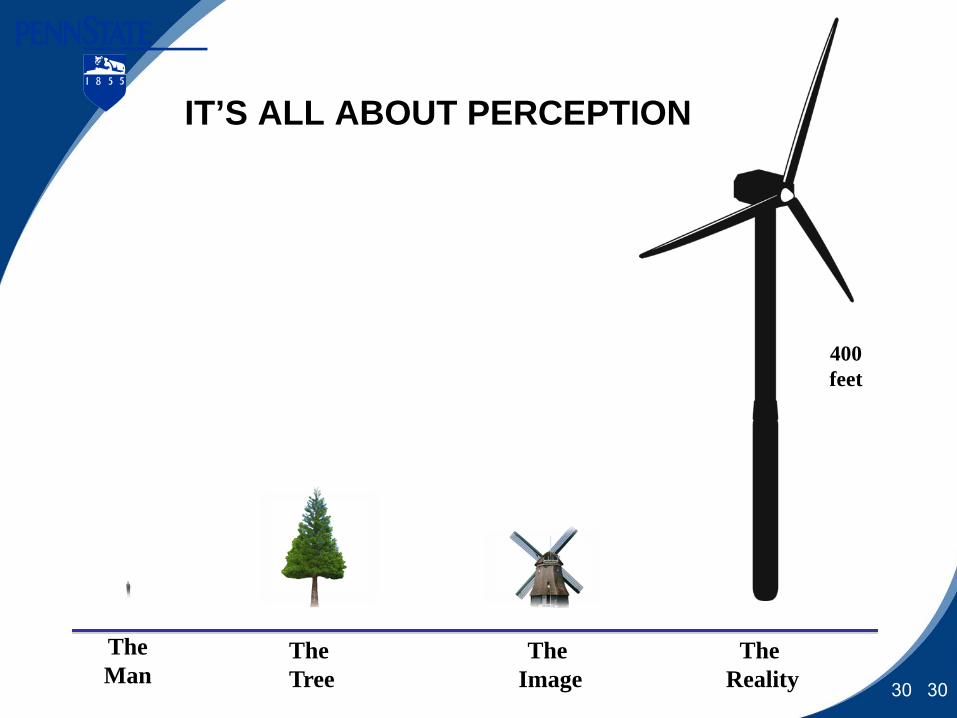
IT’S ALL ABOUT PERCEPTION
30
The Image
The Reality
TheMan
400 feet
The Tree
31
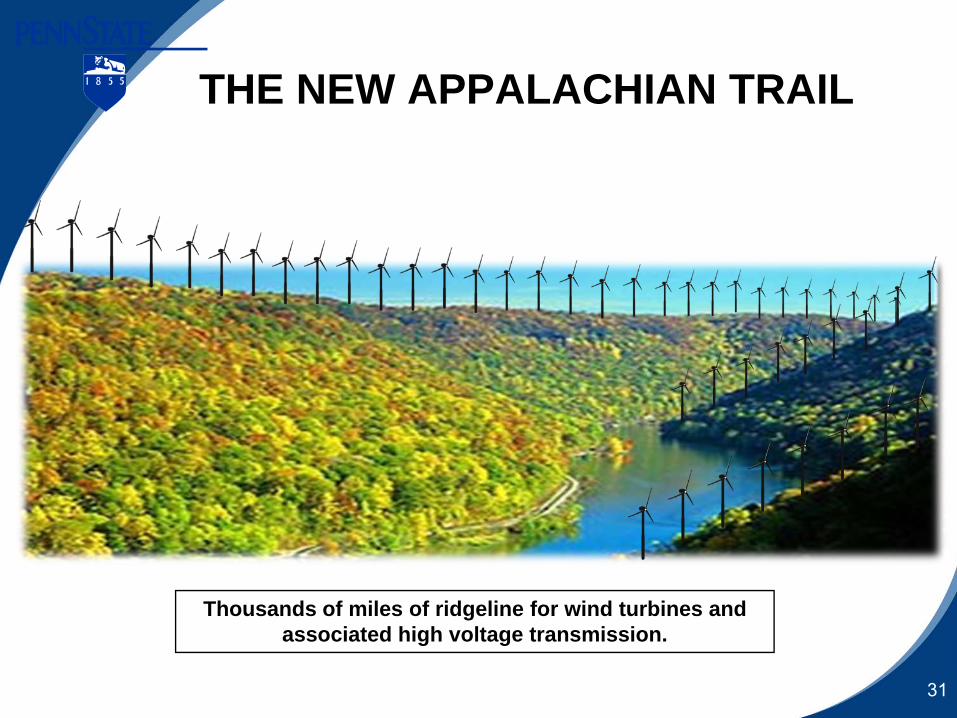
THE NEW APPALACHIAN TRAIL
Thousands of miles of ridgeline for wind turbines and associated high voltage transmission.
32
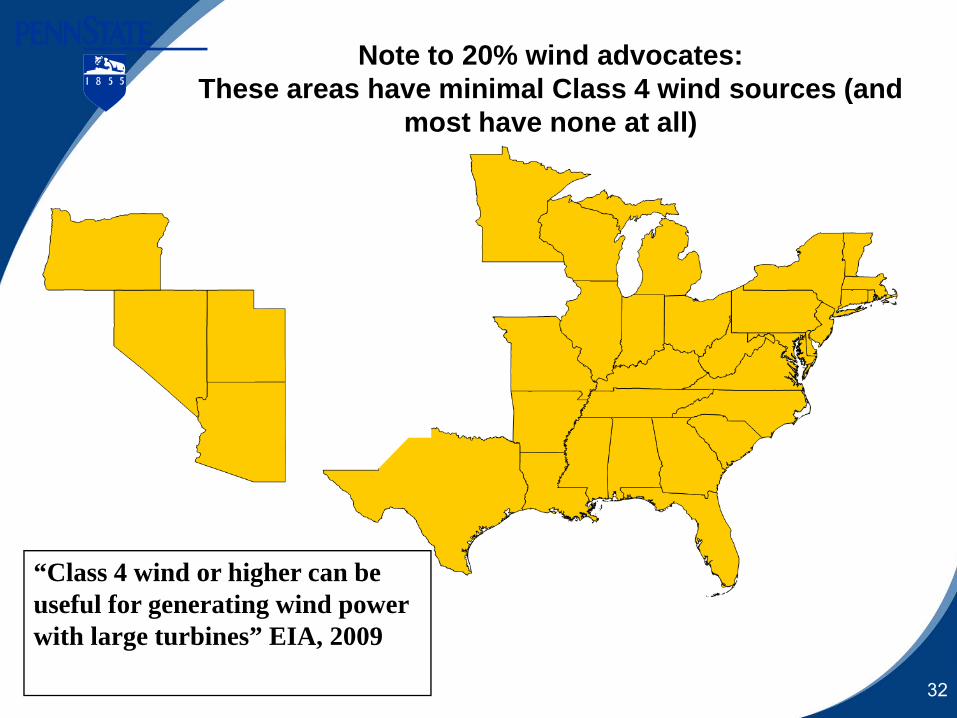
Note to 20% wind advocates:These areas have minimal Class 4 wind sources (and
most have none at all)
“Class 4 wind or higher can be useful for generating wind power with large turbines” EIA, 2009
33
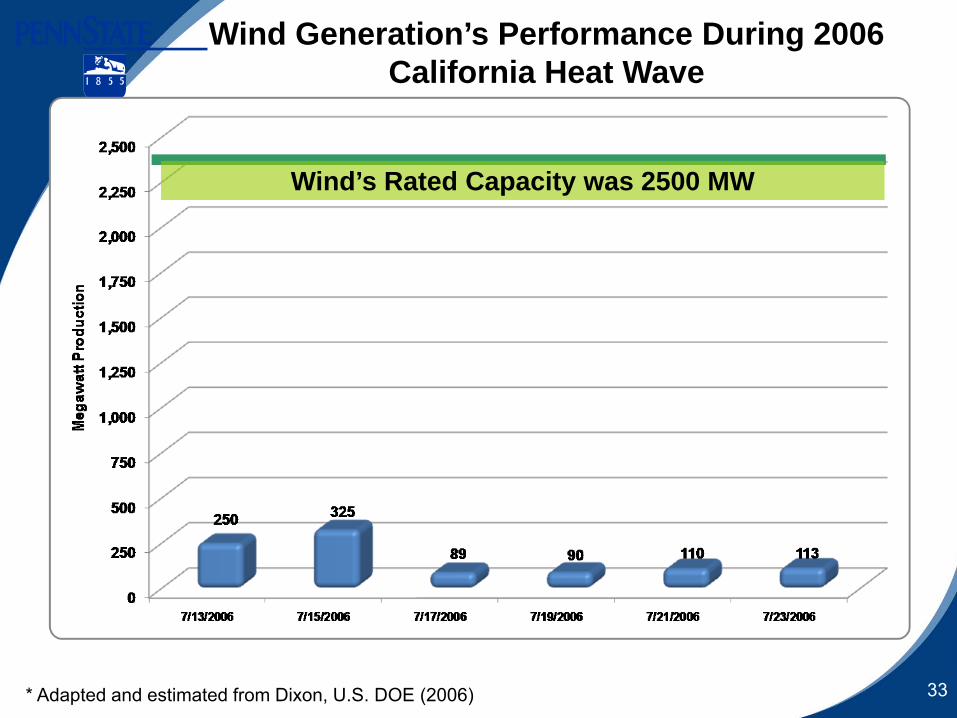
Wind Generation’s Performance During 2006 California Heat Wave
* Adapted and estimated from Dixon, U.S. DOE (2006)
Wind’s Rated Capacity was 2500 MW
34
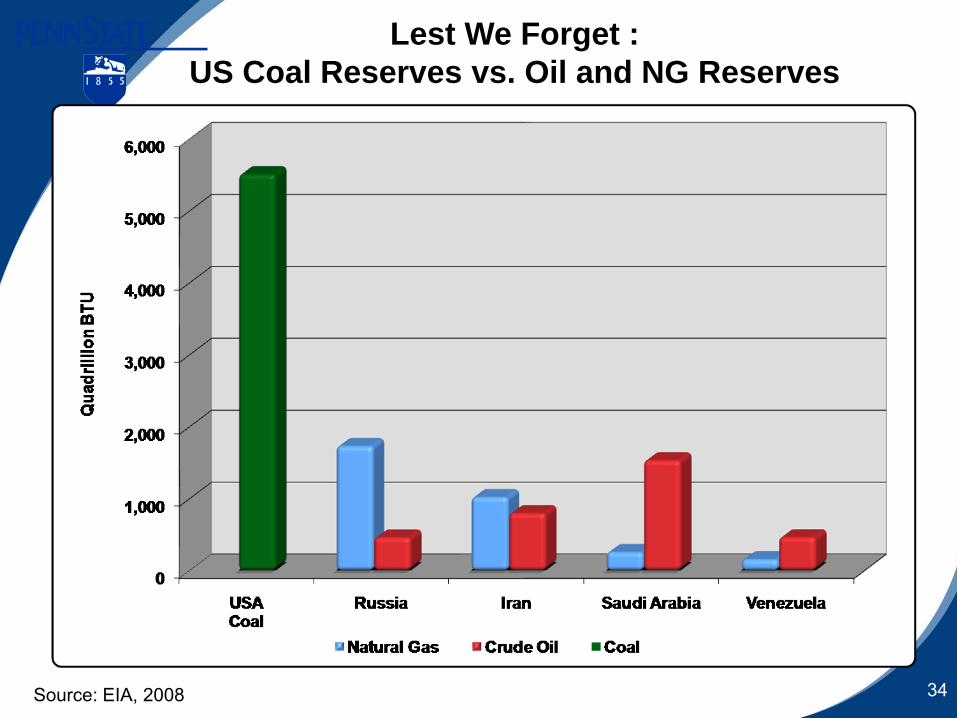
Lest We Forget : US Coal Reserves vs. Oil and NG Reserves
Source: EIA, 2008
3535
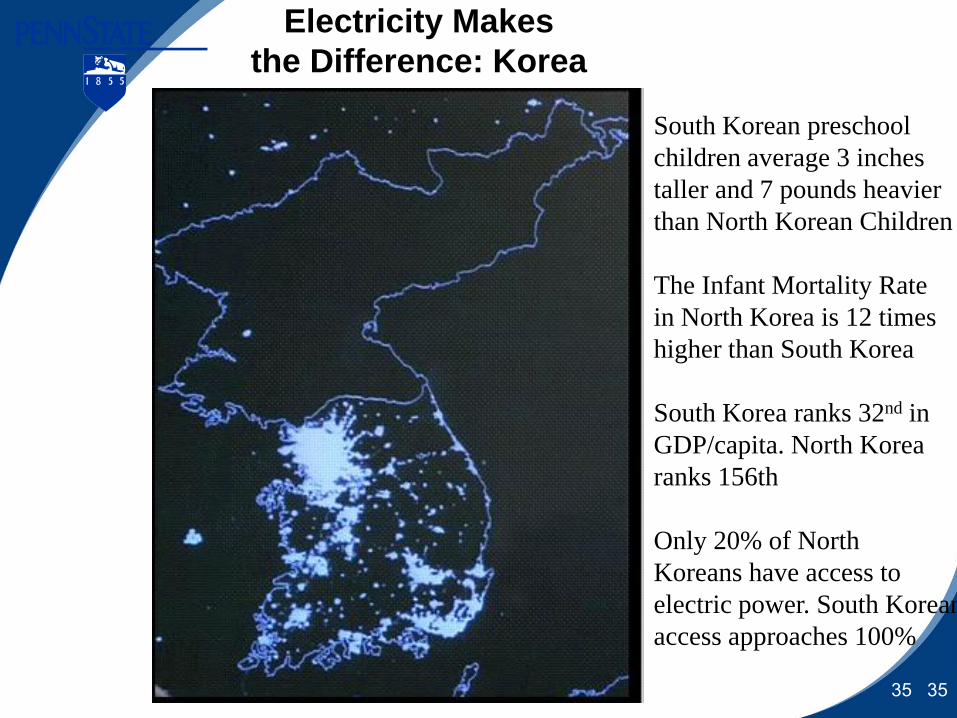
Electricity Makes the Difference: Korea
South Korean preschool children average 3 inches taller and 7 pounds heavier than North Korean Children
The Infant Mortality Rate in North Korea is 12 timeshigher than South Korea
South Korea ranks 32nd in GDP/capita. North Korea ranks 156th
Only 20% of North Koreans have access toelectric power. South Koreanaccess approaches 100%

36
fac226@ps