Embed Size (px)
Citation preview
THE WILLIAM DAVIDSON INSTITUTE
AT THE UNIVERSITY OF MICHIGAN BUSINESS SCHOOL
Why Transition Paths Differ: Russian and Chinese Enterprise Performance Compared
By: Sumon Bhaumik and Saul Estrin
William Davidson Working Paper Number 525 January 2003
William Davidson Institute Working Paper 525
1
Why Transition Paths Differ:
Russian and Chinese Enterprise Performance Compared*
Sumon Bhaumik London Business School
Saul Estrin**
London Business School Abstract We use enterprise data to analyse and compare the determinants of enterprise performance in China and Russia. We find that in China, enterprise growth and efficiency is associated with rapid increases in factor inputs including management, as well as TFP, but not greatly associated with ownership or institutional factors. In contrast, sales growth in Russia is not associated with improvements in factor quantity (except for labor) or quality; TFP is not influenced by competition and privatization to outsiders does not enhance company performance relative to insider ownership. The main determinants of TFP are instead demand and institutional factors at a regional level. JEL Classification Codes: D23, L22, O12, P31 Keywords: enterprise performance; privatization in Russia and China; total factor productivity
* The authors would like to thank Maria Bytchkova for research assistance, and Alan Tlusty Sheen, Kanliang Wang, Yuan Li and Boris Kutznetsov for provision of the data, as well as Simon Commander, Chenggang Xu and participants in seminars at the Centre for New and Emerging Markets of London Business School; University College, London; the New Economic School, Moscow; the School of Oriental and African Studies, London; and St. Anthony’s College, Oxford University for comments and discussion. Any remaining errors are our own. ** Corresponding author. Address: Centre for New and Emerging Markets, London Business School, Sussex Place, Regent’s Park, London NW1 4SA, UK. Phone: +44 20 7262-5050, Fax: +44 20 7724-8060, Email: [email protected].
William Davidson Institute Working Paper 525
2
Non-Technical Summary There has been a marked contrast in economic performance between Russia and China since each embarked on the path of transition from socialist planning. In attempting to understand the contrast, analysts have cited differences in preconditions, notably the low level of industrialization in China; differences in policy frameworks – gradualism in China as against “big bang” policies in Russia; and differences in policy sequencing i.e. delayed rather than immediate privatization in China but not Russia. There are a number of factors likely to contribute to growth in relatively less developed economies transforming from central planning to markets. The first is the transfer of factor inputs from low to high productivity uses. In the case of less industrialised economies, such as China, much of that transfer might take the form of labor shifts from agriculture to industry and industrial capital accumulation. In Russia, with “over-industrialization” and a pre-transition domestic relative price structure inconsistent with world prices, factor reallocation could take the form of capital and labor flows to sectors of international comparative advantage. At the same time, the price and foreign trade liberalisation inherent to transition is likely to lead to enhanced competition, which might act to increase total factor productivity (TFP). TFP could also be increased by the decentralisation of the enterprise sector, giving autonomy to managers so that variance in the quality or effectiveness in management becomes an important determinant of enterprise performance. The improved incentives for management as a result of ownership changes could also enhance enterprise performance. There is a large literature to suggest privatization acts to increase enterprise efficiency and profitability, though, the results for the transition economies are not so clear cut because the ownership forms which emerged post-privatization were too dispersed, and because the legal and institutional environment was not always sufficiently well developed. This latter finding suggests that institutional factors – political, legal, regional and industrial – may also play a significant role in determining company performance, especially in countries as regionally diverse as Russia or China. In this paper, we explore the relative impact of these determinants of enterprise growth in matched random panels of firms in Russia and China. Our questionnaire was designed to yield unique and comparable data about competition, technology, ownership and managerial activity, as well as concerning institutions and factor inputs. The strength of the study is its comparative nature; while our findings are for the most part consistent with those in the separate large literatures on enterprise performance in Russia and China,
William Davidson Institute Working Paper 525
3
we obtain additional robustness and insight from the estimation of common equations, and the resulting direct comparison of determining factors. We find that in China enterprise performance can be associated with rapid increases in factor inputs including management and TFP, but is not greatly associated with ownership or institutional factors. In contrast, sales growth in Russia is not driven by improvements in factor quantity (except for labor) or quality, TFP is not influenced by competition or managerial effort, and privatization to outsiders is not found to improve performance relative to insider owner firms. Our equations provide an equivalent level of explanation in Russia and China but in Russia the main determinants of sales growth in addition to employment are demand and region-specific factors. These findings cast some light on several important policy debates. They suggest that there were serious flaws in the “big bang” reform strategy adapted in Russia, though it is unclear whether these were in the design or implementation of policy. The null hypothesis is however not well specified; it is not clear that alternative, more gradual and partial, strategies were a realistic option in Russia in the early 1990s. Further, it is not evident whether the Chinese reforms process itself is optimal, given the concerns about the health of the Chinese public sector banks and the resultant quasi-fiscal obligations of the government. However, the effectiveness of reforms which liberalise markets while leaving ownership unchanged or only partially adjusted, seems to be strongly supported by our Chinese findings. We confirm that state owned and semi-privatised firms in China are responding to market signals and increasing total factor productivity along the same lines as privately owned firms in market economies, even when they are located in inland China where the spillovers from foreign direct investment are limited compared to that in the coastal and southern regions of the country. This suggests that in certain contexts such as the one of modern China, market incentives are sufficient to ensure some degree of efficiency in enterprise actively without immediate full privatisation. This is not to say that performance cannot be further improved by private ownership; indeed the evidence is strong that privatization improves enterprise performance. But it is consistent with the view that neither “big bang” reform policies nor early privatisation are the sine qua non for successful transition.
William Davidson Institute Working Paper 525
4
1. Introduction There has been a marked contrast in economic performance between Russia and China since each embarked on the path of transition from socialist planning. China’s GDP per capita has increased by 8% per annum between 1978 and 2000, while Russian GDP had fallen to 64% of its 1990 level by 2000, with output declining in seven years of the ten. In attempting to understand the contrast, analysts have cited differences in preconditions, notably the low level of industrialization in China (see Sachs and Woo, 1997); differences in policy frameworks – gradualism in China as against “big bang” policies in Russia (see Jefferson and Rawski, 1994, World Bank, 1996); and differences in policy sequencing i.e. delayed rather than immediate privatization in China but not Russia (see Stiglitz, 1999, Nellis, 2000, Estrin, 2002). In this paper, we use comparable enterprise level data to analyse and contrast the determinants of company performance in China and Russia, in a manner which throws light on these broader issues. There are a number of factors likely to contribute to growth in relatively less developed economies transforming from central planning to markets. The first is the transfer of factor inputs from low to high productivity uses. In the case of less industrialised economies, such as China, much of that transfer might take the form of labor shifts from agriculture to industry and industrial capital accumulation. In Russia, with “over-industrialization” and a pre-transition domestic relative price structure inconsistent with world prices, factor reallocation could take the form of capital and labor flows to sectors of international comparative advantage. At the same time, the price and foreign trade liberalisation inherent to transition (see Svejnar, 2002) is likely to lead to enhanced competition, which might act to increase total factor productivity (TFP) (see Nickell, 1996). TFP could also be increased by the decentralisation of the enterprise sector, giving autonomy to managers so that variance in the quality or effectiveness in management becomes an important determinant of enterprise performance (see Claessens and Djankov, 1999, Muravyev, 2002). The improved incentives for management as a result of ownership changes could also enhance enterprise performance (see Vickers and Yarrow, 1988). There is a large literature to suggest privatization acts to increase enterprise efficiency and profitability (see Megginson and Netter, 2001), though, as Djankov and Murrell (2000) show, the results for the transition economies are not so clear cut because the ownership forms which emerged post-privatization were too dispersed, and because the legal and institutional environment was not always sufficiently well developed (see also Estrin, 2002). This latter finding suggests that institutional factors – political, legal, regional and industrial – may also play a significant role in determining company performance, especially in countries as regionally diverse as Russia or China (see Granick, 1990, Tsui, 1996, Granville and Oppenheimer, 2001). In this paper, we explore the relative impact of these determinants of enterprise growth in matched random panels of firms in Russia and China. Our questionnaire was designed to yield unique and comparable data about competition, technology, ownership and managerial activity, as well as concerning institutions and factor inputs. The strength of the study is its comparative
William Davidson Institute Working Paper 525
5
nature; while our findings are for the most part consistent with those in the separate large literatures on enterprise performance in Russia1 and China,2 we obtain additional robustness and insight from the estimation of common equations, and the resulting direct comparison of determining factors.3 We find that in China enterprise performance can be associated with rapid increases in factor inputs including management and TFP, but is not greatly associated with ownership or institutional factors. In contrast, sales growth in Russia is not driven by improvements in factor quantity (except for labor) or quality, TFP is not influenced by competition or managerial effort, and privatization to outsiders is not found to improve performance relative to insider owner firms. Our equations provide an equivalent level of explanation in Russia and China but in Russia the main determinants of sales growth in addition to employment are demand and region-specific factors. The remainder of the paper is structured as follows. In the next section we outline our hypotheses, taking into account both economic theory and the particular institutional environment of Russia and China. The resulting estimation framework is presented in third section along with the datasets. The findings are presented in the fourth section and conclusions are in the fifth. 2. The Determinants of Enterprise Growth in Russia and China In this section, we outline the conceptual framework and outline the hypotheses implied by the Chinese and Russian historical and institutional environments. Our approach is based on estimation of augmented production functions using data from Russian and Chinese firms. We assume that the technology of each firm, i, can be represented by,
MKLAY iiiiiδβαγ= (1)
where Y measures output, L is labor, K is capital, A is the “technology” parameter and M measures the quality of management. The latter variable is included explicitly in our formulation
1 See for example Blasi (1997), Earle and Estrin (1998), Estrin and Wright (1999) Brown and Earle (2001), Brown and Brown (1999), and Djankov and Murrell (2000) for a survey. 2 See for example Jefferson and Rawski (1994), Li (1999), Jefferson et al. (1996), Woo (1994), and Jefferson et al. (2000). 3 For example, in previous work (e.g. Bevan et al., 2002) it has been hard to decide whether the disappointing results on Russian enterprise performance, with limited input from competition, privatization or investment, arose from sampling or measurement problems, methodological weaknesses or because non-economic factors were driving Russian enterprise performance e.g. as in Earle and Estrin (1997). In this paper, equations with comparable standards of fit provide clear evidence that, though economic factors do not for the most part influence performance in Russia but as in e.g. Jefferson and Rawski (1994), they do in China.
William Davidson Institute Working Paper 525
6
because managerial quality and effort is seen as a major independent factor influencing enterprise performance in transition countries (see e.g. Barberis et al., 1996, Blanchard and Aghion, 1996). As planning systems were decentralised and firms gained autonomy, the variance in managerial competence and effort may have become an important explanation of the differences in enterprise performance (see Granick, 1990, Claessens and Djankov, 1999). Output (value added) data is scarce and typically of poor quality in transition economies, so, with other analysts in the field, (see e.g. Frydman et al., 1999), we have used sales (S), where
MKLPAYPS iiiiiiδβαγ=≡ (2)
and P is the product price of the good being produced. The price is determined by net demand in the relevant market and the competitive structure of that market, i.e.
P = P(Q, C) (3) where Q is net demand in the industry and C is a measure of competition. Because the transition process is essentially one of change, our analysis is focused towards growth of sales; levels of output or input in transition economies are often determined by historical or institutional factors of limited relevance in the new market environment. Hence, denoting time differences by a dot,
( )δβαγ
iiiii MKLAPS......
= (4)
This framework effectively categorises the determinants of sales growth into four groups: changes in product price (itself a function of net demand and market structure changes); changes in factor inputs (L and K) including changes in factor quality; changes in total factor productivity (TFP) which, in the transition context, are primarily be affected by ownership structure and competition (see Frydman et al., 1999, Djankov and Murrell, 2000); and changes in management activities, which for firms in transition can be measured by the extent of restructuring activity (see Estrin, Gelb and Singh, 1995). To sharpen the hypotheses, we must briefly compare the two economies at the point of transition (1978 and 1991 respectively) and beyond, to establish points of similarity and difference.4 China
4 This discussion is necessarily brief and summarises two huge literatures (see e.g. World Bank, 1996, Boycko et al., 1995, EBRD, 1999, Groves et al., 1994, 1995, Granick, 1990, Jefferson and Rawski, 1994, Roland, 2000).
William Davidson Institute Working Paper 525
7
and Russia both embarked on their transition paths from more or less unreformed systems of central planning,5 though Chinese planning was never so complete as Russian, and operated through regional structures rather than industrial ministries (see Qian et al., 1999). The Chinese economy therefore suffered, within the almost entirely state owned industrial sector from similar problems of incentives, soft budget constraints and inadequate information, with well-known negative implications for company efficiency, innovation, and growth (see e.g. Ellman, 1989, Dewatripont and Roland, 1995). Indeed, in Russia at the time when transition began, there was an almost total absence of the institutional and legal infrastructure necessary for the operation of competitive markets (see Commander, Fan, Schaffer, 1996, Blanchard and Kremer, 1997). However, there were also very marked differences in initial conditions. China was a much less developed economy in 1978 than Russia in 1991; for example in GNP per capita (US$ 285 as against US$ 3783); share of industrial employment, 13.3% as against 39%) and share of agricultural employment (75% as against 13.5%).6 In particular, the stock of human capital was markedly lower in China, with a literacy rate in 1980 of 66% as against 98% in Russia, 1998); secondary school enrolment rates of 63% as against 91% and tertiary education enrolments of 1.7%, 1980) as against 50%. This meant that the two countries faced fundamentally different resource reallocation challenges. In China, it was necessary to raise national income by transferring labor from low productivity activities (primarily agriculture) to higher productivity ones (largely in industry) (see Qian, 2000, Granick, 1990). In Russia, the pattern of final demand has had to be rebalanced from a concentration on the pattern preferred by central planners (heavy industry, defence) towards domestic consumer demand (light industry, services) and activities of international comparative advantage at world prices (see Hanson, 2002). The two countries also followed very different transition paths (see World Bank, 1996, Stiglitz, 1999). In China, reforms were gradual, experimental, and partial, with the authorities taking a flexible approach to policy making (see Qian et al., 1999). In Russia, in principle, the reforms were rapid and comprehensive (see Hanson, 2002), the caveat being the wedge between the principle and actual implementation of reforms in that country. This had important implications for the sequence of transition in the two countries. In China, markets were liberalised first, and they have gradually become more competitive and efficient in resource allocation (see Jeffeson and Rawski, 1994). Hence, strong market-based incentives were provided to state owned firms and semi-private ones such as the town-village enterprises (TVEs) while the process of privatization has been much slower and more limited (see Jefferson et al., 2000, Cao et al., 1999). In contrast, Russia attempted virtually simultaneous introduction of markets and private ownership from the outset, with much of the intended enhancement to company performance presumed to derive from the latter (see Boycko et al., 1995). The implementation of Russian
5 In contrast, for example, to Hungary or Yugoslavia (see Fisher and Gelb, 1991). 6 Sources: World Bank, IMF and State Statistical Bureau, GNP per capita in Russia, 1988 and share of industrial and agricultural employment 1980.
William Davidson Institute Working Paper 525
8
reforms, however, proved harder than expected, (see Granville and Oppenheimer, 2001), leaving enterprises to operate in only a quasi-market environment (see Commander et al., 2002), and with a prolonged recession. Therefore in China, one can hypothesise that growth in the industrial sector has resulted from strong demand (domestic and international) and deriving from factor transfers (labor and capital), and TFP growth driven by competition (see Wang and Yao, 2001). Once might also expect some contribution from enhanced factor quality, management and private ownership, though a limited one given the level of development and the transition path (but see Huang and Duncan, 1997). Given that a relatively competitive market system had been established by the time of our study in 1999, specific institutional factors related to industry or regions might be expected to be of less significance (see Parker, 1997). One would predict similar factors as being relevant in Russia, but the balance of importance might be different (see Granville and Oppenheimer, 2001). One would clearly expect the change in sales, driven by demand, would be closely correlated with changes in factor inputs. Given Russia’s more advanced level of technological and educational development, one might also expect a strong influence of factor quality on sales growth. If Russia’s “big bang” reform programme had been effective, one would also expect to see, fairly rapidly, a major impact on TFP from ownership changes, and from product market competition (see Bevan et al., 2002). However, given that the period of transition is Russia has been rather shorter and more problematic than that in China, one might also expect to see greater significance of sectoral and region-specific factors (see Djankov and Murrell, 2000, Nellis, 2000). 3. Specification and Data 3.1. Specification of the Estimating Equations Equation (4) is a reduced form relationship which is commonly estimated log-linearly and in rate of change form (∆) to remove firm-specific effects so, with error term εi;
∆lnSi = α ∆ln Li + β∆ln Ki + γ∆lnA + δ∆lnMi + φ∆lnQi + σ∆lnCi + εI (5) In this section, we outline the dataset, and the ways that the variables in equation (5) have been specified for empirical estimation. It is often difficult to obtain direct measures of A, M, Q and C as continuous variables, especially in transition economics. Hence (5) is modified so that L and K are included in logarithmic form, while proxies for the other variables are included as dummy variables. For a measure of the management input during the relevant time period, we use an
William Davidson Institute Working Paper 525
9
aggregate count of qualitative indicators of restructuring activity undertaken during that period, denoted RE.7 The variable A represents total factor productivity and is influenced by several variables. In the literature on privatization, it is argued that TFP varies according to ownership type, for example being higher in private than state owned firms (see Megginson and Netter, 2001). The transition literature additionally argues that TFP is a function of the type of private ownership, with outsider ownership expected to generate higher productivity than insider or state (Blanchard and Aghion, 1996, Roland, 2000). In our estimating equations, we use a variety of ownership dummies (O) to proxy for alternative ownership forms in each country.8 We also control for the quality of capital and the quality of the labor force,9 the proxy for capital quality being the proportion of productive capital that was less than 5 years old, and that for labour quality being the ratio of part time to full time laborers. The qualitative indicators of changes in competitive pressures are derived from management responses in the survey and subdivided into domestic (DC) and international (IC) competition. We control for (net) demand using industry dummy variables (IS) and for region-
7 The measures of restructuring achieved by a Chinese firm during 1995-99 and by a Russian firm during 1997-99 have been obtained from qualitative data, the basis for which are the responses of the management of the surveyed firms to a series of questions. Specifically, Russian firms were asked whether they had undertaken 15 different types of restructuring during 1997-99. A dummy variable has been used to capture their yes-no response for each type of restructuring, such that RE for Russia is a score on a 0-15 scale. Chinese firms, on the other hand, were asked similar questions about 32 different forms of restructuring, and were asked to rank their success in implementing each type of restructuring on a 1 - 5 scale. Hence, RE for China is a score on a 32-160 scale. 8 As discussed earlier, the ownership issues are different in China and in Russia. In the Chinese context, it is important to distinguish between firms in which the state has controlling stake and those in which non-state entities have controlling stake, along the lines of the standard literature (e.g. Megginson and Netter, 2001); insider ownership as has emerged in much of Central and Eastern Europe is not a significant issue, given that our sample does not contain TVEs. In Russia, however, privatisation was widespread, and indeed almost all firms in our sample are private but the dominant owners are rarely outsiders in the western sense (see Earle and Estrin, 1997). Hence the most meaningful distinction in Russia, in so far as ownership is concerned, is between firms in which insiders have controlling stake and firms that are controlled by outsiders (see Djankov and Murrell, 2000). Further, in Russia, the government retained 25 percent or more shares in some privatised firms, thereby giving them a significant amount of say in the decision making process (see Bennett, Estrin and Maw, 2001). This factor too should be taken into account in considering for the quality of managerial input in Russian enterprises. Hence ownership variable is defined differently in the Russian and Chinese contexts. 9 The proxy for “technology” in this study is the proportion of capital stock of an enterprise that is less than 5 years old. For labor quality we use the ratio of managerial to blue collar workers. But since the variable’s coefficient is never significant, it is excluded from the reported regressions.
William Davidson Institute Working Paper 525
10
specific factors influencing enterprise performance with regional dummies variables (Ri). To the extent that the markets in China and Russia are not fully integrated, the regional dummies may pick up local demand effects. They may also pick up inter-regional differences in institutional factors like the legal environment and governance. We attempt to distinguish between the impact of local net demand and institutional factors later in our analysis.
The specification is therefore given by, ∆ln Si = λ0 + α ∆ln Li + β∆ln Ki + γA + λ1Oi + λ2 REi + λ3 DCi + λ4 ICi +
Σ1λ5k IS
1 + Σj λ6 j Rj + εI . (6)
In keeping with the earlier discussion, α, β and γ are expected to be positive reflecting the stylised production function relationship between output-sales and factor inputs and technology. Similarly, restructuring is expected to have a positive impact on sales growth, such that λ2 is expected to have a positive sign. In the presence of stylised Cournot-type market dynamics, the magnitude of sales growth might be expected to vary inversely with the extent of competition faced by an enterprise. On the other hand, recent models suggest that higher TFP is associated with increased competition (see Nickell, 1996). Hence our predictions on the signs of λ3 and λ4, are ambiguous. The impact of ownership on sales growth is also complicated. In principle, government control in China and Russia can be expected to have an adverse impact on sales growth relative to outsider ownership (see Vickers and Yarrow, 1988, Nellis, 2000). But, in the light of the relevant literature (see Blanchard and Aghion, 1996, Estrin and Wright, 1999, Djankov and Murrell, 2000), it is not clear whether privatization to insiders would generate similar improvements in performance relative to state ownership. The theory suggest that, at the very least, outsider ownership will be more efficient than insider or state, but that insider ownership may not yield significantly superior performance to state ownership. Similarly, we do not offer any clear propositions about the impact of region-specific factors on sales growth, except perhaps that Russian firms in the large conurbations - the Moscow and St. Petersburg regions - might be expected to perform better, on average, than firms in other parts of the country. 3.2 Chinese and Russian Data The data on Chinese firms, most of which were largely or entirely state owned, were collected through a random survey of manufacturing firms in the Sha’anxi, Hunan and Shanxi provinces of China, and yielded 274 observations (see Tlusty Sheen, 2001). The firms belong to a wide array of mining and manufacturing industries,10 and the sample includes about 20% of the firms in the underlying population. The responses to the survey questionnaire provide information about,
10 The industries are mining, light industries, engineering products, chemicals and utilities.
William Davidson Institute Working Paper 525
11
among other things, ownership of the firms, volume of sales, stock and quality of factor inputs, the extent of competition faced by the firms in the product market, and the extent of restructuring in the 32 different operational areas, for the 1995-99 period. The Russian dataset contains information on 437 firms surveyed across 13 provinces11 and six industries12 (see Bevan et al., 2002, for further information). As with the Chinese data, the stratified random survey of Russian manufacturing provided information about the volume of sales, stock of inputs the nature of competition faced by firms in the product market, and the extent of restructuring in 15 different operational areas, for the 1997-99 period.13 The data for these firms, almost all of which had been privatised before 1997, also provides information about the proportion of equity owned by the insiders and the government. Thus the matched samples compare privatised Russian firms in some of the main industrial regions of the country with largely state owned firms in some of the less central and more internally oriented provinces of China. The sample years for Russia include the post-1998 recession. The data from both Russia and China have missing value problems. In particular, a number of firms did not provide full breakdown of equity stakes, and/or information about capital stock. Since ownership and capital stock are important determinants of a firm’s performance, as indicated by its growth of sales, observations with incomplete information about these variables had to be dropped. It is not clear how non-reporting might be associated with performance, and there was no obvious pattern by sector, region, size and sales growth. Eventually, we were left with 138 usable observations for China and 279 usable observations for Russia.
11 The regions are Moscow, Moscow oblast, St. Petersburg, St. Petersburg oblast, Nizny Novgorod, Samari, Ekaterinburg, Perm, Novosibirik, Kiasnayovsk, Volgograd, Chelyabirsk, and Omsk. 12 The industrial categories are chemicals, machinery, wood and paper, construction material, light industry, and food processing. There were, however, 18 “special” firms in the sample which did not wholly belong to any of these six industries. Hence, a seventh industrial category – other – was created for these firms. 13 The survey was based on random sampling from a population list from Goskomstat Enterprise Registry, for the six Russian Industries Classification’s (OKONH) two digit sector. The size of the sampled firms was restricted to between 100 and 5000 employees, so as to rule out both small and medium enterprises and the huge Russian resource companies which, though important economically, are atypical. The sample was stratified to distribute firms more or less evenly across three size classes: 100-500 employees, 501-1000 employees, and 1001-5000 employees. The stratification process led to certain biases in the sample relative to the Goskomstat data for industrial enterprises, e.g., over-representation of chemicals relative to machine building. Bevan et al. (2000) also report some bias in favor of more profitable firms. None of these biases seem likely to explain the estimation results to any significant extent.
William Davidson Institute Working Paper 525
12
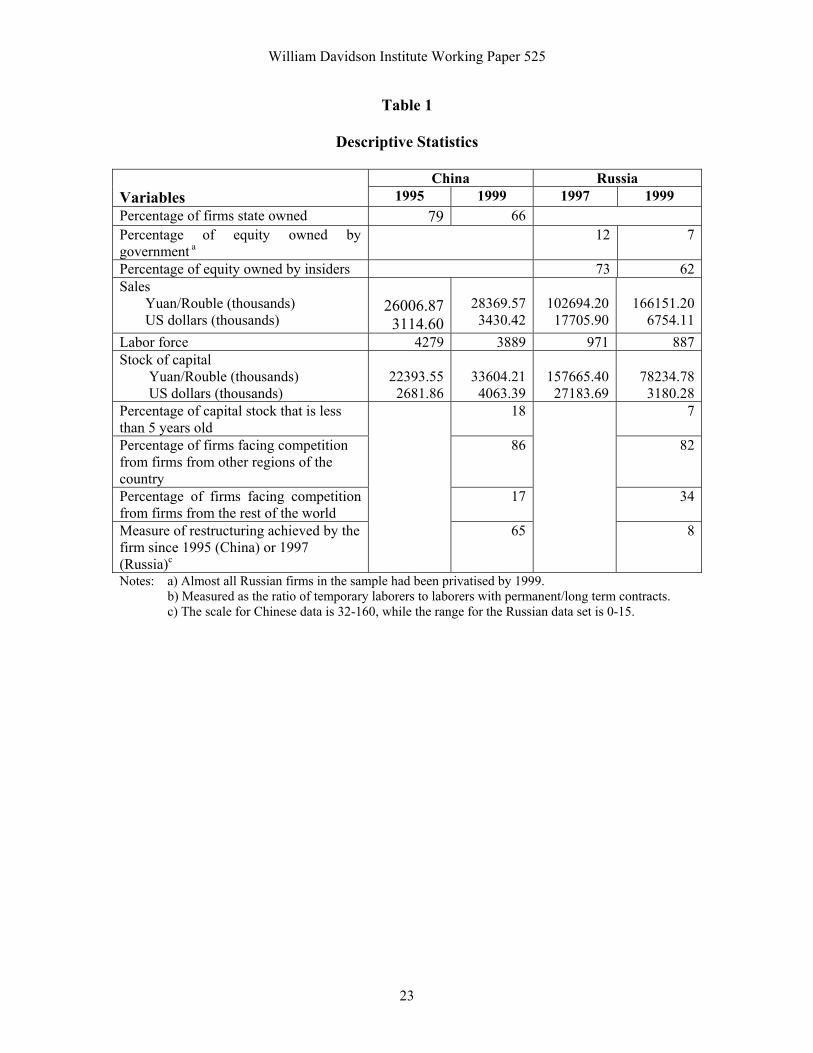
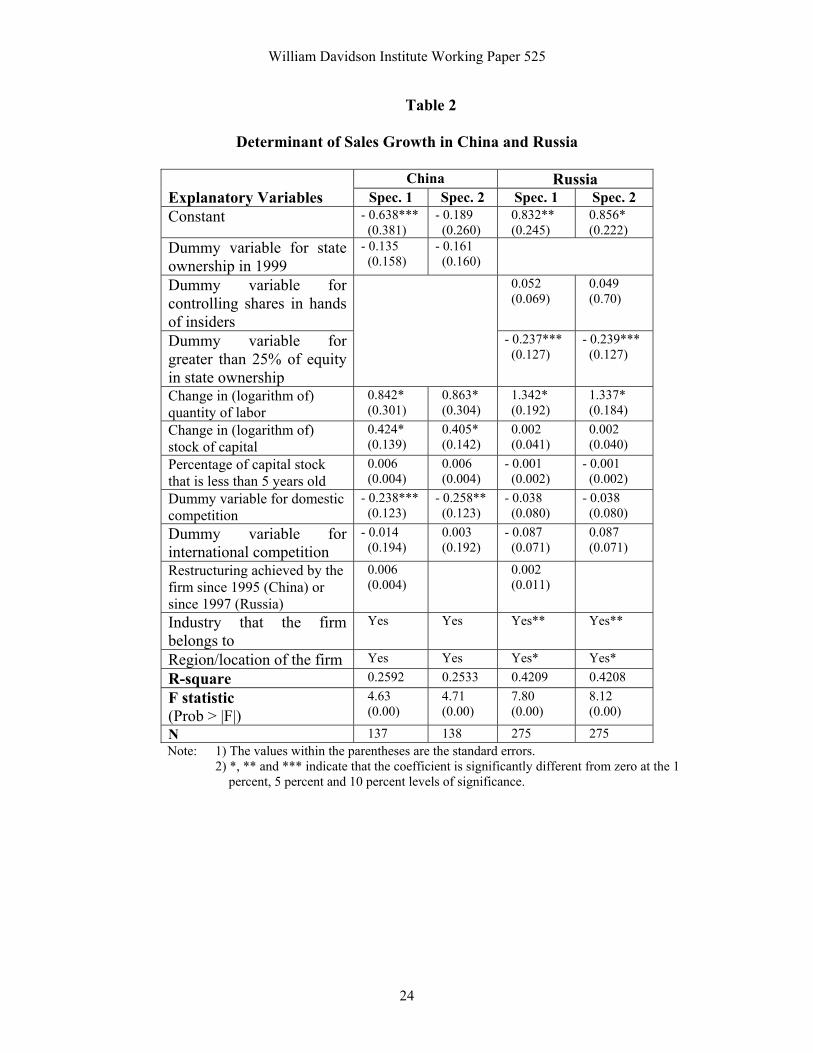
The descriptive statistics in Table 1 highlight the patterns of evolution of the Russian and the Chinese firms over the period and are consistent with the macro-economic data (see, e.g., EBRD, 2001). First, as one would expect, the state had controlling stake in most Chinese firms in our sample, while the majority of the Russian firms are controlled by insiders (see Qian, 2000, Earle and Estrin, 1997). Second, even though the real sales of an average Chinese firm in our sample grew between 1995 and 1999, while the real sales of an average Russian firm in our sample declined, sales per laborer in Russian firms remained higher that that in Chinese firms even after the recession in 1998 and even after the adverse impact of the sharp depreciation of the rouble on the US dollar value of the sales of the former. Further, there was real sales growth in a large minority of Russian firms. Third, the size of the labor force for both Russian and Chinese firms declined over time, indicating some degree of restructuring in both countries that involved laying off surplus laborers. Fourth, while the real capital stock (valued at historic cost) of an average Chinese firm grew substantially over the 1995-99 period, an average Russian firm experienced severe real decapitalisation during 1997-99, rather more markedly than the decline in demand.14 Finally, a greater proportion of Russian firms in our sample faced competition from foreign competitors than Chinese firms,15 possibly reflecting the fact that the Chinese firms surveyed are from the more insulated inland provinces (though Earle and Estrin, 1998, and Brown and Earle, 2001, also note that Russian industry faces quite stiff competition in its home market). We are unable to compare the extent of restructuring activity in the Chinese and Russian firms because it was measured on different scales in the two countries (see footnote 7). 4. Regression Results The regression results are presented in Tables (2) through (5). The empirical analysis is developed as follows: first, we have estimated the specification given in equation (6) using the Chinese and Russian data (Table 2). As mentioned above, the specifications for China and Russia are slightly different, on account of the difference in the nature of ownership and impact of ownership on firm performance in the two countries. Further, as explained in footnote 10, the measure of RE is also different across the two countries. Hence, equation (6) was estimated separately using the data from the two countries. The specification estimated with the Chinese data includes one ownership variable: a dummy variable indicating whether or not a firm was state-owned during the 1995-99 period. The specification estimated using the Russian data, on the other hand, has two variables
14 This decapitalisation could be a consequence of Russian firms either selling assets or writing off unproductive capital in the aftermath of the 1998 crisis. 15 Herfindahl indices, the stylised measure of the extent of competitiveness of an industry/sector, are not available for Chinese and Russian industries. Mindful of this lacuna in the available data, the survey instruments used in China and Russia asked the management of the firms whether or not they faced competition from other domestic firms, and foreign firms. The percentages stated in Table 1 were generated on the basis of the dummy variables – with value 1 if a firm faced a certain type of competition, and 0 otherwise – that were created on the basis of this information.
William Davidson Institute Working Paper 525
13
capturing the impact of insider ownership and residual government control: a dummy variable indicating whether or not insiders – managers and laborers – hold a majority stake in a firm during 1997-99, and another dummy variable indicating whether the government controls 25% or more of its equity during the same period, a stake which we could have given the government significant influence over strategic and operational decisions of the firm. Moreover, since it can be argued that ownership (O) itself determines managerial effort, we estimated two different specifications for both China and Russia: one in which the proxies for managerial input are both ownership and the extent of restructuring (Spec. 1 in Tables 2 through 4), and another in which ownership alone is the proxy for managerial input (Spec 2 in Tables 2 through 4).16 Second, in order to check for the robustness of the results presented in Table 2, we used an alternative yet related measure of firm performance, namely, proportional sales growth, which can be defined as ∆ln S/ln S0: the rate of growth (of sales). This measure of performance takes into account the initial size of the firm. We estimated the two specifications presented in Table 2 – one with and one without the measure of enterprise restructuring – using Chinese and Russian data, after substituting the growth rate of sales, the dependent variable for the models presented in Table 2, with the proportional growth of sales of the firms. The coefficient estimates of the models that have this second order measure of performance as the dependent variable are presented in Table 3. Third, as we shall see later, a very significant part of the inter-firm variation in sales growth in Russia is explained by regional dummy variables that were included in the specification to capture the impact of institutions – or the cross-regional difference thereof – on the growth of the firms. Indeed, almost none of the explanatory variables that owe their inclusion in equation (6) to economic theory have coefficients that are significantly different from zero. Since the data for the Russian firms span the 1997-99 period, and given that the debt and currency crises in Russia in 1998 may have affected the performance of the firms in a way that is not adequately captured by the specification, we estimated equation (6) using data on Russian firms separately for the 1997-98 and 1998-99 periods (Table 4). If the results for the Russian firms, presented in Tables 2 and 3, are driven by the events in 1998, the factors determining the growth of sales of these firms would be noticeably different in 1998-99 as compared with 1997-98. 16 In other words, RE might be endogenous. The omitted variable version of the Hausman test (see Kennedy, 1998, p. 150-1) indicates that this indeed is the case. However, the surveys do not provide for good instruments and hence the IV equations are weak; the coefficients of the plausible instruments are not significant. Hence, RE was not instrumented and, as we shall see later, two specifications – one including RE and the other without RE – were estimated. The decision to not use IV technique in the face of weak IV regressions is by no means unique and unprecedented. See, for example, Bhaumik and Nugent (1999).
William Davidson Institute Working Paper 525
14
Finally, since institutional factors seem to have played such an important role in determining firm performance in Russia, and since dummy variables by themselves do not indicate the relative importance of the different types of institutions, we estimated equation (6) by substituting the regional dummy variables with variables that capture the characteristics of the regions (Table 5). Specifically, we used the Berkowitz and DeJong (2001) variables capturing inter-regional economic and institutional differences in Russia.17 We also estimated specifications in which sectoral relative prices were used instead of industry dummies, but these regressions were found to be inferior in terms of goodness of fit and are therefore not reported. The regression results presented in Table 2 indicate that in China, growth of sales is positively correlated with changes in factor inputs (i.e., α, β > 0) and negatively correlated with competition (i.e., λ3 < 0). Managerial input is not significant however in this specification. Note that neither the signs nor the magnitudes of the significant coefficients are much different across specifications 1 and 2. These findings are consistant with those of other empirical studies on China (e.g. Jefferson et al., 1996, Jefferson et al., 2000). In the Russian context, on the other hand, variation in the growth rate of sales across firms can largely be explained by industry-specific (IS) and region-specific (R) factors. The economic variables that have significant conditional correlation with the growth of sales in the Russian context are the quantity of labor (i.e., α > 0) and the dummy variable capturing significant (i.e., greater than 25 percent) government equity stake in a firm, both with the predicted sign. Outsider ownership is found to have the same effect on performance as insider ownership. Once again, both the signs and the magnitudes of the significant coefficients are preserved across the two alternative specifications. In other words, in both the Chinese and the Russian contexts, the coefficient estimates are robust with respect to the inclusion of managerial effort in the specification, and this is also reflected in the similar values of the R-square statistic across the two specifications for both China and Russia. The R-square values – 0.25 and 0.42 for China and Russia respectively – and the F-statistic indicate that our specification explains variations in sales growth across fairly well. However, the Chinese data yield a fairly well specified conventional revenue function, with both factor inputs and other variables significant, while, as in other studies (see Estrin and Wright, 1999, or Djankov and Murrell, 2000, for a summary) the Russian data yield an equation with more limited economic interpretation. 17 Berkowitz and DeJong (2001) have a number of variables highlighting the differences among the regions of Russia. However, predictably, the variables are highly correlated, and after taking into consideration the possible multicollinearity problems we were able to use five of the variables: industrial growth during 1997-99, unemployment in 1998, per capita gross regional product in 1997, proportion of debt that was overdue in 1998, and index of legislative quality in 1997. The first three variables are proxies for regional demand, while the fourth and fifth variables are proxies for the strength of market institutions and enforceability of contracts in the regions.
William Davidson Institute Working Paper 525
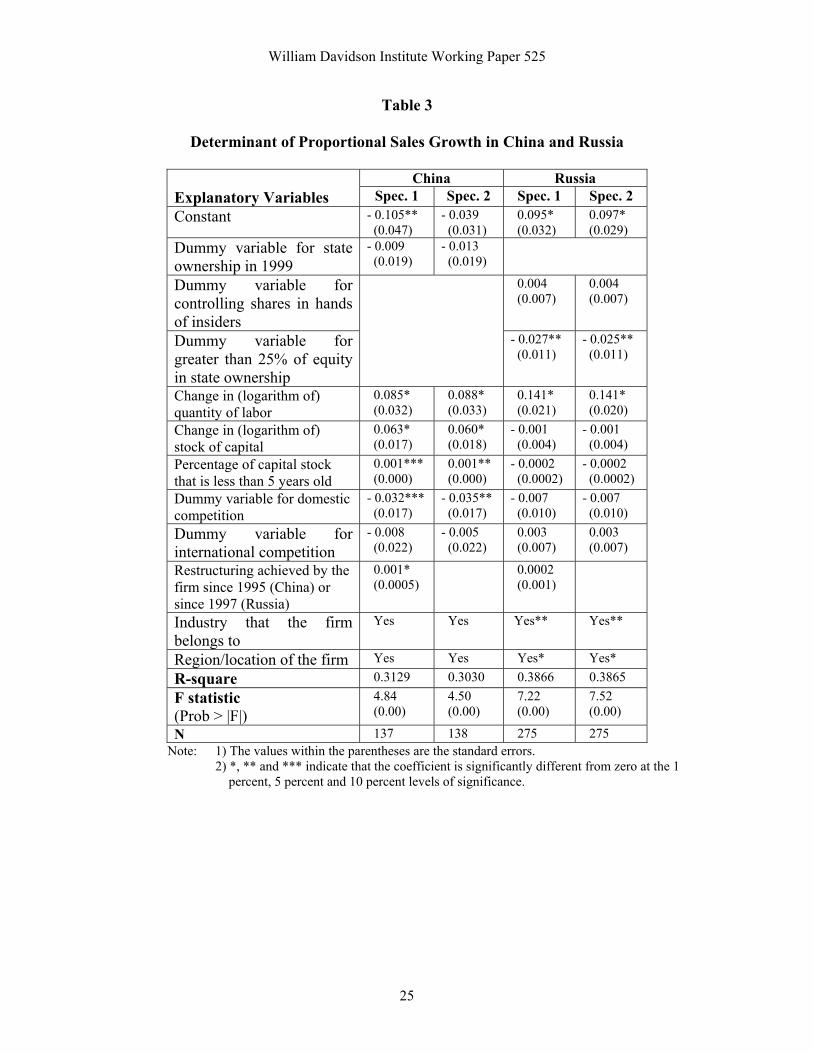
15
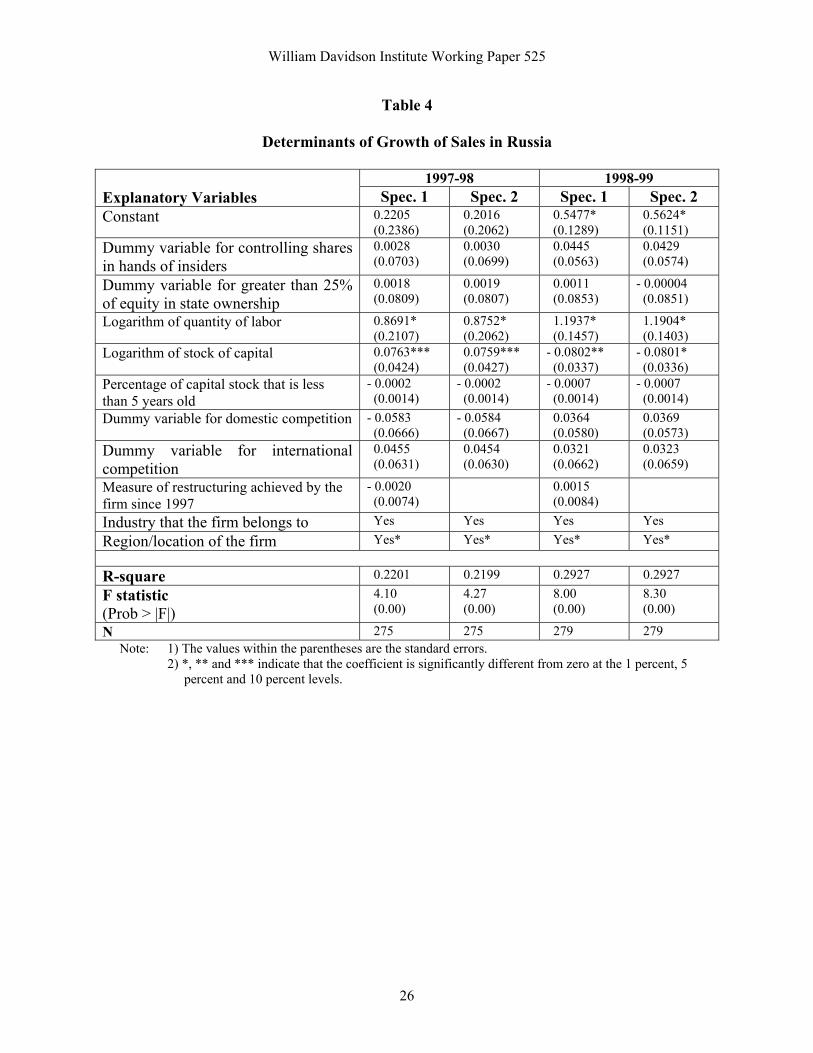
Table 3 reports the coefficients of the variables explaining inter-enterprise variation in firm performance when performance is measured not by the growth of sales but by the proportional growth of sales. It can be seen that this change in the measure of performance significantly improves the results involving the Chinese firms. The rate of growth of sales of the Chinese firms in our sample not only varies positively with changes in factor inputs (i.e., α, β > 0) and negatively with competition (i.e., λ3 < 0), as earlier, but also has a significant conditional correlation with technology (i.e., γ > 0). Once again, signs and magnitudes of the significant coefficients estimates are not affected by the inclusion of the indicator of managerial activity in the specification, but this is found to have a weakly significant independent effect in China. The R-square value correspondingly improves from 0.25 (see Table 2) to 0.3, suggesting it is important to control for initial size in explaining Chinese enterprise sales growth. The variation in the rate of sales growth across Russian firms however is, once again, explained primarily by industry-specific and region-specific factors. As before, change in the size of the labor force is shown to have varied positively with this second order measure of performance (i.e., α > 0), while significant (i.e., more than 25 percent) government stake in firms are once again seen to have had a negative impact on the proportional growth rate of sales of firms. As before, the estimates are robust with respect to the inclusion of RE in the specification but managerial activity exerts no independent influence on performance. However, the R-square value – still very reasonable – declines marginally from 0.42 to 0.38, suggesting no underlying relationship between firm size and growth in Russian enterprises. Table 4 presents the regression estimates for the two aforementioned specifications – one including and the other excluding a measure for managerial effort – for Russia, for the 1997-98 and 1998-99 time periods. The purpose of this exercise is to verify whether the Russian debt and currency crises of 1998 is driving the result – presented in Tables 2 and 3 – that industry-specific and region-specific/institutional factors are influencing performance of Russian firms rather than the “economic” variables. The regression results indicate that in each of these two periods – 1997-98 and 1998-99 – changes in factor inputs capital and labor were correlated with growth of sales (i.e., α, β > 0). While the significance of capital, absent in the results presented in Tables 2 and 3, is a welcome improvement, the coefficient is actually found to be negative in the 1998-99 period, probably reflecting a slow adjustment of the capital stock to the output shock. Managerial effort, competition, capital quality and ownership continue to play no role in explaining Russian enterprise performance in either year. Even before the 1998 recession, much of the variation in sales growth across firms is thus explained by region-specific factors. What inference can we draw from the fact that while, in China, economic factors like changes in labor and capital, the level of technology and managerial activity explain inter-firm variation in growth and proportional growth of sales, in Russia most of this variation is explained by region-specific factors? The first and the more obvious
William Davidson Institute Working Paper 525
16
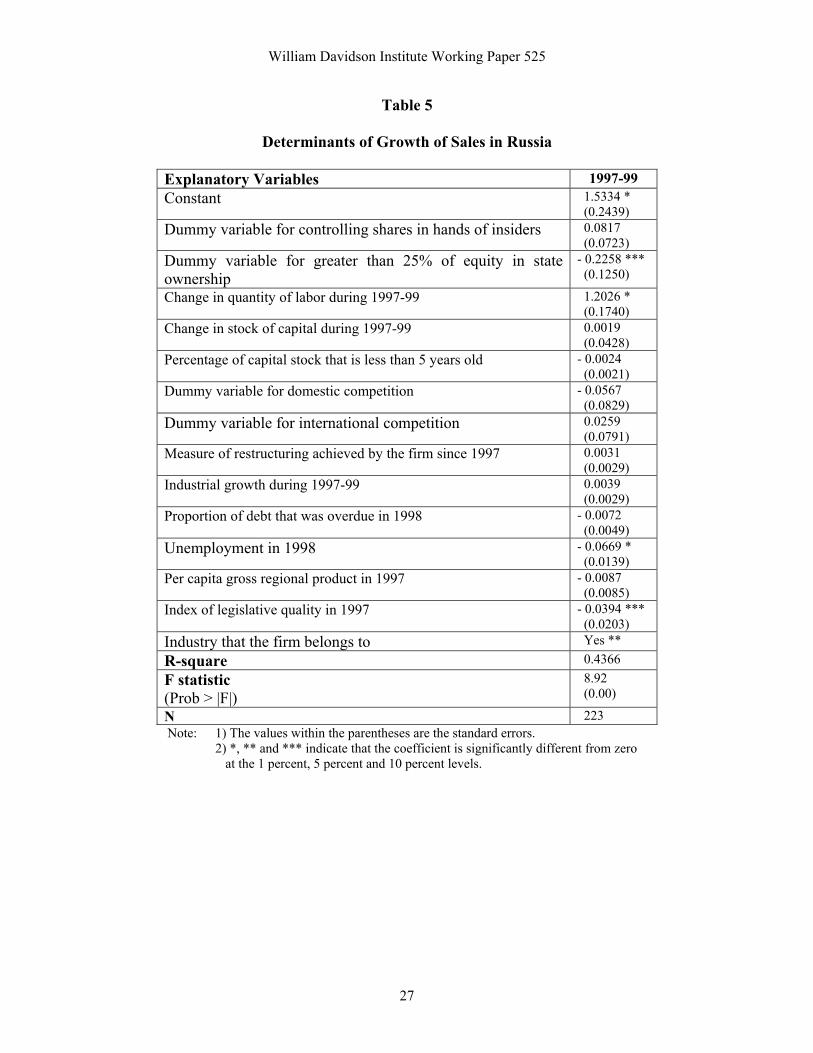
implication of this result is that, unlike in China, the Russian market remains fragmented both in the geographical and institutional sense, an observation that is consistent with our knowledge about the political economy of economic governance in Russia and China (see e.g. Hanson, 2002, Mau, 2000, Granick, 1990). Which institutional variables are likely to have a significant impact on enterprise performance, however? Berkowitz and DeJong (2001) have explained in detail the determinants of differential growth rates across regions in Russia, and provide a useful source of information about inter-regional differences in demand, infrastructure, legal arrangements, political orientation and corruption. Most of these variables are highly correlated with each other, and hence one has to be careful about the choice of variables to be included in a regression specification. After some experimentation, we selected the variables which had the greatest impact on enterprise performance (on the basis of goodness of fit) and yet were not highly correlated with each other. Table 5 reports the coefficient estimates. Since the results presented in Tables 2 through 4 have shown that the coefficient estimates are robust with respect to the inclusion of a measure of managerial effort in the specification, in Table 5 we present only one of the two alternative specifications, the one that includes RE. The results indicate that regional unemployment rate, a proxy for regional demand, and the regional index for legislative quality, a proxy for the quality of regional institutions, are the region-specific variables that have most significant impact on enterprise performance as measured by growth of sales.18 Further, use of regional dummy variables and the Berkowitz and DeJong variables provide an equivalent amount of explanation for the inter-firm variation in performance. This indicates that the significance of the regional dummies in the previous equations is indeed proxying for a combination of local demand and institutional/legal factors. 5. Conclusions In this paper, we have estimated comparable equations across enterprise samples in China and Russia seeking to understand the determinants of changing enterprise performance. The surveys are particularly interesting in bringing into contrast samples of firms from more isolated inland regions in China with companies from across Russia, including leading centres such as Moscow and St Petersburg. China commenced the transition more than twenty years ago, and has embraced a path of gradual change, with liberalisation of
18 The index accorded a value of 1-6 to each of the regions, 1 being the best and 6 the worst. Hence the negative sign of the coefficient.
William Davidson Institute Working Paper 525
17
domestic and international markets first and, more recently, privatisation and capital market development. Russian reforms began only a decade ago, from a much longer heritage of industrialisation and central planning, and with an almost simultaneous and immediate liberalisation of markets and mass privatisation. Our findings, which are consistent with other individual country studies, suggest a clear contrast in outcomes between the two countries. In China, enterprises appear to be responsive to market and supply phenomena – competition, managerial effort, technology and investment. However, we find little impact from the extent of privatisation or from local or individual institutional factors. In contrast, Russian firms are still unresponsive to most conventional economic drivers – outsider versus insider privatisation, management effort, competition or technological factors. Nearly a decade after the start of transition, the primary determinants of enterprise performance in Russia remain region-specific primarily local demand and institutional factors, though we do identify a relationship between changes in sales and in employment. These findings cast some light on several important policy debates. They suggest that there were serious flaws in the “big bang” reform strategy adapted in Russia, though it is unclear whether these were in the design or implementation of policy. The null hypothesis is however not well specified; it is not clear that alternative, more gradual and partial, strategies were a realistic option in Russia in the early 1990s (see Boycko et al., 1995, Nellis, 2000). Further, it is not evident whether the Chinese reforms process itself is optimal, given the concerns about the health of the Chinese public sector banks and the resultant quasi-fiscal obligations of the government. However, the effectiveness of reforms which liberalise markets while leaving ownership unchanged or only partially adjusted, seems to be strongly supported by our Chinese findings. We confirm that state owned and semi-privatised firms in China are responding to market signals and increasing total factor productivity along the same lines as privately owned firms in market economies (see Jefferson and Rawski, 1994), even when they are located in inland China where the spillovers from foreign direct investment are limited compared to that in the coastal and southern regions of the country. This suggests that in certain contexts such as the one of modern China, market incentives are sufficient to ensure some degree of efficiency in enterprise actively without immediate full privatisation. This is not to say that performance cannot be further improved by private ownership; indeed the evidence is strong that privatization improves enterprise performance (see Megginson and Netter, 2001). But it is consistent with the view (see e.g. Stiglitz, 1999) that neither “big bang” reform policies nor early privatisation are the sine qua non for successful transition.
William Davidson Institute Working Paper 525
18
References
Barberis, N., Shleifer, A., Vishny, R., 1996. How Does Privatization Work? Evidence from the Russian Shops. Journal of Political Economy, 104 (4), 764-790.
Bennett, J., Estrin, S., Maw, J., 2001. Mass Privatisation and Partial State Ownership of Firms in Transition Economics. Discussion Paper no 2895, Centre for Economic Policy Research, London.
Berkowitz, D., DeJong, D., 2001. Entrepreneurship and Post-Socialist Growth. Mimeo, University of Pittsburgh.
Bevan, A., Angelucci, M., Estrin, S., Fennema, J., Kuznetsov, B., Mangiarotti, G., Schaffer, M., 2002. The Determinants of Privatized Enterprise Performance in Russia. Discussion Paper no 3193, Centre for Economic Policy Research, London.
Bhaumik, S. K., Nugent, J., 1999. Analysis of Food Demand in Peru, Implications for Food Feed Competition. Review of Development Economics, 3 (3), 242-257.
Blanchard, O., Aghion, P., 1996. On Insider Privatization. European Economic Review, 40 (3-5), 759-766.
Blanchard, O., Kremer, M., 1997. Disorganization. Quarterly Journal of Economics, 112 (4), 1091-1126.
Blasi, J., Kroumova, M., Kruse, D., 1997. Kremlin Capitalism, Privatizing the Russian Economy. Cornell University Press, Ithaca.
Boycko, M., Shleifer, A., and Vishny, R., 1995. Privatizing Russia. MIT Press, Cambridge, Mass.
Brown, A. N., Brown, D., 1999. The Transition of Market Structure in Russia, Economic Lessons and Implications for Competition. Staff Paper no 99/01, Stockholm Institute of Transition Economics, Stockholm.
Brown, D. Earle, J., 2001. Privatization, Competition and Reform Strategies, Theory and Evidence from Russian Enterprise Panel Data. Discussion Paper no 2758, Centre for Economic Policy Research, London.
Cao, Y., Qian, Y., Weingast, B., 1999. From Federalism, Chinese style to Privatization, Chinese style. Economics of Transition, 7 (1), 103-131.
Claessens, S., Djankov, S., 1999. Enterprise Performance and Management Turnover in the Czech Republic. European Economic Review, 43 (4-6), 1115-1124.
William Davidson Institute Working Paper 525
19
Commander, S., Dolinskaya, I., Mumssen, C., 2002. Determinants of Barter in Russia: An Empirical Analysis. Journal of Development Economics, 67 (2), 275-307.
Commander, S., Fan, Q., Schaffer, M., 1996. Enterprise Restructuring and Economic Policy in Russia. World Bank, Washington.
Dewatripont, M., Roland, G., 1995. The Design of Reform Packages under Uncertainty. American Economic Review, 85 (5), 1207-1223.
Djankov, S., Murrell, P., 2002. Enterprise Restructuring in Transition: A Quantitative Survey. Journal of Economic Literature, 40(3), 739-793.
Earle, J., Estrin, S., 1997. After Voucher Privatization, The Structure of Corporate Ownership in Russian Manufacturing Industry. Discussion Paper no.1736, Centre for Economic Policy Research, London.
Earle, J., Estrin, S., 1998. Privatization, Competition and Budget Constraints: Disciplining Enterprises in Russia. Working Paper no 128, Stockholm Institute of Transition Economics, Stockholm.
EBRD, 1999. Transition Report 1999, Ten Years of Transition. London, EBRD.
EBRD, 2001. Transition Report 2001, Energy in Transition. London, EBRD.
Ellman, M., 1989. Socialist Planning. Cambridge, Cambridge University Press.
Estrin, S., 2002. Competition and Corporate Governance in Transition. Journal of Economic Literature, 16 (1), 101-124.
Estrin, S., Gelb, A., Singh, I., 1995. Shocks and Adjustment by Firms in Transition, A Comparative Study. Journal of Comparative Economics, 21 (2), 131-153.
Estrin, S., Wright, M., 1999. Corporate Governance in the Former Soviet Union, An Overview. Journal of Comparative Economics, 27 (3), 398-421.
Fisher, S., Gelb, A., 1991. Process of Socialist Economic Transformation. Journal of Economic Perspectives, 5 (4), 91-105.
Frydman, R., Gray, C., Hessel, M., Rapaczynski, A., 1999. When Does Privatization Work? The Impact of Private Ownership on Corporate Performance in the Transition Economies. Quarterly Journal of Economics, 114 (4), 1153-1191.
William Davidson Institute Working Paper 525
20
Granick, D., 1990. Chinese State Enterprises, A Regional Property Rights Analysis. University of Chicago Press, Chicago and London.
Granville, B., Oppenheimer, P., (Eds.), 2001. Russia’s Post-Communist Economy. Oxford University Press, New York.
Groves, T., Hong, Y., McMillan, J., Naughton, B., 1994. Autonomy and Incentives in Chinese State Enterprises. Quarterly Journal of Economics, 109 (1), 183-209.
Groves, T., Hong, Y., McMillan, J., Naughton, B., 1995. China's Evolving Managerial Labor Market. Journal of Political Economy, 103 (4), 873-892.
Hanson, P., 2002. Barriers to long-term growth in Russia. Economy and Society, 31 (1), 62-84.
Huang, Y., Duncan, R., 1997. How Successful Were China’s State Sector Reforms? Journal of Comparative Economics, 24 (1), 65-78.
IMF, 1999. International Financial Statistics Yearbook. International Monetary Fund, Washington D.C.
Jefferson, G., Rawski, T., 1994. Enterprise Reform in Chinese Industry. The Journal of Economic Perspectives, 8 (2), 47-70.
Jefferson, G., Rawski, T., Zheng, Y., 1996. Chinese Industrial Productivity, Trends, Measurement Issues, and Recent Developments. Journal of Comparative Economics, 23 (2), 146-180.
Jefferson, G., Rawski, T., Zheng, Y., 2000. Ownership, Productivity Change, and Financial Performance in Chinese Industry. Journal of Comparative Economics, 28 (4), 786-813.
Kennedy, P., 1998. A Guide to Econometrics. MIT Press, Cambridge, Mass.
Li, H., 1999. State Factories in Transition – Openness, Competition, and Productivity. Journal of Development Economics, 58 (2), 429-462.
Mau, V., 2000. Russian Economic Reform as Seen by an Insider, Success or Failure? Royal Institute of International Affairs, London.
Megginson, W., Netter, J., 2001. From State to Market, A Survey of Empirical Studies on Privatization. Journal of Economic Literature, 39 (2), 321-389.
Muravyev, A., 2002. Turnover and Succession of Senior Managers in Russian Privatised Firms. Mimeo, Russian European Centre for Economic Policy, Moscow.
William Davidson Institute Working Paper 525
21
Nellis, J., 2000. Privatization in Transition Economies, What Happened? What’s Next? Mimeo, World Bank, Washington.
Nickell, S., 1996. Competition and Corporate Performance. Journal of Political Economy, 104 (4), 724-746.
Parker, E., 1997. The Effect of Scale on the Response to Reform by Chinese State-Owned Construction Units. Journal of Development Economics, 52 (2), 331-353.
Qian, Y., Roland, G., Xu, C., 1999. Why Is China Different from Eastern Europe? Perspectives from Organization Theory. European Economic Review, 43 (4-6), 1085-1094.
Qian, Y., 2000. The Process of China’s Market Transition (1978-1998), The Evolutionary, Historical, and Comparative Perspectives. Journal of International and Theoretical Economics, 156 (1), 151-171.
Roland, G., 2000. Transition and Economics, Politics, Markets and Firms. MIT Press, London.
Sachs, J., Woo, W., 1997. Understanding China’s Economic Performance. Working Paper no 5935, National Bureau of Economic Research.
Stiglitz, J., 1999. Whither Reform? Ten Years of Transition. Keynote address at the Annual Bank Conference on Development Economics, World Bank, Washington.
Svejnar, J., 2002. Transition Economies, Performance and Challenges. Journal of Economic Perspectives, 16 (1), 3-28.
Tlusty-Sheen, A., 2001. Restructuring of State Owned Enterprises in Sha’anxi, Henan and Shanxi provinces in the People’s Republic of China. Paper presented at London Business School, Centre for New and Emerging Markets, London.
Tsui, K., 1996. Economic Reform and Interprovincial Inequalities in China. Journal of Development Economics, 50 (2), 353-368.
Vickers, J., Yarrow, G., 1988. Privatization, An Economic Analysis. MIT Press, Cambridge, Massachusetts.
Wang, Y., Yao, Y., 2001. Sources of China’s Economic Growth, 1952-99, Incorporating Human Capital Accumulation. Mimeo, World Bank, Washington.
Woo, W., 1994. The Art of Reforming Centrally Planned Economies, Comparing China, Poland and Russia. Journal of Comparative Economics, 18 (3), 276-308.
William Davidson Institute Working Paper 525
22
World Bank, 1996. From Plan to Market World Development Report. Washington, DC, Oxford University Press.
William Davidson Institute Working Paper 525
23
Table 1
Descriptive Statistics
China Russia Variables 1995 1999 1997 1999 Percentage of firms state owned 79 66Percentage of equity owned by government a
12 7
Percentage of equity owned by insiders 73 62Sales Yuan/Rouble (thousands) US dollars (thousands)
26006.873114.60
28369.57 3430.42
102694.20
17705.90
166151.20
6754.11Labor force 4279 3889 971 887Stock of capital Yuan/Rouble (thousands) US dollars (thousands)
22393.55 2681.86
33604.21 4063.39
157665.40
27183.69
78234.78 3180.28
Percentage of capital stock that is less than 5 years old
18 7
Percentage of firms facing competition from firms from other regions of the country
86 82
Percentage of firms facing competition from firms from the rest of the world
17 34
Measure of restructuring achieved by the firm since 1995 (China) or 1997 (Russia)c
65
8
Notes: a) Almost all Russian firms in the sample had been privatised by 1999. b) Measured as the ratio of temporary laborers to laborers with permanent/long term contracts. c) The scale for Chinese data is 32-160, while the range for the Russian data set is 0-15.
William Davidson Institute Working Paper 525
24
Table 2
Determinant of Sales Growth in China and Russia
China Russia Explanatory Variables Spec. 1 Spec. 2 Spec. 1 Spec. 2 Constant - 0.638***
(0.381) - 0.189 (0.260)
0.832** (0.245)
0.856* (0.222)
Dummy variable for state ownership in 1999
- 0.135 (0.158)
- 0.161 (0.160)
Dummy variable for controlling shares in hands of insiders
0.052 (0.069)
0.049 (0.70)
Dummy variable for greater than 25% of equity in state ownership
- 0.237*** (0.127)
- 0.239*** (0.127)
Change in (logarithm of) quantity of labor
0.842* (0.301)
0.863* (0.304)
1.342* (0.192)
1.337* (0.184)
Change in (logarithm of) stock of capital
0.424* (0.139)
0.405* (0.142)
0.002 (0.041)
0.002 (0.040)
Percentage of capital stock that is less than 5 years old
0.006 (0.004)
0.006 (0.004)
- 0.001 (0.002)
- 0.001 (0.002)
Dummy variable for domestic competition
- 0.238*** (0.123)
- 0.258** (0.123)
- 0.038 (0.080)
- 0.038 (0.080)
Dummy variable for international competition
- 0.014 (0.194)
0.003 (0.192)
- 0.087 (0.071)
0.087 (0.071)
Restructuring achieved by the firm since 1995 (China) or since 1997 (Russia)
0.006 (0.004)
0.002 (0.011)
Industry that the firm belongs to
Yes Yes Yes** Yes**
Region/location of the firm Yes Yes Yes* Yes* R-square 0.2592 0.2533 0.4209 0.4208 F statistic (Prob > |F|)
4.63 (0.00)
4.71 (0.00)
7.80 (0.00)
8.12 (0.00)
N 137 138 275 275 Note: 1) The values within the parentheses are the standard errors.
2) *, ** and *** indicate that the coefficient is significantly different from zero at the 1 percent, 5 percent and 10 percent levels of significance.
William Davidson Institute Working Paper 525
25
Table 3
Determinant of Proportional Sales Growth in China and Russia
China Russia Explanatory Variables Spec. 1 Spec. 2 Spec. 1 Spec. 2 Constant - 0.105**
(0.047) - 0.039 (0.031)
0.095* (0.032)
0.097* (0.029)
Dummy variable for state ownership in 1999
- 0.009 (0.019)
- 0.013 (0.019)
Dummy variable for controlling shares in hands of insiders
0.004 (0.007)
0.004 (0.007)
Dummy variable for greater than 25% of equity in state ownership
- 0.027** (0.011)
- 0.025** (0.011)
Change in (logarithm of) quantity of labor
0.085* (0.032)
0.088* (0.033)
0.141* (0.021)
0.141* (0.020)
Change in (logarithm of) stock of capital
0.063* (0.017)
0.060* (0.018)
- 0.001 (0.004)
- 0.001 (0.004)
Percentage of capital stock that is less than 5 years old
0.001*** (0.000)
0.001** (0.000)
- 0.0002 (0.0002)
- 0.0002 (0.0002)
Dummy variable for domestic competition
- 0.032*** (0.017)
- 0.035** (0.017)
- 0.007 (0.010)
- 0.007 (0.010)
Dummy variable for international competition
- 0.008 (0.022)
- 0.005 (0.022)
0.003 (0.007)
0.003 (0.007)
Restructuring achieved by the firm since 1995 (China) or since 1997 (Russia)
0.001* (0.0005)
0.0002 (0.001)
Industry that the firm belongs to
Yes Yes Yes** Yes**
Region/location of the firm Yes Yes Yes* Yes* R-square 0.3129 0.3030 0.3866 0.3865 F statistic (Prob > |F|)
4.84 (0.00)
4.50 (0.00)
7.22 (0.00)
7.52 (0.00)
N 137 138 275 275 Note: 1) The values within the parentheses are the standard errors.
2) *, ** and *** indicate that the coefficient is significantly different from zero at the 1 percent, 5 percent and 10 percent levels of significance.
William Davidson Institute Working Paper 525
26
Table 4
Determinants of Growth of Sales in Russia
1997-98 1998-99 Explanatory Variables Spec. 1 Spec. 2 Spec. 1 Spec. 2 Constant 0.2205
(0.2386) 0.2016 (0.2062)
0.5477* (0.1289)
0.5624* (0.1151)
Dummy variable for controlling shares in hands of insiders
0.0028 (0.0703)
0.0030 (0.0699)
0.0445 (0.0563)
0.0429 (0.0574)
Dummy variable for greater than 25% of equity in state ownership
0.0018 (0.0809)
0.0019 (0.0807)
0.0011 (0.0853)
- 0.00004 (0.0851)
Logarithm of quantity of labor 0.8691* (0.2107)
0.8752* (0.2062)
1.1937* (0.1457)
1.1904* (0.1403)
Logarithm of stock of capital 0.0763*** (0.0424)
0.0759*** (0.0427)
- 0.0802** (0.0337)
- 0.0801* (0.0336)
Percentage of capital stock that is less than 5 years old
- 0.0002 (0.0014)
- 0.0002 (0.0014)
- 0.0007 (0.0014)
- 0.0007 (0.0014)
Dummy variable for domestic competition - 0.0583 (0.0666)
- 0.0584 (0.0667)
0.0364 (0.0580)
0.0369 (0.0573)
Dummy variable for international competition
0.0455 (0.0631)
0.0454 (0.0630)
0.0321 (0.0662)
0.0323 (0.0659)
Measure of restructuring achieved by the firm since 1997
- 0.0020 (0.0074)
0.0015 (0.0084)
Industry that the firm belongs to Yes Yes Yes Yes Region/location of the firm Yes* Yes* Yes* Yes* R-square 0.2201 0.2199 0.2927 0.2927 F statistic (Prob > |F|)
4.10 (0.00)
4.27 (0.00)
8.00 (0.00)
8.30 (0.00)
N 275 275 279 279 Note: 1) The values within the parentheses are the standard errors.
2) *, ** and *** indicate that the coefficient is significantly different from zero at the 1 percent, 5 percent and 10 percent levels.
William Davidson Institute Working Paper 525
27
Table 5
Determinants of Growth of Sales in Russia
Explanatory Variables 1997-99 Constant 1.5334 *
(0.2439) Dummy variable for controlling shares in hands of insiders 0.0817
(0.0723) Dummy variable for greater than 25% of equity in state ownership
- 0.2258 *** (0.1250)
Change in quantity of labor during 1997-99 1.2026 * (0.1740)
Change in stock of capital during 1997-99 0.0019 (0.0428)
Percentage of capital stock that is less than 5 years old - 0.0024 (0.0021)
Dummy variable for domestic competition - 0.0567 (0.0829)
Dummy variable for international competition 0.0259 (0.0791)
Measure of restructuring achieved by the firm since 1997 0.0031 (0.0029)
Industrial growth during 1997-99 0.0039 (0.0029)
Proportion of debt that was overdue in 1998 - 0.0072 (0.0049)
Unemployment in 1998 - 0.0669 * (0.0139)
Per capita gross regional product in 1997 - 0.0087 (0.0085)
Index of legislative quality in 1997 - 0.0394 *** (0.0203)
Industry that the firm belongs to Yes ** R-square 0.4366 F statistic (Prob > |F|)
8.92 (0.00)
N 223 Note: 1) The values within the parentheses are the standard errors.
2) *, ** and *** indicate that the coefficient is significantly different from zero at the 1 percent, 5 percent and 10 percent levels.
DAVIDSON INSTITUTE WORKING PAPER SERIES - Most Recent Papers The entire Working Paper Series may be downloaded free of charge at: www.wdi.bus.umich.edu
CURRENT AS OF 1/10/03 Publication Authors Date No. 525: Why Transition Paths Differ: Russian and Chinese Enterprise Performance Compared
Sumon Bhaumik and Saul Estrin Jan. 2003
No. 524: Official Regulations and the Shadow Economy: A Labour Market Approach
Maxim Bouev Dec. 2002
No. 523: Children at Risk: Infant and Child Health in Central Asia Cynthia Buckley Jan. 2003 No. 522: Wages and International Rent Sharing in Multinational Firms John W. Budd, Jozef Konings and
Matthew J. Slaughter July 2002
No. 521: Gross Job Flows in Ukraine: Size, Ownership and Trade Effects
Jozef Konings, Olga Kupets and Hartmut Lehmann
Dec. 2002
No. 520: Entrepreneurial Networking in China and Russia: Comparative Analysis and Implications for Western Executives
Bat Batjargal Dec. 2002
No. 519: Agriculture and Income Distribution in Rural Vietnam under Economic Reforms: A Tale of Two Regions
Dwayne Benjamin and Loren Brandt
Mar. 2002
No. 518: Property Rights, Labour Markets, and Efficiency in a Transition Economy: The Case of Rural China
Dwayne Benjamin and Loren Brandt
Mar. 2002
No. 517: Bank Discrimination in Transition Economies: Ideology, Information or Incentives?
Loren Brandt and Hongbin Li Oct. 2002
No. 516: Ex-ante Evaluation of Conditional Cash Transfer Programs: The Case of Bolsa Escola
François Bourguignon, Francisco H. G. Ferreira and Phillippe G. Leite
Sep. 2002
No. 515: Missed Expectations: The Argentine Convertibility Sebastian Galiani, Daniel Heymann and Mariano Tommasi
Nov. 2002
No. 514: Job Reallocation and Productivity Growth under Alternative Economic Systems and Policies: Evidence from the Soviet Transition
J. David Brown and John S. Earle Nov. 2002
No. 513: Cross-Border Trading as a Mechanism for Capital Flight: ADRs and the Argentine Crisis
Sebastian Auguste, Kathryn M.E. Dominguez, Herman Kamil and Linda L. Tesar
Nov. 2002
No. 512: Embracing the Market: Entry into Self-Employment in Transitional China, 1978 -1996
Xiaogang Wu Sep. 2002
No. 511: Opening the Capital Account of Transition Economies: How Much and How Fast
Daniel Daianu and Radu Vranceanu
Sep. 2002
No. 510: Bridging “the Great Divide”: Countering Financial Repression in Transition
Patrick Conway May 2002
No. 509: Change the Regime – Change the Money: Bulgarian Banknotes, 1885-2001
Adrian E. Tschoegl May 2002
No. 508: Differential Rewards to, and Contributions of, Education in Urban China’s Segmented Labor Markets
Margaret Maurer-Fazio and Ngan Dinh
June 2002
No. 507: Balassa-Samuelson Effect in Transition Economies: The Case of Slovenia
Boštjan Jazbec Oct. 2002
No. 506: Explaining Gender Differences in Unemployment with Micro Data on Flows in Post-Communist Economies
Jana Stefanová Lauerová and Katherine Terrell
Sep. 2002
No. 505: Bank Performance in Transition Economies Steven Fries, Damien Neven and Paul Seabright
Sep. 2002
No. 504: Does the Balassa-Samuelson Hypothesis Hold for Asian Countries? An Empirical Analysis using Panel Data Cointegration Tests
Imed Drine and Christophe Rault Sep. 2002
No. 503: Job Growth in Early Transition: Comparing Two Paths Štĕpán Jurajda and Katherine Terrell
Aug. 2002
No. 502: Job Creation, Destruction and Transition in Poland, 1988-1998: Panel Evidence
John E. Jackson and Bogdan Mach
June 2002
No. 501: Competition, Innovation and Growth in Transition: Exploring the Interactions between Policies
Philippe Aghion, Wendy Carlin and Mark Schaffer
Mar. 2002
No. 500: Women in the LAC Labor Market: The Remarkable 1990’s Suzanne Duryea, Alejandra Cox Edwards and Manuelita Ureta
June 2001
No. 499: Human Capital, Growth and Inequality in Transition Economies
Michael Spagat July 2002