Embed Size (px)
Citation preview
WHY TILAPIA IS BECOMING
THE MOST IMPORTANT FOOD
FISH ON THE PLANET
Kevin Fitzsimmons, Ph.D. University of Arizona, Professor of Environmental Science
World Aquaculture Society, Past-President
Aquaculture without Frontiers, Past-Chairman
American Tilapia Association, Sec. Tres.
ISTA 9
Shanghai Ocean University
22 April 2011
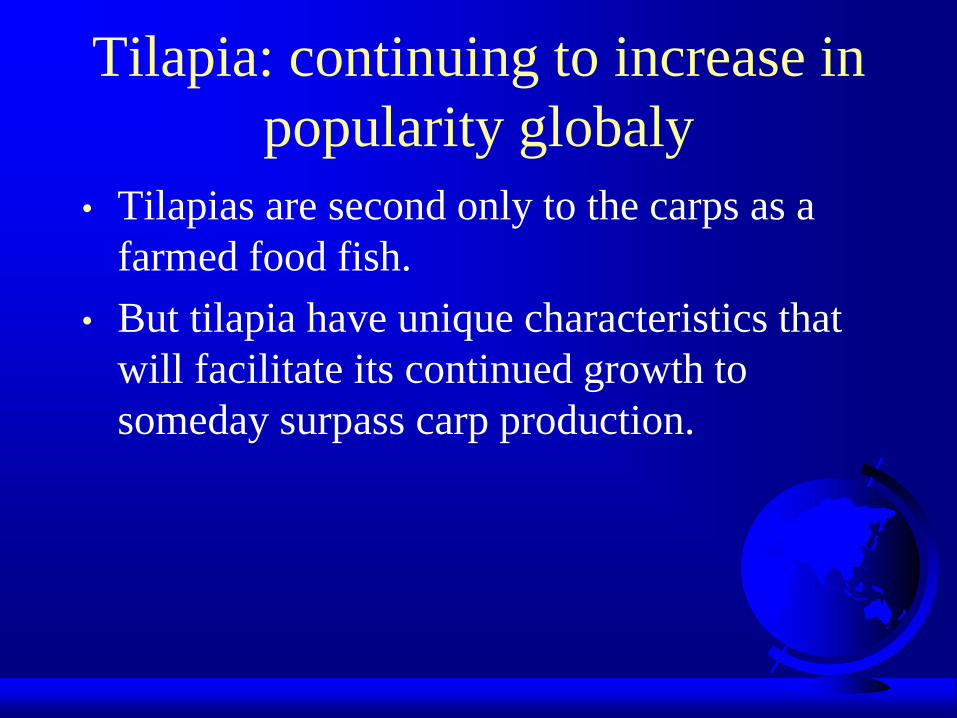
Tilapia: continuing to increase in
popularity globaly
• Tilapias are second only to the carps as a
farmed food fish.
• But tilapia have unique characteristics that
will facilitate its continued growth to
someday surpass carp production.
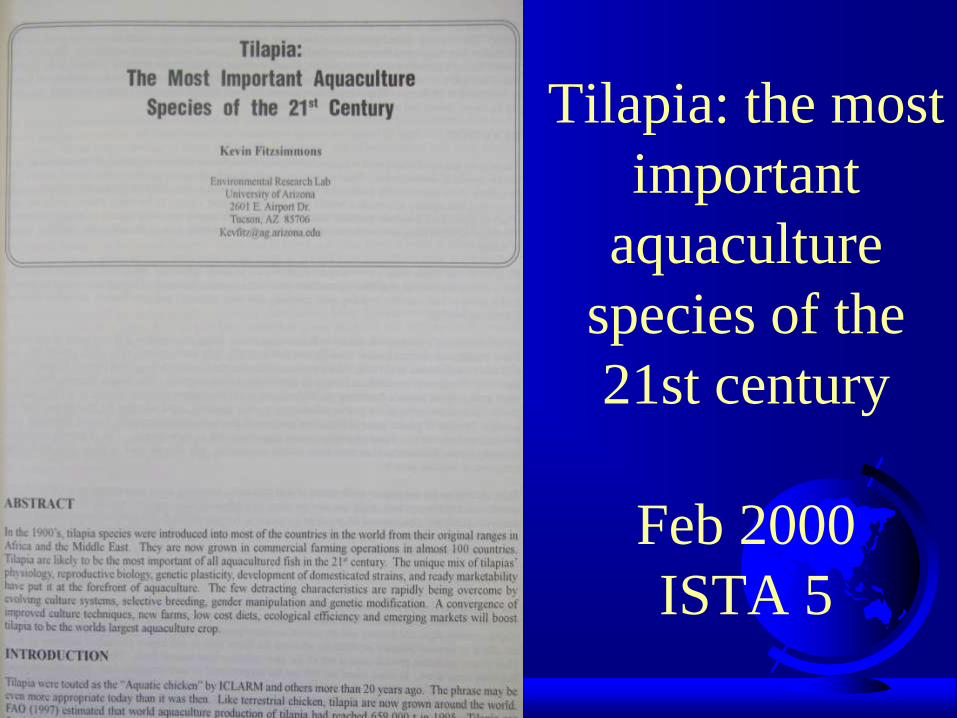
Tilapia: the most
important
aquaculture
species of the
21st century
Feb 2000
ISTA 5
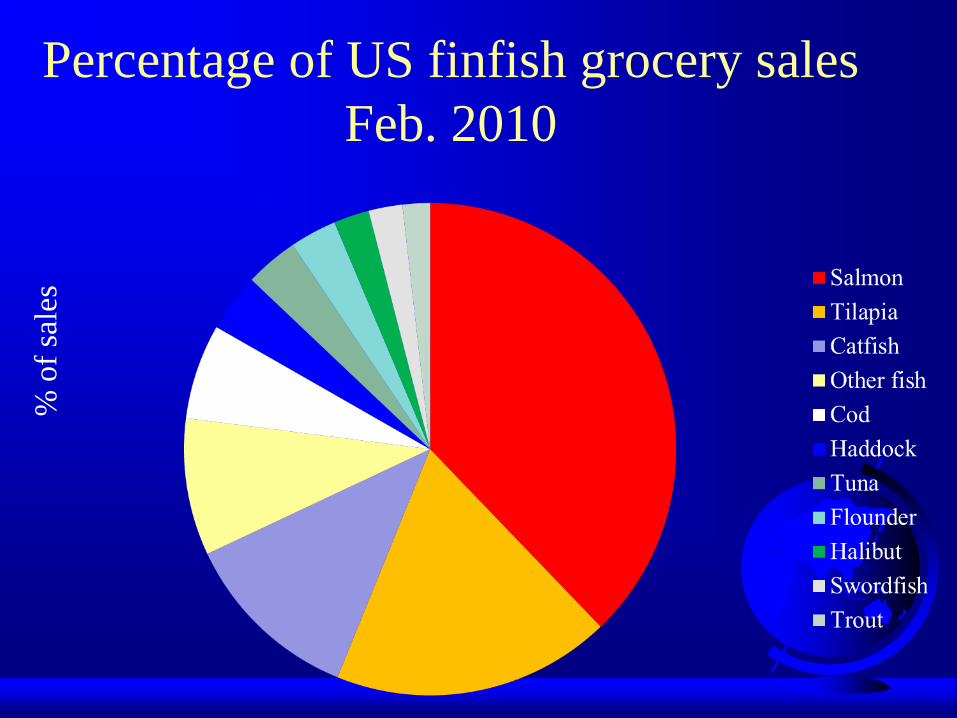
Percentage of US finfish grocery sales
Feb. 2010
% o
f sa
les
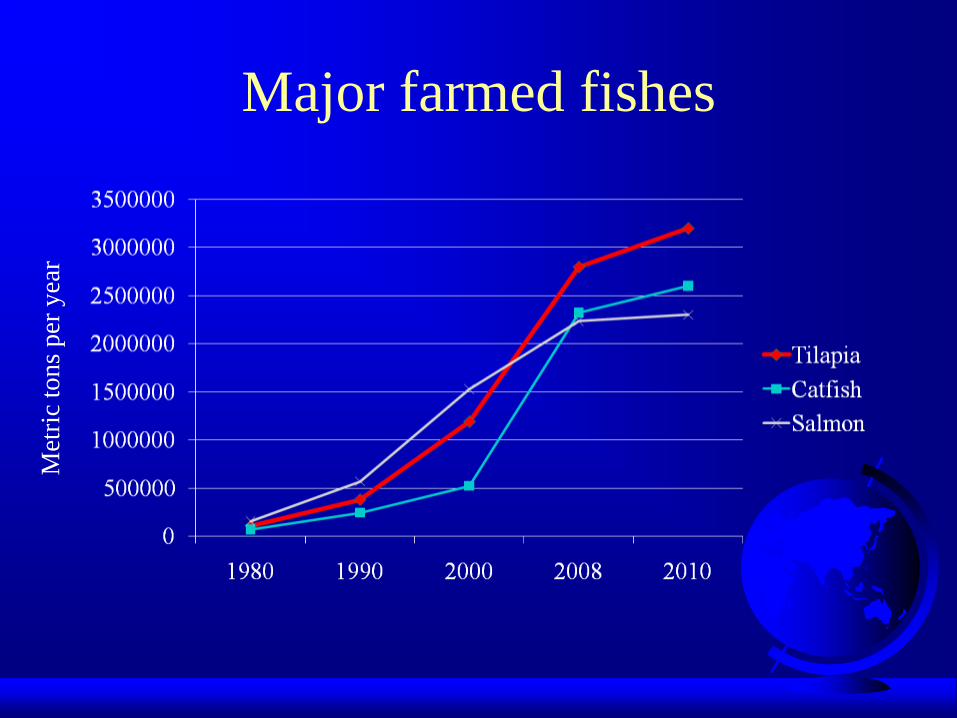
Major farmed fishes M
etri
c to
ns
per
yea
r
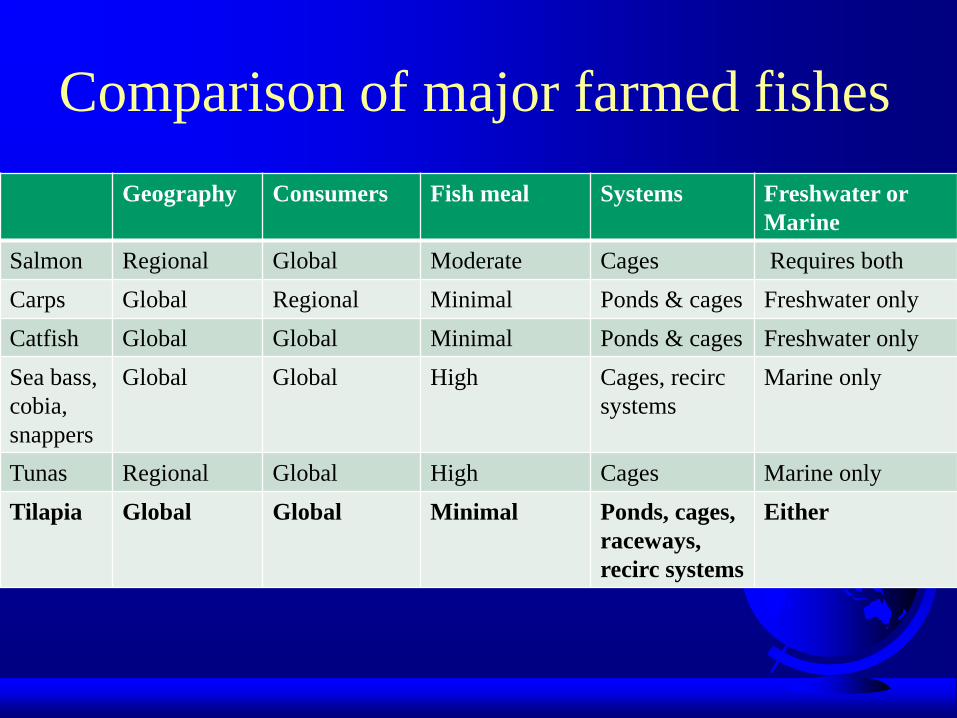
Comparison of major farmed fishes
Geography Consumers Fish meal Systems Freshwater or
Marine
Salmon Regional Global Moderate Cages Requires both
Carps Global Regional Minimal Ponds & cages Freshwater only
Catfish Global Global Minimal Ponds & cages Freshwater only
Sea bass,
cobia,
snappers
Global Global High Cages, recirc
systems
Marine only
Tunas Regional Global High Cages Marine only
Tilapia Global Global Minimal Ponds, cages,
raceways,
recirc systems
Either
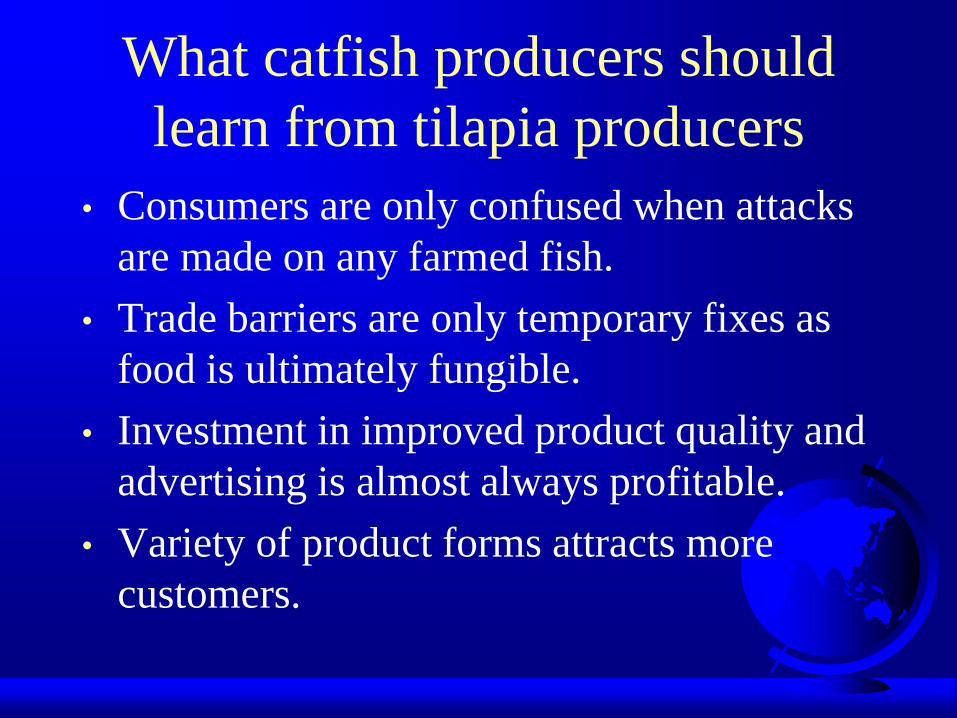
What catfish producers should
learn from tilapia producers
• Consumers are only confused when attacks
are made on any farmed fish.
• Trade barriers are only temporary fixes as
food is ultimately fungible.
• Investment in improved product quality and
advertising is almost always profitable.
• Variety of product forms attracts more
customers.
Subsistence and Export Commodity
• Tilapia is unique in its role as a small
livestock animal grown by subsistence farmers
in developing countries around the world…..
• And
• It is widely grown and exported to high value
markets to be served in expensive restaurants
and grocery stores
• Commodity or specialty crop - BOTH, like
chicken
Tilapia
• Model for how aquaculture industry should
develop
• Global demand, variety of production systems
and geographic regions, some vertically
integrated
• Environmentally sustainable – “Green
Aquaculture” (no fish meal required in the diet,
no antibiotics, many farms use effluents for
crops)
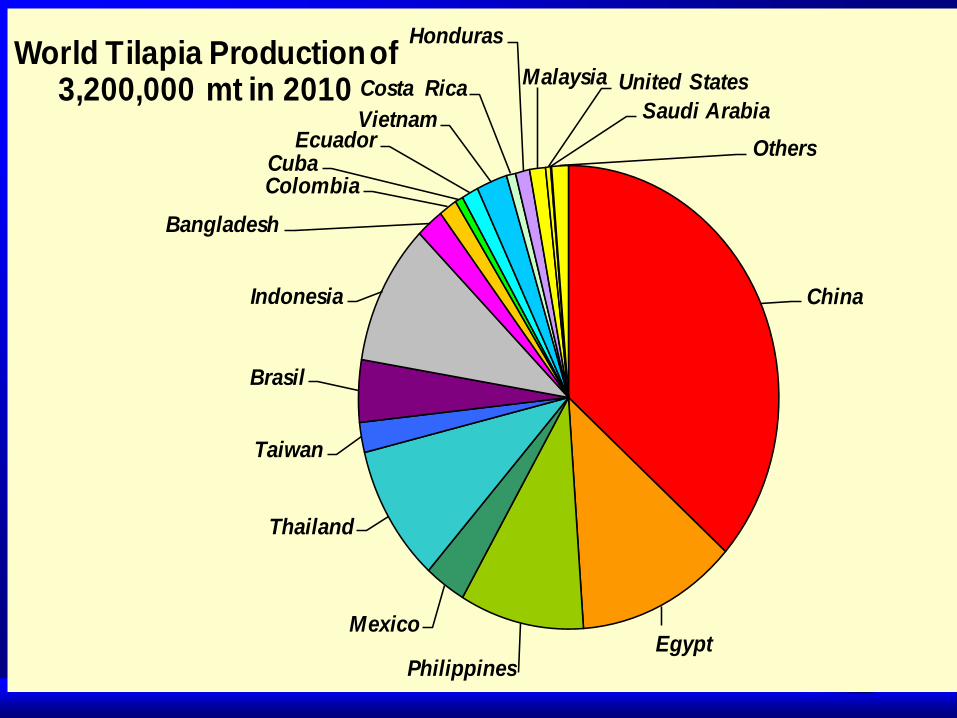
China
EgyptPhilippines
Mexico
Thailand
Taiwan
Brasil
Indonesia
Bangladesh
ColombiaCuba
EcuadorVietnam
Costa Rica
Honduras
Malaysia United States
Saudi Arabia
Others
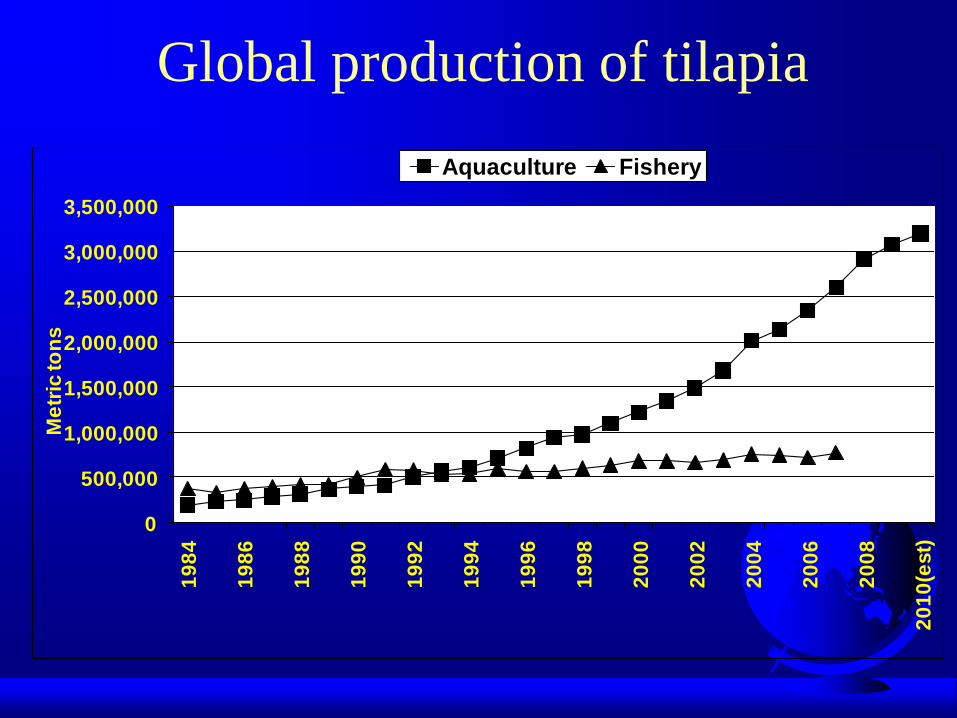
World Tilapia Production of 3,200,000 mt in 2010
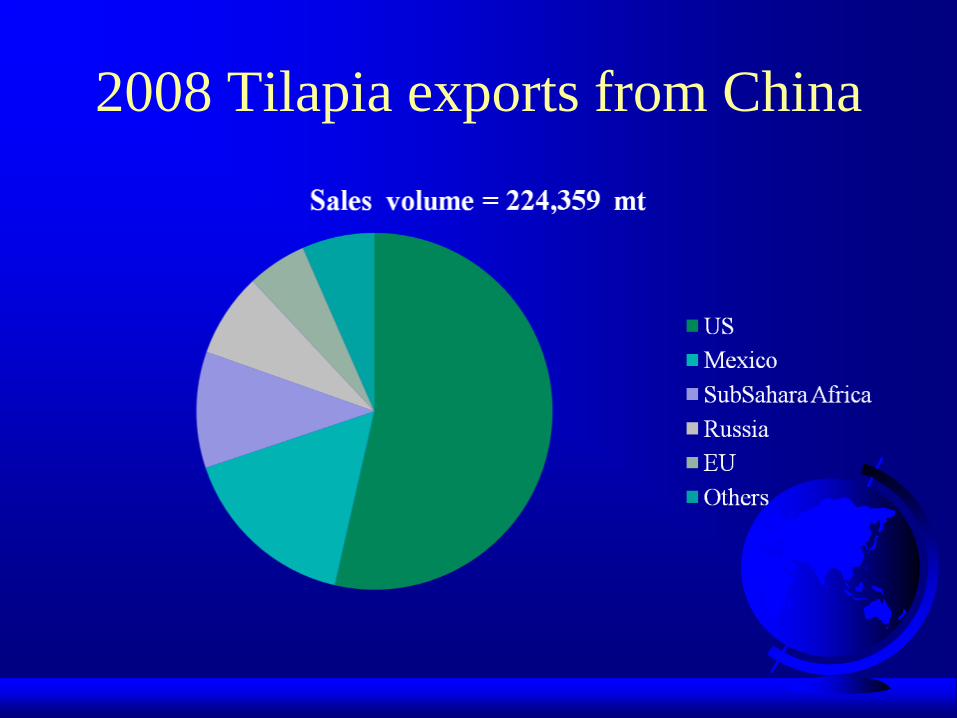
2008 Tilapia exports from China
0
500,000
1,000,000
1,500,000
2,000,000
2,500,000
3,000,000
3,500,0001
98
4
19
86
19
88
19
90
19
92
19
94
19
96
19
98
20
00
20
02
20
04
20
06
20
08
20
10
(est)
Me
tric
to
ns
Aquaculture Fishery
Global production of tilapia
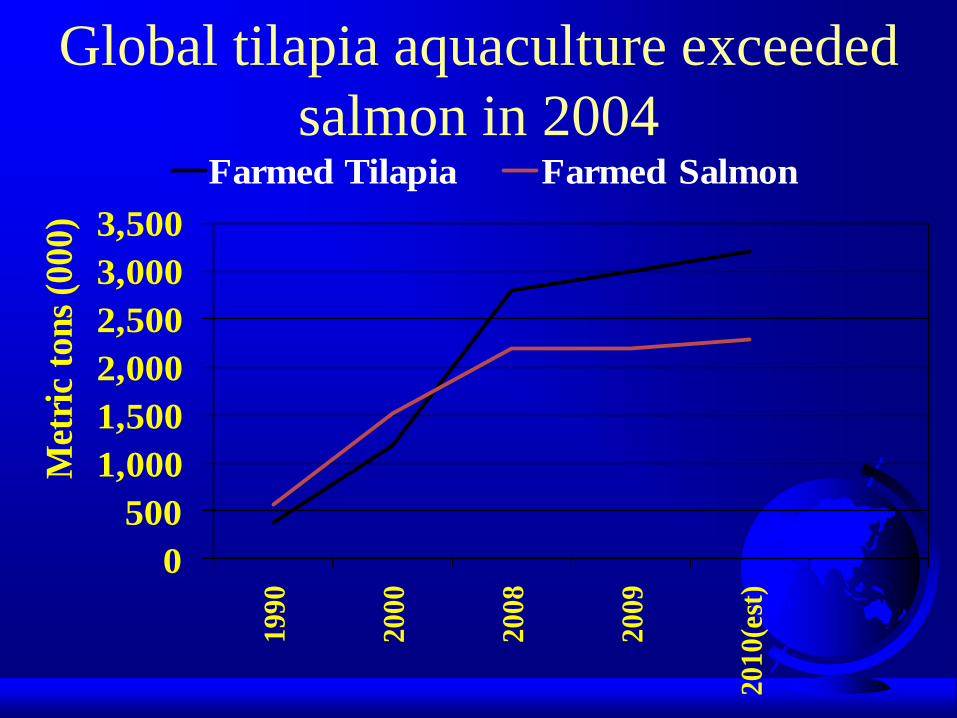
Global tilapia aquaculture exceeded
salmon in 2004
0
500
1,000
1,500
2,000
2,500
3,000
3,500
19
90
20
00
20
08
20
09
20
10
(est
)
Met
ric
ton
s (0
00
)
Farmed Tilapia Farmed Salmon
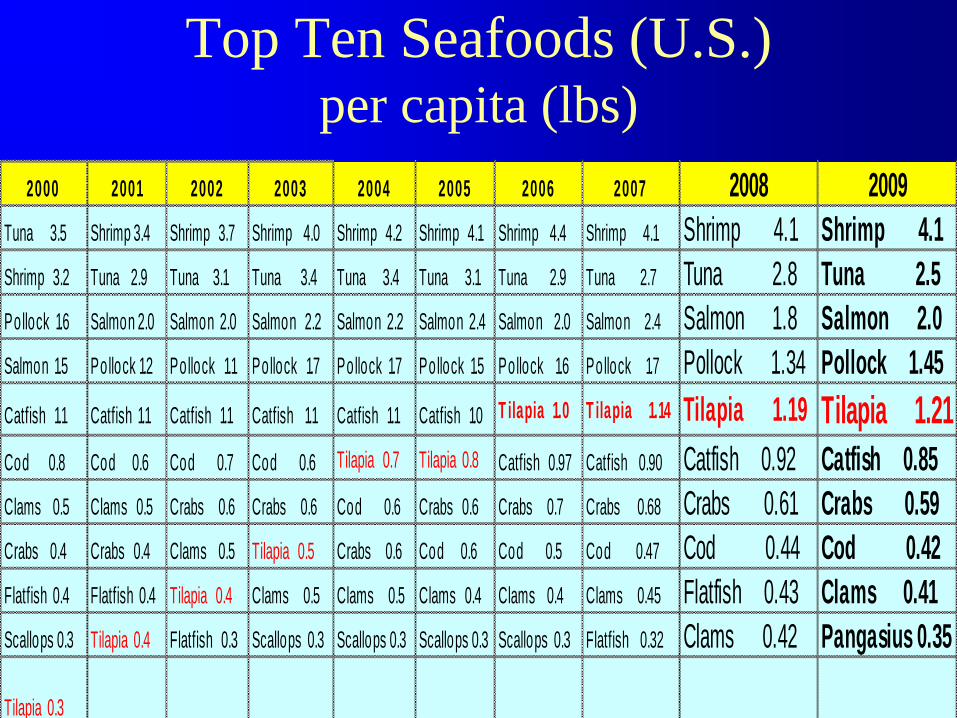
Top Ten Seafoods (U.S.) per capita (lbs)
2000 2001 2002 2003 2004 2005 2006 2007 2008 2009
Tuna 3.5 Shrimp 3.4 Shrimp 3.7 Shrimp 4.0 Shrimp 4.2 Shrimp 4.1 Shrimp 4.4 Shrimp 4.1 Shrimp 4.1 Shrimp 4.1
Shrimp 3.2 Tuna 2.9 Tuna 3.1 Tuna 3.4 Tuna 3.4 Tuna 3.1 Tuna 2.9 Tuna 2.7 Tuna 2.8 Tuna 2.5
Pollock 1.6 Salmon 2.0 Salmon 2.0 Salmon 2.2 Salmon 2.2 Salmon 2.4 Salmon 2.0 Salmon 2.4 Salmon 1.8 Salmon 2.0
Salmon 1.5 Pollock 1.2 Pollock 1.1 Pollock 1.7 Pollock 1.7 Pollock 1.5 Pollock 1.6 Pollock 1.7 Pollock 1.34 Pollock 1.45
Catfish 1.1 Catfish 1.1 Catfish 1.1 Catfish 1.1 Catfish 1.1 Catfish 1.0 T ilapia 1.0 T ilapia 1.14 Tilapia 1.19 Tilapia 1.21
Cod 0.8 Cod 0.6 Cod 0.7 Cod 0.6 Tilapia 0.7 Tilapia 0.8 Catfish 0.97 Catfish 0.90 Catfish 0.92 Catfish 0.85
Clams 0.5 Clams 0.5 Crabs 0.6 Crabs 0.6 Cod 0.6 Crabs 0.6 Crabs 0.7 Crabs 0.68 Crabs 0.61 Crabs 0.59
Crabs 0.4 Crabs 0.4 Clams 0.5 Tilapia 0.5 Crabs 0.6 Cod 0.6 Cod 0.5 Cod 0.47 Cod 0.44 Cod 0.42
Flatfish 0.4 Flatfish 0.4 Tilapia 0.4 Clams 0.5 Clams 0.5 Clams 0.4 Clams 0.4 Clams 0.45 Flatfish 0.43 Clams 0.41
Scallops 0.3 Tilapia 0.4 Flatfish 0.3 Scallops 0.3 Scallops 0.3 Scallops 0.3 Scallops 0.3 Flatfish 0.32 Clams 0.42 Pangasius 0.35
Tilapia 0.3

Tilapia widely recognized as a
healthy food item
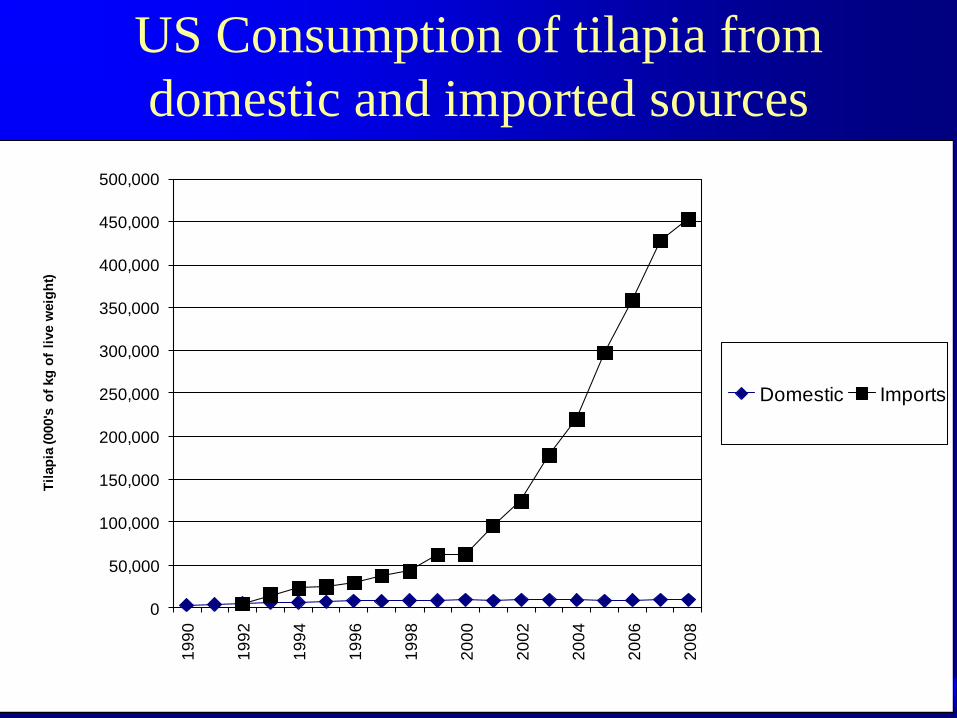
US Consumption of tilapia from
domestic and imported sources
0
50,000
100,000
150,000
200,000
250,000
300,000
350,000
400,000
450,000
500,0001
99
0
19
92
19
94
19
96
19
98
20
00
20
02
20
04
20
06
20
08
Til
ap
ia (000's
of
kg
of
live w
eig
ht)
Domestic Imports
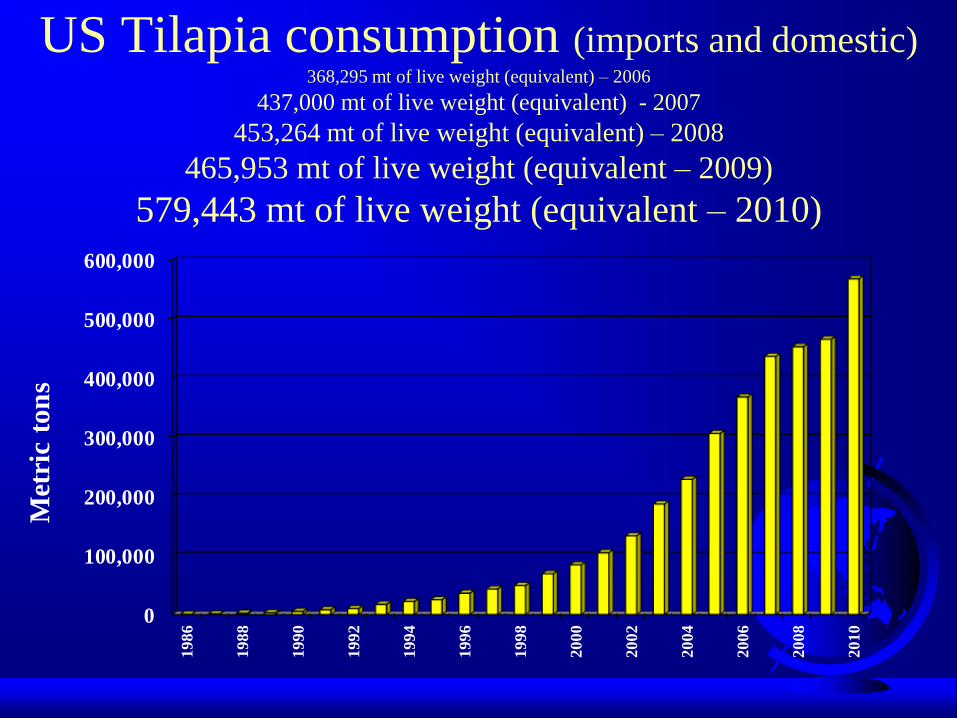
US Tilapia consumption (imports and domestic) 368,295 mt of live weight (equivalent) – 2006
437,000 mt of live weight (equivalent) - 2007
453,264 mt of live weight (equivalent) – 2008
465,953 mt of live weight (equivalent – 2009)
579,443 mt of live weight (equivalent – 2010)
0
100,000
200,000
300,000
400,000
500,000
600,000
19
86
19
88
19
90
19
92
19
94
19
96
19
98
20
00
20
02
20
04
20
06
20
08
20
10
Met
ric
ton
s
Fillet FreshFillet Frozen
Whole Frozen
$0
$20,000,000
$40,000,000
$60,000,000
$80,000,000
$100,000,000
$120,000,000
$140,000,000
$160,000,000
$180,000,000
$200,000,000
1993 1994 1995 1996 1997 1998 1999 2000 2001 2002
$ U
S
Value of Tilapia product forms imported to the U.S.2002
Whole Frozen
Fillet Frozen
Fillet Fresh
$0
$100,000,000
$200,000,000
$300,000,000
$400,000,000
$500,000,000
$600,000,000
$700,000,000
$800,000,000
$900,000,0001992
1993
1994
1995
1996
1997
1998
1999
2000
2001
2002
2003
2004
2005
2006
2007
2008
2009
2010
$ U
S
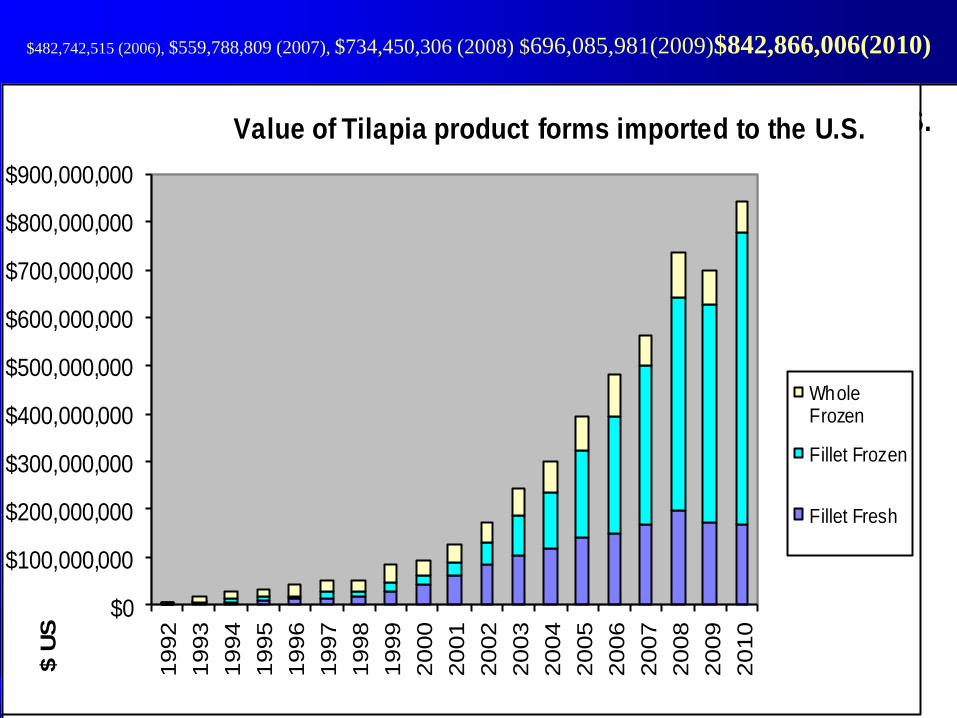
Value of Tilapia product forms imported to the U.S.
WholeFrozen
Fillet Frozen
Fillet Fresh
$482,742,515 (2006), $559,788,809 (2007), $734,450,306 (2008) $696,085,981(2009)$842,866,006(2010)
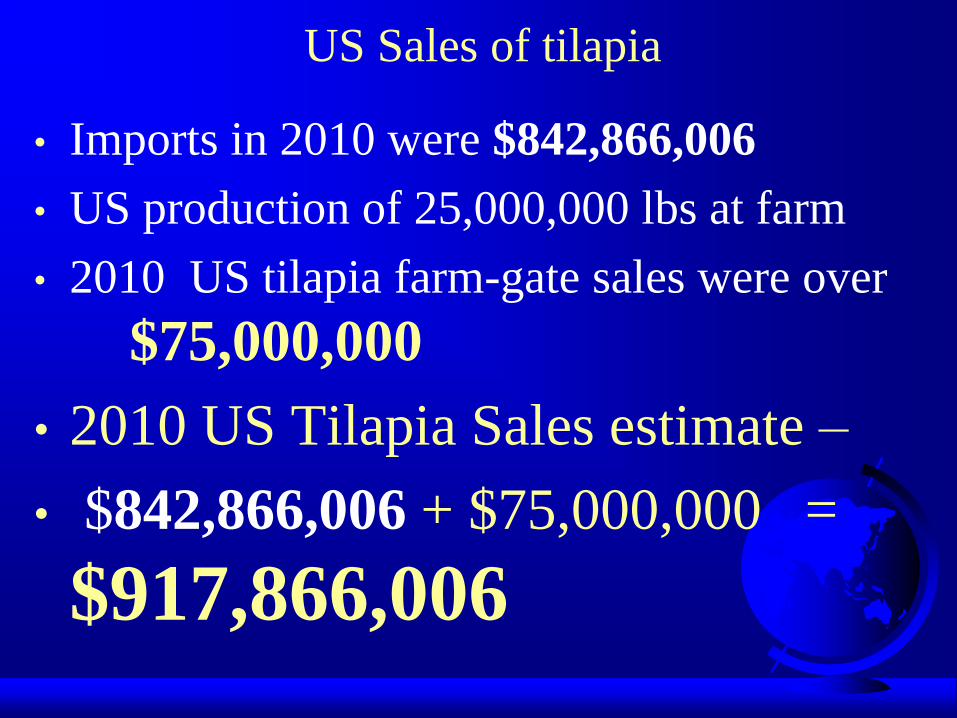
• Imports in 2010 were $842,866,006
• US production of 25,000,000 lbs at farm
• 2010 US tilapia farm-gate sales were over
$75,000,000
• 2010 US Tilapia Sales estimate –
• $842,866,006 + $75,000,000 =
$917,866,006
US Sales of tilapia
Selective breeding and genetic
improvements • Excellent breeding programs
- G.I.F.T. - Malaysia
- Genomar - Brazil and Norway
- Chitralada – Thailand
- TabTim – Thailand (CP Group)
- GIFT Excell – Philippines
- Molobicus - Philippines
- GIFT Bangladesh
• YY Supermale - Philippines and Swansea,
Egypt and Indonesia
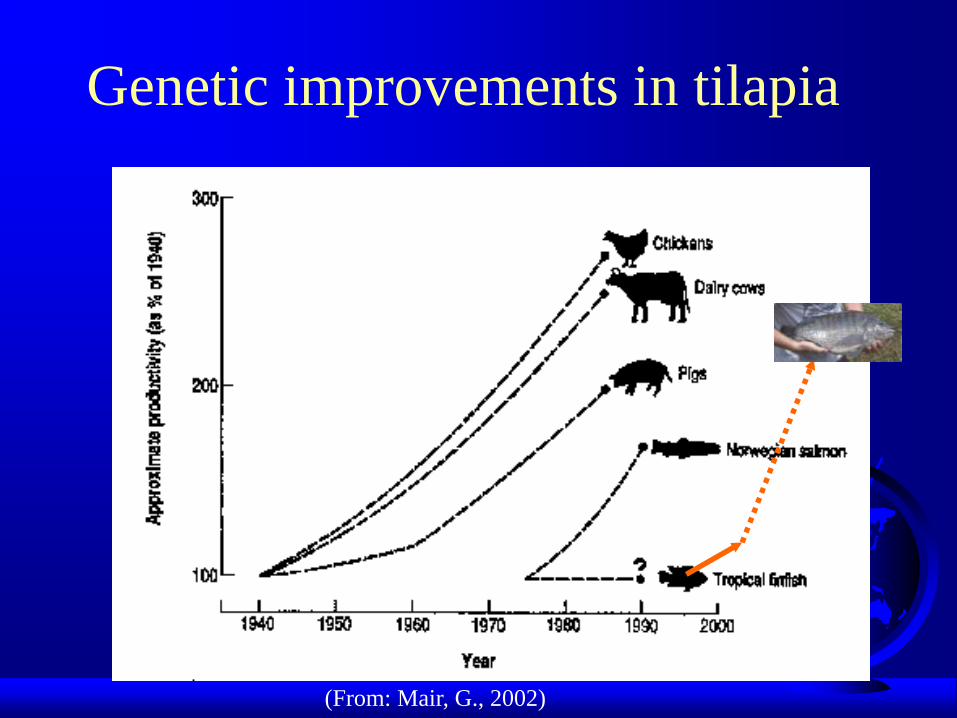
Genetic improvements in tilapia
(From: Mair, G., 2002)

Tilapia Genome Project
• March 2011 - First assembly of the tilapia genome
• Oreochromis niloticus – Nile Tilapia
• http://www.broadinstitute.org/ftp/pub/assemblies/fi
sh/tilapia/Orenil1/
• Matching many segments to those known from
other fish
• Publically available and freely accessible
• Next frontier of genetic program for tilapia
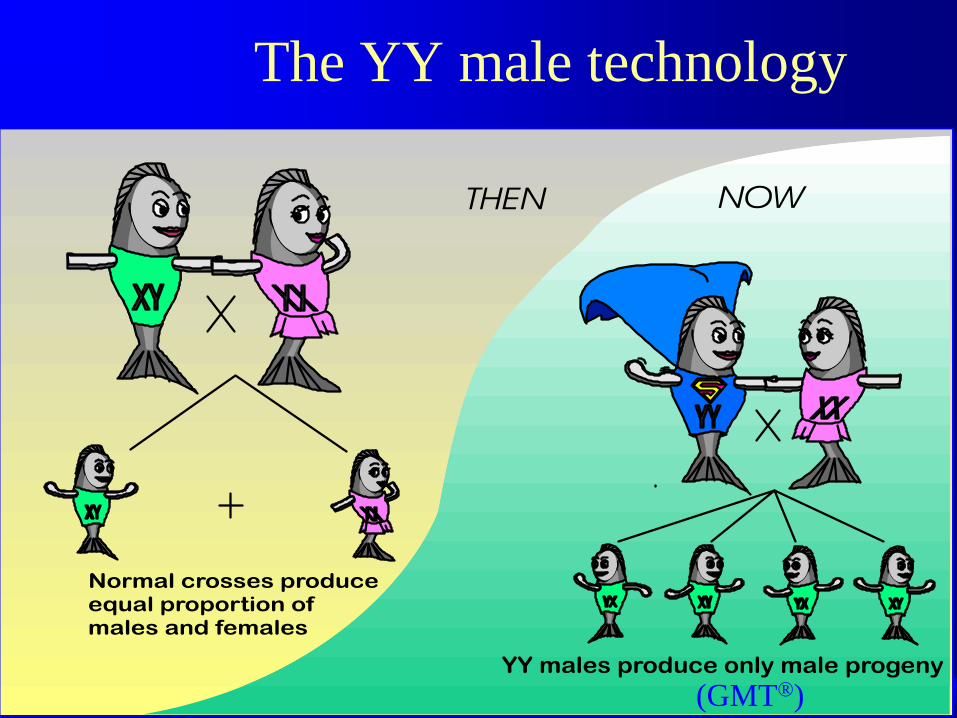
The YY male technology
(GMT®)
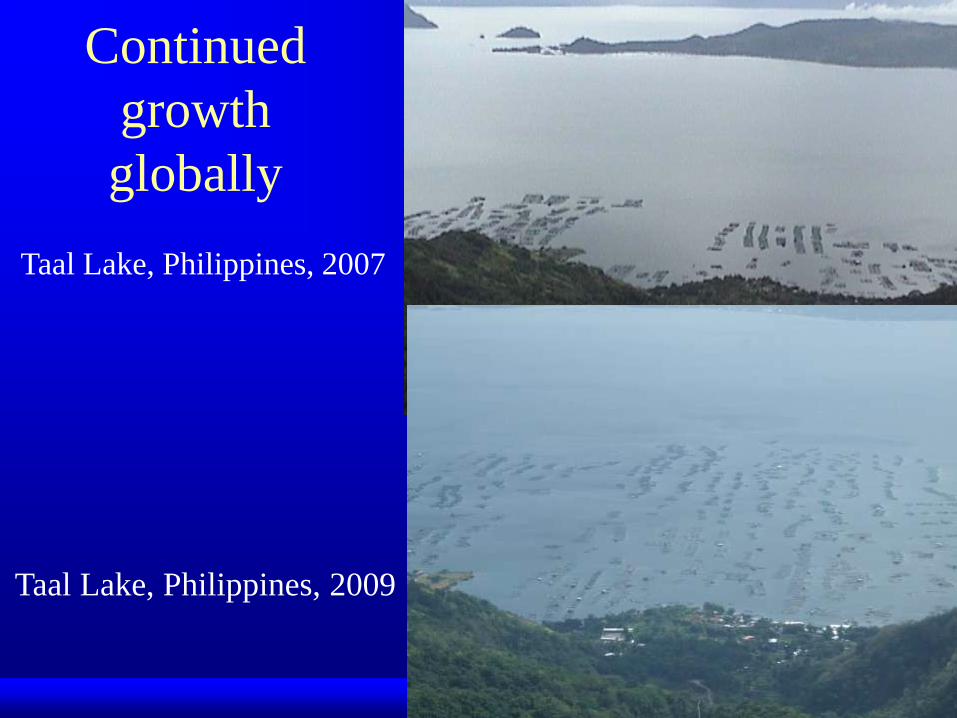
Continued
growth
globally
Taal Lake, Philippines, 2009
Taal Lake, Philippines, 2007
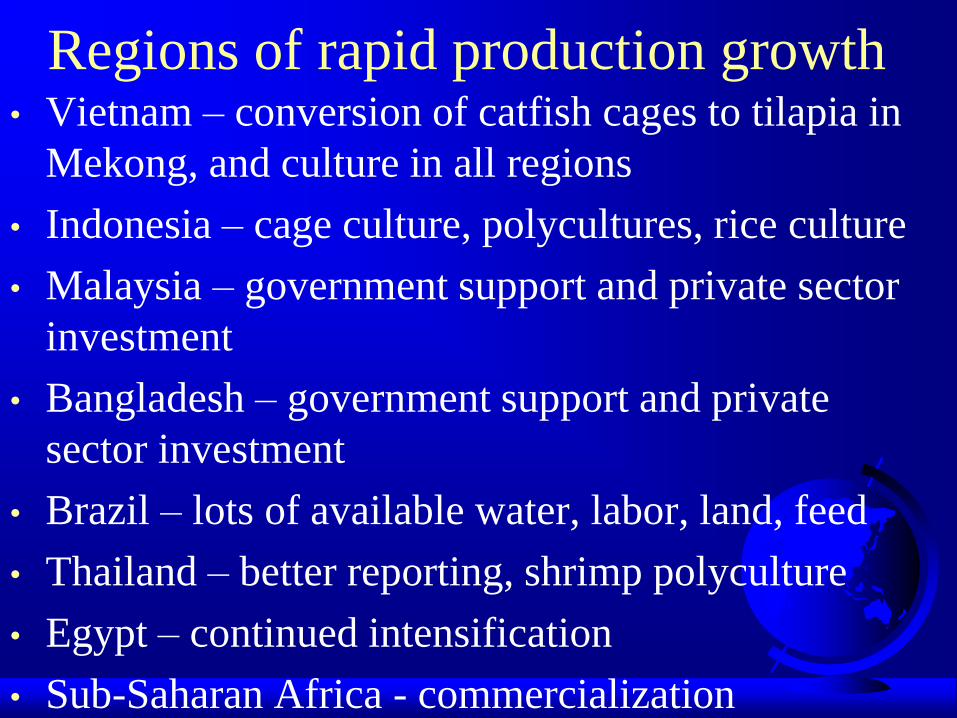
Regions of rapid production growth • Vietnam – conversion of catfish cages to tilapia in
Mekong, and culture in all regions
• Indonesia – cage culture, polycultures, rice culture
• Malaysia – government support and private sector
investment
• Bangladesh – government support and private
sector investment
• Brazil – lots of available water, labor, land, feed
• Thailand – better reporting, shrimp polyculture
• Egypt – continued intensification
• Sub-Saharan Africa - commercialization
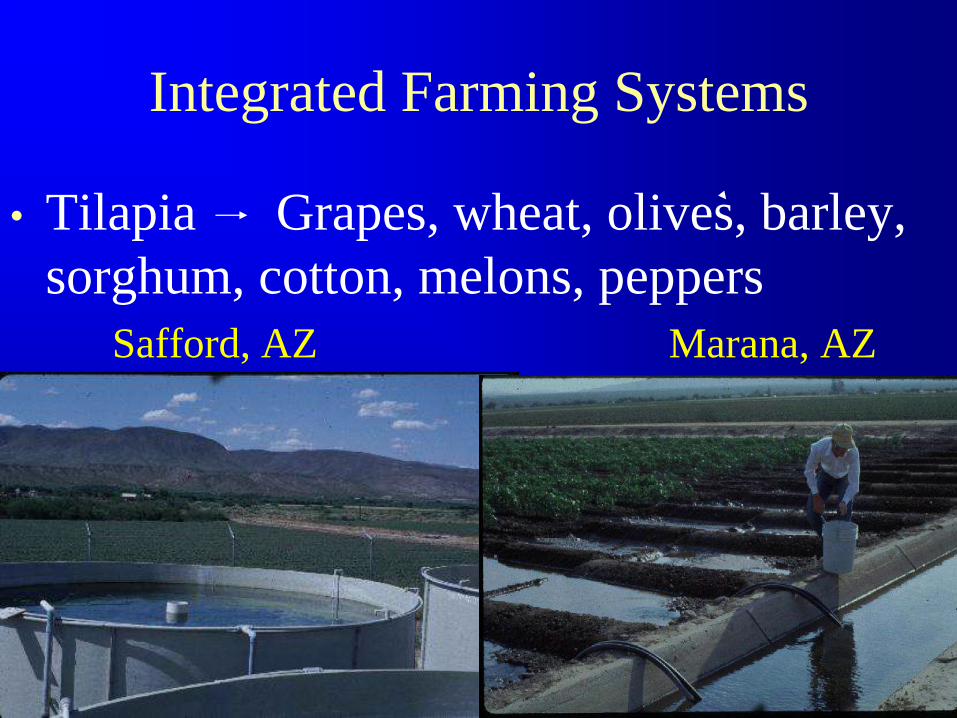
Integrated Farming Systems
• Tilapia Grapes, wheat, olives, barley,
sorghum, cotton, melons, peppers
Safford, AZ Marana, AZ
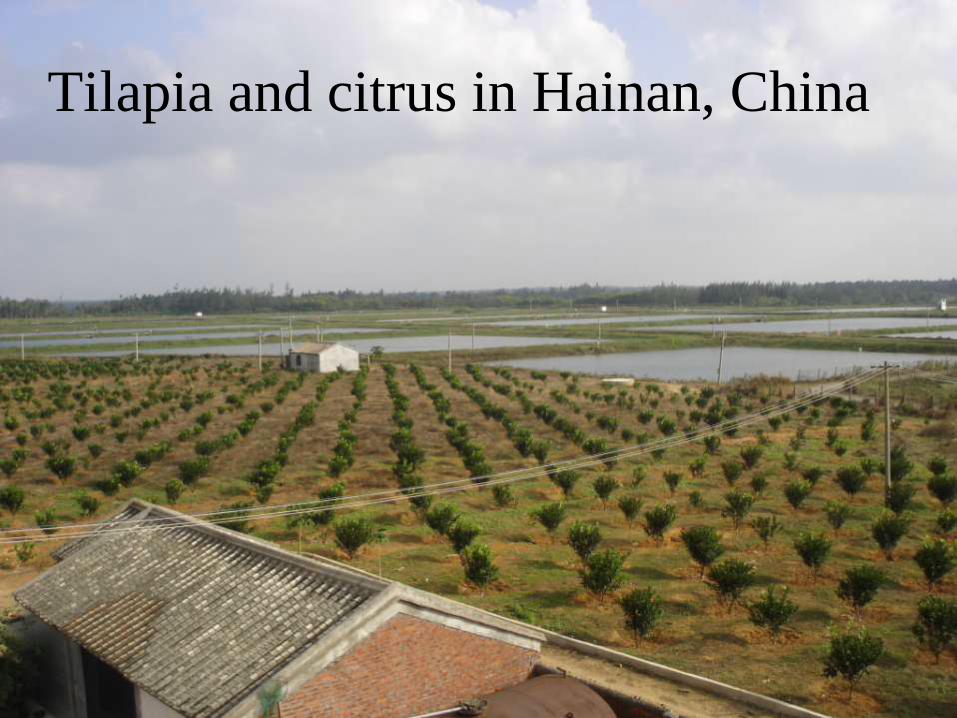
Tilapia and citrus in Hainan, China

Desert Springs Tilapia, Hyder AZ

Gila Farms, AZ
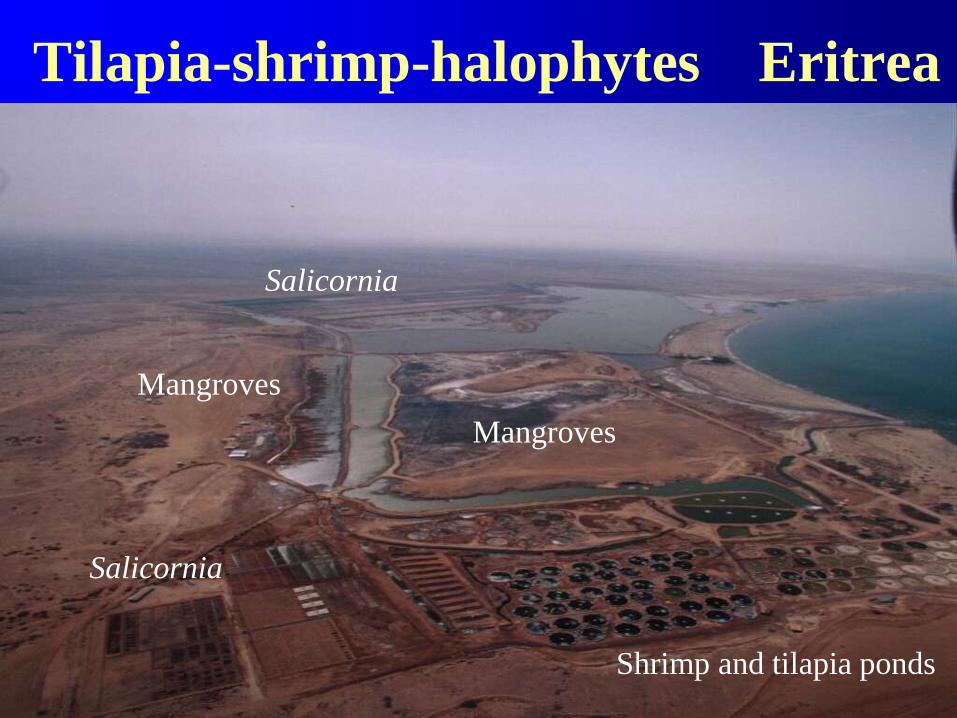
Tilapia-shrimp-halophytes Eritrea
Shrimp and tilapia ponds
Mangroves
Salicornia
Salicornia
Mangroves
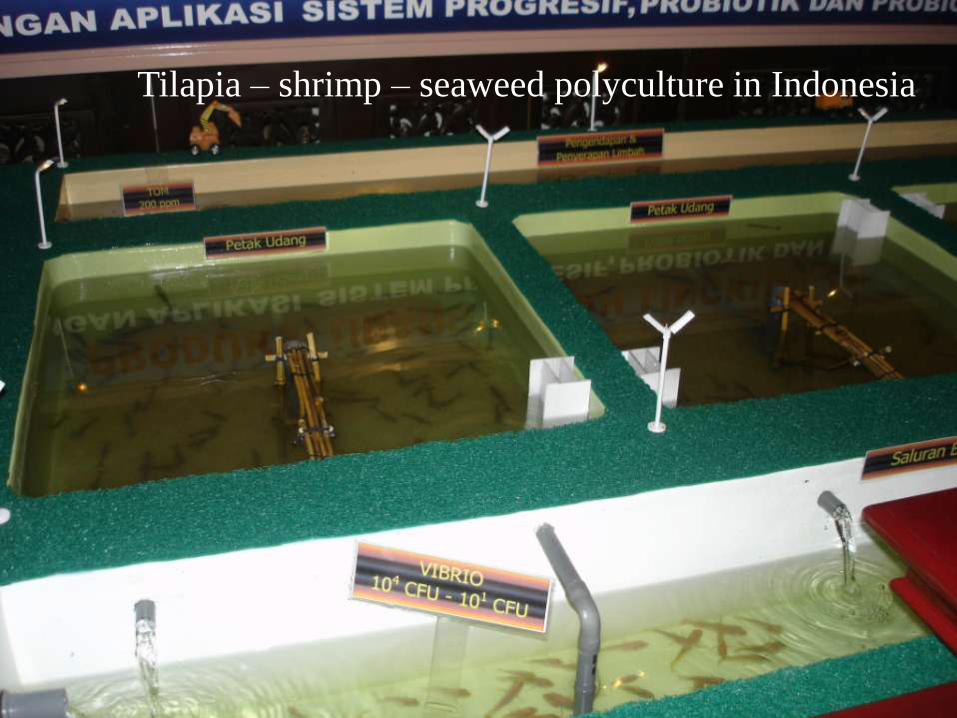
n Tilapia – shrimp – seaweed polyculture in Indonesia
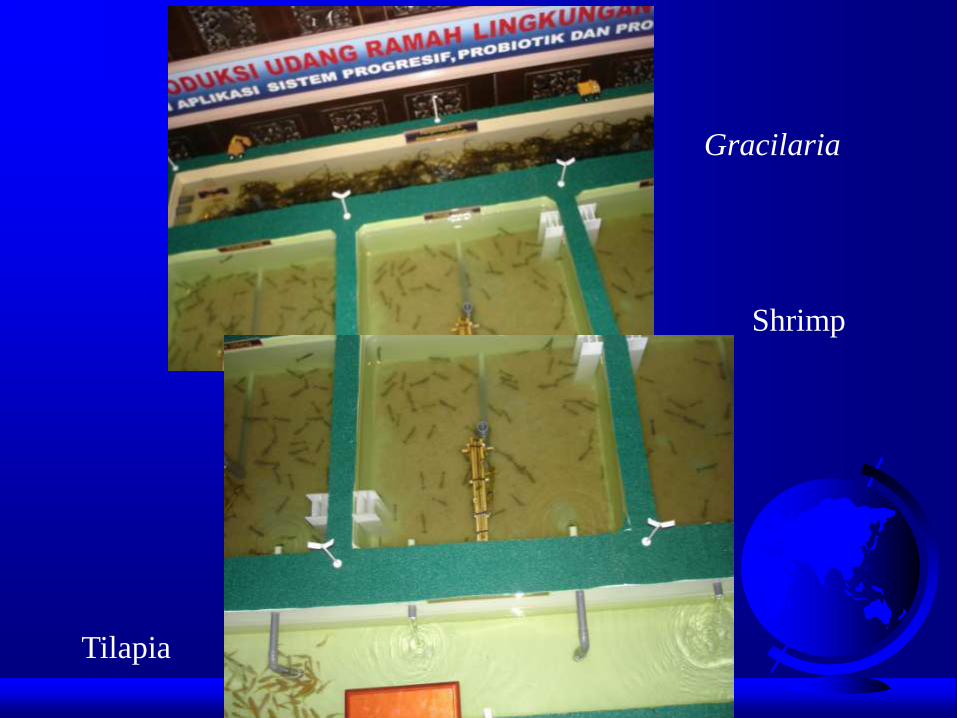
Gracilaria
Shrimp
Tilapia
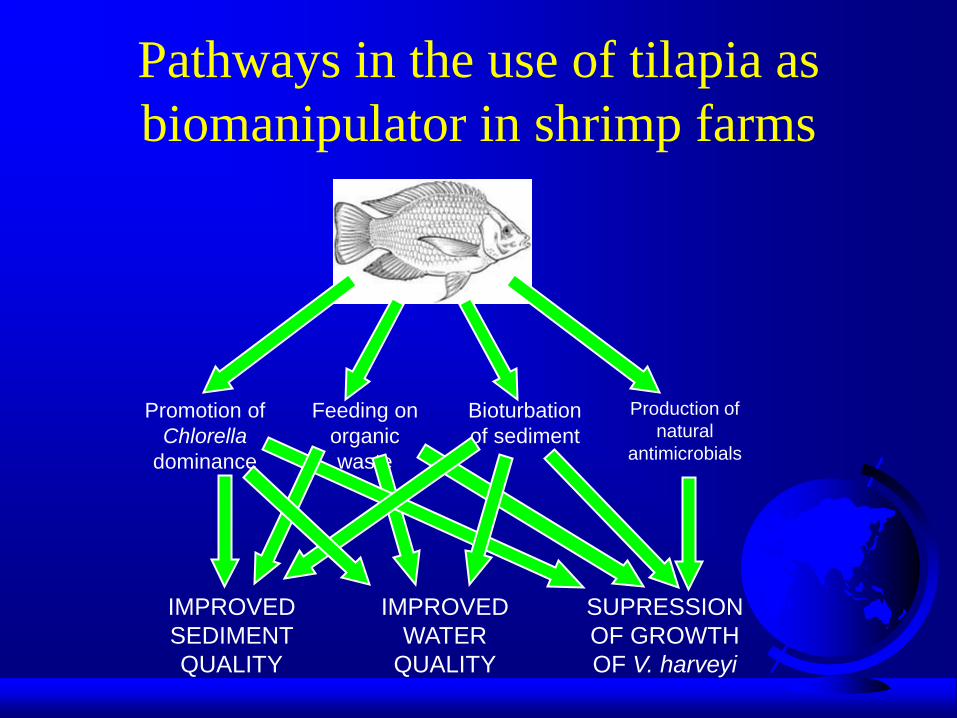
Pathways in the use of tilapia as
biomanipulator in shrimp farms
Promotion of
Chlorella
dominance
Feeding on
organic
waste
Bioturbation
of sediment
Production of
natural
antimicrobials
IMPROVED
SEDIMENT
QUALITY
IMPROVED
WATER
QUALITY
SUPRESSION
OF GROWTH
OF V. harveyi
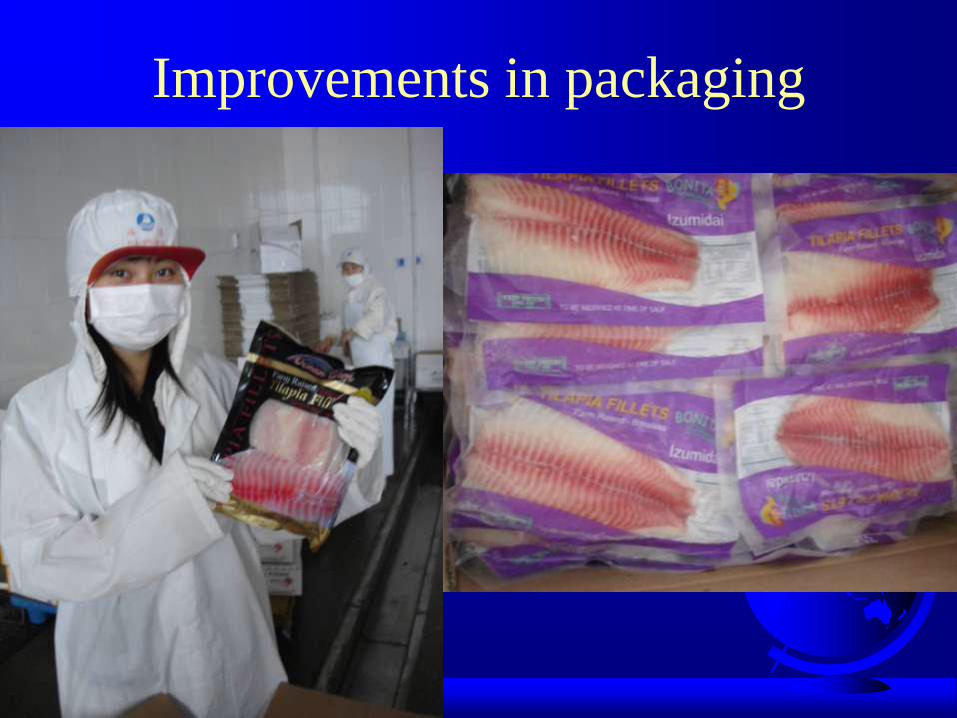
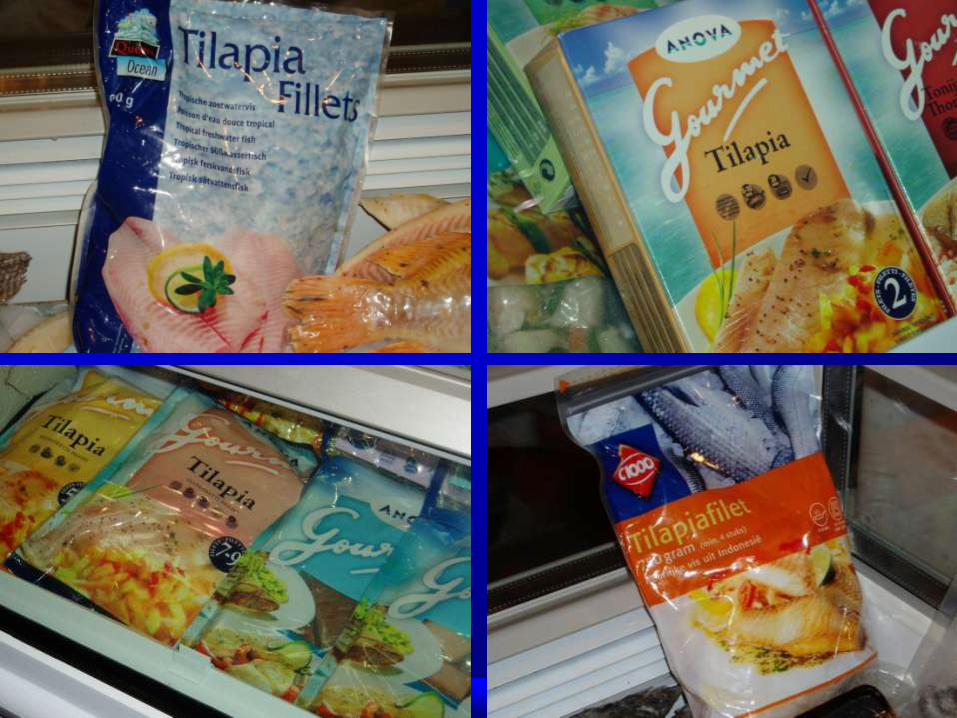
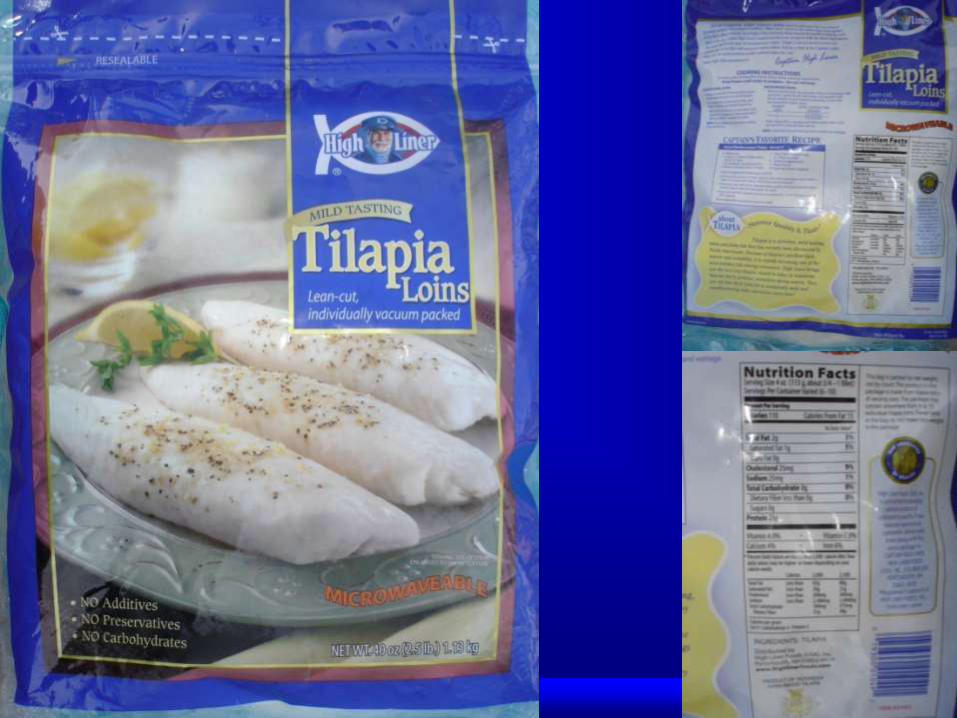
Improvements in packaging
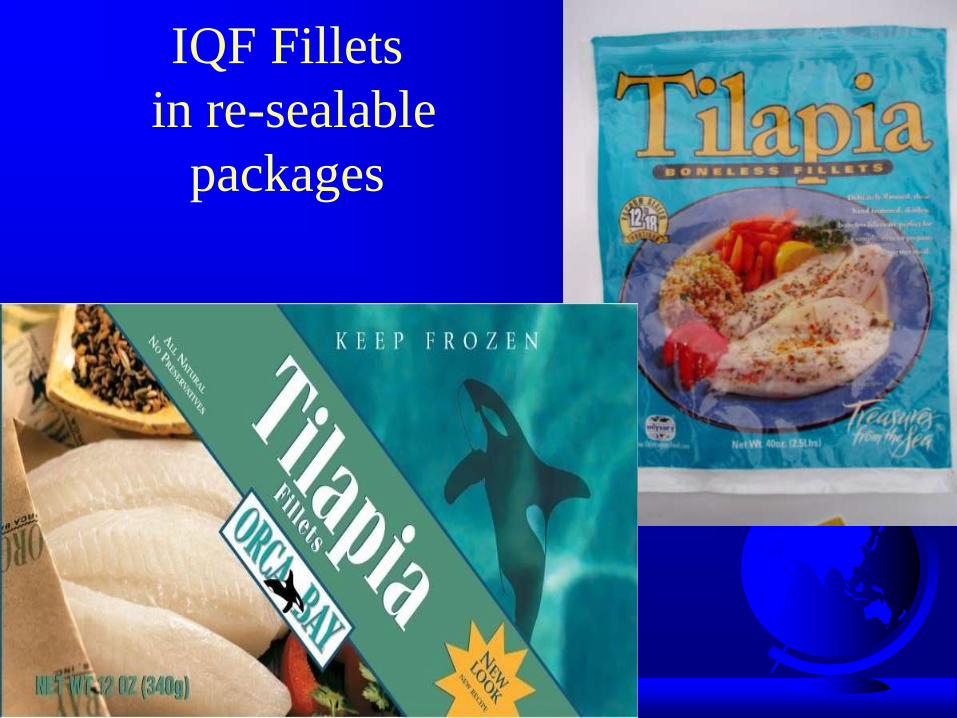
IQF Fillets
in re-sealable
packages
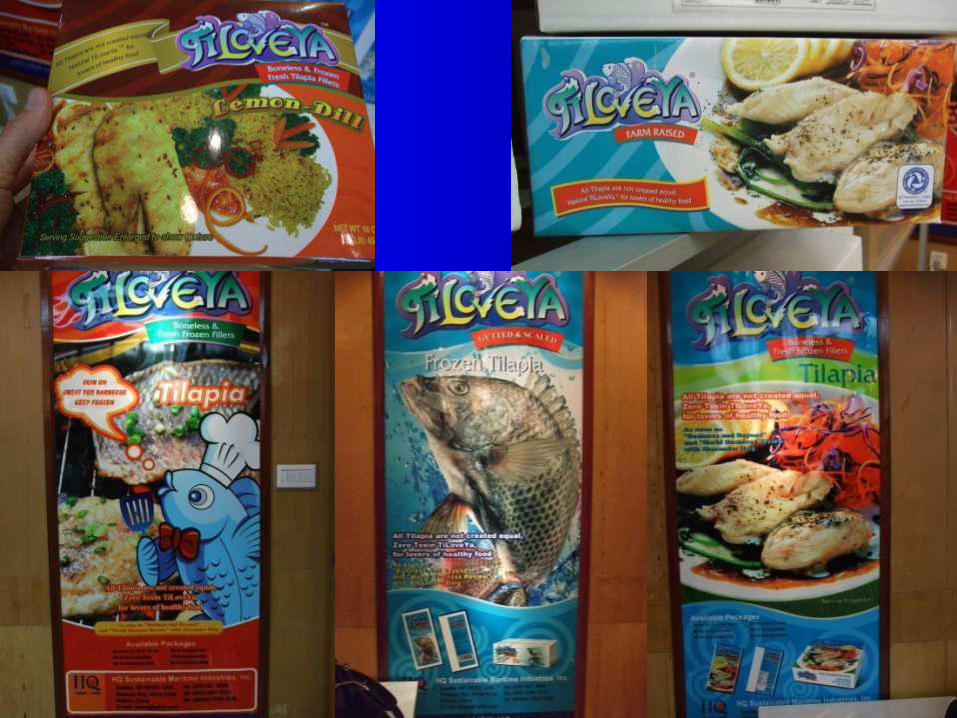

Value added meals
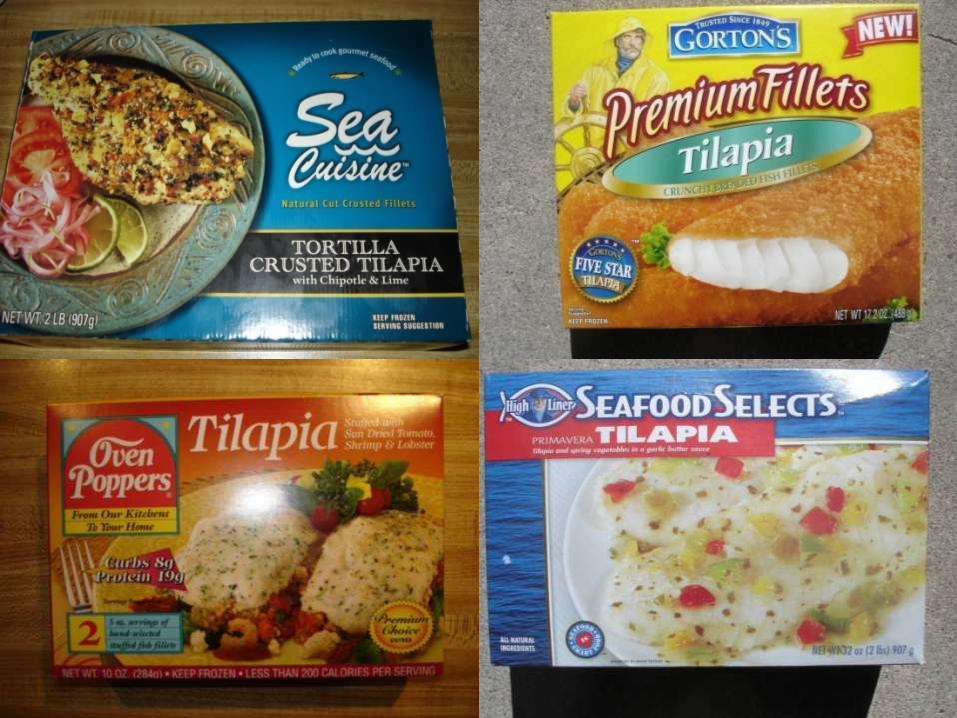
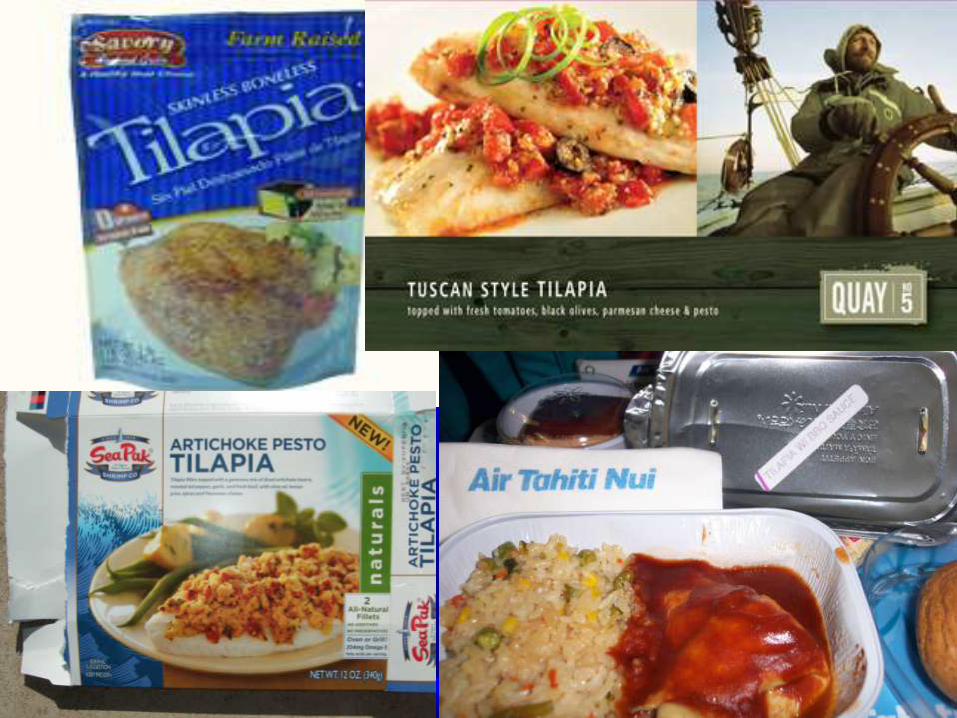


New product
forms
Smoked tilapia
Sashimi grade
tilapia

Tilapia and food
service
• On almost all cruise
ships
• Starting to appear on
airlines
• Increasingly with
schools, hospitals and
prisons
• Several prisons have
their own tilapia farms
Courtesy: Eric Roderick
American Airlines 14 Jan 2011- Chicago - Delhi

Tilapia in
Long John
Silver’s
McDonald’s
and other
fastfoods could
double tilapia
global demand

Byproducts - Tilapia Leather

Health and
Beauty
Products
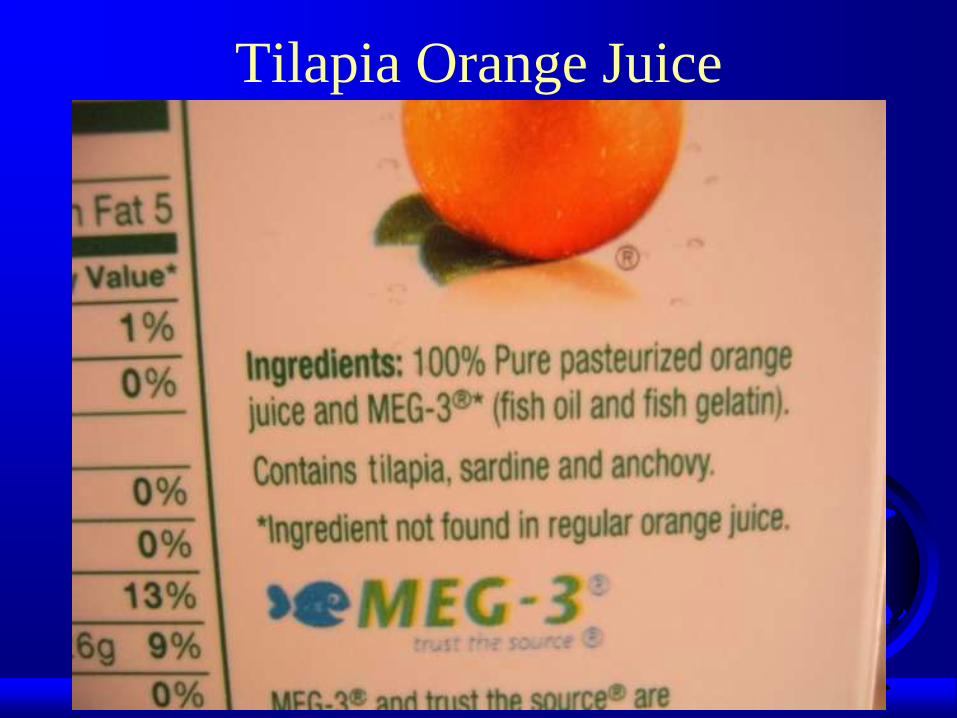
Tilapia Orange Juice
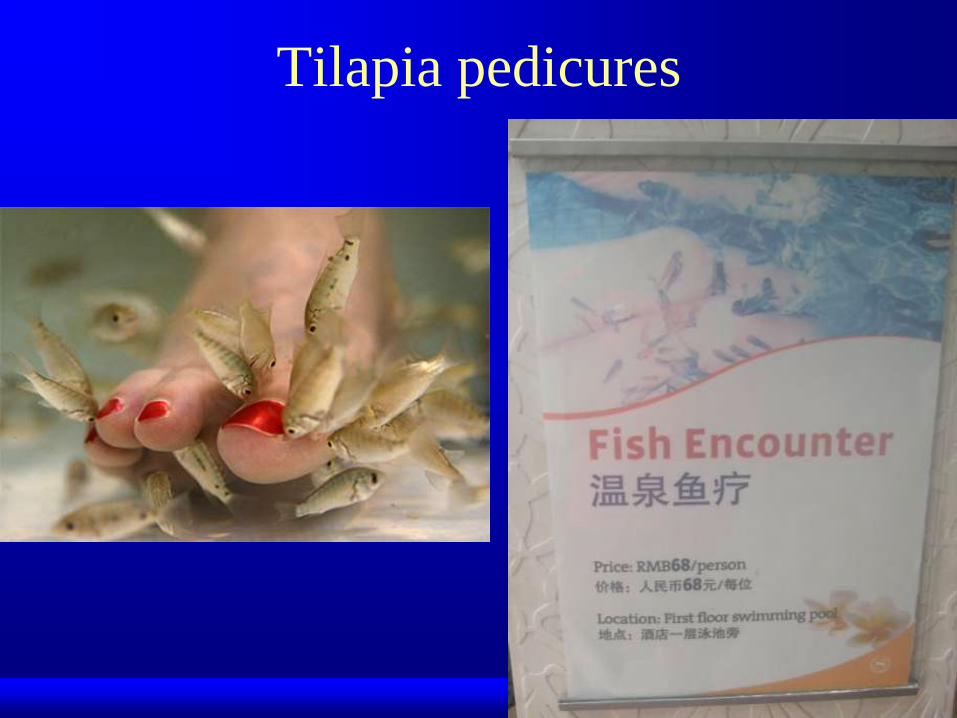
Tilapia pedicures
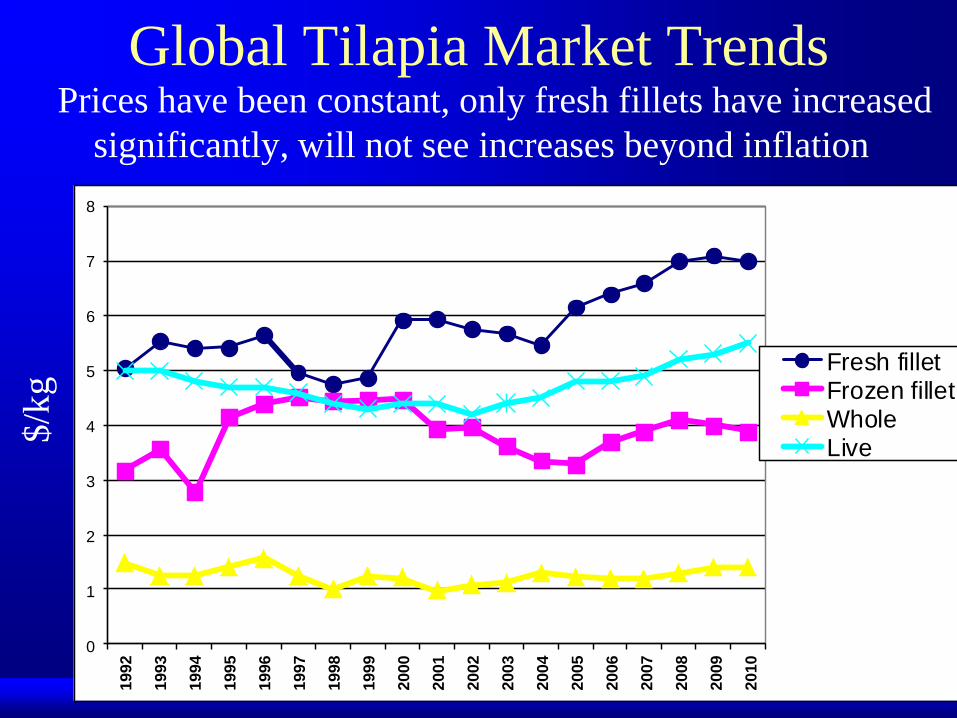
Global Tilapia Market Trends Prices have been constant, only fresh fillets have increased
significantly, will not see increases beyond inflation
0
1
2
3
4
5
6
7
8
1992
1993
1994
1995
1996
1997
1998
1999
2000
2001
2002
2003
2004
2005
2006
2007
2008
2009
2010
Fresh filletFrozen filletWholeLive
$/k
g
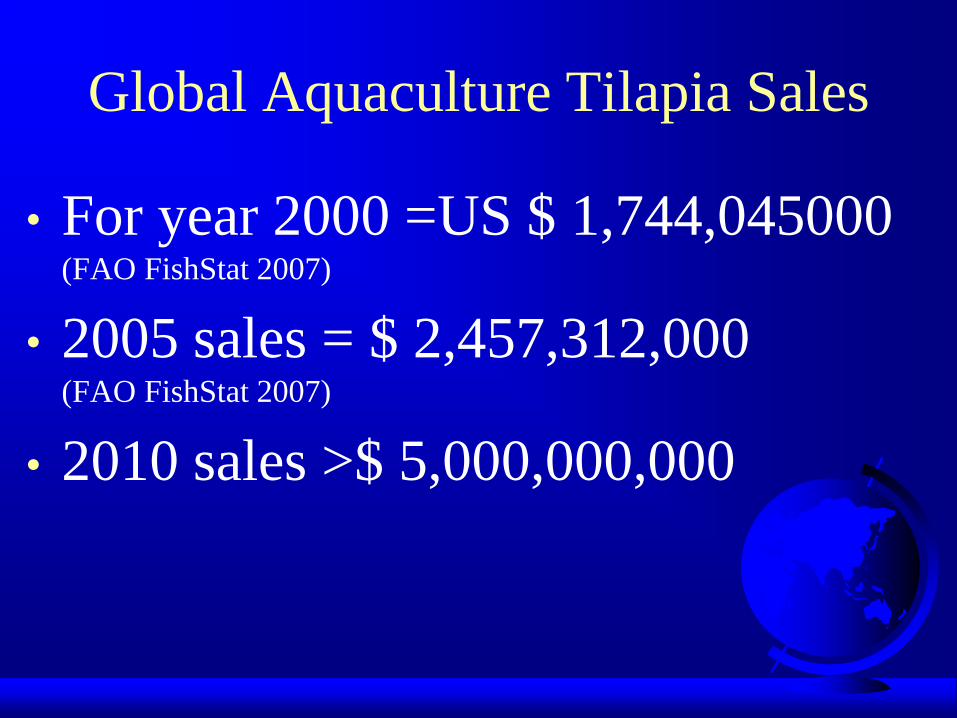
Global Aquaculture Tilapia Sales
• For year 2000 =US $ 1,744,045000 (FAO FishStat 2007)
• 2005 sales = $ 2,457,312,000 (FAO FishStat 2007)
• 2010 sales >$ 5,000,000,000
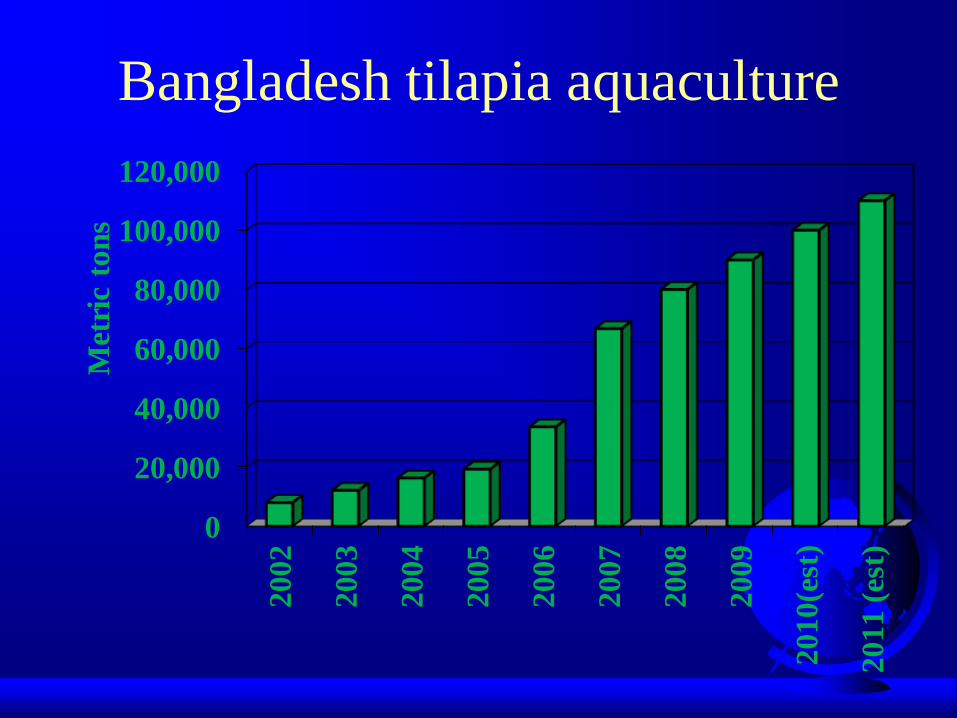
Bangladesh tilapia aquaculture
0
20,000
40,000
60,000
80,000
100,000
120,000
2002
2003
2004
2005
2006
2007
2008
2009
201
0(e
st)
201
1 (
est)
Met
ric
ton
s
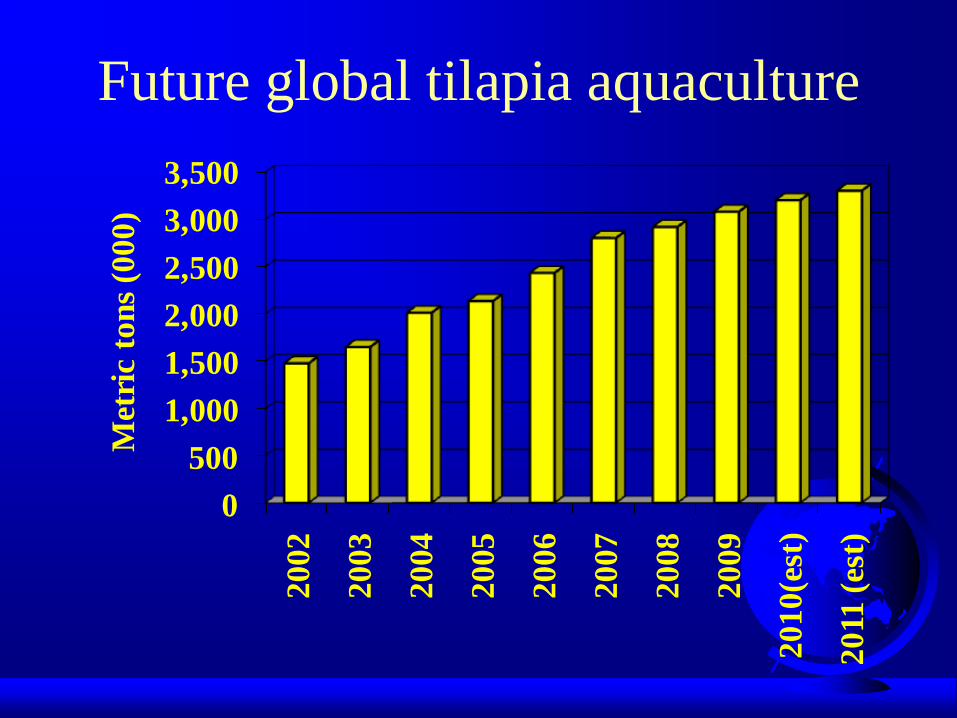
Future global tilapia aquaculture
0
500
1,000
1,500
2,000
2,500
3,000
3,500
2002
2003
2004
2005
2006
2007
2008
2009
201
0(e
st)
2011
(es
t)
Met
ric
ton
s (0
00
)
Conclusions • Global tilapia production exceeded
3,200,000 metric tons in 2010.
• Constantly improving farming, processing
and packaging for food safety, quality
assurance, traceability, and environmental
safeguards (with little, if any, increase in
price).
• Other aquaculture species will follow the
tilapia model.
Conclusions
• Tilapia has long been
called the aquatic
chicken.
• Instead…...
• The
“terrestrial
tilapia”

Tilapia: the most fun aquaculture
species of the 21st century
http://www.youtube.com/
watch?v=Bh2673ncWJg

Buy TILAPIA
Thank you!
Questions?