Embed Size (px)
Citation preview
Paper for presentation at the 2012 Regional Studies Association European Conference, Delft 1
1
1
Why space matters in technological innovation 2
systems – The global knowledge dynamics of 3
membrane bioreactor technology 4
5
Christian Binza, Bernhard Trufferb and Lars Coenenc 6
7 a Corresponding author. Eawag, Swiss Federal Institute of Aquatic Science and Technology, Überlandstrasse 133, 8600 8 Dübendorf, Switzerland. [email protected]. Tel: +41 (0)44 823 5674 9 10 b Eawag, Swiss Federal Institute of Aquatic Science and Technology, Überlandstrasse 133, 8600 Dübendorf, Switzerland. 11 [email protected] 12 c Circle, University of Lund, Sweden
13
14
15
DRAFT VERSION – DO NOT CITE WITHOUT PERMISSION BY THE AUTHORS 16
17
18
Keywords: technological innovation system, networked space, globalization, social 19
network analysis, membrane bioreactor 20
21
Abstract 22
Studies on technological innovation systems (TIS) set the spatial analytical boundary at a 23
national level and treat supranational spatial levels as a geographic homogeneous and freely 24
accessible global technological opportunity set. In this article we criticize this simplistic 25
conceptualization of space and propose to understand relevant actors and processes in TIS 26
from a relational, networked perspective. An analytical framework is developed which allows 27
analyzing the spatial setup of a TIS through its knowledge creating network. Based on social 28
network analysis and a co-publication dataset from membrane bioreactor technology, we 29
illustrate that the spatial configuration of the knowledge creation function varies greatly over 30
short periods of time. This finding suggests that the delimitation of TIS and related policy 31
advice should be much more responsive to the geographic setup of TIS. 32
33
Paper for presentation at the 2012 Regional Studies Association European Conference, Delft 2
2
1. Introduction 34
Global environmental problems urgently ask for an implementation of radical innovations in 35
infrastructure sectors to secure long-term sustainability. Innovation studies have therefore 36
recently developed concepts and theories on how environmental technologies might emerge 37
and replace established and locked-in sectors (Kemp et al., 1998; Markard and Truffer, 38
2008b). The narrow spatial focus of this literature on industrialized countries and processes at 39
a national scale is however increasingly criticized (Berkhout et al., 2009; Coenen et al., 40
accepted). Continuing globalization and the fast rise of environmental industries in emerging 41
economies adds considerable complexity to the analysis of relevant innovation processes. It is 42
now argued that newly industrializing countries could leapfrog over polluting technologies 43
and directly become key actors in the development and diffusion of environmental 44
technologies (Angel and Rock, 2009; Berkhout et al., 2009; Binz et al., 2012). It thus becomes 45
increasingly important for innovation scholars and policy makers to know how innovative 46
activity in environmental technologies is organized globally and how innovation processes 47
work at and between increasingly interrelated spatial scales. 48
49
The technological innovation system (TIS) concept in principle allows for such an 50
international analysis. Conceptualizing innovation systems without a territorial preconception 51
can be seen as a distinctive feature of the TIS concept. In contrast to other innovation system 52
approaches that set a priori spatial boundaries, e.g. at the national (Lundvall, 1988) or regional 53
(Cooke et al., 1997) scale, it proposes to analyze emerging environmental innovation as a 54
system of actors, networks and institutions that contribute to innovation processes in a 55
specific technological field (Carlsson and Stankiewicz, 1991). By taking a specific technology 56
as a starting point, TIS proponents argue that the approach cuts through both geographical and 57
sectoral dimensions (Hekkert et al., 2007). In contrast to this vantage point, one can observe 58
that contemporary TIS research nonetheless delineates its empirical studies on the basis of 59
territorial (often national) boundaries. Moreover, international interaction is often 60
conceptualized as actors interfering with a geographically neutral and ubiquitously accessible 61
"global technological opportunity set" (Carlsson et al., 2002). This simplistic 62
conceptualization of space has recently been criticized by economic geographers. Coenen et al. 63
(accepted) propose a more careful treatment of space in TIS studies which is pronouncedly 64
relational and multi-scalar, avoiding a priori set scalar boundaries and hierarchies. In the 65
meantime, TIS proponents have started to acknowledge the need to better understand the 66
Paper for presentation at the 2012 Regional Studies Association European Conference, Delft 3
3
relationships between technological and other types of innovation systems (regional, national) 67
to avoid a reified, decontextualized treatment of technological innovation systems (Jacobsson 68
and Bergek, 2011). 69
70
In applying a relational conceptualization of space the paper aims to derive and test an 71
analytical framework for TIS that is explicitly spatial but at the same time avoids a territorial 72
lock-in. Instead of delimiting a TIS space a priori we propose to start from a networked 73
perspective and to use the relational properties of the TIS actors to identify relevant spaces in 74
different evolution phases of a TIS. This frame will be exemplified by analyzing the spatial 75
setup and identifying hubs of dense interaction in the knowledge creation function of the 76
membrane bioreactor (MBR) TIS. Following the critique of Coenen et al. (accepted) we 77
propose to "follow the network to wherever it leads, instead of setting system boundaries in an 78
arbitrary and closed-off way". By doing so we aim at providing answers to the following 79
research questions: What are the implications of the currently a-spatial practice in identifying 80
the system boundaries in TIS studies? How can meaningful linkages and relationships among 81
spatially separated TISs be analyzed empirically? 82
83
These questions will be addressed in the following structure: In the next section, we will first 84
discuss the problems of mono-scalar TIS research and show the potential benefits of a 85
relational geographic perspective in more detail. Sections 3 introduces social network analysis 86
as a tool for spatial TIS analysis and develops and operationalizes a set of respective 87
indicators. Section 4 and 5 introduce the used co-publication dataset and apply our framework 88
to knowledge creation in the TIS of MBR technology. Our results suggest that knowledge 89
creation in MBR technology evolved from a globalized nurturing, to a Europe-based 90
expansion and finally to a multi-scalar, Europe- and Asia based consolidation phase. We 91
conclude by discussing the implications of the observed high spatial-temporal dynamics in 92
our case study for future TIS studies, discuss policy implications and identify promising fields 93
of future research. 94
95
2. Conceptualizing space in TIS 96
The TIS concept emerged in the early nineties from a quickly expanding innovation system 97
literature, which is rooted in evolutionary economics and industrial dynamics (Freeman, 1987; 98
Paper for presentation at the 2012 Regional Studies Association European Conference, Delft 4
4
Lundvall, 1992; Nelson, 1993; Cooke et al., 1997; Malerba, 2002). Technological (innovation) 99
system are defined as a "network of agents interacting in a specific economic/industrial area 100
under a particular institutional infrastructure or set of infrastructures and involved in the 101
generation, diffusion, and utilization of technology” (Carlsson and Stankiewicz, 1991: 111). 102
TIS research conceptualizes the innovation process as an interactive, recursive process, 103
embedded in a set of co-evolving actors, networks and institutions. It pronouncedly rejects the 104
idea of linear innovation paths and emphasizes instead the importance of systemic interplay of 105
complementary actors, interactive and recursive improvement processes and the institutional 106
embeddedness of innovation (Carlsson and Stankiewicz, 1991; Bergek et al., 2008a). 107
2.1. The need for a space concept in TIS 108
The first contributions of TIS literature criticized the narrow spatial focus of the national 109
(Freeman, 1987) and regional (Cooke et al., 1997) innovation system concepts and proposed a 110
territorially unbound perspective focusing on technologies (Carlsson and Stankiewicz, 1991). 111
This basic idea was later developed and refined conceptually and empirically in different 112
studies on renewable energy technologies such as biogas, wind power, photovoltaics or fuel 113
cells (Bergek and Jacobsson, 2003; Jacobsson et al., 2004; Bergek et al., 2008b; Markard and 114
Truffer, 2008a; Markard et al., 2009). The TIS definition above clearly does not define or 115
favor any spatial boundary or a single relevant scale1 for a TIS. In its strict interpretation, a 116
TIS thus incorporates all agents and institutions which are relevant for innovation in a field of 117
technology. 118
This notwithstanding, TIS studies have from the outset drawn on spatial boundaries for their 119
empirical investigations, typically delineating ex-ante the national level of one or a few 120
comparable industrialized countries as the appropriate level of analysis (see for example 121
Jacobsson, 2008; Negro and Hekkert, 2008; Negro et al., 2008; Markard et al., 2009). As such, 122
the ambition not to conflate system boundaries with national borders is not entirely realized. It 123
even seems that the desire to avoid a spatial fix has to some extent backfired. When outlining 124
the framework Carlsson (1997) on the one hand assumes that “the technological opportunities 125
facing any economic agent are virtually unlimited; the pool of global possibilities has 126
practically no boundaries”. At the same time, empirical findings on four technological fields 127
1 Scale refers to a vertical differentiation in which relations between actors are hierarchically organized among, for
example, global, supra-national, national, regional, metropolitan and/or local levels (Swyngedouw, 1997; Brenner,
2011).
Paper for presentation at the 2012 Regional Studies Association European Conference, Delft 5
5
in Sweden (sic) reveal the importance of both international linkages and geographic proximity 128
to understand the evolution of these fields. Interestingly, the results also reveal that the ability 129
to tap into an international system level is of crucial importance in all four sectors. 130
Internationalizing activities is identified as an efficient strategy to bypass domestic 131
bottlenecks in knowledge, resources or institutional settings. 132
133
This notwithstanding, the emphasis on the national scale was later unintentionally further 134
amplified with a scheme of analysis by Bergek et al. (2008a), who proposed to focus TIS 135
studies on processes in a TIS2. In its empirical implementation, TIS literature thus so far 136
conceptualizes space as a national container which comprises all relevant processes of a 137
system. Even though it is often stated that TIS elements interfere with a “global technological 138
opportunity set” (Carlsson, 1997) or that TIS are “global by nature” (Bergek et al., 2008c), 139
there is little conceptual nor analytical guidance how to analyze TIS structure and functions 140
beyond national boundaries. Empirical applications of the concept thus contradict the original 141
conceptual notion of TIS scholars that TIS are in general global and that a respective analysis 142
“always needs to have a strong international component simply because a spatially limited 143
part of a global TIS can neither be understood, nor assessed, without a thorough 144
understanding of the global context” (Bergek et al., 2008a). A focus on national TIS was often 145
further justified by referring to a motive to inform policy-making (Jacobsson, 2011). Also 146
here, it is assumed that national institutions constitute the most relevant context for effective 147
policy intervention. As this contribution will show, giving primacy to the national scale 148
without satisfactory theoretical or empirical justification is problematic and might lead to 149
incomplete, or biased understanding of relevant processes and therefore also to flawed policy 150
advice. An explicit analysis of ‘TIS spaces’ is thus urgently needed to bring the concept closer 151
to its original conceptual ambitions and to improve policy advice. In this realm it is not only 152
important to analyze the location of TIS actors, but to scrutinize how actual innovation 153
processes (or functions) work in space. 154
2 They argue that seven basic processes or functions are important in TIS: Knowledge development, market
formation, legitimation, resource mobilization, influence on the direction of search, entrepreneurial
experimentation, development of external economies
Paper for presentation at the 2012 Regional Studies Association European Conference, Delft 6
6
2.2. The spatiality of TIS functions 155
The functional approach to TIS studies was defined in two programmatic papers by Bergek 156
(2008a) and Hekkert (2007). In-depth reading of those sources reveals that the only function 157
which is explicitly assigned to a geographic level is “development of positive externalities”. 158
Bergek et al. (2008a: 418) argue by referring to Marshall (1920), that this function manifests 159
itself through dense localized interaction leading to knowledge spillovers and externalities 160
like pooled labor markets or specialized service providers. Economic geographers would 161
strongly agree with the importance of this geographic level for innovation processes (Porter, 162
1998). However, some of the relevant processes like tacit knowledge spillovers could 163
arguably also happen at other spatial scales. Examples comprise “temporal clusters” (2006) 164
forming in international trade fairs, symposia or conferences or activities in global 165
communities of practice (Wenger, 1998). 166
Knowledge development which is referred to in many TIS studies as “at the heart of 167
innovative activity” (Bergek et al., 2008a) is in turn assigned to a global level in Hekkert et 168
al.’s (2007) contribution: “the relevant knowledge base for most technologies originates from 169
various geographical areas all over the world” (Hekkert et al., 2007). At the same time, both 170
publications also hint that knowledge creation can have different qualities with corresponding 171
spatial outreach: Whereas scientific knowledge creation is an international process of codified 172
knowledge accumulation, Bergek et al. (2008a) argue that build-up of practical and tacit 173
knowledge is very likely restricted to dense interactive spaces and strongly localized 174
experimentation. As a consequence, one could assume to find very simple geographic patterns 175
in the networks of knowledge generation: either dense subnational clusters or global ties 176
connecting actors to the freely accessible global technological opportunity set. As we will 177
show in the empirical cases study, the actual geographic manifestation of this function is 178
much more complex than expected. 179
‘Entrepreneurial experimentation’, ‘market formation’, ‘guidance of the search’, ‘creation of 180
legitimacy’ and ‘resource mobilization’ have no spatial specifications in the two 181
programmatic papers, but are all discussed in the related case studies at a national to 182
subnational level. For market formation, indeed small localized initiatives at a regional level 183
can be of crucial importance (Dewald and Truffer, 2012). However, missing market formation 184
in a national TIS can also be compensated by tapping into foreign markets: Chinese PV 185
manufacturers as an example developed into a market leading position by nearly exclusively 186
tapping into downstream foreign markets in Europe and the US (de la Tour et al., 2011). 187
Paper for presentation at the 2012 Regional Studies Association European Conference, Delft 7
7
Similarly, Binz et al. (Binz and Truffer, forthcoming) show that market formation in Asian 188
TIS can decisively depend on direct global-local linkages. 189
“Influence on the direction of search” is just another case where a limitation to a national 190
scale seems too simplistic: Both Bergek and Hekkert define it as a combination of long-term 191
policy goals and regulations by governments and the creation of vision and collective 192
expectations in an interactive process (Hekkert et al., 2007; Bergek et al., 2008a). Whereas 193
policy regulation can arguably be limited to a national scale (when ignoring the increasing 194
influence of supranational political institutions and treaties like the EU, UN or WTO), the 195
expectation dimension cannot. Even Bergek et al. (2008a) agree that expectations might be 196
influenced by growth occurring in TISs in other countries or by changes in the socio-technical 197
landscape (Geels, 2002), which lies outside the influence sphere even of specific national 198
agents. Cited examples of the German wind TIS (Bergek and Jacobsson, 2003) in fact show 199
that direction of the search in the German national TIS was strongly influenced by 200
developments in California and Denmark. Similar criticism applies to the ‘entrepreneurial 201
experimentation’, ‘resource mobilization’ and ‘creation of legitimacy’ functions which are 202
also introduced with an implicitly national focus. Also here, the actual spatial outreach of 203
processes is likely to transcend national borders more easily than could be assumed from 204
empirical TIS studies. 205
206
In summary, tackling the spatial topology of a TIS is an important analytical problem yet to 207
solve. The interesting road forward is however not trying to assign functions to an appropriate 208
spatial level (see Coenen et al., accepted), but scrutinizing in more detail how processes in 209
different places and at different spatial levels interact and thereby define innovative outcomes 210
of the global TIS as a whole and of specific national subsystems. This implies that a 211
networked or relational perspective on TIS space might be a fruitful way forward. As 212
economic geography has been strongly involved in this kind of theorizing, the next section 213
scrutinizes on how to combine TIS with a networked perspective on space as derived from 214
economic geography. 215
2.3. Applying a networked perspective on TIS space 216
Economic geography has a long tradition in analyzing the influence of space and place on 217
innovation processes at various scales (Bunnell and Coe, 2001; Dicken and Malmberg, 2001; 218
Asheim and Coenen, 2006). On the one hand this literature strongly emphasizes the 219
Paper for presentation at the 2012 Regional Studies Association European Conference, Delft 8
8
importance of territorial and institutional embedded learning and innovation processes in 220
densely localized “territorial innovation models” (TIM) such as regional innovation systems, 221
clusters, industrial districts or innovative milieus (Cooke et al., 1997; Porter, 1998; Boschma 222
and Lambooy, 2002; Camagni and Maillat, 2006). Dense and repeated cooperation, regular 223
face-to-face interaction, a build-up of specific supportive institutions and trustworthy 224
relationships are assumed to be central to the innovation process. This argument is not directly 225
transferable to TIS given its focus on very early innovation phases, where uncertainties are 226
high and a favorable institutional environment may still be under construction. Dense local 227
interaction might be important in this process, yet innovative actors and activities might also 228
spring up in different windows of locational opportunity at the same time (Boschma, 1997). 229
On the other hand, economic geography also increasingly argues that relevant structures and 230
agents for the innovation process are in most cases not restricted to a specific cluster or region, 231
but that linkages with actors and networks elsewhere and relationships with institutions at 232
different scales can be, at least, of equal importance (Bunnell and Coe, 2001; Amin, 2002; 233
Coe and Bunnell, 2003; Coenen et al., accepted). This shift in perspective is one of the 234
hallmarks in the so-called relational turn in economic geography (Bathelt and Gluckler, 2003; 235
Boggs and Rantisi, 2003). "Spaces and places are shaped not only by processes and relations 236
internal to their demarcated spatial boundaries but also through processes which function 237
through wider sets of relations and network connections" (Bathelt and Gluckler, 2003; Yeung, 238
2005). These processes and relations are fluent and constantly reorganizing at all scales 239
(2002). The basis of a relational approach is that individual actors have significant 240
relationships (through which they seek to access resources to achieve their individual goals) 241
that influence their behaviour simultaneously at a number of different scales. As a 242
consequence, relational economic geography has put a premium on networks as a conceptual 243
and methodological underpinning to analyze (uneven) spatial development (Glückler, 2007; 244
Ter Wal and Boschma, 2009). So opposed to fixed territorial surfaces and boundaries, 245
networks span space by establishing transversal and topological interlinkages among 246
geographically dispersed locations or organizational units (Whatmore and Thorne, 1997; 247
Leitner, 2004;(Brenner et al., 2011)). This does not mean that a networked perspective by 248
default presupposes distanced, global relations. Network spaces may very well be 249
concentrated in a particular locality through dense local relations. It is in fact often a 250
combination of dense local ties (‘local buzz’) and extended extra-regional connections 251
(‘global pipelines’) that create successful long-term innovativeness of TIMs {{10317 Bathelt, 252
Harald 2004}}. How this combination plays out in reality is however contingent on a number 253
Paper for presentation at the 2012 Regional Studies Association European Conference, Delft 9
9
of factors such as the type of industry and its knowledge base (Asheim and Coenen, 2006) and 254
the institutional conditions of a region (Tödtling and Trippl, 2005). 255
256
A networked perspective on space thus suggests that relying only on interaction at one scale 257
(e.g. the regional scale in regional innovation systems or, the national scale in technological 258
innovation systems) curtails the significance of processes, relations and institutions elsewhere 259
or treats these as merely exogenous factors. This reveals a key challenge for TIS research. 260
While indeed the development of a technology or technological fields does not stop short of 261
territorial borders, they do articulate particular forms of uneven spatial development. 262
To give a hypothetical example, a TIS for water recycling technology could in theory develop 263
in a region in Italy based on local environmental movements, coherent EU regulation and 264
competing Chinese and German companies which develop specific market solutions in 265
cooperation with a Spanish university and an industry association from neighboring regions in 266
Italy. Obviously, such a TIS would not be anchored at any specific territorial unit or delimited 267
to any particular regions or nation. It would rather be integrated in a network spanning 268
between all involved actors and connecting different territorial units. 269
270
Similarly, TIS actors are usually not just defined by specific actors’ individual resource 271
endowments or capabilities, but by their networks with other complementary actors in the 272
same or related fields. Also important processes for system buildup like standard setting, 273
market formation or lobbying for regulative changes in TIS are assumed to be enacted 274
through specific relational networks (Musiolik and Markard, in press). However, despite the 275
prominent position of networks in TIS terminology (TIS are defined a set of networks of 276
actors and institutions), the actual use of the term has been restricted to a mostly qualitative 277
and metaphorical level (Kastelle and Steen, 2010). This is not very surprising as getting grasp 278
of the plentiful and very diverse types of networks that define a TIS is a very delicate task. 279
Networks in a TIS can be formal, informal, short-run, long-lasting, transdisciplinary, 280
exclusive, open or strategic and spanning between diverse actor types (Musiolik and Markard, 281
in press). Thus, also when speaking about networks, TIS research so far mostly referred to a 282
national boundary. As a result, it would probably be more correct to speak of a national TIS 283
rather than a TIS. International actors, linkages and foreign or supra-national institutions are 284
ultimately treated as ‘foreign’ and exogenous. That is, the systemicness of the TIS remains 285
largely grounded in the national context of study. Therefore the paradoxical outcome of TIS 286
Paper for presentation at the 2012 Regional Studies Association European Conference, Delft 10
10
initial aspatial treatment of innovation system has resulted in a territorial fixation of TIS 287
dynamics. 288
289
Shifting to a networked perspective on space is however not only referring to the structural 290
elements of a TIS, but also to the processes working in a system. As discussed before, a 291
networked perspective on space might ultimately also lead to a better understanding of what is 292
going on in the functional pattern of a TIS and of how processes in localized or very distant 293
places might influence the functioning of a national system in focus. We suggest that a main 294
reason why unpacking these spatial complexities of TIS was avoided for a long time was due 295
to problems of data availability in particular if the focus is extended beyond the borders of 296
small European countries. Clearly, international TIS studies cannot follow the protocol of TIS 297
assessment as proposed by Bergek et al. (2008c) and Hekkert (2007). In addition to the 298
conceptual challenges, a whole new set of methodologies and indicators is thus needed to 299
enable the proposed networked TIS analysis. 300
301
In the following sections we will thus propose a first step in this direction by developing a set 302
of indicators based on social network analysis that allow for a networked, spatial analysis of 303
TIS functions. To reduce complexity, but still allow for an in-depth study of spatial dynamics, 304
the analysis in this paper will be limited to the ‘core’ function of TIS, knowledge creation. 305
306
307
Paper for presentation at the 2012 Regional Studies Association European Conference, Delft 11
11
3. Measuring international network topologies of TIS 308
In the proposed perspective on TIS, the used methodological approach has to be able to 309
scrutinize actor network evolution in global space. Here, social network analysis (SNA) enters 310
the stage as a tool which already developed a set of heuristic routines for this purpose and 311
which is able to handle large global databases (Wasserman and Faust, 1994). In this paper, a 312
three step procedure of analysis is proposed. First, the network as a whole and its core actors 313
can be characterized with a set of descriptive SNA indicators. As these are standard measures, 314
they will be introduced directly in the results section, detailed descriptions can be found in 315
Appendix 2. Secondly, a nationalization index is developed, which gives a direct measure for 316
how much of the cooperation in knowledge creation of a TIS is actually happening inside 317
national borders. Thirdly, the concept of “hubs” will be introduced. Hubs are defined as 318
cohesive subgroups in a network which show particularly tight interaction and which integrate 319
different types of actors into a transdisciplinary knowledge creation process. As TIS 320
emphasizes the importance of such transdisciplinary cooperation, one can assume that hubs 321
indicate the core of innovative activities in a network, say the most vibrant and innovative 322
spaces in a TIS. Hubs can be strongly localized, develop in a regional cluster, form between 323
actors at a national level or even be international in their outreach. After introducing in more 324
detail the latter two indicators, they allow formulating a typology of spatial setups of 325
knowledge creation (or ultimately the TIS as a whole, if the other functions are equally 326
covered with similar approaches) and speculate on the spatial errors which nationally 327
delimited cases are likely to commit. 328
329
The nationalization index is defined as the average ratio of links among actors inside one 330
country versus the links with actors outside a country. Its definition is based on the E-I index 331
by Krackhardt and Stern (1988), but combined with the spatial attributes ‘national’ and 332
‘international’. As indicated before, this index gives a direct measure for the average 333
importance of nationally delimited interaction in knowledge creation. It can thus designate 334
how much information on external linkages is lost in nationally delimited case studies and 335
thus how strongly one might be including spatial biases in such cases. The following formula 336
can be used to analyze this ratio: 337
338
339
Paper for presentation at the 2012 Regional Studies Association European Conference, Delft 12
12
340
1) 341
342
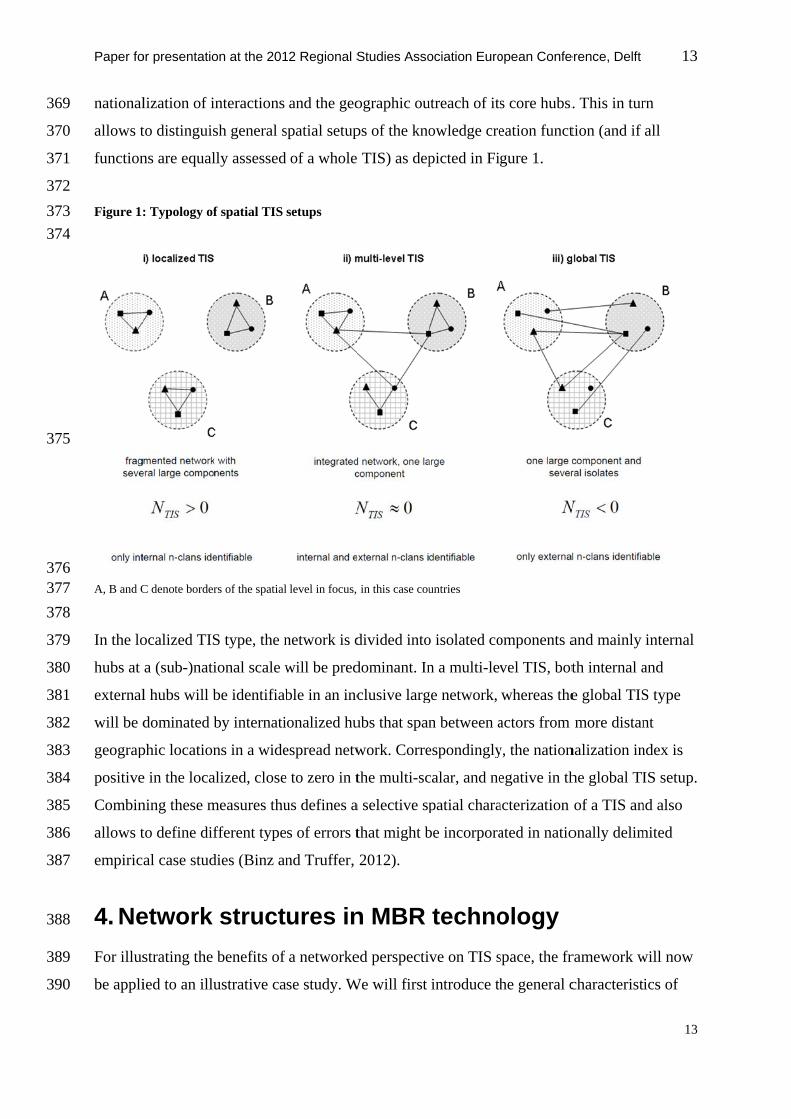
Nc:= "nationalization index" of all actors in a specific country in the TIS, Li:= internal link, Le:= external link 343
344
2) 345
346
347
:= nationalization index of the TIS as a whole, c:= country 348
349
This index can be used to both assess the nationalization of one single country in the TIS 350
(equation 1) or also to get a cumulated measure for the overall nationalization of the TIS 351
(equation 2). If most actors are cooperating in a national or subnational context, this ratio will 352
show values above 0 and tend towards 1. If internal and external links are equally important, 353
the value will be close to zero. Consequently, in a more internationalized TIS, it will take on 354
negative values and tend towards -1. 355
356
Hubs will be assessed by identifying and characterizing network components and cohesive 357
subgroups. Whereas components depict completely isolated fractions of a network, cohesive 358
subgroups are defined in SNA terminology as a subset of a network that displays some 359
minimal level of cohesion. Subgroup identification will be based on geographically sensitive 360
n-clan analysis. An n-Clan is defined as a subgraph in which the (geodesic3) distance between 361
all actors is not greater than n (Wasserman and Faust, 1994). An n-value of 2 was chosen here, 362
meaning that every actor in each n-Clan is divided from all other actors by no more than one 363
intermediary. In addition, n-Clans allow for the definition of a minimum value of participants. 364
The minimum size of n-Clans was set at 9 actors4. 365
366
Summarizing, the proposed networked analysis of the knowledge creation function can be 367
operationalized based on scrutinizing the overall knowledge network structure, the grade of 368
3 Godesic distance: The shortest possible path between two connected actors in a social network.
4 This value was chosen based on the used co-publication data. A few publications in the dataset contain up to 8
authors. The threshold level was therefore set at nine actors in order to avoid that a single publications with many
involved actors would be interpreted as one distinct hub in the TIS
c
NN c
TIS
TISN
ei
eic LL
LLN
369
370
371
372
373
374
375
376 377
378
379
380
381
382
383
384
385
386
387
388
389
390
Paper fo
national
allows t
function
Figure 1
A, B and C
In the lo
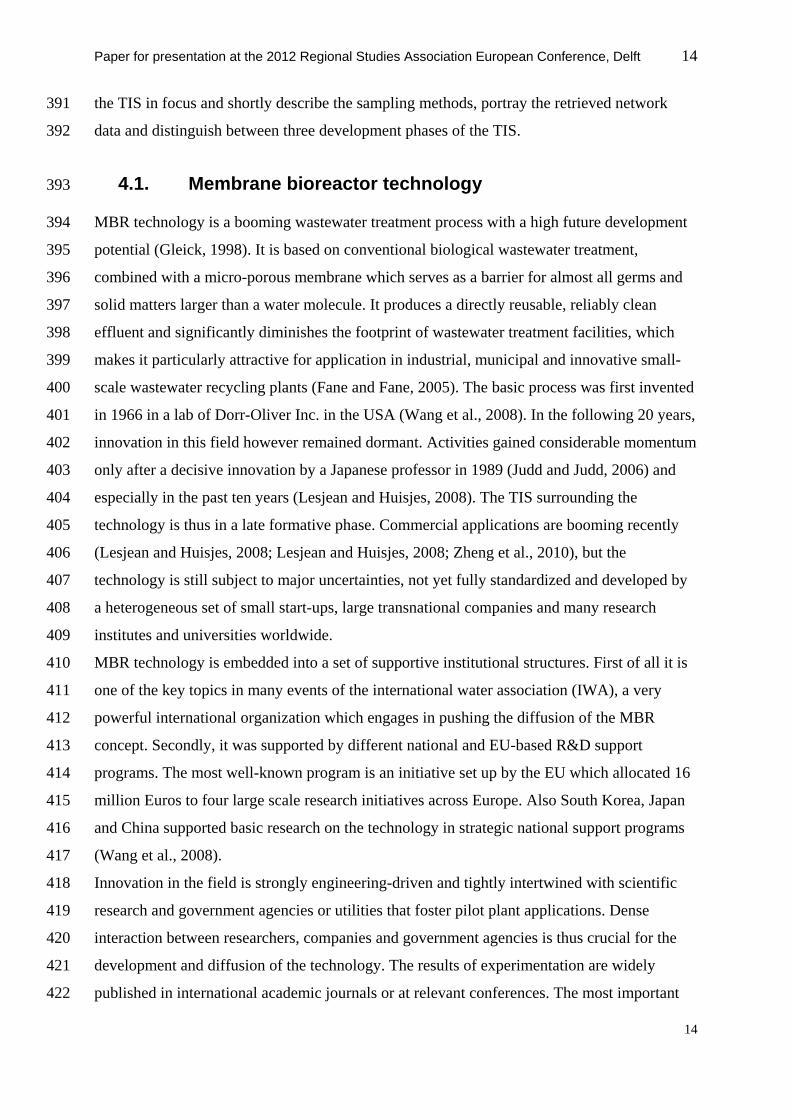
hubs at
external
will be d
geograp
positive
Combin
allows t
empiric
4. Ne
For illus
be appli
or presentatio
lization of i
to distinguis
ns are equal
: Typology of
C denote border
ocalized TIS
a (sub-)nati
l hubs will b
dominated b
phic location
e in the loca
ning these m
to define dif
al case stud
etwork
strating the
ied to an illu
on at the 201
nteractions
sh general s
lly assessed
f spatial TIS
rs of the spatial
S type, the n
ional scale w
be identifiab
by internati
ns in a wide
alized, close
measures thu
fferent type
dies (Binz an
struct
benefits of
ustrative ca
12 Regional S
and the geo
spatial setup
d of a whole
setups
l level in focus,
network is d
will be pred
ble in an inc
onalized hu
espread netw
e to zero in t
us defines a
s of errors t
nd Truffer,
ures in
f a networke
se study. W
Studies Asso
ographic ou
ps of the kno
TIS) as dep
in this case cou
divided into
dominant. In
clusive larg
ubs that span
work. Corre
the multi-sc
a selective sp
that might b
2012).
n MBR
ed perspecti
We will first
ociation Euro
utreach of its
owledge cre
picted in Fig
untries
o isolated co
n a multi-lev
ge network,
n between a
espondingly
calar, and ne
patial chara
be incorpora
techno
ve on TIS s
introduce th
opean Confe
s core hubs.
eation funct
gure 1.
omponents a
vel TIS, bot
whereas the
actors from
y, the nation
egative in th
acterization
ated in natio
ology
space, the fr
he general c
erence, Delft
. This in tur
tion (and if
and mainly
th internal a
e global TIS
more distan
nalization in
he global TI
of a TIS an
onally delim
ramework w
characterist
13
13
rn
all
internal
and
S type
nt
ndex is
IS setup.
nd also
mited
will now
ics of
Paper for presentation at the 2012 Regional Studies Association European Conference, Delft 14
14
the TIS in focus and shortly describe the sampling methods, portray the retrieved network 391
data and distinguish between three development phases of the TIS. 392
4.1. Membrane bioreactor technology 393
MBR technology is a booming wastewater treatment process with a high future development 394
potential (Gleick, 1998). It is based on conventional biological wastewater treatment, 395
combined with a micro-porous membrane which serves as a barrier for almost all germs and 396
solid matters larger than a water molecule. It produces a directly reusable, reliably clean 397
effluent and significantly diminishes the footprint of wastewater treatment facilities, which 398
makes it particularly attractive for application in industrial, municipal and innovative small-399
scale wastewater recycling plants (Fane and Fane, 2005). The basic process was first invented 400
in 1966 in a lab of Dorr-Oliver Inc. in the USA (Wang et al., 2008). In the following 20 years, 401
innovation in this field however remained dormant. Activities gained considerable momentum 402
only after a decisive innovation by a Japanese professor in 1989 (Judd and Judd, 2006) and 403
especially in the past ten years (Lesjean and Huisjes, 2008). The TIS surrounding the 404
technology is thus in a late formative phase. Commercial applications are booming recently 405
(Lesjean and Huisjes, 2008; Lesjean and Huisjes, 2008; Zheng et al., 2010), but the 406
technology is still subject to major uncertainties, not yet fully standardized and developed by 407
a heterogeneous set of small start-ups, large transnational companies and many research 408
institutes and universities worldwide. 409
MBR technology is embedded into a set of supportive institutional structures. First of all it is 410
one of the key topics in many events of the international water association (IWA), a very 411
powerful international organization which engages in pushing the diffusion of the MBR 412
concept. Secondly, it was supported by different national and EU-based R&D support 413
programs. The most well-known program is an initiative set up by the EU which allocated 16 414
million Euros to four large scale research initiatives across Europe. Also South Korea, Japan 415
and China supported basic research on the technology in strategic national support programs 416
(Wang et al., 2008). 417
Innovation in the field is strongly engineering-driven and tightly intertwined with scientific 418
research and government agencies or utilities that foster pilot plant applications. Dense 419
interaction between researchers, companies and government agencies is thus crucial for the 420
development and diffusion of the technology. The results of experimentation are widely 421
published in international academic journals or at relevant conferences. The most important 422
Paper for presentation at the 2012 Regional Studies Association European Conference, Delft 15
15
companies in the field run own research institutes and R&D departments and are regularly 423
involved in basic research, scientific publications and in organizing and supporting 424
conferences and trade fairs. Relatively abundant data about multidisciplinary and 425
transdisciplinary cooperation in the innovation process is thus included in the publication 426
record of this field of technology. As a consequence, co-publication data was chosen as a 427
source of network data. This data (ideally) stands for a long-term cooperation activity in a 428
complex process, necessitating intensive knowledge exchange among participating authors, 429
which by definition leads to a small piece of innovation. In the specific case of MBR 430
technology publication data additionally appears to be more informative than patent data. 431
MBR companies are rather reluctant to patent their innovations which hindered us from 432
complementing co-publication with patent data. As the co-publication dataset includes a 433
balanced set of actor types (only 53% of actors originate from universities, the rest includes 434
companies, research institutes, government agencies and associations, see Figure 2B), we 435
maintain that a sufficiently valid part of the innovation network structure of this function is 436
covered with this dataset. Despite well documented problems with such data (Katz and Martin, 437
1997), co-publication data thus forms a suitable proxy for the actor structure and relational 438
pattern of the knowledge creation function in the MBR TIS. 439
4.2. Sampling method 440
Data collection was based on an extensive query in the publication database of ISI web of 441
knowledge5. A dataset of 1'102 publications covering a timeframe from 1992-2009 was 442
obtained by searching for TS=(membrane bioreactor” AND water) and subsequently filtering 443
unrelated topic areas6. For the scope of this study, author affiliation information in each 444
publication was the key data source. Because of errors in ISI affiliation data (false or missing 445
affiliation information, several names for the same organization, typing errors, redundancies 446
etc.) the raw data was converted into a network matrix manually. During this procedure, about 447
5 Thomson Reuters Web of Knowledge, http://apps.isiknowledge.com/
6 Search string: TS=("membrane bioreactor" AND water). All subject areas filtered, except for: water resources; engineering,
chemical; environmental sciences; engineering, environmental; biotechnology & applied microbiology; polymer science;
chemistry, multidisciplinary; biochemistry & molecular biology; engineering, civil; energy & fuels; agricultural engineering;
food science & technology; microbiology; chemistry, analytical; chemistry, applied; materials science, textiles;
multidisciplinary sciences; ecology; engineering, aerospace; engineering, biomedical; engineering, electrical & electronic;
engineering, multidisciplinary; environmental studies
448
449
450
451
452
453
454
455
456
457
458 459
460
461
462
463
464
465
466
467
468
Paper fo
200 them
time fra
and 201
samplin
4.3
MBR te
years (s
market g
other stu
Figure 2:
Source: Ow
Figure 2
conside
thus stro
and 200
quickly
Actor
Actors i
research
nodes ar
or presentatio
matically un
ame from 19
11 were exc
ng. The data
3. Ge
echnology is
ee Figure 2
growth and
udies (Lesje
ISI web of kno
num
wn design, base
2A furtherm
rable amoun
ongly focus
09, which is
(Lesjean an
structure
in this study
h institutes o
re thus orga
on at the 201
nrelated pub
992-2009 w
luded, as th
aset was eva
neral cha
s in a boom
2A). This inc
d increased o
ean and Hui
owledge public
A
ber of publica
ed on data from
more reveals
nts of netwo
s on the time
also the tim
nd Huisjes,
e
y are define
or governm
anizations, w
12 Regional S
blications g
were left for
he ISI record
aluated and
aracteris
ming period:
creasing pu
overall inter
isjes, 2008;
cation record i
tions
m ISI web of kno
s that public
ork data are
eframe with
me when act
2008).
d at the leve
ment agencie
whereas ties
Studies Asso
got excluded
a co-author
ds did not y
visualized u
stics of t
Publication
ublication ac
rest for the
Wang et al
in the field of M
nowledge
cations are d
e available o
h sufficient
tivities in th
el of organi
es and not at
s are the coo
ociation Euro
d. In the end
rship analys
yet seem to b
using Net M
he datas
ns grew exp
ctivity nicel
application
l., 2008).
MBR technolog
spatia
dispersed un
only after th
and reliable
he overall T
izations suc
t the level o
operation b
opean Confe
d, 911 publi
sis. Publicat
be complete
Miner 3 softw
set
ponentially o
y correspon
of MBR sy
gy 1993-2010
B
l distribution o
nequally in
he year 2000
e data betwe
TIS reported
h as compa
of single aut
etween thes
erence, Delft
ications cov
tions from 2
e at the time
tware.
over the las
nds with rap
ystems repor
of publications
time and th
0. Our analy
een the year
dly grew mo
anies, univer
thors. Netw
se organizat
16
16
vering a
2010
e of data
st ten
pid
rted in
s
hat
ysis will
rs 2001
ost
rsities,
work
tion in a
Paper for presentation at the 2012 Regional Studies Association European Conference, Delft 17
17
co-publication process. Actor attributes (such as type of organization, location) were derived 469
from the affiliation information provided in the database of ISI web of knowledge. 470
471
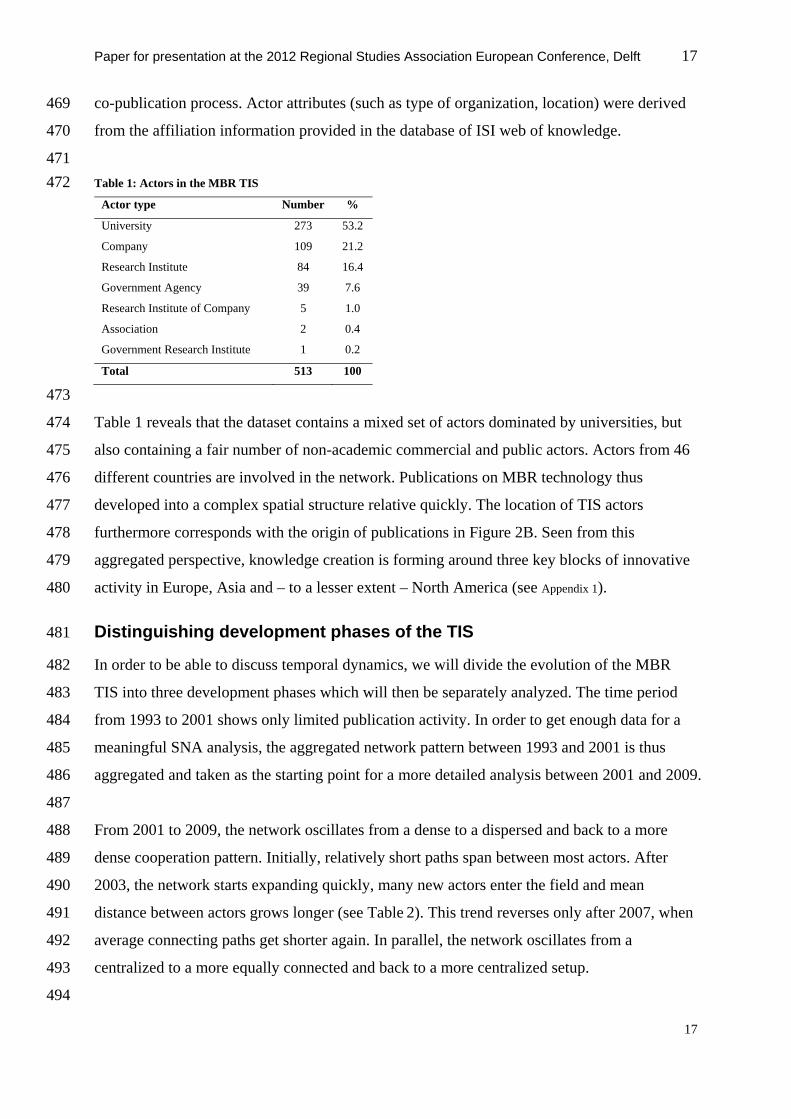
Table 1: Actors in the MBR TIS 472 Actor type Number %
University 273 53.2
Company 109 21.2
Research Institute 84 16.4
Government Agency 39 7.6
Research Institute of Company 5 1.0
Association 2 0.4
Government Research Institute 1 0.2
Total 513 100
473
Table 1 reveals that the dataset contains a mixed set of actors dominated by universities, but 474
also containing a fair number of non-academic commercial and public actors. Actors from 46 475
different countries are involved in the network. Publications on MBR technology thus 476
developed into a complex spatial structure relative quickly. The location of TIS actors 477
furthermore corresponds with the origin of publications in Figure 2B. Seen from this 478
aggregated perspective, knowledge creation is forming around three key blocks of innovative 479
activity in Europe, Asia and – to a lesser extent – North America (see Appendix 1). 480
Distinguishing development phases of the TIS 481
In order to be able to discuss temporal dynamics, we will divide the evolution of the MBR 482
TIS into three development phases which will then be separately analyzed. The time period 483
from 1993 to 2001 shows only limited publication activity. In order to get enough data for a 484
meaningful SNA analysis, the aggregated network pattern between 1993 and 2001 is thus 485
aggregated and taken as the starting point for a more detailed analysis between 2001 and 2009. 486
487
From 2001 to 2009, the network oscillates from a dense to a dispersed and back to a more 488
dense cooperation pattern. Initially, relatively short paths span between most actors. After 489
2003, the network starts expanding quickly, many new actors enter the field and mean 490
distance between actors grows longer (see Table 2). This trend reverses only after 2007, when 491
average connecting paths get shorter again. In parallel, the network oscillates from a 492
centralized to a more equally connected and back to a more centralized setup. 493
494
Paper for presentation at the 2012 Regional Studies Association European Conference, Delft 18
18
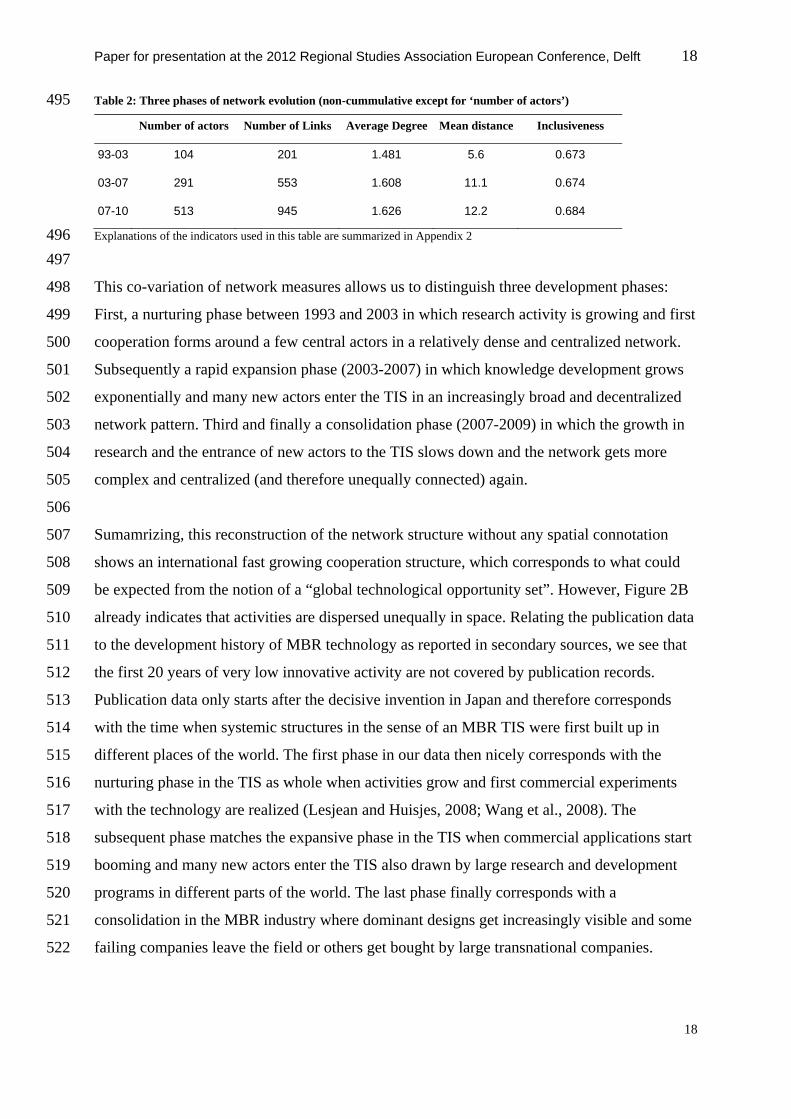
Table 2: Three phases of network evolution (non-cummulative except for ‘number of actors’) 495
Number of actors Number of Links Average Degree Mean distance Inclusiveness
93-03 104 201 1.481 5.6 0.673
03-07 291 553 1.608 11.1 0.674
07-10 513 945 1.626 12.2 0.684
Explanations of the indicators used in this table are summarized in Appendix 2 496
497
This co-variation of network measures allows us to distinguish three development phases: 498
First, a nurturing phase between 1993 and 2003 in which research activity is growing and first 499
cooperation forms around a few central actors in a relatively dense and centralized network. 500
Subsequently a rapid expansion phase (2003-2007) in which knowledge development grows 501
exponentially and many new actors enter the TIS in an increasingly broad and decentralized 502
network pattern. Third and finally a consolidation phase (2007-2009) in which the growth in 503
research and the entrance of new actors to the TIS slows down and the network gets more 504
complex and centralized (and therefore unequally connected) again. 505
506
Sumamrizing, this reconstruction of the network structure without any spatial connotation 507
shows an international fast growing cooperation structure, which corresponds to what could 508
be expected from the notion of a “global technological opportunity set”. However, Figure 2B 509
already indicates that activities are dispersed unequally in space. Relating the publication data 510
to the development history of MBR technology as reported in secondary sources, we see that 511
the first 20 years of very low innovative activity are not covered by publication records. 512
Publication data only starts after the decisive invention in Japan and therefore corresponds 513
with the time when systemic structures in the sense of an MBR TIS were first built up in 514
different places of the world. The first phase in our data then nicely corresponds with the 515
nurturing phase in the TIS as whole when activities grow and first commercial experiments 516
with the technology are realized (Lesjean and Huisjes, 2008; Wang et al., 2008). The 517
subsequent phase matches the expansive phase in the TIS when commercial applications start 518
booming and many new actors enter the TIS also drawn by large research and development 519
programs in different parts of the world. The last phase finally corresponds with a 520
consolidation in the MBR industry where dominant designs get increasingly visible and some 521
failing companies leave the field or others get bought by large transnational companies. 522
523
524
525
526
527
528
529
530
531
532
533
534 535
536
537
538
539
540
541
542
543
Paper fo
5. Sp
MB
The spa
to the id
Nationa
Figure 3
knowled
subsyste
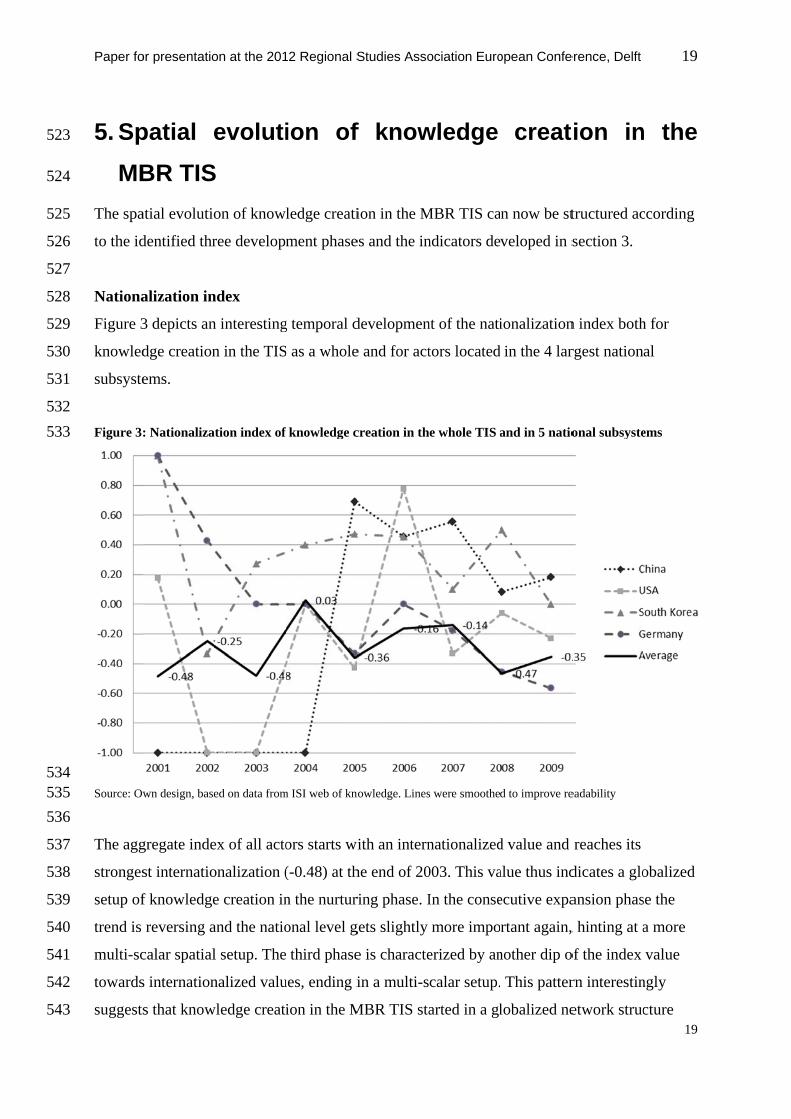
Figure 3
Source: Ow
The agg
stronges
setup of
trend is
multi-sc
towards
suggests
or presentatio
patial e
BR TIS
atial evolutio
dentified thr
alization in
3 depicts an
dge creation
ems.
: Nationaliza
wn design, base
gregate inde
st internatio
f knowledge
reversing a
calar spatial
s internation
s that know
on at the 201
evoluti
S
on of know
ree developm
ndex
n interesting
n in the TIS
tion index of
ed on data from
ex of all acto
onalization (
e creation in
and the natio
l setup. The
nalized valu
wledge creati
12 Regional S
ion of
ledge creati
ment phase
g temporal d
S as a whole
f knowledge c
m ISI web of kno
ors starts wi
(-0.48) at th
n the nurtur
onal level g
third phase
ues, ending i
ion in the M
Studies Asso
f know
ion in the M
es and the in
developmen
e and for act
creation in th
nowledge. Lines
ith an intern
he end of 20
ring phase. I
gets slightly
e is characte
in a multi-s
MBR TIS sta
ociation Euro
wledge
MBR TIS ca
ndicators de
nt of the nati
tors located
e whole TIS a
s were smoothe
nationalized
003. This va
In the conse
more impo
erized by an
calar setup.
arted in a gl
opean Confe
creat
an now be st
veloped in s
ionalization
in the 4 lar
and in 5 natio
d to improve re
d value and
alue thus ind
ecutive expa
rtant again,
nother dip o
This patter
lobalized ne
erence, Delft
tion in
tructured ac
section 3.
n index both
rgest nation
onal subsyste
eadability
reaches its
dicates a glo
ansion phas
, hinting at a
of the index
rn interestin
etwork struc
19
19
n the
ccording
h for
al
ems
obalized
se the
a more
value
ngly
cture
Paper for presentation at the 2012 Regional Studies Association European Conference, Delft 20
20
and developed into a more differentiated multi-scalar spatial setup only in the later expansion 544
and consolidation phases. 545
546
Also nationalization index values for single countries show strong temporal variation. In the 547
first years of analysis this dynamism can still partly be attributed to low data volumes and 548
corresponding high impact of a few publications on the overall index value. Nevertheless, US 549
actors show that the spatial outreach of cooperation can change greatly and repeatedly also in 550
later phases of TIS development. Chinese actors’ index values are exclusively international in 551
the first four years and then suddenly switch to nationalized index values in 2005. This shift 552
happens in a time when many new Chinese actors enter the TIS and MBR technology gets 553
increasingly integrated into heavily funded strategic national R&D programmes (Wang et al., 554
2008; Zheng et al., 2010). This pattern thus reveals a catching-up process in which the 555
Chinese TIS actors first tapped into global knowledge sources before domestic research 556
capabilities were built up in the wake of the formulation of basic research programs and 557
industrial policies. South Korean actors, finally exemplify a publication strategy which is in 558
most time periods focused on cooperation in national boundaries. 559
560
Hub analysis 561
The so far highly aggregated view on the network can now be complemented with a hub 562
analysis. As mentioned in Section 3, network components and n-Clans are used to identify 563
hubs of innovative activity. 564
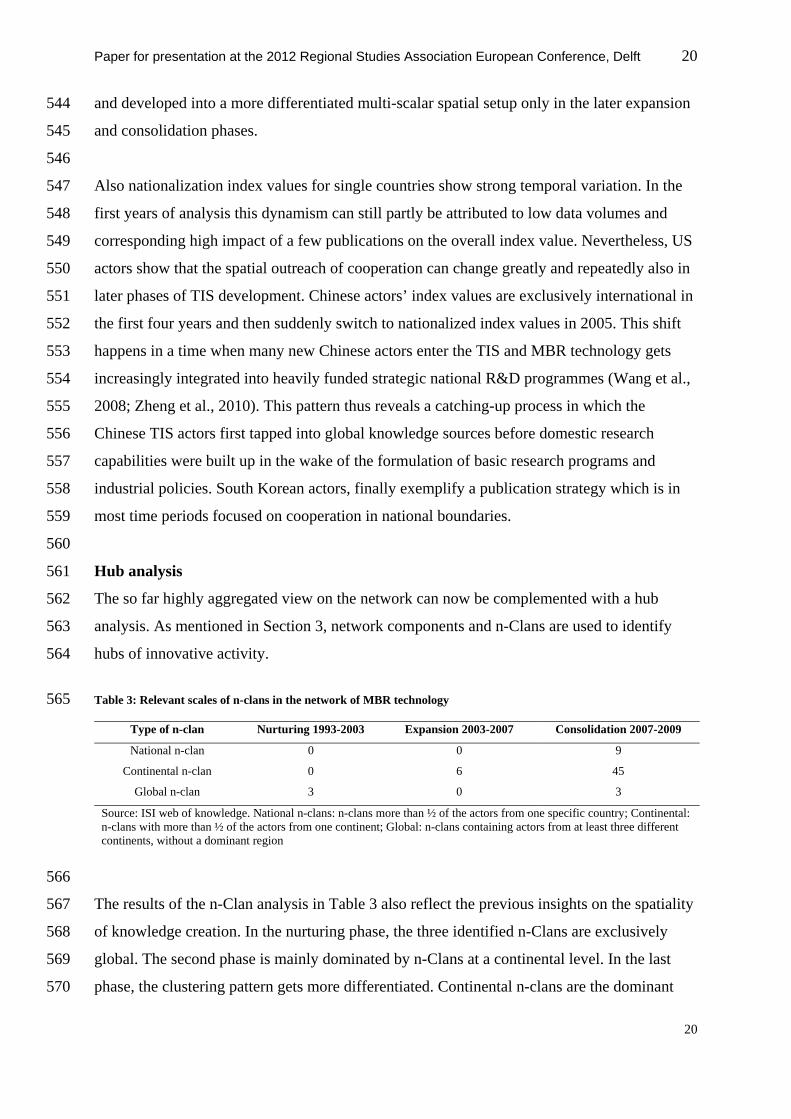
Table 3: Relevant scales of n-clans in the network of MBR technology 565
Type of n-clan Nurturing 1993-2003 Expansion 2003-2007 Consolidation 2007-2009
National n-clan 0 0 9
Continental n-clan 0 6 45
Global n-clan 3 0 3
Source: ISI web of knowledge. National n-clans: n-clans more than ½ of the actors from one specific country; Continental: n-clans with more than ½ of the actors from one continent; Global: n-clans containing actors from at least three different continents, without a dominant region
566
The results of the n-Clan analysis in Table 3 also reflect the previous insights on the spatiality 567
of knowledge creation. In the nurturing phase, the three identified n-Clans are exclusively 568
global. The second phase is mainly dominated by n-Clans at a continental level. In the last 569
phase, the clustering pattern gets more differentiated. Continental n-clans are the dominant 570
Paper for presentation at the 2012 Regional Studies Association European Conference, Delft 21
21
level of interaction, but global and national hubs play a role, too. The affiliation of actors to n-571
Clans will be discussed in more detail in the next sections together with a more detailed 572
discussion of the observed spatial pattern at each development stage. 573
5.1. 1993-2003: Globalized TIS dominated by French 574
transnational water companies 575
The nurturing phase is a relatively dense global network that spans around a few central actors. 576
Network measures in Table 2, the nationalization index and n-clan analysis affirm that the 577
global scale is the most relevant in this development phase (also see network visualization in 578
Appendix 3). The network is centered on CIRSEE (Centre International de Recherche Sur 579
l'Eau et l'Environnement), a French company research institute, and its subsidiaries in 580
Malaysia (ASTRAN Malaysia) and Australia (ASTRAN Sydney). This setup can be 581
explained with a global research network that was setup by a large French transnational water 582
company in this early phase of TIS development. Asian and European actors are strongly 583
linked to this network from the outset: The Chinese Qinghua University or the institute of the 584
Asian Technology and Research Network in Malaysia occupy a relatively central position in 585
the network already in 2003 (Binz and Truffer, 2012). 586
587
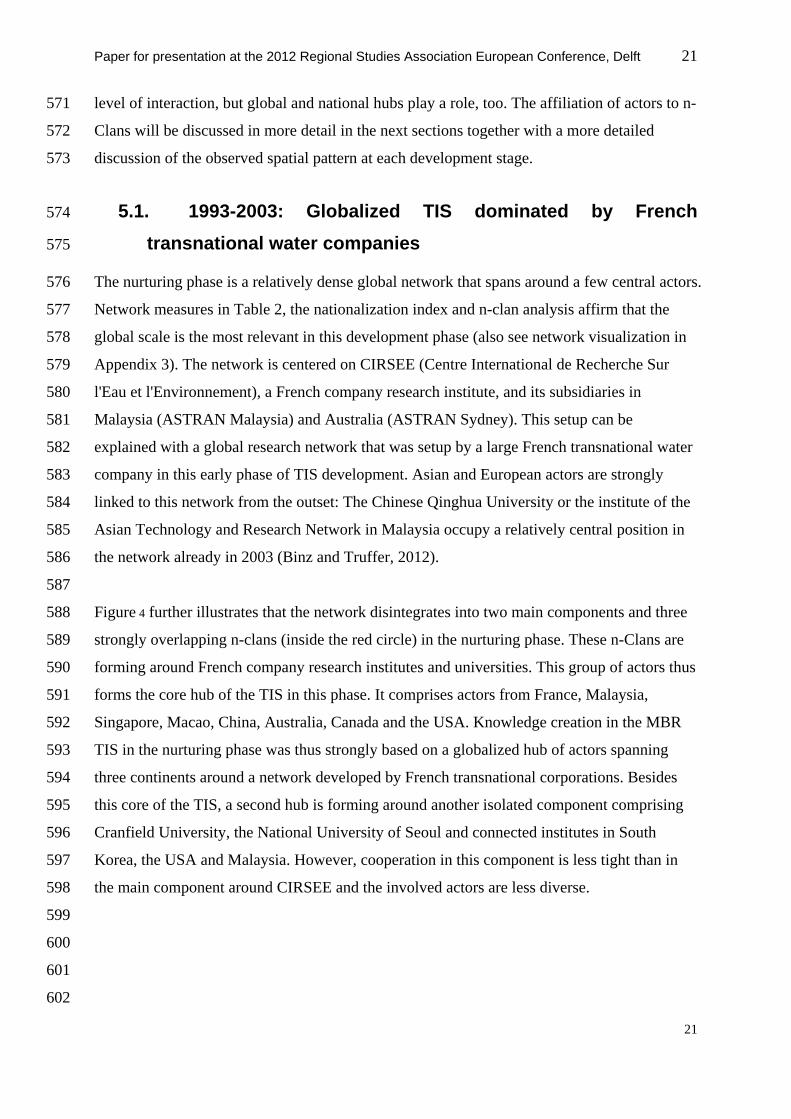
Figure 4 further illustrates that the network disintegrates into two main components and three 588
strongly overlapping n-clans (inside the red circle) in the nurturing phase. These n-Clans are 589
forming around French company research institutes and universities. This group of actors thus 590
forms the core hub of the TIS in this phase. It comprises actors from France, Malaysia, 591
Singapore, Macao, China, Australia, Canada and the USA. Knowledge creation in the MBR 592
TIS in the nurturing phase was thus strongly based on a globalized hub of actors spanning 593
three continents around a network developed by French transnational corporations. Besides 594
this core of the TIS, a second hub is forming around another isolated component comprising 595
Cranfield University, the National University of Seoul and connected institutes in South 596
Korea, the USA and Malaysia. However, cooperation in this component is less tight than in 597
the main component around CIRSEE and the involved actors are less diverse. 598
599
600
601
602
603
604 605
606
607
608
609
610
611
612
613
614
615
616
617
618
619
620
Paper fo
Figure 4:
Source: O
5.2
The sub
Clans at
expands
Table 2)
Append
program
internat
most dis
isolated
coopera
between
its actor
Korean,
or presentatio
Spatial outrea
Own depiction,
2. 200
bsequent exp
t a continen
s quickly an
). Dense int
dix 4). This
ms that are s
tional relatio
sconnected
d actors. Eur
ation pattern
n actors from
r base and s
, Chinese an
on at the 201
ach of hubs in t
ISI, NetMiner
03-2007:
pansion pha
ntal level. In
nd the numb
teraction no
developmen
set up in the
onal pattern
region with
ropean actor
n. Inside Eu
m EU memb
ome first de
nd Japanese
12 Regional S
the two main c
r 3, node size d
Europe-
ase was so f
n addition, b
ber of actors
ow gets dom
nt is explain
e European U
n can now be
h a high num
rs in contra
urope, the in
ber states. A
ense interna
e actors.
Studies Asso
components of
depends on sum
-centered
far characte
between 200
s and links t
minant espec
nable with f
Union at th
e described
mber of sing
ast show bot
nternational
Asia in turn
al cooperati
ociation Euro
f the network.
m of publicatio
d multi-s
rized as a m
03 and 2007
triples in a d
cially inside
four compre
at point of t
d. The USA
gle authored
th a very int
cooperation
is characte
on especiall
opean Confe
ons
scalar TIS
multi-scalar
7 the overall
dispersed sp
e the Europe
ehensive MB
time. Major
and Canada
d papers and
tensive inter
n network is
rized by a q
ly among an
erence, Delft
S
setup with
ll network st
patial patter
ean Union (
BR research
r differences
a appear to
d correspon
rnal and ext
s most tight
quick expan
nd between
22
22
six n-
tructure
rn (see
(see
h
s in the
be the
ndingly
ternal
tly knit
nsion of
n South
621
622
623
624
625
626
627
628
629
630
631
632
633
634 635
636
637
638
639
640
Paper fo
Also in
that two
connect
French w
Compet
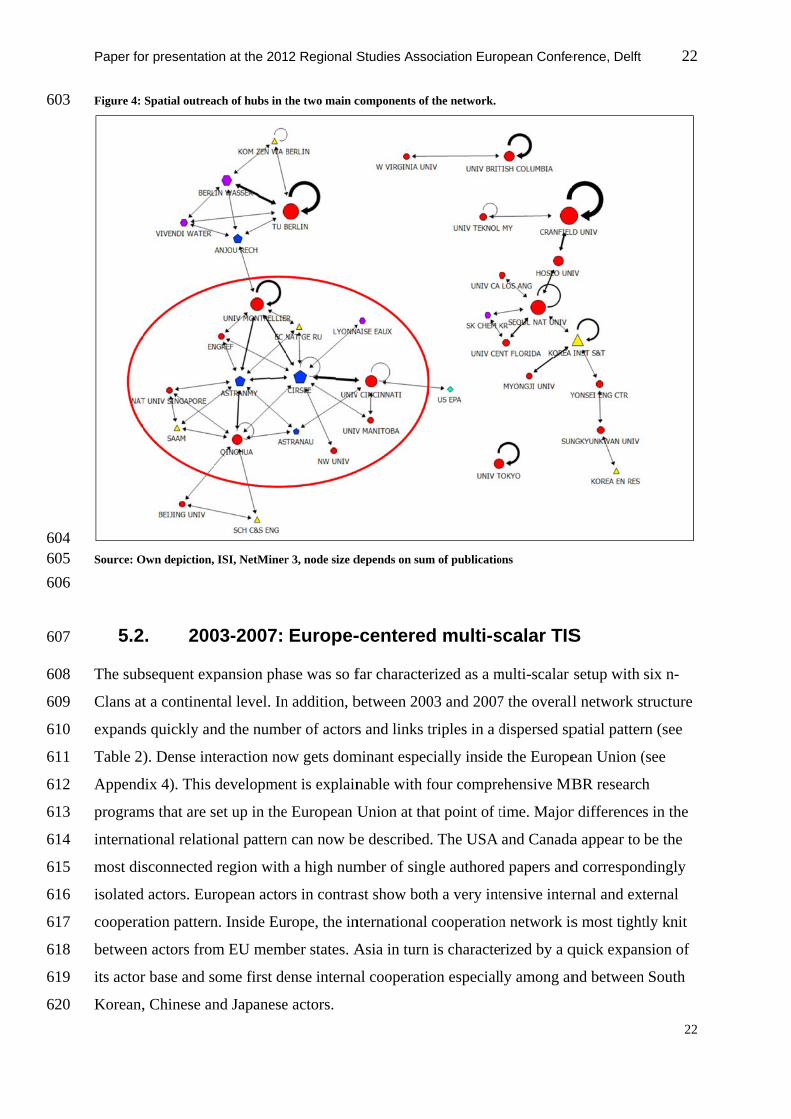
but the n
Berlin. A
in the da
fragmen
world.
Figure 5:
Source: IS
Compar
develop
central a
from Ch
or presentatio
this period,
o distinct hu
ted by the T
water comp
tence Centre
network aro
Apart from
ata, mainly
nting into a
n-Clans 2003-
SI web of knowl
ring the resu
pments. Firs
actors of the
hina and Ge
on at the 201
, most of the
ubs can now
Technical Un
panies is stil
e for Water
ound CIRSE
the largest
between Eu
main hub a
-2007
ledge, NetMine
ults of the n
st of all, both
e TIS have
ermany as a
12 Regional S
e 6 identifie
w be identifi
niversity of
ll important
are closely
EE has lost
network co
uropean and
and several i
er 3
nurturing an
h the overal
switched qu
n example o
Studies Asso
ed n-Clans a
ied which sp
f Berlin. Clu
t in the cent
y related to V
its central p
omponent, m
d/or Asian a
isolated sub
nd the expan
ll spatial set
uite dramati
occupy a ra
ociation Euro
are strongly
pan between
ustered coop
tral cluster (
Veolia, a lar
position to t
many other s
actors. The
b-networks i
nsion phase
tup and the
ically over a
ather periphe
opean Confe
y overlappin
n actors in t
peration in t
(Anjou Rech
rge French w
he technica
small comp
TIS as a wh
in different
reveals som
compositio
a short perio
eral position
erence, Delft
ng. Figure 5
the Europea
the network
herche and
water corpo
al university
ponents now
hole is thus
regions of
me interestin
on of the mo
od of time.
n in the netw
23
23
5 shows
an Union,
ks of
Berlin
oration),
y of
w appear
the
ng
ost
Actors
work
Paper for presentation at the 2012 Regional Studies Association European Conference, Delft 24
24
until 2003. Between 2003 and 2007, they multiply their activity and especially German actors 641
move to the central position, taking it over from the French company research network. This 642
shows that the spatial configuration of knowledge creation can change quite dramatically in a 643
short period of time, with possibly relevant implications also on other functions of the TIS. 644
Both the central scale and set of actors considerably differ between the first and second phase, 645
meaning that the spatial focus of TIS studies would have to be adapted accordingly. Secondly, 646
the core knowledge creating hub of the TIS also changed qualitatively from a company-647
dominated mode to a more transdisciplinary mode, connecting 7 universities, 5 companies, 5 648
research institutes, 3 government organizations and one company research institute. Finally, 649
the spatial setup of the TIS switched from a globalized to a slightly more multi-scalar setup. A 650
new important scale of interaction is being constructed by support programs of the European 651
Union, whereas European actors are at the same time still involved in global relations which 652
were established in the previous phase. 653
5.3. 2007-2009: Multi-scalar TIS connecting European and 654
Asian actors 655
In the last development phase interaction in the network gets very strong and a consolidation 656
happens with existing actors intensifying their ties in the main network component and fewer 657
new actors entering the field. Even though the number of very small components still 658
increases, most actors are now included in a very extensive central network component, 659
connecting 340 actors. 660
661
The results from section 4.3 describe the consolidation phase as a multi-scalar setup with 57 662
n-clans. The high number of (frequently overlapping) n-Clans in Table 4 makes interpretation 663
of the data more challenging. 664
665
Table 4: n-Clans 2007-2009 666
number of n-clans dominant region 35 EU 7 Asia 4 Germany 4 South Korea 3 EU and Asia 2 Global 1 China 1 Middle East
667
668
669
670
671
672
673
674
675
676
677
678
679
680
681
682
683
684
685
Paper fo
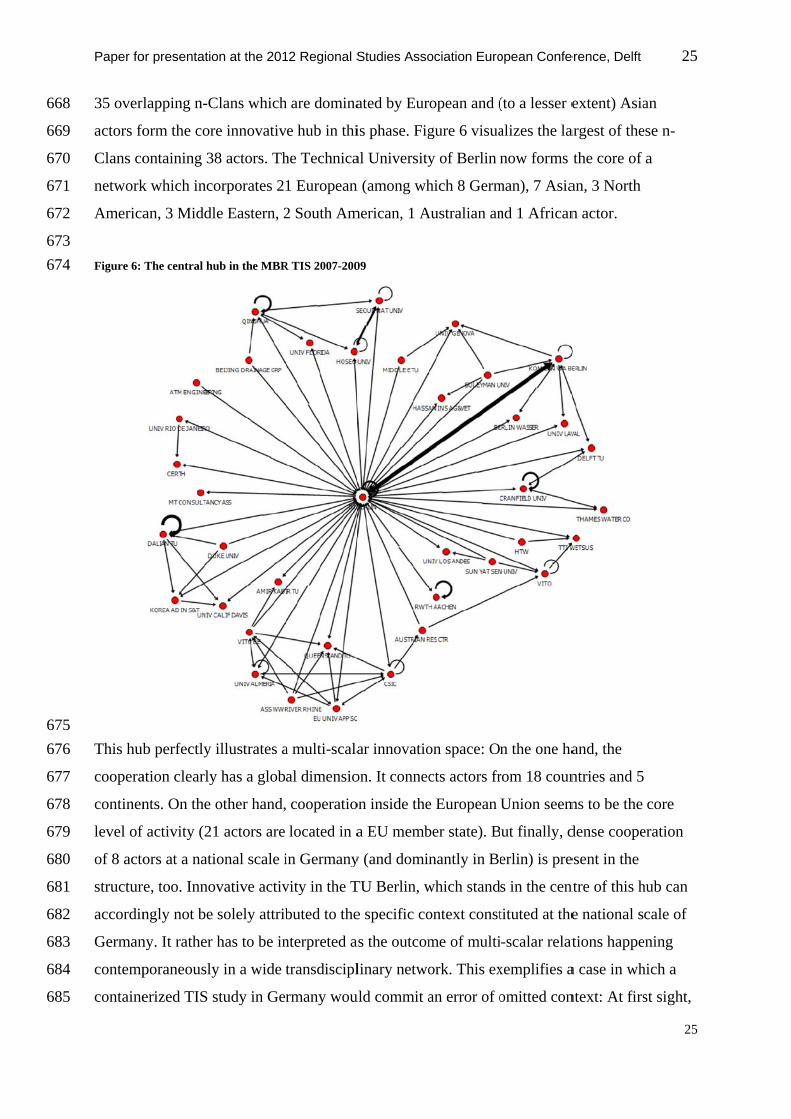
35 overl
actors fo
Clans co
network
America
Figure 6:
This hub
coopera
continen
level of
of 8 acto
structur
accordin
German
contemp
containe
or presentatio
lapping n-C
form the cor
ontaining 3
k which inco
an, 3 Middl
The central hu
b perfectly
ation clearly
nts. On the
f activity (21
ors at a nati
re, too. Inno
ngly not be
ny. It rather
poraneously
erized TIS s
on at the 201
Clans which
re innovativ
8 actors. Th
orporates 2
le Eastern, 2
ub in the MBR
illustrates a
y has a glob
other hand,
1 actors are
ional scale i
ovative activ
solely attrib
has to be in
y in a wide t
study in Ger
12 Regional S
h are domina
ve hub in thi
he Technica
1 European
2 South Am
R TIS 2007-200
a multi-scala
al dimensio
cooperatio
located in a
in Germany
vity in the T
buted to the
nterpreted a
transdiscipl
rmany wou
Studies Asso
ated by Eur
is phase. Fig
al University
n (among wh
merican, 1 A
09
ar innovatio
on. It connec
on inside the
a EU memb
y (and domin
TU Berlin, w
e specific co
as the outcom
linary netwo
uld commit a
ociation Euro
ropean and (
gure 6 visua
y of Berlin n
hich 8 Germ
Australian an
on space: O
cts actors fr
e European
ber state). B
nantly in Be
which stand
ontext const
me of multi
ork. This ex
an error of o
opean Confe
(to a lesser e
alizes the la
now forms
man), 7 Asia
nd 1 African
n the one ha
rom 18 coun
Union seem
ut finally, d
erlin) is pre
s in the cen
tituted at the
-scalar relat
xemplifies a
omitted con
erence, Delft
extent) Asia
argest of the
the core of
an, 3 North
n actor.
and, the
ntries and 5
ms to be the
dense coope
esent in the
ntre of this h
e national s
tions happe
a case in wh
ntext: At firs
25
25
an
ese n-
a
core
eration
hub can
cale of
ening
hich a
st sight,
Paper for presentation at the 2012 Regional Studies Association European Conference, Delft 26
26
the national scale in Germany contains some relevant innovative activity, but ultimately 686
German actors like the TU Berlin generate knowledge more strongly in an international 687
network. 688
689
In addition to this central hub, the n-Clan analysis now also reveals an extensive set of small 690
hubs at other scales. These clans show some internal cohesion, but at the same time all 691
contain actors which are connected to the central hub around the Technical University Berlin. 692
Only very few nearly isolated hubs exist. Most striking here is a small cohesive subgroup 693
formed by research institutes and companies from Israel, Spain, Turkey, China and Japan. 694
45 out of the 57 n-Clans contain cooperation at a “continental” scale, connecting actors from 695
closely neighboring countries. Most of them form in the European Union, but also in Asia or 696
the Middle East. 2 n-clans are still fully globalized, comprising equal amounts of actors from 697
at least 4 continents. In addition, 9 clans are now identifiable at a national scale. This 698
distribution on the one hand reflects the influence of the research programs of the European 699
Union on the spatial setup of knowledge creation. On the other hand it also shows the 700
increasing importance of Asian R&D support in the field, especially in South Korea and 701
China (Zheng et al., 2010). Interestingly no n-clan could be identified that is dominated by 702
North American actors. This finding interestingly corresponds with empirical studies which 703
claim that North American actors are indeed partly decoupled from mainstream research 704
activities and following a distinct technology development path focussing on side-stream 705
MBR systems (Wang et al., 2008). Summarizing, the last phase of development again differs 706
considerably from the previous phases. International, continental and national scales all 707
contain relevant hubs of interaction and the center of the core hub still stays in Europe, but 708
increasingly shifts towards Asia. This pattern thus perfectly exemplifies a multi-scalar TIS 709
setup. 710
5.4. Discussion 711
In the light of existing innovation system studies, the presented findings are remarkable for 712
two main reasons: First of all, international (or better multi-scalar) interaction is surprisingly 713
important in most evolution phases of the MBR TIS. This finding sustains our core argument 714
that innovation system research should explore multi-scalar processes and especially the 715
international scale more prominently. Secondly, our findings contradicts a linear spatial 716
diffusion model which would expect a TIS to develop in a specific place and then to trickle 717
Paper for presentation at the 2012 Regional Studies Association European Conference, Delft 27
27
down and expand to other spatial levels (local-regional-national-international) in consecutive 718
steps. Data on the MBR TIS suggest the exact opposite with knowledge creation forming 719
around several central actors around the world in the first stage. Only in later phases does the 720
knowledge creation network get geographically more differentiated and also reportedly spans 721
to other spatial scales, including first a continental and then a national scale. This pattern 722
matches better with ideas of Oinas (2000) and Rutten (2003), who supposed that the relevant 723
scale changes with phases of the innovation process; basic research being global, engineering 724
being territorially embedded and subsequent production getting global again. 725
726
As discussed before, the used dataset limited the empirical assessment to the knowledge 727
creation function. A full TIS however also comprises six other functions and a plethora of 728
interaction and exchange processes, which all feed back to system evolution. Despite clear 729
limitations of our data, it is nevertheless very likely giving hints on the relevant scales of 730
interaction in other functions at different points in time. As an example, the dense hub 731
spanning between German universities, companies and authorities in the last phase increases 732
the likelihood that other functions of the MBR TIS (like entrepreneurial experimentation, 733
guidance of the search or creation of positive externalities) are developing in the respective 734
space, too. In contrast, the strongly globalized knowledge creation hub in the first phase could 735
indicates that the entrepreneurial experimentation and other functions were likely restricted to 736
that international TNC scale, too. Anecdotal evidence from visits at MBR trade fairs and 737
conferences supports this point. In other cases, our data however also missed on important 738
functional patterns. Entrepreneurial experimentation and market formation as an example 739
were likely not exclusively based on French actors in the first phase, but also on companies 740
from North America and especially Japan. As these actors did not participate strongly in 741
scientific publications, their influence on knowledge creation appears to be underevaluated in 742
our publication data. Also market formation as an example happened in Japan, the US, South 743
Korea and the EU in a very diversified spatial pattern which is not derivable from the 744
presented data. Such processes defining other TIS functions would thus have to be analyzed in 745
more detail and with other methodologies. The presented framework thus allows getting a 746
rough feeling of spatial system boundaries, relevant actors and scales in the innovation 747
process and different actors’ position in knowledge creation of an emerging TIS. For a 748
comprehensive understanding of the global TIS as a whole, a more encompassing and mixed 749
method approach would have to be applied. 750
751
Paper for presentation at the 2012 Regional Studies Association European Conference, Delft 28
28
Our analysis did also underemphasize the institutional dimension of TIS. From a co-752
publication network we cannot directly derive implications for the institutional dimension. 753
However, the results section presented some evidence on how national and European 754
institutional contexts (like the implementation of research programs and related industrial 755
policy in the EU and Asia) created relevant scales of knowledge creation. Our results 756
furthermore revealed that the influence of such institutional interventions shape the innovation 757
processes also in more distant places of the TIS. National policy making is thus much more 758
intertwined with institutional contexts in other places than what could be expected from 759
existing TIS studies. We also sustain that a global mapping of institutional contexts of a TIS 760
similar to what was done in this study for knowledge creation could be a very interesting way 761
forward for theory development in the TIS field. 762
763
Thirdly, the results might be subject to some biases originating from the used dataset and 764
methodology. Firstly, the high importance of international linkage in all development phases 765
of the MBR TIS might be partially attributable to the bias of publications from ISI web of 766
knowledge towards research in international projects and published in international journals 767
(Andrew J., 2009). For a more balanced view one would have to integrate other data types 768
like patents or licenses and possibly publications from non-ISI journals into the analysis. This 769
could create a more comprehensive actor set and add important insights into spatial dynamics 770
in the knowledge development at a sub-national scale. Besides patent or license data, one 771
could try to extract relational data also conference participation lists, affiliation information 772
from industry associations, participation in websites, blogs and social networks or 773
participation of different TIS actors in research, industry, or informal exchange networks. 774
Even in the light of these data issues, we maintain that in the presented case co-publication 775
data is still indicative as scientific publication represents the core of the knowledge creating 776
network of the MBR TIS. This might be different in other technology fields, so the data 777
sources would have to be adapted accordingly. Furthermore, data limitations do not challenge 778
the usefulness of the developed conceptual and analytical framework. Once more data on 779
other functions gets available, the same frame could be applied and be used for assessing the 780
spatial dynamics in other TIS functions. 781
782
Finally, this study far from exploited the vast potential that lies in the toolset of social network 783
analysis. We only scratched the surface of possibilities. One could add a position and role 784
analysis or try to correlate network properties to innovative performance of TIS actors. Also 785
Paper for presentation at the 2012 Regional Studies Association European Conference, Delft 29
29
longitudinal data analysis and modeling of network dynamics could potentially be used to 786
forecast future spatial setups of the system. 787
6. Conclusions 788
This paper aimed at discussing the implications of the currently a-spatial practice in 789
identifying the system boundaries in TIS studies and to illustrate how a a spatialized TIS 790
framework could contribute to identifying meaningful linkages and relationships with other 791
(territorial) types of systems of innovation. As showed in the literature discussion, adding 792
space to the TIS concept could be a crucial step in avoiding an increasing reification of the 793
concept and its empirical application. The developed analytical framework is an answer to 794
second research question. It showed that setting spatial system boundaries a posteriori and 795
with a relational, multi-scalar conception of space allows for a more differentiated 796
interpretation of relevant processes and scales of innovation than conventional TIS analysis. 797
The empirical case study revealed that knowledge creation in the MBR technology TIS 798
changed substantially in a short period of time from a transnational company-based nurturing, 799
to a Europe-based expansion and finally to a multi-scalar, Europe- and Asia based 800
consolidation phase. This implies that TIS space is dynamic and innovation processes can 801
change quickly both in their spatial outreach and quality. A more reflected spatial perspective 802
in TIS research could therefore be used for new explanations on where and when specific 803
innovations develop, for the diffusion of innovative activity and for the relevance of 804
interrelated processes at places which seem to be unrelated at first sight. Our results contradict 805
the existing assumption in existing studies that all relevant processes in a TIS actually work at 806
a national scale. Developments in distant parts of the world might be more closely connected 807
than expected by mono-scalar TIS studies. If as an example knowledge creation in the MBR 808
TIS in South Korea is supported by a government program, then knowledge creation in 809
Berlin’s universities and companies will likely profit directly through its dense links with 810
South Korean actors. 811
812
Our results furthermore provide evidence that the international scale might be more relevant 813
for innovation processes in TIS than can be expected from existing literature. We thus argue 814
in line with Carlsson (Carlsson, 2006) that this scale needs more attention in future conceptual 815
and empirical work. Our results also indicate that the “global technological opportunity set” 816
should not be understood as a geographic neutral and ubiquitous resource for TIS actors. It is 817
Paper for presentation at the 2012 Regional Studies Association European Conference, Delft 30
30
rather has to be characterized as a dynamically evolving network structure to which actors 818
with different relational positions have different access at different points in time (e.g. in a 819
first phase French companies were central, later German universities, which strongly changed 820
the set of actors which could access the produced knowledge). 821
822
Reconsidering the conceptualization of space and spatial boundary setting in TIS studies 823
could finally help to avoid errors in boundary setting. One can argue that national boundaries 824
are only legitimate in 1) mono-scalar, national TIS setups or 2) in multi-scalar TISs where 825
actors from the country in focus are both interacting at a national scale and also integrated 826
into the central innovative hub of the TIS. In our example, only Germany, South Korea and 827
China fulfil these conditions and not in every point in time. Focussing national studies of the 828
MBR technology TIS on Germany, South Korea or China in the time period between 2003 829
and 2009 is arguably legitimate (though potentially affected by errors of omitted context), as 830
their actors are present in the core hub of innovative activity and combine the requested kinds 831
of internal (national) cohesion and strong link to the central knowledge creating hub. 832
Focussing on the US on the other hand would rather have produced an isolation error, as US 833
actors follow a distinct spatial networking pattern and technological trajectory. Doing 834
nationally delimited TIS studies in the nurturing phase, finally, would in all countries have 835
produced system misinterpretation errors: Both the overall TIS structure and the central 836
knowledge creation hub were dominated by globally operating companies at that time, so 837
national delimitation would not have identified the core actor and spatial level of the system. 838
839
This also implies a central lesson for policy making: innovation and industrial policy and 840
especially subsidies for specific technologies should be responsive to the spatial setup of TIS 841
structures and functioning. National policy intervention in a globalized (and in some specific 842
cases multi-scalar) TIS setup bears the risk of becoming effective at another, unintended 843
spatial scale. Interventions should therefore be designed in a way that avoids supporting 844
effects from flowing off to other spatial scales or which consciously profits from the 845
opportunities stemming from multi-scalar interaction: As an example, tapping into innovation 846
networks at a global scale and a proactive promotion and management of strategic 847
international couplings might have been considerably underrated as a policy option, especially 848
in newly industrializing countries (Binz et al., 2012). 849
850
Paper for presentation at the 2012 Regional Studies Association European Conference, Delft 31
31
Future TIS research could be inspired by this contribution in three ways: Firstly, one could 851
extend this analytical framework more strongly to the sub-national level and use it as a 852
spatially fully differentiated analytical tool for the “knowledge development and diffusion” 853
function in TIS. Secondly, spatially sensitive studies of other TIS functions would be possible 854
with similar frameworks. We argue that a better spatial conceptualization of TIS functions 855
could open fruitful ways forward for theory development. Thirdly, our results could feed into 856
a spatialized TIS lifecycle theory. Understanding which scales are relevant in what fields of 857
technology and at what phase of system development could generate important input for 858
improving theory development and policy advice here. Finally, our study just covers one 859
narrow field of water recycling technology. Similar studies in other technological fields (and 860
especially in environmental technologies already covered by TIS research) would help to get a 861
better understanding of the spatial errors incorporated in existing TIS studies and to formulate 862
strategies on how to avoid them in future studies. We therefore strongly encourage more work 863
in this exciting field of inquiry. 864
865
866
867
868
869
870
871
872
873
874
875
876
877
878
879
880
881
882
883
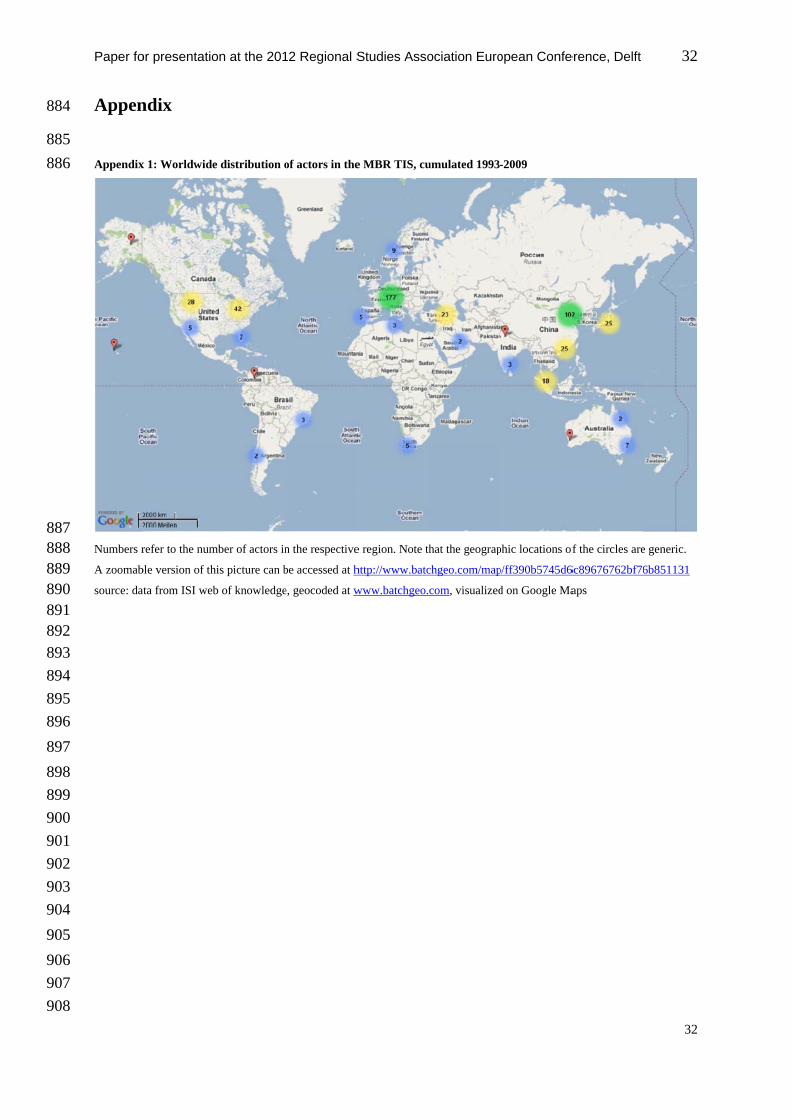
884
885
886
887 888 889 890 891 892 893
894
895
896
897
898
899
900
901
902
903
904
905
906
907
908
Paper fo
Appen
Appendix
Numbers r
A zoomab
source: da
or presentatio
ndix
x 1: Worldwide
refer to the num
ble version of th
ata from ISI web
on at the 201
e distribution o
mber of actors in
his picture can b
b of knowledge
12 Regional S
of actors in the
n the respective
be accessed at h
e, geocoded at w
Studies Asso
e MBR TIS, cu
e region. Note th
http://www.batc
www.batchgeo.
ociation Euro
umulated 1993-
hat the geograp
chgeo.com/map
com, visualized
opean Confe
-2009
phic locations of
p/ff390b5745d6
d on Google Ma
erence, Delft
f the circles are
6c89676762bf76
aps
32
32
e generic.
6b851131
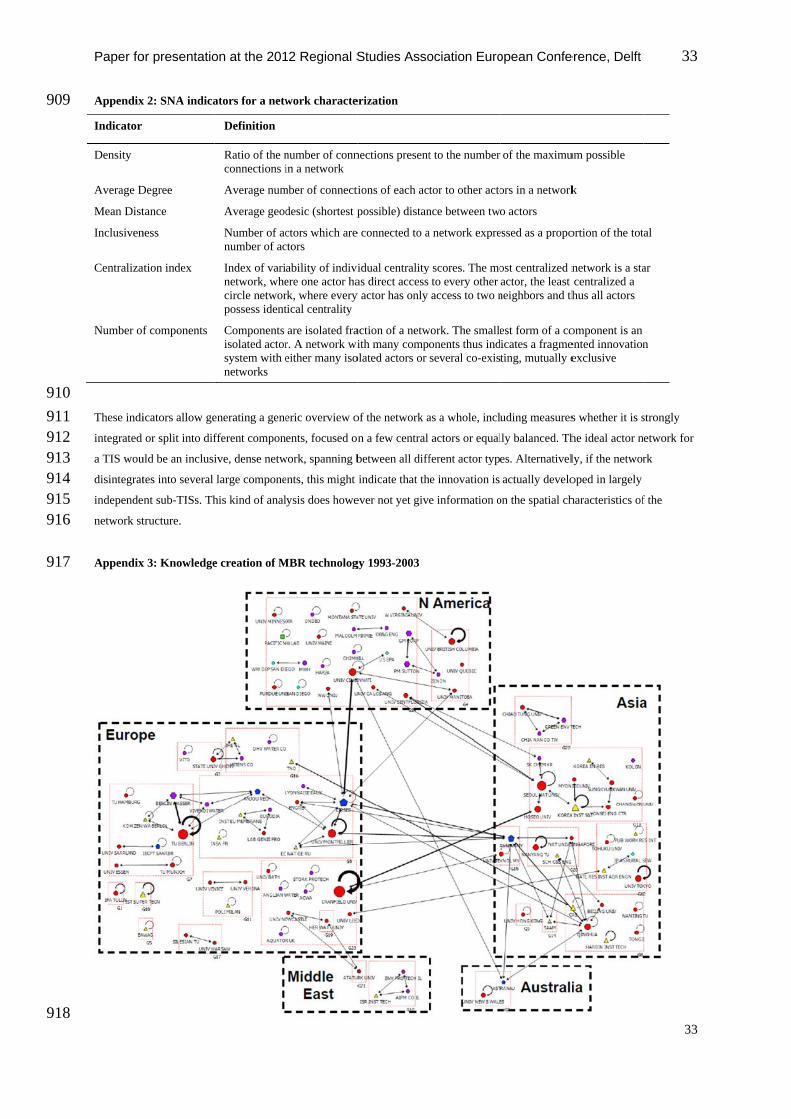
909
910
911 912 913 914 915 916
917
918
Paper fo
Appendix
Indicator
Density
Average D
Mean Dist
Inclusiven
Centraliza
Number of
These indi
integrated
a TIS wou
disintegrat
independe
network st
Appendix
or presentatio
x 2: SNA indica
Degree
tance
ness
ation index
f components
icators allow ge
or split into dif
uld be an inclusi
tes into several
ent sub-TISs. Th
tructure.
x 3: Knowledge
on at the 201
ators for a netw
Definition
Ratio of the nconnections i
Average num
Average geod
Number of acnumber of ac
Index of varinetwork, whecircle networpossess ident
Components isolated actorsystem with enetworks
enerating a gene
fferent compon
ive, dense netw
large compone
his kind of anal
e creation of M
12 Regional S
work characte
number of connin a network
mber of connecti
desic (shortest p
ctors which are ctors
ability of indiviere one actor hark, where every tical centrality
are isolated frar. A network wieither many iso
eric overview o
ents, focused on
work, spanning b
ents, this might
ysis does howe
MBR technolog
Studies Asso
erization
nections present
tions of each ac
possible) distan
e connected to a
idual centralityas direct access
y actor has only
action of a netwith many comp
olated actors or
of the network a
n a few central
between all diff
indicate that th
ever not yet giv
gy 1993-2003
ociation Euro
t to the number
tor to other acto
nce between tw
a network expre
y scores. The moto every other access to two n
work. The smalleonents thus indseveral co-exis
as a whole, incl
actors or equal
ferent actor typ
he innovation is
e information o
opean Confe
of the maximu
ors in a network
o actors
essed as a propo
ost centralized nactor, the least
neighbors and th
est form of a coicates a fragmeting, mutually e
uding measures
lly balanced. Th
es. Alternativel
actually develo
on the spatial ch
erence, Delft
um possible
k
ortion of the tot
network is a stacentralized a hus all actors
omponent is an ented innovationexclusive
s whether it is s
he ideal actor n
ly, if the networ
oped in largely
haracteristics of
33
33
al
ar
n
strongly
etwork for
rk
f the
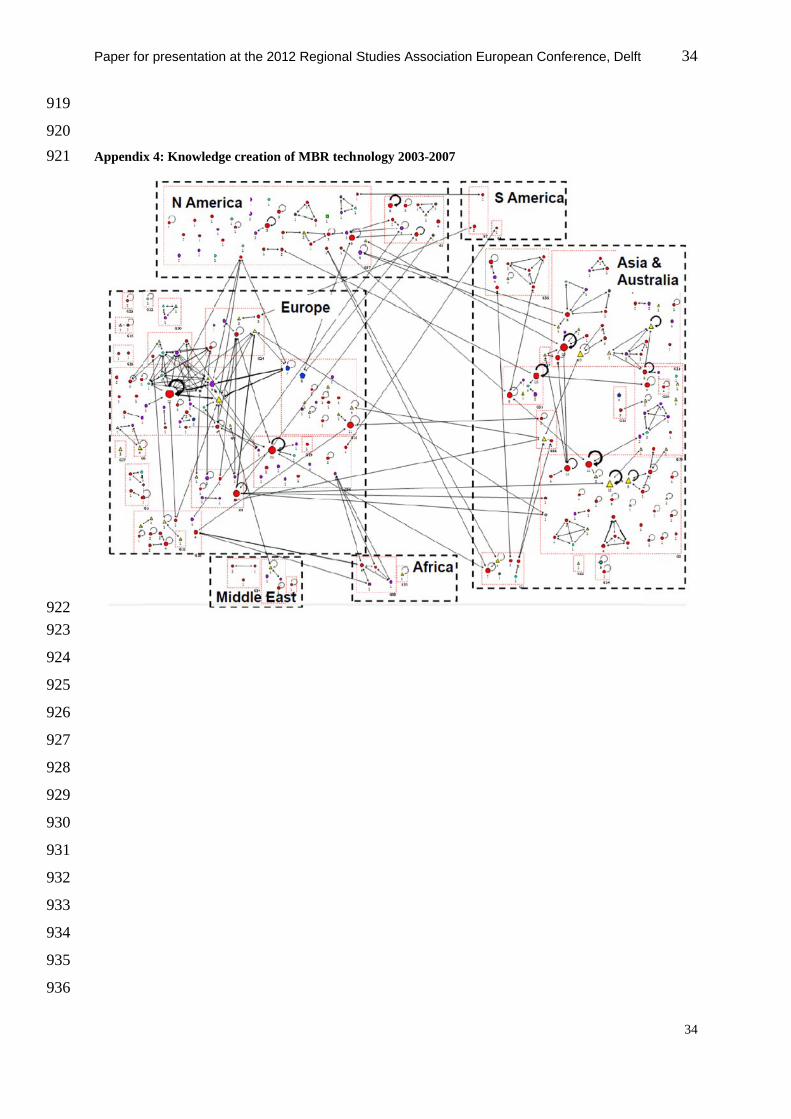
919
920
921
922
923
924
925
926
927
928
929
930
931
932
933
934
935
936
Paper fo
Appendi
or presentatio
ix 4: Knowled
on at the 201
dge creation o
12 Regional S
of MBR techn
Studies Asso
nology 2003-
ociation Euro
2007
opean Confeerence, Delft 34
34
Paper for presentation at the 2012 Regional Studies Association European Conference, Delft 35
35
References 937
Amin, A., 2002. Spatialities of globalisation. Environ.Plann.A 34, 385-399. 938
Andrew J., N., 2009. Measuring knowledge spillovers: What patents, licenses and 939 publications reveal about innovation diffusion. Research Policy 38 (6), 994-1005. 940
Angel, D., Rock, M.T., 2009. Environmental rationalities and the development state in East 941 Asia: Prospects for a sustainability transition. Technological Forecasting & Social Change, 76 942 (2), 229-240. 943
Asheim, B., Coenen, L., 2006. Contextualising Regional Innovation Systems in a Globalising 944 Learning Economy: On Knowledge Bases and Institutional Frameworks. Journal of 945 Technology Transfer 31, 163-173. 946
Bathelt, H., Gluckler, J., 2003. Toward a relational economic geography. Journal of Economic 947 Geography 3 (2), 117-144. 948
Bergek, A., Jacobsson, S., Carlsson, B., Lindmark, S., Rickne, A., 2008a. Analyzing the 949 functional dynamics of technological innovation systems: A scheme of analysis. Research 950 Policy 37 (3), 407-429. 951
Bergek, A., Jacobsson, S., Sandén, B.A., 2008b. 'Legitimation' and 'development of positive 952 externalities': Two key processes in the formation phase of technological innovation systems. 953 Technology Analysis and Strategic Management 20 (5), 575-592. 954
Bergek, A., Jacobsson, S., Carlsson, B., Lindmark, S., Rickne, A., 2008c. Analyzing the 955 functional dynamics of technological innovation systems: A scheme of analysis. Research 956 Policy 37 (3), 407-429. 957
Bergek, A., Jacobsson, S., 2003. The Emergence of a Growth Industry: A Comparative 958 Analysis of the German, Dutch and Swedish Wind Turbine Industries. In: Metcalfe, J.S., 959 Cantner, U. (Eds.), Change, Transformation and Development. Physica-Verlag (Springer), 960 Heidelberg, pp. 197-228. 961
Berkhout, F., Angel, D., Wieczorek, A., 2009. Sustainability transitions in developing Asia: 962 Are alternative development pathways likely? Technological Forecasting & Social Change 76 963 (2), 215-217. 964
Binz, C., Truffer, B., forthcoming. 965 Reconceptualizing niche upscaling in emerging Asia with multiscalar technological 966 innovation systems – the case of on-site water recycling in Beijing. 967
Binz, C., Truffer, B., 2012. 968 Technological innovation systems in multiscalar space. Analyzing an emerging water 969 recycling industry with social network analysis. Geographica Helvetica 66 (4), 260. 970
Binz, C., Truffer, B., Li, L., Shi, Y., lu, Y., 2012. Prospective analysis of leapfrogging 971 trajectories – An analytical framework and a case study in the Chinese wastewater sector. 972 Technological Forecasting and Social Change 79 (1), 155-171. 973
Paper for presentation at the 2012 Regional Studies Association European Conference, Delft 36
36
Boggs, J.S., Rantisi, N.M., 2003. The relational turn in economic geography. Journal of 974 Economic Geography 3, 109-116. 975
Boschma, R.A., Lambooy, J.G., 2002. Knowledge, market structure, and economic 976 coordination: Dynamics of industrial districts. Growth and Change 33 (3), 291-311. 977
Boschma, R.A., 1997. New industries and windows of locational opportunity: a long-term 978 analysis of Belgium. Erdkunde 51 (1), 12-22. 979
Brenner, T., Cantner, U., Fornahl, D., Fromhold-Eisebith, M., Werker, C., 2011. Regional 980 innovation systems, clusters, and knowledge networking. Papers in Regional Science 90 (2), 981 243-249. 982
Bunnell, T.G., Coe, N.M., 2001. Spaces and scales of innovation. Progress in Human 983 Geography 25 (4), 569-589. 984
Camagni, R., Maillat, D., 2006. Milieux innovateurs. Economica, Paris. 985
Carlsson, B., 1997. Technological systems and industrial dynamics. Springer, Boston and 986 Dordrecht. 987
Carlsson, B., 2006. Internationalization of innovation systems: A survey of the literature. 988 Research Policy 35 (1), 56-67. 989
Carlsson, B., Jacobsson, S., Holmen, M., Rickne, A., 2002. Innovation systems: Analytical 990 and methodological issues. Research Policy 31 (2), 233-245. 991
Carlsson, B., Stankiewicz, R., 1991. On the nature, function and composition of technological 992 systems. Journal of Evolutionary Economics 1 (2), 93-118. 993
Coe, N.M., Bunnell, T.G., 2003. 'Spatializing' knowledge communities: towards a 994 conceptualization of transnational innovation networks. Global Networks 3 (4), 437-456. 995
Coenen, L., Benneworth, P., Truffer, B., accepted. Towards a spatial perspective on 996 sustainability transitions. Research Policy. 997
Cooke, P., Gomez Uranga, M., Etxebarria, G., 1997. Regional innovation systems: 998 Institutional and organisational dimensions. Research Policy 26 (4-5), 475-491. 999
de la Tour, A., Glachant, M., Ménière, Y., 2011. Innovation and international technology 1000 transfer: The case of the Chinese photovoltaic industry. Energy Policy 39 (2), 761-770. 1001
Dewald, U., Truffer, B., 2012. The Local Sources of Market Formation: explaining regional 1002 growth differentials in German photovoltaic markets. European Planning Studies, 420. 1003
Dicken, P., Malmberg, A., 2001. Firms in Territories: A Relational Perspective. Economic 1004 Geography 77 (4), 345-363. 1005
Fane, A.G., Fane, S.A., 2005. The role of membrane technology in sustainable decentralized 1006 wastewater systems. Water Science and Technology 51 (10), 317-325. 1007
Paper for presentation at the 2012 Regional Studies Association European Conference, Delft 37
37
Freeman, C., 1987. Technology and economic performance: lessons from Japan. Pinter, 1008 London. 1009
Geels, F.W., 2002. Technological transitions as evolutionary reconfiguration processes: a 1010 multi-level perspective and a case-study. Research Policy 31, 1257-1274. 1011
Gleick, P.H., 1998. Water in crisis: Paths to sustainable water use. Ecological Applications 8 1012 (3), 571-579. 1013
Glückler, J., 2007. Economic geography and the evolution of networks. Journal of Economic 1014 Geography 7 (5), 619-634. 1015
Hekkert, M., Suurs, R., Negro, S., Kuhlmann, S., Smits, R., 2007. Functions of innovation 1016 systems: A new approach for analysing technological change. Technological Forecasting and 1017 Social Change 74 (4), 413-432. 1018
Jacobsson, S., Bergek, A., 2011. Innovation system analyses and sustainability transitions: 1019 Contributions and suggestions for research. Environmental Innovation and Societal 1020 Transitions 1 (1), 41-57. 1021
Jacobsson, S., 2008. The emergence and troubled growth of a 'biopower' innovation system in 1022 Sweden. Energy Policy 36 (4), 1491-1508. 1023
Jacobsson, S., Sandén, B.A., Bångens, L., 2004. Transforming the energy system-the 1024 evolution of the German technological system for solar cells. Technology Analysis and 1025 Strategic Management 16 (1), 3-30. 1026
Judd, S., Judd, C., 2006. The MBR book. Elsevier, Oxford. 1027
Kastelle, T., Steen, J., 2010. Using network analysis to understand innovation. Innovation: 1028 Management, Policy and Practice 12, 2-4. 1029
Katz, J.S., Martin, B.R., 1997. What is research collaboration? Research Policy 26 (1), 1-18. 1030
Kemp, R., Schot, J., Hoogma, R., 1998. Regime Shifts to Sustainability Through Processes of 1031 Niche Formation: The Approach of Strategic Niche Management. Technology Analysis & 1032 Strategic Management 10 (2), 175-195. 1033
Krackhardt, D., Stern, R.N., 1988. Informal Networks and Organizational Crises: An 1034 experimental simulation. Social Psychology Quarterly 51 (2), 123-140. 1035
Lesjean, B., Huisjes, E.H., 2008. Survey of the European MBR market: trends and 1036 perspectives. Desalination 231 (1-3), 71-81. 1037
Lundvall, B., 1992. National Systems of Innovation - toward a Theory of Innovation and 1038 Interactive Learning. Pinter, London. 1039
Lundvall, B., 1988. Innovation as an interactive process: from user-producer interaction to the 1040 national system of innovation. In: Dosi, G., Freeman, C., Nelson, R., Silverberg, G., Soete, L. 1041 (Eds.), Technical Change and Economic Theory. Pinter, London, pp. 349-369. 1042
Paper for presentation at the 2012 Regional Studies Association European Conference, Delft 38
38
Malerba, F., 2002. Sectoral systems of innovation and production. Research Policy 31 (2), 1043 247-264. 1044
Markard, J., Stadelmann, M., Truffer, B., 2009. Prospective analysis of technological 1045 innovation systems: Identifying technological and organizational development options for 1046 biogas in Switzerland. Research Policy 38, 655-667. 1047
Markard, J., Truffer, B., 2008a. Actor oriented analysis of innovation systems: Exploring 1048 micro-meso level linkages in the case of stationary fuel cells. Technological Analysis and 1049 Strategic Management 20 (4), 443-464. 1050
Markard, J., Truffer, B., 2008b. Technological innovation systems and the multi-level 1051 perspective: Towards an integrated framework. Research Policy 37, 596-615. 1052
Marshall, A., 1920. Principles of Economics. 8th editionMacmillan and Company Ltd., 1053 London. 1054
Maskell, P., Bathelt, H., Malmberg, A., 2006. Building Global Knowledge Pipelines: The 1055 Role of Temporary Clusters. European Planning Studies 14, 997-1013. 1056
Musiolik, J., Markard, J., in press. Creating and shaping innovation systems: Formal networks 1057 in the innovation system for stationary fuel cells in Germany. Energy Policy. 1058
Negro, S.O., Hekkert, M.P., 2008. Explaining the success of emerging technologies by 1059 innovation system functioning: The case of biomass digestion in Germany. Technology 1060 Analysis and Strategic Management 20 (4), 465-482. 1061
Negro, S.O., Suurs, R.A.A., Hekkert, M.P., 2008. The bumpy road of biomass gasification in 1062 the Netherlands: Explaining the rise and fall of an emerging innovation system. Technological 1063 Forecasting and Social Change 75 (1), 57-77. 1064
Nelson, R., 1993. National Innovation Systems: A Comparative Analysis. Oxford University 1065 Press, New York. 1066
Oinas, P., 2000. Distance and learning: does proximity matter? In: Boekema, F., Morgan, K., 1067 Bakkers, S., Rutten, R. (Eds.), Knowledge, innovation and economic growth the theory and 1068 practice of learning regions. Edward Elgar, Cheltenham. 1069
Porter, M.E., 1998. Clusters and the new economics of competition. Harvard Business 1070 Review 76 (November-December 1998), 77-90. 1071
Rutten, R., 2003. Knowledge and Innovation in Regional Industry: an entrepreneurial 1072 coalition. Routledge, London. 1073
Ter Wal, A.L.J., Boschma, R.A., 2009. Applying social network analysis in economic 1074 geography: Framing some key analytic issues. Annals of Regional Science 43 (3 SPEC. ISS.), 1075 739-756. 1076
Tödtling, F., Trippl, M., 2005. One size fits all? Towards a differentiated regional innovation 1077 policy approach. Research Policy 34 (8), 1203-1219. 1078
Paper for presentation at the 2012 Regional Studies Association European Conference, Delft 39
39
Wang, Z., Wu, Z., Mai, S., Yang, C., Wang, X., An, Y., Zhou, Z., 2008. Research and 1079 applications of membrane bioreactors in China: Progress and prospect. Separation and 1080 Purification Technology 62 (2), 249-263. 1081
Wasserman, S., Faust, K., 1994. Social Network Analysis: Methods and Applications. 1082 Cambridge University Press, Cambridge. 1083
Wenger, E., 1998. Communities of practice Learning, meaning, and identity. Cambridge 1084 University Press, Cambridge, UK. 1085
Yeung, H.W., 2005. Rethinking relational economic geography. Transactions of the Institute 1086 of British Geographers 30 (1), 37-51. 1087
Zheng, X., Zhou, Y., Chen, S., Zheng, H., Zhou, C., 2010. Survey of MBR market: Trends 1088 and perspectives in China. Desalination 250, 609-612. 1089
1090