Embed Size (px)
Citation preview

Journal ofResearch in Rural Education, Fall, 2000, Vol. 16, No.2, 63-140
Why Rural Matters:The Need for Every State to Take Action on Rural Education
Elizabeth Beeson and Marty StrangeRural School and Community Trust
Fully one quarter ofAmerica's school-age children attend public schools in rural areas or small towns. But if youlisten to the education policy debate, chances are you will not hear much about them. In most of the 50 states, it is theeducation ofurban children that gets nearly all ofthe attention. This report aims to adjust that picture by bringing ruralschools and communities into focus. Rural kids, their schools, and their communities do matter. And in many states,action on behalfof rural schools needs to be an urgent priority.
This is the first in a series of reports on the context ofrural education in the 50 states. We believe it is the firstattempt to describe the importance of rural education ineach of the 50 states, and to suggest the urgency with whichpolicymakers should address the needs of rural schools andcommunities.
One fourth of U.S. schoolchildren go to schools in rural areas or small towns of less than 25,000 population.Fourteen percent go to school in even smaller places withfewer than 2,500 people. But these children, and the communities and schools they live and study in, are largelyunnoticed in the national debate over the direction of American education. While policymakers, advisors, and scholars debate-and they should-the wisdom of alternativepolicies for urban schools, and for special education students or second language learners, or for poor and minority students, we rarely read serious analysis of the particularpolicy issues faced by students who live in rural places.
This void is not a matter of indifference as much as it .is a matter of constituency. Rural people are so widely dispersed that they are politically invisible. They are a demographic and political majority in only five states (Maine,Mississippi, South Dakota, Vermont, and West Virginia)and a handful of congressional districts. Even in states witha numerically large rural population, rural people are oftena particularly small demographic minority. California has2.2 million rural people-more than all but seven statesbut they constitute less than 8% of California's population.
Rural people are scattered among many jurisdictions,with varying degrees of local control. They are citizens ofremote places too numerous to count, each with distinguishing socioeconomic characteristics that make fact findingdifficult and conclusions elusive.
Correspondence concerning thisarticleshouldbeaddressedto Elizabeth Beeson, Rural School andCommunity Trust, P.O. Box650, Burleigh Farm Road, Holderness, NH 03245. ([email protected])
There is a further problem. We have generally definedeconomic progress as growth, and for most communities,the idea of "development" has specially meant eliminatingwhat makes us rural. In this view, any special problems ofrural places will go away with growth and development.And without growth and development, these rural placesthemselves will eventually go away. So there is a persistent attitude that if we close our eyes, sooner or later, oneway or another, the "rural problem" will just go away. Thesolution for rural people trapped in these social problemshas frequently been to move on (west), to move in (to thecity), orto move up (to someplace prosperous).
Finally, there is the frustration over the lack of a precise demographic definition of "rural." This lament seemsto be obligatory in every analysis of rural America. But itobscures a more fundamental cultural dilemma. We are anurban society now, one that is pretty sure we know what"urban" is, but not at all sure we know what "rural" is.
So talking and thinking seriously about rural education as a public policy issue is understandably a problemfor our society, and, for the most part, we do not do it.
But despite this reluctance to discuss rural education,realities persist that make it necessary. Among those realities:
People persistently choose to live in rural areas if they can make a living there. Each generation sees a "renaissance" of interest in ruralcommunities and a spurt of growth in certainchosen places. We are deep into such a renaissance now.
Rural America is as diverse as urban America,especially among the young. Minorities constituted 17% of all rural residents in 1997.Well over one third of the rural population ofeach of the four minority groups was under

64 BEESON AND STRANGE
age 18 in 1997, compared with only one fourthof the rural white population.
Rural America is far poorer than metropolitan areas as a whole, and nearly as poor ascentral cities. Of the 250 poorest counties inAmerica, 244 are rural. Poverty is especiallyprevalent among rural minorities. In fact, ifyou are African-American, your chances ofliving in poverty are greater if you live in rural America than if you live in the inner city.And this rural poverty is not all in Appalachia and the deep South. The Great Plains,the Southwest, the northern reaches of NewEngland and the Great Lakes states, as wellas other regions, are matted with persistentlypoor rural places.
Some of our most urban states are also ourmost rural states. Only one in ten New Jerseyites lives in a rural place, but that's morerural people than there are in Maine, wheremore than half the population lives in suchsmall places. A higher percentage of Pennsylvanians live in rural places than Kansans.And more rural Americans live in New YorkState than in Idaho, Montana, Nebraska, Nevada, North Dakota, South Dakota, Utah, andWyoming combined. In fact, the West is ourmost urban region, demographically speaking. Twice as many people live in places under 2,500 east of the Mississippi than west ofit. Nevada rivals Rhode Island as our mostdemographically urban state.
Schools throughout rural America tend to be numerous and small, both by necessity and by community preference. They tend to be close to the communities they serve.They are places where students, teachers, parents and administrators know each other. They are different from manyschools in larger places.
While they have many of the same needs as otherschools, they also face some problems that are different,creating challenges for policymakers. Among these special problems:
recruitment and retention of rural teachers,principals, and administrators is strained byprofessional isolation and chronically lowersalaries than larger schools in larger places;
• long bus rides eat away at children's time forstudy, play, and family, while high transportation costs whittle away at funds for instruction;
teachers are expected to teach both in and outof the field in which they are certified;
high per-pupil costs contrast low levels of discretionary spending; and
distance and sparsity make these schools lastto be connected to the digital world that mighthelp solve the curricular problems associatedwith distance and sparsity.
Gauging Rural Education in 50 the States
Education policy is largely the province of state government, so our analysis of rural education considers eachstate individually and in relation to the other states. Usingstandard data sources, sometimes requiring special data runswe requested, we analyze and compare the states on twomeasures, or gauges, of concern for their rural schools andcommunities. In all cases, we use the most conservativedefinition of "rural" that we can-the Census definition ofplaces with 2,500 or fewer people.
J. Rural Importance Gauge: How important is it tothe overall educational performance of each state to explicitly address the particular needs of schools serving itsrural communities? Eight indicators of the scale, proportion; and challenge of rural education in the state are considered.
The percentage of the state's population living in rural places with 2,500 or fewer people(1990 Census of Population and Housing).States that score high on this indicator tendto be very rural, and to have relatively smallpopulations-they look and feel very rural.The higher the percentage, the more important "rural" is to the state.
. The number of people living in rural placeswith 2,500 or fewer people (1990 Census ofPopulation and Housing). Many states scorehigh ·on this indicator that score low on theprevious one. These are states in which a largerural population is a small demographic minority. The higher the number of rural people,the more important "rural" is to the state.
• Percentage of public schools in rural areas,(U.S. Department of Education, National Center for Education Statistics, Common Core ofData, Public School Universe, 1997-98). Thisindicator includes schools offering any gradelevel, and excludes schools that are not oper-

WHY RURAL MATTERS 65
ating. This indicator scores high for states thathave not pursued school closing strategies andoften have many small schools. The higherthe percentage of schools in rural areas, themore important "rural" is to the state.
Percentage of students enrolled in rural schools (U.S. Department of Education, NationalCenter for Education Statistics, CommonCore of Data, Public School Universe, 199798). This indicator scores high in states thathave kept rural schools open, but also in statesthat have built larger schools in rural areas.The higher the percentage, the more important "rural" is to the state.
Percentage of students enrolled in rural schools who are minorities (U.S. Department ofEducation, National Center for Education Statistics, Common Core of Data, Public SchoolUniverse, 1997-98). This indicates rural schools with a substantial at-risk student population. The higher the percentage of minoritystudents in rural schools, the more important"rural" is to the state.
Ratio of average number of rural students toaverage number of grades in rural schools(U.S. Department of Education, National Center for Education Statistics, Common Core ofData, Public School Universe, 1997-98). Because schools have various grade configurations, average daily enrollment is not a goodindicator of school size. This ratio is a betterindicator of the average size of rural schools.The lower the ratio, the smaller schools are,and the more important "rural" is to the state'spolicy considerations.
Percentage of all students who attend smallrural schools (U.S. Department of Education,National Center for Education Statistics,Common Core of Data, Public School Universe, 1997-98). This is the number of students who live in rural areas and attendschools with enrollments below the state median, divided by the number of students in allpublic schools in the state - a measure of howprevalent the small and rural school experience is in the state. The higher the percentageof students attending small rural schools, themore important "rural" is to the state.
Percentage of rural children in poverty (U.S.Department of Education, National Center forEducation Statistics, Common Core of Data,Agency Universe and special census tabulation, 1990). This is another indicator of ruralschools with a substantial at-risk studentpopulation. The higher the state's percentageof rural children in poverty, the more important "rural" is to the state.
2. Rural Urgency Gauge: Given conditions in thestate's rural schools and communities, how urgent is it ineach state that policy makers develop explicit rural education policies? Eleven indicators are used to quantify theneed for concern, including some that compare the conditions in the state's rural schools with those of its nonruralschools.
Average rural teaching salary (U.S. Department of Education, National Center for Education Statistics, Schools and Staffing SurveyPublic School Teacher Questionnaire, 199394). Indicates how the rural parts of the statecompete with other rural areas in other statesfor teacher pay. The lower the average ruralteaching salary, the more urgent it is that policymakers give attention to rural education.
Difference between average rural teacher salaries and teacher salaries in the rest of the state(U.S. Department of Education, National Center for Education Statistics, Schools and Staffing Survey, Public School TeacherQuestionnaire, 1993-94). Indicates how ruralareas of the state compete with nonrural areas of the state for teacher pay. The higherthe disparity, the more urgent it is that policymakers give attention to rural education.
Percentage of students who are free lunch eligible, 1997-98 (U.S. Department of Education, National Center for Education Statistics,Common Core of Data, Public School Universe, 1997-98). This is the best measure ofthe level of poverty and near poverty in schools, and is an indicator of how much economicstress rural schools cope with. The higher thepercentage of students eligible for free lunch,the more urgent it is that policy makers giveattention to rural education.

66 BEESON AND STRANGE
• Percentage of rural communities scoring below national average on Education ClimateIndex (Cross tabulation of public schools bystate: ECI and metro status. Prepared by Quality Education Data, Denver, CO, 1997-98).The Education Climate Index measures socioeconomic status by zip code, using income,educational attainment, and occupation. Thehigher the percentage of rural communitiesin a state that score below the national average on the ECI, the more urgent it is that statepolicymakers give attention to rural education.
• Average rural student-to-teacher ratio (U.S.Department of Education, National Center forEducation Statistics, Common Core of Data,Public School Universe, 1997-98). This is aproxy for class size. The higher the averageratio, the more urgent it is that policymakersgive attention to rural education.
Percentage of rural householders with lessthan 12 years of school and no diploma (U.S.Department of Education, National Center forEducation Statistics, Common Core of Data,Agency Universe, 1997-98). These are ruralpeople 15 years of age and older who havenot completed high school. The higher the percentage, the more urgent it is that policymakers give attention to rural education.
Percentage of rural schools with Internet access, 1997-98 (Cross tabulation of public schools by state: Internet access and metrostatus. Prepared by Quality Education Data,Denver, CO, February, 2000). The lower thepercentage, the more urgent it is that policymakers give attention to rural education.
• Percentage of out-of-field teachers who arein rural schools (U.S. Department of Education, National Center for Education Statistics,Schools and Staffing Survey, Public SchoolTeacher Questionnaire, 1993-94). The higherthe rural percentage of out-of-field teachers,the more urgent it is that policymakers giveattention to rural education.
• Average percentage of rural school expenditures spent on instruction (U.S. Departmentof Education, National Center for EducationStatistics, Common Core of Data, AgencyUniverse, 1995-96). The lower the average
percentage spent on instruction, the more urgent it is that policymakers give attention torural education.
• Percentage of rural schools with declining enrollment of ten percent or more between 1993and 1997 (U.S. Department of Education,National Center for Education Statistics,Common Core of Data, Public School Universe, 1997-98). This indicates schools operating in a stressful economy and usuallycoping with reduced revenue. The higher thepercentage of rural schools with declining enrollment, the more urgent it is that state policymakers give attention to rural education.
The percentage of the state's population living in rural places with 2,500 or fewer people(1990 Census of Population and Housing).States that score high on this indicator tendto be very rural, and to have relatively smallpopulations-they look and feel very rural.The higher the percentage of people living inrural places, the more urgent it is that policymakers give attention to rural education.
The indicators included in these gauges were selectedon the basis of how well they contributed to the generalgauge questions and data availability. Many potential indicators were omitted, either because rural data cannot bebroken out from state level data (e.g., SAT scores, transportation revenues, access to higher education, adult literacy) or because data are not reliably collected in all states(e.g., dropout rates and National Assessment of EducationalProgress test scores, because many heavily rural states donot participate in NAEP).
Sometimes, the best indicators available for every stateand by rural locale have been included here despite the factthat the data is relatively old. Data on teacher salaries isfrom 1993, for example. We know that some states havemade explicit efforts to increase salaries, often as part ofnew state accountability systems. But for the sake of consistency, we have included only those data sources that comprehensively cover all (or very nearly all) 50 states. Everyeffort was made to collect the most recent data available.We know that future iterations of this report, which we hopeto publish every 2 years, will have much more current data.
Results
The results of this analysis are summarized below. Thedetailed data and scores are presented in the summariesthat follow for each of the 50 states and for the 18 indicators.
WHY RURAL MATTERS
To "gauge" the importance of rural education and the urgency of need for policy action in each state, we rankedstates using the following procedure:
Data were collected for each indicator by state and locale. Each indicator carries the same weight. Thereare seven unique indicators in the Importance Gauge and ten unique indicators in the Urgency Gauge. Thepercentage of population living in rural areas was an indicator common to both gauges.
• Each state was placed in rank order on each indicator for each gauge, with a score of 1 being the mostimportant or urgent.
All of the state rankings were added and then divided by the number of indicators to give a cumulativeranking for each state (see below).
States were ordered by their average ranking and then divided into quartiles that place the states in relativeposition along a spectrum describing how important rural education is to the state's educational systemrelative to other states (ranging from "Useful" to "Important" to Very Important" to "Crucial") and howurgent it is that policymakers address rural education (ranging from "Fair" to "Serious" to "Critical" to"Urgent").
67
Discussion
The categories merely describe a state's relative position along a continuum. When evaluating the urgency ofpolicy attention to rural matters, there is no bright line distinguishing New Mexico as "urgent" from Montana asmerely "critical." Likewise, the difference in importancebetween Vermont as "crucial" and Alaska as merely "veryimportant" are negligible. However, these categories do allow us to group states into certain clusters in order to discuss patterns in the findings.
There is a cluster of seven states where rural education is simply crucial to the state's educational performanceand where the need for attention is urgent. These states arelocated in the western Black Belt and Mississippi Delta(Alabama, Arkansas, and Mississippi-note that Louisiana barely misses the urgent ranking), in the heart of Appalachia (Kentucky and West Virginia), and in the core ofthe Northern Plains (North Dakota and South Dakota-notethat Montana barely misses Urgent ranking). These regionsare chronically depressed, suffer large areas of out-migration, and are deeply distressed by changes in the globaleconomy. Six of these seven states rank in the top ten inrural student poverty and all rank in the top one third in atleast six of the urgency indicators. Declining enrollment inschools is widespread in these states, teacher pay is ratherconsistently low, rural adults have low levels of educationalattainment, and communities rank low in the EducationalClimate Index (all seven states are in the top one thirdamong states in urgency on this indicator). If the states areranked on the basis of the combined raw scores on bothgauges, these seven states are joined by their near neighbors Louisiana, Montana, and Oklahoma as the top ten stateswhere rural education is important and needs are urgent.
At the other end of the spectrum are eight states thatrank low on both gauges - seven states on the East Coastfrom Maryland northward (Connecticut, Delaware, Maryland, Massachusetts, New Jersey, New York, and RhodeIsland), plus Hawaii. Although these are among our mosturban states, there are over 6.6 million rural people in them.However, rural poverty and minority rates are relativelylow, and communities are much more likely to be stressedby growth and sprawl than to be distressed by populationdeclines and shrinking enrollments. Rural schools in thesestates are larger than in most other states, a product of consolidation and urbanization.
Another group offive states, all in the Southeast (Tennessee, South Carolina, Louisiana, and Georgia) and theSouthwest (New Mexico), score "urgent" on the UrgencyGauge but less than "crucial" on the Importance Gauge.Consolidation and the removal of schools from rural areashave simply removed much of rural education from ruralcommunities in these states. They rank relatively high inthe number of rural people and in the percentage of population living in rural areas, but much lower in the averagesize of rural schools, the percentage of public school students enrolled in rural schools, and the percentage of students attending small rural schools. If these statesreconsidered their school size policy, and located smallerrural schools closer to rural communities, they would scorevery high on the importance gauge. It is a weakness in thescoring system that they do not score higher than they doon the Importance Gauge. There is no mistake that the needfor rural policy is urgent. They score in the top third inurgency indicators more than four times as often as theyscore in the bottom third. All score in the top ten on one ormore urgency indicators.

68 BEESON AND STRANGE
Importance Gauge Cumulative Rankings*
How important is it to the overall educational performance ofeach state to explicitly address the particular needs ofschools serving its rural communities?
Crucial Very Important Important Useful
SD 12.5 AK 18.5 TX 25.0 AZ 31.6AR 13.3 IA 19.0 VA 25.0 CA 32.4ND 13.8 LA 19.5 MN 25.1 FL 32.8MS 14.0 NE 20.0 GA 26.4 DE 33.9WV 14.6 KS 20.1 OR 27.1 NY 34.8OK 15.1 SC 20.1 MI 27.4 UT 34.9MT 15.3 MO 20.5 IN 28.5 HI 36.3NC 16.8 NM 21.0 CO 29.0 MD 36.6KY 17.3 WY 21.3 WA 29.5 NV 36.8AL 17.4 WI 22.6 OH 30.5 CT 38.4ME 17.8 NH 23.3 PA 31.0 MA 40.1ID 18.1 TN 23.5 IL 31.4 NJ 43.4VT 18.3 RI 46.0
*Numbersare rounded
Urgency Gauge Cumulative Rankings
Given conditions in the state's rural schools and communities, how urgent is it in each state that policymakers developexplicit rural education policies?
Urgent Critical Serious Fair
MS 13.0 MT 20.3 IN 25.1 TX 28.5KY 14.8 IL 20.3 KS 25.3 WA 28.5AR 15.0 OK 21.1 OR 25.5 CO 28.5SD 15.8 MO 21.3 CA 25.8 NH 28.6ND 16.4 ID 22.5 FL 26.1 NE 29.2TN 18.3 WI 22.5 PA 26.1 DE 30.3LA 18.6 AZ 23.3 ME 26.3 MD 30.3SC 18.9 VT 23.6 OH 26.5 HI 32.7AL 19.1 IA 23.7 AK 26.6 NY 35.2
V'fV 19.2 VA 24.2 NC 27.0 MA 35.3GA 19.5 MN 24.4 UT 27.9 CT 35.8NM 20.1 WY 24.7 NV 28.0 RI 40.1
MI 24.8 NJ 40.5
Seven states score "critical" on the Importance Gaugebut less than "urgent" on the Urgency Gauge. There is littlegeographic pattern to this group-Alaska, Idaho, Maine,Montana, North Carolina, Oklahoma, and Vermont. Sparsity of settlement and rugged terrain are common featuresin many of these states and, except for North Carolina, theseare states with small schools. Their average rank is IO"onthe percentage of schools in rural areas, the percentage of
students enrolled in rural schools, and (if you exclude NorthCarolina) small average rural school size. Their averagerank is 13th on the percentage of students attending smallrural schools. North Carolina is an odd fit here. Its strengthon the Importance Gauge is due to its large number andpercentage of rural population, and to its large rural minority population. Although none of these states rank "urgent"on the Urgency Gauge, four of the seven rank "critical"

WHY RURAL MATTERS 69
(Idaho, Montana, Oklahoma, and Vermont). There is nopattern, however, to their scoring on any indicators, withthe possible exception that all seven of these states rankeither in the top ten (Montana, Oklahoma; and Alaska) orthe bottom ten (Idaho, Vermont, Maine, and North Carolina) for urgency in the rate of rural school Internet access.
Of the remaining states, only four score above average on both gauges: Iowa, Missouri, Wisconsin, and Wyoming, These are states with a high percentage of studentsin rural schools and in small schools, a relatively high percentage of out-of-field teachers serving rural schools, below-average rural teacher pay (except Wisconsin), and asharp disparity between their rural and nonrural teachers(except Wyoming).
The rest of the states score moderately on both gauges.But we want to emphasize that no matter where a statescores on these gauges, every child, including every ruralchild is important. And every state can improve the policyclimate within which its rural schools operate. Nebraskamay relish its "fair" urgency rating, but cannot be sanguineabout its capacity to recruit and retain good rural teacherswhile ranking fourth lowest in rural teacher salaries. Illinois, Michigan, and Minnesota may rank relatively low onthe importance gauge because they are predominately large,urban states, but they are home to almost 5.8 million ruralpeople, and their rank of I, 3 and 4, respectively, on ruralteacher pay disparity is a disservice to rural children.
And that brings us to a final point. Note that the Importance Gauge is a measure ofthe importance to that particular state that it explicitly address rural education. That'sbecause this report is directed to the attention of state education leaders and policymakers, and of the rural peoplethey serve. Some very large states, with very large ruralpopulations, may score relatively lower than other stateswith smaller rural populations, simply because the first statehas very large urban populations and second state is farmore rural overall. Thus, it may be more important forVermont's educational performance that its policymakersconsider the rural dimensions of its educational system thanit is for California's policymakers to do so. But from a national perspective, it is at least as important for Californiato consider the educational needs of its 2.2 million people
living in rural places as it is for Vermont to consider theeducational needs of the 381,000 Vermonters who live inrural places. And from the perspective of rural Californians,it is certainly every bit as important that California have arural education policy as it is to Vermonters that Vermontdoes. Thus while the rankings in this report are useful inidentifying states where rural education is paramount togood schooling in the state, it is also useful in identifyingstates where rural communities' educational needs may beunjustly lost in the political shuffle of state politics. Nochild deserves to be lost in the shuffle.
Conclusion
As far as we know, this is the first time data of thiskind has been assembled to describe the relative importance of rural education in each of the 50 states and to suggest the relative urgency with which policymakers shouldaddress the needs of rural schools and communities. Wehope to update this analysis every other year. We knowthat more recent data will soon be available from severalsources. We know that some important data on studentachievement may soon be available from the states themselves. We hope to be able to add new indicators aboutschool facilities, school finance, and other important topics. It is important to note that many indicators we wouldlike to have included in this analysis could not be includedbecause rural data cannot be isolated from statewide data.
In each interim year, beginning next year, we intendto prepare a more detailed analysis of the policies withwhich selected states approach (or do not approach) theproblems of their rural schools and communities. Unlikethe Importance and Urgency Gauges presented here, whichmeasure the relative position of each state among the 50,the Policy Context Gauge will assess individual policieson the basis of specific criteria, and score the states basedon absolute policy performance. These analyses will beintensive, based on raw data from state sources, and wewill select states based on criteria that in large part reflectthe results of the analysis of importance and urgency presented here.

STATE-By-STATE
RESULTS(IN ALPHABETICAL ORDER BY STATE)

STATE-BY-STATE RESULTS 71
\
oAL51us
oAL.US
IEJAL nonrural
oAL rural
16.4
Urgency Gauge
24.1
33.4
45
Percent of rural minority students
Percent of rural students in poverty
Percent of householders with less than12 years of school (no diploma)
oAL.us
oALII us
oAL rural
.AL nonrural
13
24.8
I23
$27,287
Importance Gauge
Percent of populationliving in rural places
39.6
Average base teacher salary
Percent of public school studentsenrolled in rural schools
$26,095
ALABAMA ranks very high in the percentage of rural students who live inpoverty and in the percentage who are minorities. Nearly half of rural adults inthe state have less than a 12th grade education, and less than half of rural schoolshave Internet access, both among the worst rates in the nation. Rural educationis crucial in Alabama, and conditions make it urgent that policymakers give ittheir attention.
Importance Gauge AL Rank
A rank of 1 is mostimportant
Percentof state's 39.6% 14population that is rural
Number of rural people 1,601,038 17
Percentof public 27.3% 23schools in rural areas
Percentof public school23%students enrolledin 17
rural schools
Percentof studentsenrolledin rural schools 33.4% 8whoare minorities
Average number ofstudents to average 67.4 29number of grades
Percentof rural students 9.2% 22attending smallschools
Percentof rural studentsin poverty 24.1% 9
Urgency Gauge AL Rank
A rank of 1 is mosturgent
Average rural teacher's $26,095 17salary
Difference between ruralteachersalariesand
$1,192 41teachersalariesin therest of the state
Percentof rural studentswhoare free lunch 40.7% IIeligible
Percentof ruralcommunities scoring 55.7% 5belowaverage on theEducation Climate Index
Average rural studentto 16.7 16teacherratio
Percentof rural45% 5householders with less
than 12yearsof school
Percentof rural schoolswith Internet access 48.7% 3
Percentof teachersteaching out-of-field 20.6% 25whoare rural
Percentof ruralexpenditures spenton 55.2% 37instruction
Percentof rural schoolswith declining
17% 36enrollments of at least10%

72 BEESON AND STRANGE
\
oAK.US
oAK rural
.AKnonrural
oAK rural
.AKnonrural
22.6
13.3
Urgency Gauge
54.3
28.2
39.1
Percent of students who arefree lunch eligible
Percent of householders with less than12 years of school (no diploma)
Percent of public schools in rural areas
oAK
.US
oAK rural
.AKnonrural
23
16.4
oAK.US
69.3
Importance Gauge
Average base teacher salary
$44,127$45,434
Percent of public school studentsenrolled in rural schools who are
minorities
Percent of rural minority students
Over half of ALASKA'S public schools are in rural areas. Its rural schoolsare the smallest on average in the nation, and are among the most heavily attended by minorities (Alaska Natives). It has the highest average rural teachersalary, and has the second lowest rate of rural schools with Internet access.Rural education is very important in Alaska and in serious need of policy attention.
Importance Gauge AK Rank
A rank of 1 is mostimportant
Percentof state's 32.5% 22population that is rural
Numberof rural people 178,808 46
Percentof public 54.3% 7schoolsin rural areas
Percentof publicschool23%students enrolledin 17
rural schools
Percentof studentsenrolledin rural schools 69.3% 2whoare minorities
Average number ofstudents to average 13.5 Inumberof grades
Percentof rural students 8.6% 26attending small schools
Percentof rural studentsin poverty 15.7% 27
Urgency Gauge AK Rank
A rank of 1 is mosturgent
Average rural teacher's $44,127 50salary
Difference between ruralteachersalaries and
$1,307 40teachersalariesin therest of the state
Percentof rural studentswhoare free lunch 39.1% 13eligible
Percentof ruralcommunities scoring 19.8% 19belowaverage on theEducation ClimateIndex
Averagerural studentto 14.5 31teacherratio
Percentof rural28.2% 26householders with less
than 12yearsof school
Percentof rural schoolswith Internet access 47% 2
Percentof teachersteaching out-of-field 28% 18whoare rural
Percentof ruralexpenditures spenton 52.6% 27instruction
Percentof rural schoolswithdeclining
12% 45enrollments of at least10%

STATE-BY-STATE RESULTS 73
\
oAZ.US
oAZ.us
oAZ rural
.AZ nonrural
18
22.6
32.2
Urgency Gauge
35.7
34.3
Percent of rural students in poverty
Percent of householders with less than12 years of school (no diploma)
Percent of public schools in rural areas
oAZ.us
oAZ.us
oAZ rural
.AZ nonrural
24.8
16.4
41.1
Importance Gauge
Percent of populationliving in rural places
Percent of rural studentswho are minorities
Average base teacher salary
ARIZONA is one of the least rural states, but its rural children are among
the most likely to be minorities and to live in poverty. Its rural schools spenda relatively low percentage of their budgets on instruction. The state's need toaddress rural education policy is critical.
Importance Gauge AZ Rank
A rankof 1 is mostimportant
Percent of state's 12.5% 46population that is rural
Number of ruralpeople 458,255 37
Percent of public 11.1% 46schools in ruralareas
Percent of publicschool5% 47students enrolled in
rural schools
Percent of studentsenrolled in ruralschools 41.1% 6whoare minorities
Average number ofstudents to average 56.8 24number of grades
Percent of rural students 3.6% 45attending smallschools
Percent of ruralstudentsin poverty 35.7% 2
Urgency Gauge AZ Rank
A rankof 1 is mosturgent
Average rural teacher's $28,693 30salary
Difference between ruralteacher salaries and
$2,717 26teacher salaries in therest of the state
Percent of ruralstudentswhoare free lunch N/A N/Aeligible
Percent of ruralcommunities scoring 15.2% 20below average on theEducation Climate Index
Average ruralstudent to 17.4 9teacher ratio
Percent of rural34.3% 16householders withless
than 12yearsof school
Percent of ruralschools 26with Internet access 77.3%
Percent of teachersteaching out-of-field 7% 45whoare rural
Percent of ruralexpenditures spenton 44.5% 2instruction
Percent of rural schoolswithdeclining
24% 13enrollments of at least10%

74 BEESON AND STRANGE
\
DAR.US
DAR.US
DAR rural
.ARnonrural
22.6
Urgency Gauge
25.9
42.2
43.7
Percent of rural students in poverty
Percent of householders with less than12 years of school (no diploma)
Percent of public schools in rural areas
DAR.US
DAR.US
DAR rural
.ARnonrural
13
24.8
46.5
29.4
Importance Gauge
Percent of populationliving in rural places
Average base teacher salary
Percent of public school studentsenrolled in rural schools
ARKANSAS leads the nation in the percentage of its students who attend
small, rural schools, and is among the leaders in the percentage of rural chil
dren in poverty. Rural teacher salaries are among the lowest in the nation, as is
the rate of rural school Internet access. Rural education is crucial to Arkansas'
children, and policymakers urgently need to give it their attention.
Importance Gauge AR Rank
A rank of 1 is most important
Percent of state's 46.5% IIpopulation that is rural
Number of rural people 1,092,704 25
Percent of public 42.2% 14schools in rural areas
Percent of public school29.4% 10students enrolled in
rural schools
Percent of studentsenrolled in rural schools 16.5% 20who are minorities
Average number ofstudents to average 50.1 18number of grades
Percent of rural students 17.9% Iattending small schools
Percent of rural studentsin poverty 25.9% 7
Urgency Gauge AR Rank
A rank of 1 is most urgent
Average rural teacher's $24,114 9salary
Difference between ruralteacher salaries and
$3,196 22teacher salaries in therest of the state
Percent of rural studentswho are free lunch 42.4% 9eligible
Percent of ruralcommunities scoring 67.2% 2below average on theEducation Climate Index
Average rural student to 16.4 18teacher ratio
Percent of rural43.7% 7householders with less
than 12 years of school
Percent of rural schoolswith Internet access 58% 5
Percent of teachersteaching out-of-field 32.4% IIwho are rural
Percent of ruralexpenditures spent on 56.2% 40instruction
Percent of rural schoolswith declining
17% 31enrollments of at least10%

STATE-BY-STATE RESULTS 75
\
DCA.US
DCA.US
DCA rural
.CA nonrural
18
22.6
21.1
Urgency Gauge
Percent of rural students in poverty
Percent of householders with less than12 years of school (no diploma)
Percent of public schools in rural areas
DCA.US
DCA.US
DCA rural
.CA nonrural
24.8
16.4
Importance Gauge
Percent of populationliving in rural places
29.7
Average base teacher salary
Percent of rural minority students
Among all states, CALIFORNIA has the smallest percentage of its popula
tion living in rural areas, but the eighth largest rural population nonetheless. Ithas the highest rural student-to-teacher ratio in the nation and the seventh high
est percentage of rural schools experiencing declining enrollment. The size of
the rural population alone makes rural education worthy of attention and con
ditions in rural schools make the need for policy action serious.
Importance Gauge CA Rank
A rankof 1 is mostimportant
Percent of state's 7.4% 50population that is rural
Number of rural people 2,188,700 8
Percent of public 6.1% 49schools in rural areas
Percent of public school2.1% 50students enrolled in
rural schools
Percent of studentsenrolled in rural schools 29.7% 12who are minorities
Average number ofstudents to average 49.7 17number of grades
Percent of rural students 1.4% 48attending small schools
Percent of rural students25in poverty 16.4%
Urgency Gauge CA Rank
A rank of 1 is mosturgent
Average rural teacher's $33,151 40salary
Difference between ruralteacher salaries and
$5,686 9teacher salaries in therest of the state
Percent of rural studentswho are free lunch 43.5% 7eligible
Percent of ruralcommunities scoring 8.9% 25below average on theEducation Climate Index
Average rural student to 19.4 Iteacher ratio
Percent of rural16.9% 46householders with less
than 12 years of school
Percent of rural schoolswith Internet access 61.3% 7
Percent of teachersteaching out-of-field 5.8% 48who are rural
Percent of ruralexpenditures spent on 57.6% 44instruction
Percent of rural schoolswith declining
30% 7enrollments of at least10%
76 BEESON AND STRANGE
\
oCO.US
oCO rural
.CO nonrural
oCO rural
.COnonrural
22.6
Urgency Gauge
24.3
21.4 21.9
Percent of students who arefree lunch eligible
19.6 18.4
[]
Percent of householders with less than12 years of school (no diploma)
Percent of public schools in rural areas
oCO
.US
oCO.us
oCO rural
.COnonrural
60.7
24.8
Importance Gauge
Percent of populationliving in rural places
Average base teacher salary
Average number of rural students tonumber of grades
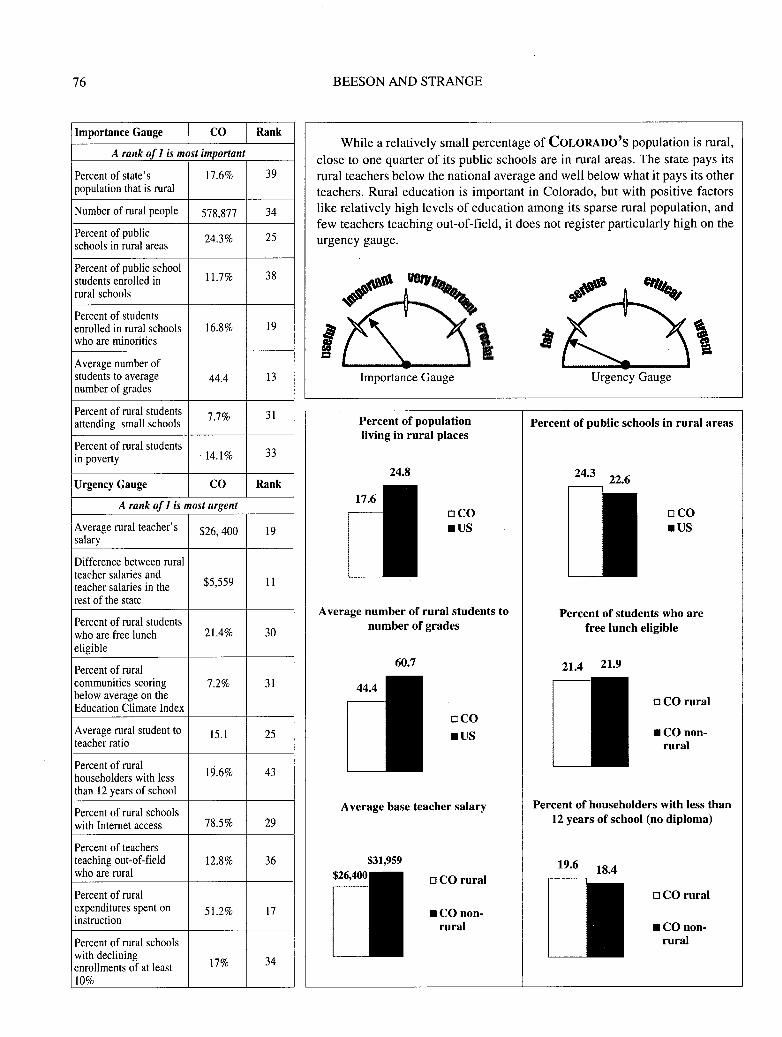
While a relatively small percentage of COLORADO'S population is rural,close to one quarter of its public schools are in rural areas. The state pays itsrural teachers below the national average and well below what it pays its otherteachers. Rural education is important in Colorado, but with positive factorslike relatively high levels of education among its sparse rural population, andfew teachers teaching out-of-field, it does not register particularly high on theurgency gauge.
Importance Gauge CO Rank
A rank of 1 is mostimportant
Percent of state's 17.6% 39population that is rural
Number of rural people 578,877 34
Percent of public 24.3% 25schools in rural areas
Percent of publicschool11.7% 38students enrolled in
rural schools
Percent of studentsenrolled in rural schools 16.8% 19whoare minorities
Average number ofstudents to average 44.4 13number of grades
Percent of rural students 7.7% 31attending smallschools
Percent of rural students33in poverty . 14.!%
Urgency Gauge CO Rank
A rank of 1 is mosturgent
Average rural teacher's $26,400 19salary
Difference between ruralteacher salaries and
$5,559 11teacher salaries in therestof the state
Percent of rural studentswhoare free lunch 21.4% 30eligible
Percent of ruralcommunities scoring 7.2% 31belowaverage on theEducation Climate Index
Average rural studentto IS.! 25teacher ratio
Percent of rural19.6% 43householders with less
than 12yearsof school
Percent of rural schoolswith Internet access 78.5% 29
Percent of teachersteaching out-of-field 12.8% 36whoare rural
Percent of ruralexpenditures spenton 51.2% 17instruction
Percent of rural schoolswithdeclining
17% 34enrollments of at least10%

STATE-BY-STATE RESULTS 77
\
oCT.US
oCT.US
oCT rural
.CTnonrural
18
Urgency Gauge
89
Percent of rural students in poverty
Average number of rural students tonumber of grades
Percent of householders with less than12 years of school (no diploma)
oCT.US
oCT.US
oCT rural
.CT nonrural
24.8
Importance Gauge
Percent of populationliving in rural places
12.6 13
Average base teacher salary
Percent of public school studentsenrolled in rural schools
CONNECTICUT has more rural people than most would suspect (more
than Maine or Nebraska and twice as many as North Dakota). But despite verylow levels of rural poverty, Connecticut's rural schools have low rates of Internetaccess and their teachers suffer one of the larger pay disparities compared totheir nonrural colleagues. While the urgency and importance of rural education are less in Connecticut than in other states, policymakers still need to attend to these issues
Importance Gauge CT Rank
A rank of1 is most important
Percent of state's 20.9% 36population that is rural
Number of ruralpeople 685,568 32
Percent of public 15.7% 43schools in rural areas
Percent of publicschool12.6% 36students enrolled in
rural schools
Percent of studentsenrolled in rural schools 6.2% 32whoare minorities
Average number ofstudents to average 89.0 39number of grades
Percent of ruralstudents 5.1% 41attending smallschools
Percent of ruralstudents48in poverty 5.7%
Urgency Gauge CT Rank
A rank of 1 is most urgent
Average rural teacher's $42,909 49salary
Difference between ruralteacher salaries and
$5,241 12teacher salaries in therest of the state
Percent of ruralstudentswhoare free lunch 5.9% 43eligible
Percent of ruralcommunities scoring 0% 45below average on theEducation Climate Index
Average rural student to 13.8 37teacherratio
Percent of rural16.6% 47householders with less
than 12 yearsof school
Percent of ruralschoolswithInternet access 64.9% 13
Percent of teachersteaching out-of-field 5.2% 49whoare rural
Percent of ruralexpenditures spenton . 51.0% 16instruction
Percent of ruralschoolswithdeclining
9% 47enrollments of at least10%

78 BEESON AND STRANGE
\
oDE.US
oDE.US
oDE rural
.DEnonrural
18
Urgency Gauge
17
31.2
33.3
Percent of rural minority students
Percent of rural students in poverty
Percent of householders with less than12 years of school (no diploma)
oDE.US
oDE.US
oDE rural
.DEnonrural
24.827
17.5
Percent of populationliving in rural places
Importance Gauge
Average base teacher salary
$35,942$37,620
Percent of public school studentsenrolled in rural schools .
Over one fourth of DELAWARE'S population is rural, one third of ruraladults have less than a 12th grade education, and nearly one third of rural students are minorities, all making rural education more important than you mightimagine in Delaware. But rural teachers' pay is relatively high and the disparity between them and other teachers relatively low. Internet access rate forrural schools is very high.
Importance Gauge DE Rank
A rankof 1 is mostimportant
Percentof state's 27% 32population that is rural
Numberof rural people 179,667 45
Percentof public 18.3% 39schools in rural areas
Percentof publicschool17.5% 29students enrolledin
rural schools
Percentof studentsenrolledin rural schools 31.2% 10whoare minorities
Average numberofstudentsto average 128.1 49numberof grades
Percentof rural students 4.2% 44attending smallschools
Percentof rural students23in poverty 17%
Urgency Gauge DE Rank
A rankof 1 is mosturgent
Average rural teacher's $35,942 44salary
Difference between ruralteachersalariesand
$1,678 38teachersalariesin therest of the state
Percentof rural studentswhoare free lunch 31.7% 18eligible
Percentof ruralcommunities scoring 0% 45belowaverage on theEducation ClimateIndex
Average rural studentto 16.9 14teacherratio
Percentof rural33.3% 19householders with less
than 12yearsof school
Percentof rural schoolswith Internetaccess 94.1% 47
Percentof teachersteaching out-of-field 28.9% 15whoare rural
Percentof ruralexpenditures spent on 52.2% 23instruction
Percentof rural schoolswithdeclining
16% 38enrollments of at least10%

STATE-BY-STATE RESULTS 79
\
oFL.US
oFL.us
oFL rural
.FL nonrural
Urgency Gauge
23
90.5
38.9
[j
Percent of rural students in poverty
Percent of householders with less than12 years of school (no diploma)
Percent of public schools in rural areas
oFL.us
oFL.us
oFL rural
.FL nonrural
26.6
24.8
Importance Gauge
Percent of populationliving in rural places
Average base teacher salary
$29,026$31,013
Percent of public school studentsenrolled in rural schools
FLORIDA has nearly 2 million rural people, but less than 5% of publicschool students attend rural schools. Many rural students live in poverty andmany of them are minorities. Well under half of expenditures in rural schoolsare for instruction. Relatively well-paid teachers teach in relatively large classesin relatively large schools. A lot rural kids leave rural communities to go toschool, leaving rural schools in serious need of attention.
Importance Gauge FL Rank
A rank of 1 is most important
Percentof state's 15.2% 43population that is rural
Number of rural people 1,970,598 9
Percentof public 7% 48schools in rural areas
Percentof publicschool4.7% 48students enrolledin
rural schools
Percentof studentsenrolledin rural schools 26.6% ISwhoare minorities
Average number ofstudents to average 90.5 40number of grades
Percentof rural students 2.8% 47attending small schools
Percentof rural students12in poverty 23%
Urgency Gauge FL Rank
A rank of 1 is most urgent
Average rural teacher's $29,026 32salary
Difference between ruralteachersalaries and
$1,987 36teachersalaries in therest of the state
Percentof rural studentswhoare free lunch 42% 10eligible
Percentof ruralcommunities scoring 27.7% 17belowaverage on theEducation Climate Index
Average rural studentto 17.9 6teacherratio
Percentof rural38.9% 12householders with less
than 12yearsof school
Percentof rural schoolswith Internet access 82.3% 35
Percentof teachersteaching out-of-field 9.6% 41whoare rural
Percentof ruralexpenditures spenton 46.6% 5instruction
Percentof rural schoolswithdeclining
6% 50enrollments of at least10%

80 BEESON AND STRANGE
\
oGA.US
oGA rural
.GA nonrural
oGA rural
.GA nonrural
Urgency Gauge
26.8
44 '42.9
Percent of students who arefree lunch eligible
41.8
Percent of rural minority students
Percent of householders with less than12 years of school (no diploma)
oGA.US
oGA.US
oGA rural
.GA nonrural
ImportanceGauge
Percent of populationliving in rural places
36.8
15.8
[jAverage base teacher salary
Percent of public school studentsenrolled in rural schools
Well over one third of GEORGIA'S population-nearly 2.4 millionpeople-lives in rural areas, but many rural children are bused to schools inlarger communities. Nearly half the students left in rural schools qualify forfree lunches and they are crammed into schools that are among the largest inrural America. Georgia's rural poverty and the low levels of education amongits adult rural population create an urgent need for policy action.
Importance Gauge GA Rank
A rank of 1 is mostimportant
Percentof state's 36.8% 17population that is rural
Numberof rural people 2,380,877 7
Percentof public 18.2% 40schoolsin rural areas
Percentof public school15.8% 32studentsenrolled in
rural schools
Percentof studentsenrolled in rural schools 26.8% 14who are minorities
Average numberofstudentsto average 127.4 48numberof grades
Percentof rural students 6.9% 36attending small schools
Percentof rural students17in poverty 19.9%
Urgency Gauge GA Rank
A rank of 1 is mosturgent
Averagerural teacher's $27,094 24salary
Difference betweenruralteachersalariesand
$2,241 32teachersalaries in therest of the state
Percentof rural studentswho are free lunch 44% 6eligible
Percentof ruralcommunities scoring 43.9% 9belowaverageon theEducation ClimateIndex
Average rural student to 16.5 17teacher ratio
Percentof rural41.8% 10householders with less
than 12yearsof school
Percentof rural schoolswith Internetaccess 69.6% 17
Percentof teachersteachingout-of-field 19.4% 27whoare rural
Percentof ruralexpenditures spent on 51.6% 19instruction
Percentof rural schoolswith declining
16% 37enrollments of at least10%

STATE-BY-STATE RESULTS 81
\
oHI.US
oHI.US
oHI rural
.HI nonrural
22.6
Urgency Gauge
87.7
36.8
Average number of rural students tonumber of grades
Percent of householders with less than12 years of school (no diploma)
Percent of public schools in rural areas
oHI.US
oHI rural
.HI nonrural
oHI.US
24.8
16.4
75.3
Importance Gauge
Percent of populationliving in rural places
Average base teacher salary
$34,386$31,646
Percent of rural minority students
IIAWAIl is the least rural state in the nation, with the fewest number ofpeople living in rural areas and nearly the smallest percentage of its total population living in rural areas. But it ranks number one in the percentage of ruralstudents who are minorities, and more than one third of its rural students qualifyfor free lunches. Remarkably, every rural school has Internet access.
Importance Gauge HI Rank
A rank of 1 is mostimportant
Percentof state's 11% 48population that is rural
Number of rural people 122,058 50
Percentof public 15.9% 42schools in rural areas
Percentof publicschool12.8% 35students enrolled in
rural schools
Percentof studentsenrolledin rural schools 75.3% Iwhoare minorities
Average numberofstudents to average 87.7 38numberof grades
Percentof rural students 5.3% 40attending smallschools
Percentof rural studentsin poverty N/A N/A
Urgency Gauge HI Rank
A rank of 1 is mosturgent
Average rural teacher's $31,646 36salary
Difference between ruralteachersalaries and
$2,740 25teachersalaries in therest of the state
Percentof rural studentswhoare free lunch 36.8% 14eligible
Percentof ruralcommunities scoring 4.8% 38belowaverage on theEducation ClimateIndex
Average rural studentto 17.2 IIteacherratio
Percentof ruralN/A N/Ahouseholders with less
than 12 yearsof school
Percentof rural schoolswith Internet access 100% 50
Percentof teachersteaching out-of-field 10.3% 40whoare rural
Percentof ruralexpenditures spenton N/A N/Ainstruction
Percentof rural schoolswithdeclining
17% 32enrollments of at least10%

82 BEESON AND STRANGE
\
DID.us
DID rural
.ID nonrural
DID rural
.ID nonrural
22.6
23.4
Urgency Gauge
42.6
27
25
Percent of students who arefree lunch eligible
Percent of householders with less than12 years of school (no diploma)
Percent of public schools in rural areas
DID.us
DID.us
DID rural
.ID nonrural
13
42.6
27.8
Importance Gauge
Percent of populationliving in rural places
Average base teacher salary
Percent of public school studentsenrolled in rural schools
IDAHO ranks second in the percentage of students attending small, ruralschools and, unfortunately, second in the percentage of rural schools with declining enrollments. Idaho ranks eighth in the percentage of out-of-field teachers who are in rural schools. Rural teachers are paid relatively poorly, but thepay gap between them and other Idaho teachers is not as great as the gap inmost states. It is crucial that Idaho develops a rural education policy, as theneeds of its rural schools are critical.
Importance Gauge ID Rank
A rank of 1 is mostimportant
Percent of state's 42.6% 13population that is rural
Number of rural people 428,535 38
Percent of public 42.6% 13schools in rural areas
Percent of public school27.8% 13students enrolled in
rural schools
Percent of studentsenrolled in rural schools N/A N/A
who are minorities
Average number ofstudents to average 54.0 21number of grades
Percent of rural students 12.6% 10attending smallschools
Percent of ruralstudents24in poverty 16.6%
Urgency Gauge ID Rank
A rank of 1 is mosturgent
Average rural teacher's $24,369 10salary
Difference between rural- teacher salaries and
$2,089 35teachersalaries in therest of the state
Percent of rural studentswhoare free lunch 27% 25eligible
Percent of ruralcommunities scoring 5.3% 37belowaverage on theEducation Climate Index
Average ruralstudentto 17.2 11teacherratio
Percent of rural25% 31householders with less
than 12yearsof school
Percent of rural schoolswith Internet access 92.9% 46
Percent of teachersteaching out-of-field 35.3% 8whoare rural
Percent of ruralexpenditures spenton 53% 29instruction
Percent of rural schoolswith declining
38% 2enrollments of at least10%

STATE-BY-STATE RESULTS 83
\
oIL.US
oIL.US
.IL nonrural
oIL rural
60.7
22.6
Urgency Gauge
21.4
28
Average number of rural students tonumber of grades
Percent of householders with less than12 years of school (no diploma)
Percent of public schools in rural areas
oIL.US
oIL.us
.IL nonrural
oIL rural
24.8
13
$35,137
Importance Gauge
Percent of populationliving in rural places
Average base teacher salary
Percent of public school studentsenrolled in rural schools
ILLINOIS' rural teachers earn nearly $10,500 less than teachers in the restof the state, the largest gap in the nation. There are over one million peopleliving in rural Illinois, and the state ranks among the top ten states in the percentage of students attending small rural schools, one fourth of which sufferdeclining enrollment. The sheer number of rural people makes it important forIllinois to address rural education policy, while the conditions in rural schoolsand communities make it critical for the state to do so.
Importance Gauge IL Rank
A rank of 1 is mostimportant
Percent of state's 15.4% 42population that is rural
Number of rural people 1,762,050 14
Percentof public 21.4% 32schools in rural areas
Percentof publicschool10.2%students enrolledin
rural schools 41
Percentof studentsenrolledin rural schools 4%whoare minorities 37
Average number ofstudents to average 45.7 14number of grades
Percentof rural students 7.4% 32attending small schools
Percentof rural students39in poverty 12.4%
Urgency Gauge IL Rank
A rank of 1 is mosturgent
Average rural teacher's $24,675 11salary
Difference between ruralteachersalaries and
$10,462 Iteachersalaries in therest of the state
Percentof rural studentswhoare free lunch N/A N/Aeligible
Percentof ruralcommunities scoring 7.9% 27belowaverage on theEducation ClimateIndex
Average rural studentto 15.3 23teacher ratio
Percentof rural28% 28householders with less
than 12yearsof school
Percentof rural schoolswith Internet access 60.6% 6
Percentof teachersteaching out-of-field 12.1% 38whoare rural
Percentof ruralexpenditures spenton 50.9% 15instruction
Percentof rural schoolswithdeclining
25% 12enrollments of at least10%

84 BEESON AND STRANGE
\
DIN.US
DIN rural
.IN nonrural
DIN rural
.IN nonrural
22.9
Urgency Gauge
23.9 22.6
[)
28
Percent of students who arefree lunch eligible
Percent of householders with less than12 years of school (no diploma)
Percent of public schools in rural areas
DIN.US
DIN rural
DIN.US
.IN nonrural
Importance Gauge
Percent of populationliving in rural places
19.7
35.1
Average base teacher salary
Percent of public school studentsenrolled in rural schools
Nearly 2 million people live in rural INDIANA, over one third of its popu
lation, but fewer than one in five students go to a rural school and the ruralpoverty rate is quite low among an overwhelmingly white population. Consolidation has left many large rural schools, relatively few of which suffer declining enrollment. But rural schools spend less than half their budget on instruction.It is important for the state to have an explicit rural education policy, and theneed for one is serious.
Importance Gauge IN Rank
A rank of 1 is mostimportant
Percent of state's 35.1% 18population that is rural
Number of ruralpeople 1,946,060 10
Percent of public 23.9% 27schools in ruralareas
Percent of publicschool19.7% 23students enrolled in
ruralschools
Percent of studentsenrolled in ruralschools 1.4% 48whoare minorities
Average number ofstudents to average . 78.7 33number of grades
Percent of ruralstudents 8.7% 25attending smallschools
Percent of ruralstudents44in poverty 10.2%
UrgencyGauge IN Rank
A rank of 1 is mosturgent
Average ruralteacher's $31,918 37salary
Difference between ruralteacher salaries and
$3,420 21teacher salaries in therestof the state
Percent of ruralstudentswhoare free lunch 15% 39eligible
Percent of ruralcommunities scoring 7.6% 28belowaverage on theEducation Climate Index
Average ruralstudent to 17.9 6teacher ratio
Percent of rural28% 28householders with less
than 12years of school
Percent of ruralschoolswithInternet access 74.6% 21
Percent of teachersteaching out-of-field 27.1% 20whoare rural
Percent of ruralexpenditures spenton 49.2% 9instruction
Percent of ruralschoolswithdeclining
8% 49enrollments of at least10%

STATE-BY-STATE RESULTS 85
\
oIA.us
oIA.US
oIA rural
.IA nonrural
22.6
60.7
Urgency Gauge
47.8
24.5
Average number of rural students tonumber of grades
Percent of householders with less than12 years of school (no diploma)
Percent of public schools in rural areas
oIA.US
oIA.us
oIA rural
.IA nonrural
Percent of populationliving in rural places
Importance Gauge
31.7
39.4
Average base teacher salary
Percent of public school studentsenrolled in rural schools
$28,740
[J
Nearly one third of IOWA'S students and one half its schools are in rural
areas, both among the highest rates in the nation. But its rural teachers areamong the lowest paid in the nation and the pay gap between them and theirnonrural colleagues is one of the larger in the nation. Rural school size andclass size are small by national standards. The state's demographics make itvery important for Iowa to have an explicit rural education policy, and conditions in rural schools make the need for it critical.
Importance Gauge IA Rank
A rank of 1 is mostimportant
Percent of state's 39.4% 15population that is rural
Number of rural people 1,093,690 24
Percent of public 47.8% 10schools in rural areas
Percent of publicschool31.7% 8students enrolledin
rural schools
Percent of studentsenrolled in rural schools 2.2% 45whoare minorities
Average number ofstudents to average 43.9 IInumber of grades
Percent of rural students 17.8% 2attending small schools
Percent of rural students37in poverty 12.9%
Urgency Gauge IA Rank
A rankof 1 is mosturgent
Average rural teacher's $23,726 8salary
Difference between ruralteachersalaries and
$5,014 14teachersalaries in therest of the state
Percent of rural studentswhoare free lunch 17.9% 35eligible
Percent of ruralcommunities scoring 4.8% 38belowaverage on theEducation Climate Index
Average rural student to 13.4 40teacherratio
Percent of rural24.5% 34householders with less
than 12yearsof school
Percentof rural schoolswith Internet access 83.1% 35
Percent of teachersteaching out-of-field 36.5% 7whoare rural
Percent of ruralexpenditures spenton 50.9% 14instruction
Percent of rural schoolswithdeclining
21% 21enrollments of at least10%
86 BEESON AND STRANGE
\
oKS.US
oKS.US
.KS nonrural
oKS rural
22.6
60.7
Urgency Gauge
45.2
Average number of rural students tonumber of grades
Percent of householders with less than12 years of school (no diploma)
Percent of public schools in rural areas
oKS.US
oKS rural
.KS nonrural
13
27.1
Importance Gauge
30.9
Percent of populationliving in rural places
[j
Average base teacher salary
Percent of public school studentsenrolled in rural schools
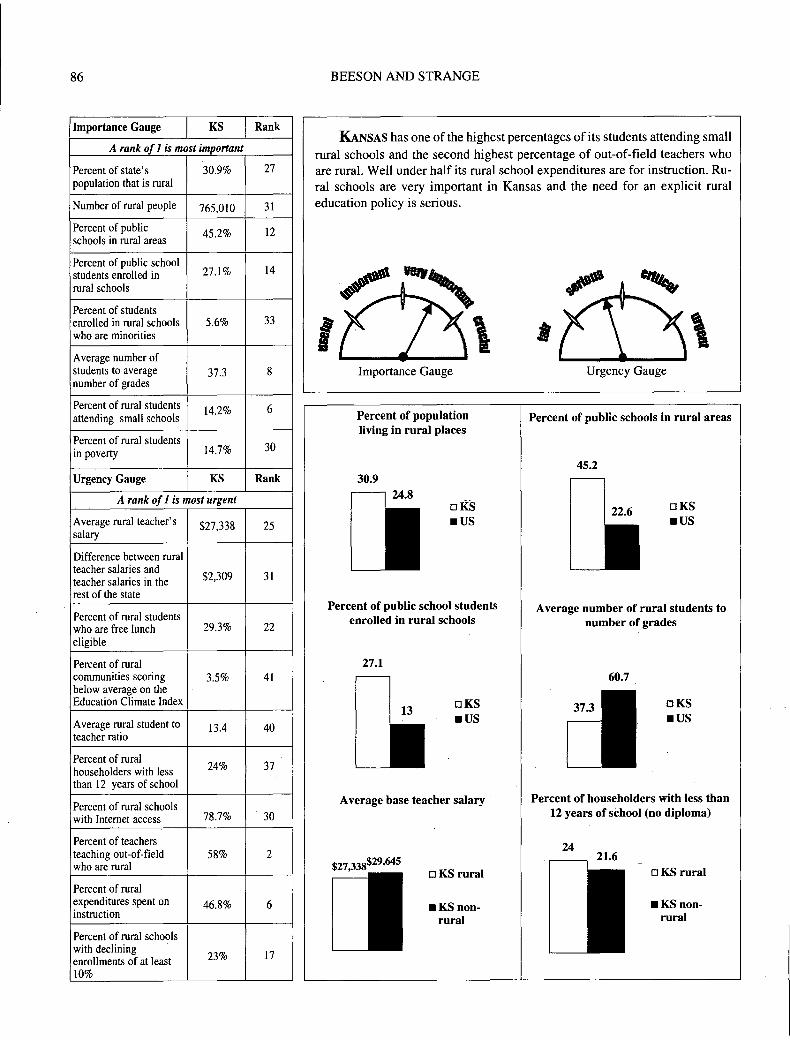
KANSAS has one of the highest percentages of its students attending smallrural schools and the second highest percentage of out-of-field teachers whoare rural. Well under half its rural school expenditures are for instruction. Rural schools are very important in Kansas and the need for an explicit ruraleducation policy is serious.
Importance Gauge KS Rank
A rank of 1 is mostimportant
Percentof state's 30.9% 27population that is rural
Numberof rural people 765,010 31
Percentof public 45.2% 12schoolsin rural areas
Percentof publicschool27.1% 14students enrolled in
rural schools
Percentof studentsenrolledin rural schools 5.6% 33whoare minorities
Average numberofstudents to average 37.3 8numberof grades
Percentof rural students 14.2% 6attending small schools
Percentof rural students30in poverty 14.7%
Urgency Gauge KS Rank
A rank of 1 is mosturgent
Average rural teacher's $27,338 25salary
Difference between ruralteachersalariesand
$2,309 31teachersalaries in therest of the state
Percentof rural studentswhoare free lunch 29.3% 22eligible
Percentof ruralcommunities scoring 3.5% 41belowaverage on theEducation ClimateIndex
Average rural studentto 13.4 40teacherratio
Percentof rural24% 37householders with less
than 12 yearsof school
Percentof rural schoolswith Internetaccess 78.7% 30
Percentof teachersteaching out-of-field 58% 2whoare rural
Percentof ruralexpenditures spent on 46.8% 6instruction
Percentof rural schoolswithdeclining
23% 17enrollments of at least10%

STATE-BY-STATE RESULTS 87
\
oKY.us
oKY rural
.KY nonrural
oKY rural
.KY nonrural
13
Urgency Gauge
28.4
49
Percent of students who arefree lunch eligible
50.9
Percent of public school studentsenrolled in rural schools
Percent of householders with less than12 years of school (no diploma)
oKY.us
oKY.us
oKY rural
.KY nonrural
32
Importance Gauge
Percent of populationliving in rural places
48.2
Average base teacher salary
$28,858$30,447
[J
Percent of rural students in poverty
KENTUCKY has the highest percentage of rural adults with less than a 12 th
grade education and the highest percentage of rural schools with declining en
rollments. It has the third highest percentage of rural students who are free
lunch eligible. Good rural schools are crucial to the state's education perfor
mance, and the need for an explicit rural policy is urgent.
Importance Gauge KY Rank
A rank of 1 is mostimportant
Percent of state's 48.2% 8population that is rural
Number of rural people 1,774,971 13
Percent of public 35.8% 16schools in rural areas
Percent of public school28.4% 12students enrolled in
rural schools
Percent of studentsenrolled in rural schools 2.6% 42who are minorities
Average number ofstudents to average 72.6 31number of grades
Percent of rural students 12.4% IIattending small schools
Percent of rural students5in poverty 32%
Urgency Gauge KY Rank
A rank of 1 is mosturgent
Average rural teacher's $28,858 31salary
Difference between ruralteacher salaries and
$1,589 39teacher salaries in therest of the state
Percent of rural studentswho are free lunch 49% 3eligible
Percent of ruralcommunities scoring 63.5% 3below average on theEducation Climate Index
Average rural student to 15.4 22teacher ratio
Percent of rural50.9% Ihouseholders with less
than 12 years of school
Percent ofrural schoolswith Internet access 63.3% 10
Percent of teachersteaching out-of-field 24.6% 24who are rural
Percent of ruralexpenditures spent on 51.8% 21instruction
Percent of rural schoolswith declining
39% Ienrollments of at least10%

88 BEESON AND STRANGE
\
oLA.US
oLA.US·
oLA rural
.LA nonrural
18
16.4
Urgency Gauge
37.7
34.5
42.3
Percent of rural minority students
Percent of rural students in poverty
Percent of householders with less than12 years of school (no diploma)
oLA.US
oLA.US
oLA rural
.LA nonrural
Importance Gauge
Percent of populationliving in rural places
18.6
31.9
Average base teacher salary
Percent of public school studentsenrolled in rural schools
LOUISIANA has the third highest percentage of rural students in povertyin the nation and among the lowest average rural teacher salaries. It also ranksamong the top ten states in the percentage of rural adults with less than a 12th
grade education. Louisiana's rural poverty makes rural schools very importantto the state's educational performance, and the need for a rural education policyis urgent.
Importance Gauge LA Rank
A rank of 1 is most important
Percent of state's 31.9% 24population that is rural
Number of rural people 1,348,214 20
Percent of public 24% 26schools in rural areas
Percent of public school18.6% 26students enrolled in
rural schools
Percent of studentsenrolled in rural schools 37.7% 7who are minorities
Average number ofstudents to average 70 30number of grades
Percent of rural students 9.4% 20attending small schools
Percent of rural students3in poverty 34.5%
Urgency Gauge LA Rank
A rank of 1 is mosturgent
Average rural teacher's $23,257 7salary
Difference between ruralteacher salaries and
$2,484 28teacher salaries in therest of the state
Percent of rural studentswho are free lunch 48.6% 4eligible ,
Percent of ruralcommunities scoring 54.2% 7below average on theEducation Climate Index
Average rural student to 15.8 20teacher ratio
Percent of rural42.3% 9householders with less
than 12years of school
Percent of rural schoolswith Internet access 84.2% 39
Percent of teachersteaching out-of-field 17.8% 28who are rural
Percent of ruralexpenditures spent on 52.3% 24instruction
Percent of rural schoolswith declining
23% 15enrollments of at least10%

STATE-BY-STATE RESULTS 89
\
oME.us
oME.US
oME rural
.MEnonrural
18
22.6
21.9
Urgency Gauge
56.6
23.4
Percent of rural students in poverty
Percent of public schools in rural areas
Percent of householders with less than12 years of school (no diploma)
oME.us
oME.us
_ME nonrural
oME rural
24.8
Importance Gauge
Percent of populationliving in rural places
48.1
55.4
Average base teacher salary
Percent of public school studentsenrolled in rural schools
Over half of MAINE'S population lives in rural areas and almost half itsstudents go to rural schools. It has one of the highest percentages of ruralschools with Internet access, and is among the highest in the portion of ruralschool expenditures spent on instruction. Its demographics make rural schoolscrucial to the state, and the need for a rural education policy is serious.
Importance Gauge ME Rank
A rank of 1 is mostimportant
Percentof state's 55.4% 3population that is rural
Numberof rural people 680,104 33
Percentof public 56.6% 6schoolsin rural areas
Percentof public school48.1% 3studentsenrolled in
rural schools
Percentof studentsenrolledin rural schools 2.2% 44who are minorities
Averagenumber ofstudents to average 50.8 19number of grades
Percentof rural students 16% 3attending small schools
Percentof rural students31in poverty 14.3%
Urgency Gauge ME Rank
A rank of 1 is mosturgent
Averagerural teacher's $26,491 20salary
Difference betweenruralteachersalariesand
$3,770 18teachersalaries in therest of the state
Percentof rural studentswho are free lunch 24.8% 27eligible
Percentof ruralcommunities scoring 6.2% 33belowaverageon theEducation Climate Index
Average rural studentto 14.7 27teacher ratio
Percentof rural23.4% 38householders with less
than 12yearsof school
Percentof rural schoolswith Internetaccess 96% 49
Percentof teachersteaching out-of-field 28.7% 16who are rural
Percentof ruralexpenditures spent on 56.5% 42instruction
Percentof rural schoolswith declining
23% 16enrollments of at least10%

90 BEESON AND STRANGE
\
oMD.US
oMD.US
oMDrural
.MD nonrural
18
22.6
Urgency Gauge
30.2
Percent of rural students in poverty
Percent of householders with less than12 years of school (no diploma)
Percent of public schools in rural areas
oMI>.us
oMD.us
oMDrural
.MDnonrural
24.8
Percent of populationliving in rural places
Importance Gauge
13.3 13
Average base teacher salary
$35,260$36,353
Percent of public school studentsenrolled in rural schools
MARYLAND'S rural schools are large, have very low rates of Internet access, and high student-to-teacher ratios. Low poverty rates and moderate minority enrollment make these disadvantages less alarming, but policymakersstill need to address these issues.
Importance Gauge MD Rank
A rank of 1 is mostimportant
Percent of state's 18.7% 38population that is rural
Number of ruralpeople 893,039 28
Percent of public 14.9% 44schools in rural areas
Percent of public school13.3% 33students enrolled in
rural schools
Percent of studentsenrolled in rural schools 20.5% 18whoare minorities
Average number ofstudents to average 126.4 47number of grades
Percent of rural students 5.1% 42attending smallschools
Percent of rural students43in poverty 10.5%
UrgencyGauge MD Rank
A rankof 1 is mosturgent
Average rural teacher's $35,260 41salary
Difference between ruralteachersalaries and
$1,093 42teacher salaries in therestof the state
Percent of rural studentswhoare free lunch 17.2% 36eligible
Percent of ruralcommunities scoring 5.5% 36below average on theEducation Climate Index
Average rural student to 18.2 5teacherratio
Percent of rural30.2% 23householders withless
than 12yearsof school
Percent of rural schoolswithInternet access 56.3% 4
Percent of teachersteaching out-of-field 13.1% 35whoare rural
Percent of ruralexpenditures spenton 53.4% 31instruction
Percent of rural schoolswithdeclining
14% 42enrollments of at least10%

STATE-BY-STATE RESULTS 91
\
oMA.us
oMA.US
oMA rural
.MA nonrural
22.6
17.2
Urgency Gauge
84.8
16.1
Average number of rural students tonumber of grades
Percent of householders with less than12 years of school (no diploma)
Percent of public schools in rural areas
oMA.us
oMA.us
oMA rural
.MA nonrural
13
24.8
Importance Gauge
Percent of populationliving in rural places
Average base teacher salary
$35,732$36,636
Percent of public school studentsenrolled in rural schools
One of the most urban states, MASSACHUSETTS nonetheless has nearly
one million rural people. Less than half of rural school expenditures go toinstruction, and Internet access rates are very low for rural schools. But ruralpoverty and minority rates are low, rural teacher salaries are among the highest, and the pay gap between rural and other teachers is among the lowest.
Importance Gauge MA Rank
A rank of 1 is mostimportant
Percent of state's 15.7% 40population that is rural
Number of ruralpeople 946,822 27
Percent of public 11.9% 45schools in rural areas
Percentof publicschool9.9% 43students enrolled in
rural schools
Percent of studentsenrolled in rural schools 3.8% 39whoare minorities
Average number ofstudents to average 84.8 35number of grades
Percentof rural students 3% 46attending small schools
Percentof rural students46in poverty 7.7%
Urgency Gauge MA Rank
A rank of 1 is mosturgent
Average rural teacher's $35,732 43salary
Difference between ruralteachersalaries and
$904 44teachersalaries in therest of the state
Percent of rural studentswhoare free lunch N/A N/Aeligible
Percent of ruralcommunities scoring 0% 45belowaverage on theEducation Climate Index
Average rural studentto N/A N/Ateacherratio
Percentof rural16.1% 48householders with less
than 12yearsof school
Percentof rural schoolswith Internet access 68.5% IS
Percentof teachersteaching out-of-field 8.5% 43whoare rural
Percentof ruralexpenditures spenton 49.7% IIinstruction
Percentof rural schoolswithdeclining
18% 29enrollments of at least10%

92 BEESON AND STRANGE
\
oMI.US
oMI.US
oMI rural
.MI nonrural
18
Urgency Gauge
22.7 22.6
28.2
Percent of rural students in poverty
Percent of householders with less than12 years of school (no diploma)
Percent of public schools in rural areas
oMI.US
oMI.US
oMI rural
.MInonrural
Importance Gauge
Percent of populationliving in rural places
18.2
29.5
[j
Average base teacher salary
Percent of public school studentsenrolled in rural schools
MICHIGAN has the sixth largest rural population, more than 2.7 million.
At more than $8,000, the pay gap is severe between rural and nonrural teach
ers, aggravated by the third highest rural student to teacher ratio in the nation.
Rural education is important in Michigan, and the need for a rural education
policy is critical.
Importance Gauge MI Rank
A rank of 1 is mostimportant
Percent of state's 29.5% 30population that is rural
Number of rural people 2,739,455 6
Percent of public 22.7% 30schools in rural areas
Percent of public school18.2% 27students enrolled in
rural schools
Percent of studentsenrolled in rural schools 6.3% 31who are minorities
Average number ofstudents to average 84.7 34number of grades
Percent of rural students 7.2% 34attending small schools
Percent of rural studentsin poverty 15.7% 27
Urgency Gauge MI Rank
A rank of 1 is mosturgent
Average rural teacher's $35,515 42salary
Difference between ruralteacher salaries and
$8,022 3teacher salaries in therest of the state
Percent of rural studentswho are free lunch 21.9% 29eligible
Percent of ruralcommunities scoring 7.3% 22below average on theEducation Climate Index
Average rural student to 18.5 3teacher ratio
Percent of rural28.2% 26householders with less
than 12 years of school
Percent of rural schoolswith Internet access 70.8% 18
Percent of teachersteaching out-of-field 16.4% 31who are rural
Percent of ruralexpenditures spent on 53.8% 34instruction
Percent of rural schoolswith declining
18% 28enrollments of at least10%

STATE-BY-STATE RESULTS 93
\
oMN.US
oMN.US
oMN rural
.MN nonrural
30.2
Urgency Gauge
60.7
tI
[j
32.1
Average number of rural students tonumber of grades
Percent of householders with less than12 years of school (no diploma)
Percent of public schools in rural areas
oMN.US
oMN.US
oMN rural
.MN nonrural
$37,174
Importance Gauge
Percent of populationliving in rural places
21.4
30.1
[j
Average base teacher salary
Percent of public school studentsenrolled in rural schools
MINNESOTA has over one million rural people, but below-average rural
poverty and minority rates. It has high rates of Internet access among its rural
schools, but also the fourth largest pay gap between rural and other teachers
and the ninth highest percentage of out-of-field teachers who are rural. Rural
schools are important to Minnesota's educationai performance, and its need
for a more explicit rural education policy is critical.
Importance Gauge MN Rank
A rank of 1 is mostimportant
Percent of state's 30.1% 29population that is rural
Number of rural people 1,318,625 21
Percent of public 30.2% 20schools in rural areas
Percent of public school21.4% 22students enrolled in
rural schools
Percent of studentsenrolled in rural schools 6.6% 30who are minorities
Average number ofstudents to average 53.1 20number of grades
Percent of rural students 8.9% 23attending small schools
Percent of rural students36in poverty 13.4%
Urgency Gauge MN Rank
A rankof 1 is mosturgent
Average rural teacher's $29,244 33salary
Difference between ruralteacher salaries and
$7,930 4teacher salaries in therest of the state
Percent of rural studentswho are free lunch 20.6% 31eligible
Percent of ruralcommunities scoring 11.9% 22below average on theEducation Climate Index
Average rural student to N/A N/Ateacher ratio
Percent of rural32.1% 21householders with less
than 12 years of school
Percent of rural schoolswith Internet access 88.7% 43
Percent of teachersteaching out-of-field 35.1% 9who are rural
Percent of ruralexpenditures spent on 53.7% 33instruction
Percent of rural schoolswith declining
22% 19enrollments of at least10%
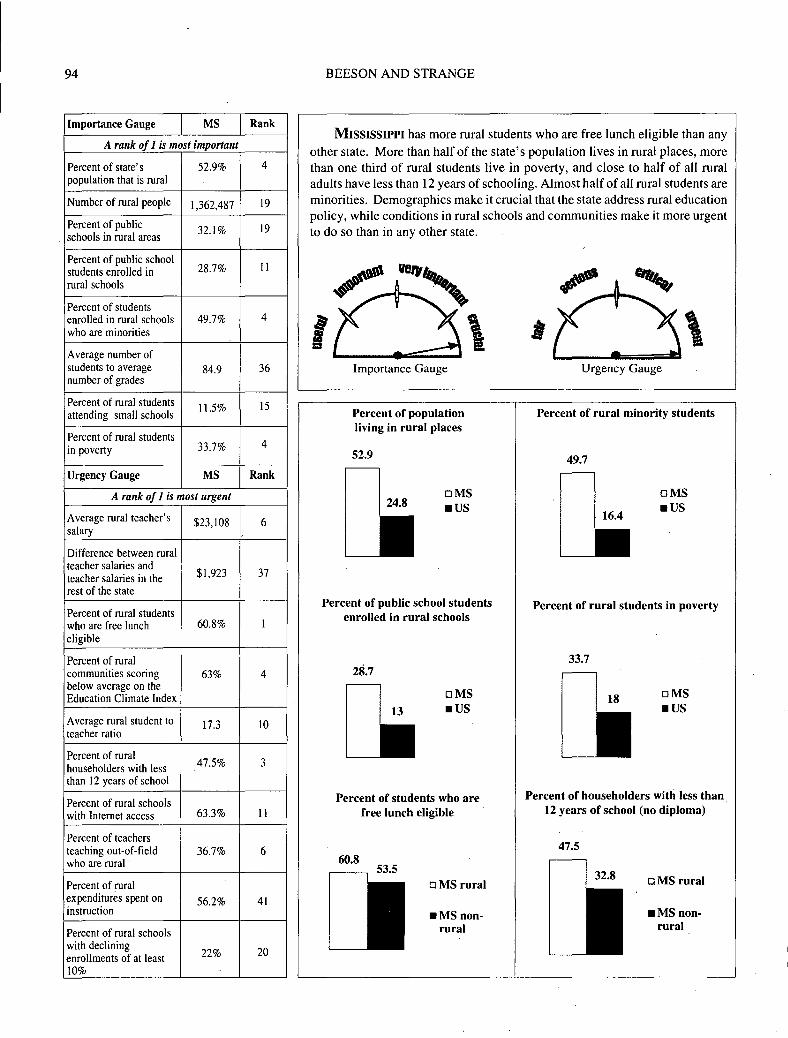
94 BEESON AND STRANGE
\
oMS.US
oMS.US
.MS nonrural
oMS rural
16.4
Urgency Gauge
33.7
49.7
47.5
Percent of rural minority students
Percent of rural students in poverty
Percent of householders with less than12 years of school (no diploma)
oMS.US
oMS.US
.MS nonrural
oMS rural
24.8
Importance Gauge
28.7
Percent of populationliving in rural places
52.9
Percent of students who arefree lunch eligible
Percent of public school studentsenrolled in rural schools
MISSISSIPPI has more rural students who are free lunch eligible than anyother state. More than half of the state's population lives in rural places, morethan one third of rural students live in poverty, and close to half of all ruraladults have less than 12 years of schooling. Almost half of all rural students areminorities. Demographics make it crucial that the state address rural educationpolicy, while conditions in rural schools and communities make it more urgentto do so than in any other state.
Importance Gauge MS Rank
A rank of 1 is mostimportant
Percentof state's 52.9% 4population that is rural
Numberof rural people 1,362,487 19
Percentof public 32.1% 19schoolsin rural areas
Percentof publicschool28.7% IIstudents enrolledin
rural schools
Percentof studentsenrolledin rural schools 49.7% 4whoare minorities
Average numberofstudents to average 84.9 36numberof grades
Percentof rural students 11.5% 15attending small schools
Percentof rural students4in poverty 33.7%
Urgency Gauge MS Rank
A rank of 1 is mosturgent
Average rural teacher's $23,108 6salary
Difference between ruralteachersalaries and
$1,923 37teachersalariesin therest of the state
Percentof rural studentswhoare free lunch 60.8% Ieligible
Percentof ruralcommunities scoring 63% 4belowaverage on theEducation ClimateIndex
Average rural studentto 17.3 10teacherratio
Percentof rural47.5% 3householders with less
than 12yearsof school
Percentof rural schoolswith Internet access 63.3% II
Percentof teachersteaching out-of-field 36.7% 6whoare rural
Percentof ruralexpenditures spent on 56.2% 41instruction
Percentof rural schoolswithdeclining
22% 20enrollments of at least10%

STATE-BY-STATE RESULTS 95
\
oMO.US
oMO.US
oMOrural
.MO nonrural
18
Urgency Gauge
19
35.3
36.7
Percent of rural students in poverty
Percent of householders with less than12 years of school (no diploma)
Percent of public schools in rural areas
oMO.us
oMO.US
oMO rural
.MO nonrural
$29,067
Importance Gauge
21.9
Percent of populationliving in rural places
31.3
Average base teacher salary
[jPercent of public school students
enrolled in rural schools
One third of MISSOURI'S people (1.6 million), one third of its schools,
and one fifth of its students are in rural communities. More than half of those
rural students go to very small schools. Good rural schools are therefore very
important to Missouri. Unfortunately, it has the third lowest average rural
teacher salary, and the fifth largest pay gap between rural and other teachers'
salaries. The need for a more explicit rural education policy is critical.
Importance Gauge MO Rank
A rankof 1 is mostimportant
Percent of state's 31.3% 25population that is rural
Number of rural people 1,601,064 16
Percent of public 35.3% 17schools in rural areas
Percent of public school21.9% 20students enrolled in
rural schools
Percent of studentsenrolled in rural schools 2.3% 43who are minorities
Average number ofstudents to average 47.9 15number of grades
Percent of rural students 12.7% 9attending small schools
Percent of rural students19in poverty 19%
Urgency Gauge MO Rank
A rank of 1 is mosturgent
Average rural teacher's $21,556 3salary
Difference between ruralteacher salaries and
$7,511 5teacher salaries in therest of the state
Percent of rural studentswho are free lunch 30.1% 20eligible
Percent of ruralcommunities scoring 42.3% 10below average on theEducation Climate Index
Average rural student to 13.7 38teacher ratio
Percent of rural36.7% 14householders with less
than 12 years of school
Percent of rural schoolswith Internet access 89% 44
Percent of teachersteaching out-of-field 27% 21who are rural
Percent of ruralexpenditures spent on 52.8% 28instruction
Percent of rural schoolswith declining
20% 26enrollments of at least10%
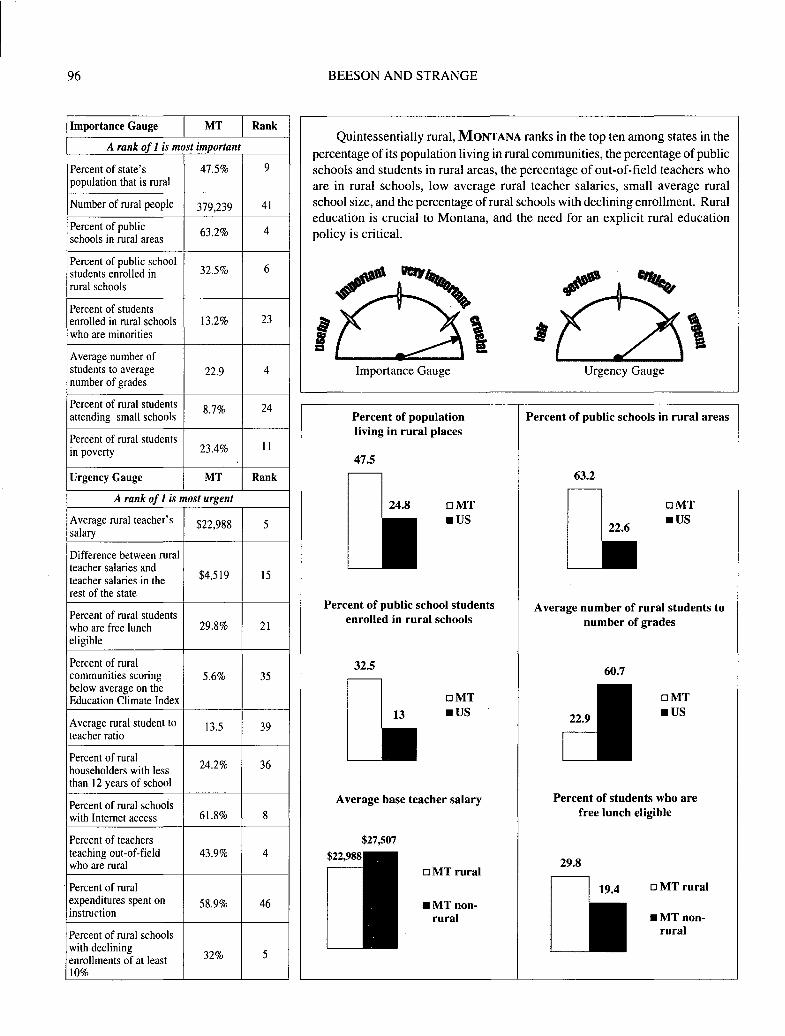
96 BEESON AND STRANGE
\
oMT.US
oMT.us
oMTrural
.MTnonrural
60.7
Urgency Gauge
63.2
29.8
Percent of students who arefree lunch eligible
Average number of rural students tonumber of grades
Percent of public schools in rural areas
oMT.us
oMT.us
oMTrural
.MTnonrural
13
24.8
Importance Gauge
47.5
32.5
Percent of populationliving in rural places
Average base teacher salary
Percent of public school studentsenrolled in rural schools
Quintessentially rural, MONTANA ranks in the top ten among states in thepercentage of its population living in rural communities, the percentage of publicschools and students in rural areas, the percentage of out-of-field teachers whoare in rural schools, low average rural teacher salaries, small average ruralschool size, and the percentage of rural schools with declining enrollment. Ruraleducation is crucial to Montana, and the need for an explicit rural educationpolicy is critical.
Importance Gauge MT Rank
A rank of 1 is mostimportant
Percent of state's 47.5% 9population that is rural
Number of rural people 379,239 41
Percent of public 63.2% 4schools in rural areas
Percent of public school32.5% 6students enrolled in
rural schools
Percent of studentsenrolled in rural schools 13.2% 23who are minorities
Average number ofstudents to average 22.9 4number of grades
Percent of rural students 8.7% 24attending small schools
Percent of rural students11in poverty 23.4%
Urgency Gauge MT Rank
A rank of 1 is mosturgent
Average rural teacher's $22,988 5salary
Difference between ruralteacher salaries and
$4,519 15teacher salaries in therest of the state
Percent of rural studentswho are free lunch 29.8% 21eligible
Percent of ruralcommunities scoring 5.6% 35below average on theEducation Climate Index
Average rural student to 13.5 39teacher ratio
Percent of rural24.2% 36householders with less
than 12years of school
Percent of rural schooiswith Internet access 61.8% 8
Percent of teachersteaching out-of-field 43.9% 4who are rural
- Percent of ruralexpenditures spent on 58.9% 46instruction
Percent of rural schoolswith declining
32% 5enrollments of at least10%

STATE-BY-STATE RESULTS 97
\
oNE.US
oNE.US
oNE rural
.NE nonrural
60.7
Urgency Gauge
57.4
24.5
Average number of rural students tonumber of grades
Percent of householders with less than12 years of school (no diploma)
Percent of public schools in rural areas
oNE.US
oNE.US
oNE rural
.NE nonrural
Importance Gauge
30.2
Percent of populationliving in rural places
33.9
Average base teacher salary
Percent of public school studentsenrolled in rural schools
More than half of NEBRASKA'S public schools are in rural areas. Thestate has many small schools, and many small classes, but teachers aren't paidmuch in rural Nebraska and many schools suffer declining enrollment. Still,64% of what Nebraska spends in rural schools goes for instruction, the secondhighest rate in the nation, and relatively few teachers are teaching out-of-field.Demographics alone make it very important that Nebraska continuously addresses rural education policy.
Importance Gauge NE Rank
A rank of 1 is mostimportant
Percentof state's 33.9% 21population that is rural
Numberof rural people 534,401 36
Percentof public 57.4% 5schools in rural areas
Percentof public school30.2% 9studentsenrolled in
rural schools
Percentof studentsenrolled in rural schools 4.3% 36who are minorities
Average numberofstudents to average 18.7 2numberof grades
Percentof rural students 9.5% 19attending small schools
Percentof rural students32in poverty 14.2%
Urgency Gauge NE Rank
A rank of 1 is mosturgent
Average rural teacher's $22,434 4salary
Difference between ruralteacher salaries and
$2,362 29teacher salaries in therest of the state
Percentof rural studentswho are free lunch 19.7% 34eligible
Percentof ruralcommunities scoring 8.8% 26below averageon theEducationClimate Index
Averagerural student to 12.4 45teacher ratio
Percentof rural24.5% 34householders with less
than 12 years of school
Percentof rural schoolswith Internet access 80.5% 32
Percentof teachersteachingout-of-field 10.8% 39who are rural
Percentof ruralexpenditures spent on 62.9% 49instruction
Percentof rural schoolswith declining
29% 8enrollmentsof at least10%

98 BEESON AND STRANGE
\
oNV.US
oNV.US
oNV rural
.NVnonrural
22.6
60.6
21.9
Urgency Gauge
23.3
Average number of rural students tonumber of grades
Percent of householders with less than12 years of school (no diploma)
Percent of public schools in rural areas
oNV.US
oNV.US
oNV rural
.NV nonrural
24.8
23
Importance Gauge
Percent of populationliving in rural places
Percent of students who arefree lunch eligible
34.2 32.7
Percent of rural minority students
Demographically, NEVADA is among the least rural states. It is one ofonly two states where rural teachers earn more, on average, than other teachers(the other is Utah). It has the fourth lowest percentage of rural school expenditures going to instruction, a low rate of Internet access, and a high rate of ruralschools with declining enrollment. Overall, rural is not an important factor inNevada education, but these deficiencies make the need for an explicit ruraleducation policy serious nonetheless.
Importance Gauge NV Rank
A rank of 1 is mostimportant
Percent of state's 11.7% 47population that is rural
Number of rural people 140,389 48
Percent of public 19.6% 38schools in rural areas
Percent of public school7.7% 46students enrolled in
rural schools
Percent of studentsenrolled in rural schools 23% 16who are minorities
Average number ofstudents to average 48.1 16number of grades
Percent of rural students 5.1% 43attending small schools
Percent of rural students40in poverty 12.2%
Urgency Gauge NV Rank
A rank of 1 is mosturgent
Average rural teacher's $32,747 39salary
Difference between ruralteacher salaries and
$-897 50teacher salaries in therest of the state
Percent of rural studentswho are free lunch 34.2% 15eligible
Percent of ruralcommunities scoring 0% 45below average on theEducation Climate Index
Average rural student to 16.2 19teacher ratio
Percent of rural23.3% 39householders with less
than 12 years of school
Percent of rural schoolswith Internet access 65.9% 14
Percent of teachersteaching out-of-field 25.5% 22who are rural
Percent of ruralexpenditures spent on 45.4% 4instruction
Percent of rural schoolswith declining
24% 14enrollments of at least10%

STATE-BY-STATE RESULTS 99
\
oNH.us
oNH rural
.NH nonrural
oNH rural
.NH nonrural
22.6
Urgency Gauge
49.7
Percent of students who arefree lunch eligible
12.1
[]Percent of householders with less than
12 years of school (no diploma)
Percent of public schools in rural areas
oNH.us
oNH.us
oNH rural
.NH nonrural
13
24.8
Importance Gauge
Percent of populationliving in rural places
49
32.2
Average base teacher salary
Percent of public school studentsenrolled in rural schools
NEW HAMPSHIRE has almost half of its population and half of its public
schools in rural areas. Close to one third of public school students attend ruralschools. It has one of the lowest percentages of rural minority students and ofrural students in poverty. Because of its demographics, the need for a ruraleducation policy is very important.
Importance Gauge NH Rank
A rank of1 is most important
Percent of state's 49% 7population that is rural
Number of ruralpeople 534,401 35
Percent of public 49.7% 8schools in rural areas
Percent of public school32.2% 7students enrolled in
rural schools
Percent of studentsenrolled in rural schools 1.4% 49whoare minorities
Average number ofstudents to average 55.1 23number of grades
Percent of rural students 12.1% 12attending smallschools
Percent of rural students45in poverty 8.1%
Urgency Gauge NH Rank
A rank of1 is most urgent
Average rural teacher's $28,564 29salary
Difference between ruralteacher salaries and
$5,643 10teacher salaries in therest of the state
Percent of rural studentswhoare free lunch 12.1% 40eligible
Percent of ruralcommunities scoring 0.5% 44below average on theEducation Climate Index
Average rural student to 14.7 27teacher ratio
Percent of rural18.6% 44householders with less
than 12years of school
Percent of rural schoolswith Internet access 80.9% 33
Percent of teachersteaching out-of-field 17.4% 29whoare rural
Percent of ruralexpenditures spenton 49.7% 10instruction
Percent of rural schoolswithdeclining
14% 43enrollments of at least10%

100 BEESON AND STRANGE
\
oNJ.US
oNJ.US
oNJ rural
.NJ nonrural
16.4
18
21.1
Urgency Gauge
Percent of rural minority students
Percent of rural students in poverty
Percent of householders with less than12 years of school (no diploma)
oNJ.US
oNJ.US
oNJ rural
.NJ nonrural
13
24.8
Importance Gauge
Percent of populationliving in rural places
Average base teacher salary
$40,591$41,426
Percent of public school studentsenrolled in rural schools
NEW JERSEY is considered one of the least rural states in the nation, yetthere are more than 800,000 people living in rural places in the state. Although New Jersey pays its rural teachers well, rural schools have one of thelowest rates of expenditures going to instruction. Despite having some of thelargest rural schools, the rural student to teacher ratio in New Jersey is relatively low. Given the state's demographics and the fair conditions in its ruralschools and communities, it would be useful for New Jersey to address ruraleducation policy.
Importance Gauge NJ Rank
A rank of 1 is mostimportant
Percentof state's 10.6% 49population that is rural
Number of rural people 819,968 30
Percentof public 4.8% 50schools in rural areas
Percentof publicschool4.5% 49students enrolledin
rural schools
Percentof studentsenrolledin rural schools 12.2% 24whoare minorities
Average numberofstudents to average 125.7 46number of grades
Percentof rural students 1% 50attending small schools
Percentof rural students49in poverty 4.3%
UrgencyGauge NJ Rank
A rank of 1 is mosturgent
Average rural teacher's $40,591 47salary
Difference between ruralteachersalariesand
$835 45teachersalaries in therest of the state
Percentof rural studentswhoare free lunch 10.1% 42eligible
Percentof ruralcommunities scoring N/A N/Abelowaverage on theEducation ClimateIndex
Average rural studentto 14.3 34teacherratio
Percentof rural13.4% 49householders with less
than 12 yearsof school
Percentof rural schoolswith Internetaccess 86% 40
Percentof teachersteaching out-of-field 6.3% 46whoare rural
Percentof ruralexpenditures spenton 48.1% 7instruction
Percentof rural schoolswith declining
14% 41enrollments of at least10%

STATE-BY-STATE RESULTS 101
\
oNMoUS
oNMoUS
oNM nonrural
oNM rural
18
30.1
Urgency Gauge
62.9
37.4
34.3
Percent of rural minority students
Percent of rural students in poverty
Percent of householders with less than12 years of school (no diploma)
oNMII] US
oNMIliIUS
oNM rural
II!iINM nonrural
24.827
Importance Gauge
Percent of populationliving in rural places
12.9 13
Average base teacher salary
$26,016$26,386
Percent of public school studentsenrolled in rural schools
NEW MEXICO ranks first in rural student poverty and third in rural stu
dent minority rates, making it a leader among states whose rural educationsystem is challenged to fulfill expectations. With relatively low rural teachersalaries (but close to par with nonrural teachers), low rates of Internet access inrural schools, over one fourth of rural schools with declining enrollment, andover one third of rural adults with less than 12 years of schooling, New Mexico'sneed for an explicit rural education policy is urgent.
Importance Gauge NM Rank
A rankof J is mostimportant
Percentof state's 27% 32population that is rural
Numberof rural people 409,418 39
Percentof public 28.1% 22schoolsin rural areas
Percentof publicschool12.9% 34students enrolledin
rural schools
Percentof studentsenrolled in rural schools 62.9% 3who are minorities
Averagenumber ofstudents to average 41.8 10numberof grades
Percentof rural students 8.5% 27attending small schools
Percentof rural studentsIin poverty 37.4%
Urgency Gauge NM Rank
A rank of J is mosturgent
Averagerural teacher's $26,016 16salary
Difference between ruralteachersalariesand
$370 46teachersalaries in therest of the state
Percentof rural studentswho are free lunch N/A N/Aeligible
Percentof ruralcommunities scoring 34.8% 13below averageon theEducation Climate Index
Averagerural student to 15.5 21teacher ratio
Percentof rural34.3% 16householders with less
than 12yearsof school
Percentof rural schoolswith Internetaccess 64.3% 12
Percentof teachersteaching out-of-field 16.4% 31who are rural
Percentof ruralexpenditures spent on 44.6% 3instruction
Percentof rural schoolswith declining
27% 11enrollments of at least10%

102 BEESON AND STRANGE
\
oNY.US
oNY.US
oNY rural
.NYnonrural
18
Urgency Gauge
16.4
25.6
Percent of rural students in poverty
Percent of householders with less than12 years of school (no diploma)
Percent of public schools in rural areas
oNY.US
oNY.us
oNY rural
.NY nonrural
13
24.8
Importance Gauge
Percent of populationliving in rural places
Average base teacher salary
Percent of public school studentsenrolled in rural schools
While NEW YORK has the 4 th largest rural population (2.8 million), 5 of 6
New Yorkers are nonrural, and only 11% of public school students are enrolled
in rural schools. Relatively few of them are poor or minorities. Still, the sheer
number of rural New Yorkers makes it useful for state policymakers to be
concerned with rural education. Rural teachers are paid about as well in New
York as anywhere, but still earn 13% less than other New York teachers, among
the widest gaps in the nation.
Importance Gauge NY Rank
A rank of 1 is mostimportant
Percent of state's 15.7% 40population that is rural
Number of rural people 2,826,408 4
Percent of public 16.4% 41schools in rural areas
Percent of public school11.4% 40students enrolled in
rural schools
Percent of studentsenrolled in rural schools 4.6% 34who are minorities
Average number ofstudents to average 95.4 41
, number of grades
Percent of rural students 6.8% 37attending small schools
Percent of rural students41in poverty 12%
Urgency Gauge NY Rank
A rank of 1 is mosturgent
Average 'rural teacher's $40,690 48salary
Difference between ruralteacher salaries and
$6,111 8teacher salaries in therest of the state
Percent of rural studentswho are free lunch 20.3% 32eligible
Percent of ruralcommunities scoring. 0.6% 43below average on theEducation Climate Index
Average rural student to 14.3 34teacher ratio
Percent of rural25.6% 30householders with less
than 12 years of school
Percent of rural schoolswith Internet access 77.1% 26
Percent of teachersteaching out-of-field 6.3% 46who are rural
Percent of ruralexpenditures spent on 58.3% 45instruction
Percent of rural schoolswith declining
17% 35enrollments of at least10%
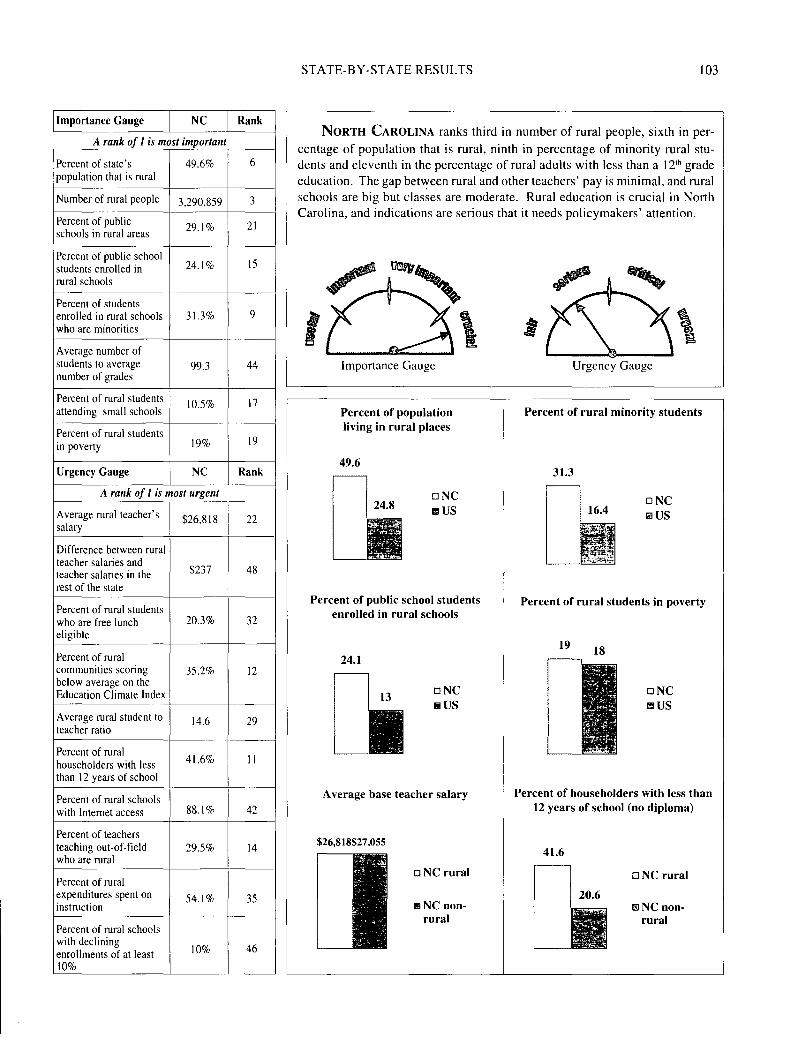
STATE-BY-STATE RESULTS 103
\
oNCtI!JIUS
oNCliJUS
oNC rural
I3NC nonrural
18
20.6
Urgency Gauge
19
31.3
41.6
Percent of rural minority students
Percent of rural students in poverty
Percent of householders with less than12 years of school (no diploma)
oNCIII US
oNC1:1 US
oNC rural
II!'INC nonrural
24.8
24.1
Importance Gauge
Percent of populationliving in rural places
49.6
Average base teacher salary
$26,818$27,055
Percent of public school studentsenrolled in rural schools
NORTH CAROLINA ranks third in number of rural people, sixth in per
centage of population that is rural, ninth in percentage of minority rural students and eleventh in the percentage of rural adults with less than a 12th gradeeducation. The gap between rural and other teachers' pay is minimal, and ruralschools are big but classes are moderate. Rural education is crucial in NorthCarolina, and indications are serious that it needs policymakers' attention.
Importance Gauge NC Rank
A rank of I is most important
Percent of state's 49.6% 6population that is rural
Number of rural people 3,290,859 3
Percentof public 29.1% 21schools in rural areas
Percent of publicschool24.1% 15students enrolled in
rural schools
Percentof studentsenrolled in rural schools 31.3% 9whoare minorities
Average number ofstudents to average 99.3 44number of grades
Percent of rural students 10.5% 17attending small schools
Percentof rural students19in poverty 19%
Urgency Gauge NC Rank
A rank of I is most urgent
Average rural teacher's $26,818 22salary
Difference between ruralteachersalaries and
$237 48teachersalaries in therest of the state
Percent of rural studentswhoare free lunch 20.3% 32eligible
Percentof ruralcommunities scoring 35.2% 12belowaverage on theEducation Climate Index
Average rural student to 14.6 29teacherratio
Percent of rural41.6% IIhouseholders with less
than 12yearsof school
Percent of rural schoolswith Internet access 88.1% 42
Percentof teachersteaching out-of-field 29.5% 14whoare rural
Percent of ruralexpenditures spenton 54.1% 35instruction
Percentof rural schoolswithdeclining
10% 46enrollments of at least10%

104 BEESON AND STRANGE
\
aND.US
aND.US
aND rural
.ND nonrural
22.6
60.7
Urgency Gauge
65.8
35.3
Average number of rural students tonumber of grades
Percent of public schools in rural areas
Percent of householders with less than12 years of school (no diploma)
aND.US
aND.US
aND rural
.NDnonrural
13
24.8
Importance Gauge
46.7
42.3
Percent of populationliving in rural places
Average base teacher salary
Percent of public school studentsenrolled in rural schools
NORTH DAKOTA is among the top five states in the percentage of schools,students, and people in rural places. Its rural schools are especially small, itsrural population surprisingly poor, and, due to Native American enrollment, itsrural student population more heavily minority than the national average. Rural teachers earn less here than anywhere in the nation. More than one-third ofrural adults have less than a 12th grade education. Only three other states havemore schools with declining enrollments. Rural schools are crucial in NorthDakota, and the need for policy attention is urgent.
Importance Gauge ND Rank
A rank of 1 is mostimportant
Percentof state's 46.7% 10population that is rural
Number of rural people 298,461 43
Percentof public 65.8% 3schoolsin rural areas
Percentof publicschool42.3% 5students enrolledin
rural schools
Percentof studentsenrolledin rural schools 10.5% 27whoare minorities
Average numberofstudents to average 2\.4 3number of grades
Percentof rural students 15.2% 4attending small schools
Percentof rural students15in poverty 2\.4%
Urgency Gauge ND Rank
A rank of 1 is mosturgent
Average rural teacher's $20,326 Isalary
Difference between ruralteachersalariesand
$3,863 17teachersalaries in therest of the state
Percentof rural studentswhoare free lunch 28.3% 24eligible
Percentof ruralcommunities scoring 30.2% 15belowaverage on theEducation ClimateIndex
Average rural studentto 13 43teacherratio
Percentof rural35.3% 15householders with less
than 12yearsof school
Percentof rural schoolswith Internet access 87.4% 40
Percentof teachersteaching out-of-field 49.9% 3whoare rural
Percent of ruralexpenditures spent on 48.5% 8instruction
Percentof rural schoolswithdeclining
35% 4enrollments of at least10%

STATE-BY-STATE RESULTS 105
\
DOHIIiiIUS
DOHIIiIIUS
DOH rural
mOH nonrural
22.6
18
23.4
Urgency Gauge
I
20.9
28.5
Percent of rural students in poverty
Percent of householders with less than12 years of school (no diploma)
Percent of public schools in rural areas
DOH.US
DOH.US
DOH rural
.OH nonrural
13
24.8
I16.4
Importance Gauge
Percent of populationliving in rural places
25.9
Average base teacher salary
Percent of public school studentsenrolled in rural schools
More than one in four people in OHIO live in rural areas, the fifth largestnumber of rural people in the nation (2.8 million). Rural schools have less thanone sixth of the state's students, but more than one fourth of the state's teacherswho teach out-of-field. They also have one of the highest rural student-toteacher ratios in the nation. With so many rural people in the state, rural schoolsare important, and the need for policy attention is serious.
Importance Gauge OH Rank
A rank of 1 is most important
Percentof state's 25.9% 34population that is rural
Number of ruralpeople 2,807,706 5
Percentof public 20.9% 33schools in rural areas
Percentof publicschool16.4% 31students enrolledin
rural schools
Percentof studentsenrolledin rural schools 1.9% 46who are minorities
Average number ofstudents to average 77.4 32number of grades
Percentof rural students 7.8% 30attending small schools
Percentof rural students33in poverty 14.1%
Urgency Gauge OH Rank
A rank of 1 is mosturgent
Average rural teacher's $30,865 34salary
Difference between ruralteachersalaries and
$3,015 23teachersalaries in therest of the state
Percentof rural studentswhoare free lunch 15.8% 37eligible
Percentof ruralcommunities scoring 11% 23belowaverage on theEducation Climate Index
Average rural studentto 18.4 4teacherratio
Percentof rural28.5% 25householders with less
than 12yearsof school
Percentof rural schoolswith Internet access 68.5% 16
Percentof teachersteaching out-of-field 27.4% 19whoare rural
Percentof ruralexpenditures spenton 53.7% 32instruction
Percentof rural schoolswithdeclining
13% 44enrollments of at least10%

106 BEESON AND STRANGE
\
oOK.US
oOK.US
.OK nonrural
oOK rural
60.7
Urgency Gauge
41.7
tI33.4
Average number of rural students tonumber of grades
Percent of householders with less than12 years of school (no diploma)
Percent of public schools in rural areas
oOK.us
oOK.US
.OK nonrural
oOK rural
13
Importance Gauge
Percent of populationliving in rural places
23.1
32.3
43
[j
Percent of students who arefree lunch eligible
Percent of public school studentsenrolled in rural schools
OKLAHOMA ranks in the top third among states in five of eight "importance" indicators, including the percentage of schools and students in ruralareas, the smallness of its schools, and the percentage of its students who areminorities (largely Native American). Its rural schools are the least "connected"to the Internet in the nation, rural poverty is widespread, and rural teachers'salaries are relatively low. Rural schools are crucial to the state's educationalperformance, and the need for explicit rural policy is critical.
Importance Gauge OK Rank
A rank of 1 is mostimportant
Percentof state's 32.3% 23population that is rural
Number of rural people 1,015,446 26
Percentof public 41.7% 15schoolsin rural areas
Percentof publicschool23.1% 16students enrolledin
rural schools
Percentof studentsenrolledin rural schools 29.1% 13whoare minorities
Average numberofstudents to average 37 7number of grades
Percentof rural students 13.9% 7attending small schools
Percentof rural students14in poverty 21.7%
Urgency Gauge OK Rank
A rank of 1 is mosturgent
Average rural teacher's $25,622 14salary
Difference between ruralteachersalariesand
$1,092 43teachersalariesin-therest of the state
Percentof rural studentswhoare free lunch 43% 8eligible
Percentof ruralcommunities scoring 32.6% 14belowaverage on theEducation ClimateIndex
Average rural studentto 14.5 31teacherratio
Percentof rural33.4% 18householders with less
than 12yearsof school
Percentof rural schoolswith Internetaccess 43.3% I
Percentof teachersteaching out-of-field 34.6% 10whoare rural
Percentof ruralexpenditures spent on 56.6% 43instruction
Percentof rural schoolswithdeclining
18% 27enrollments of at least10%

STATE-BY-STATE RESULTS 107
\
oORa us
oOR.us
.OR nonrural
oOR rural
Urgency Gauge
18.5 18
21.8 22.6
31.6
[j
Percent of rural students in poverty
Percent of householders with less than12 years of school (no diploma)
Percent of public schools in rural areas
oOR.us
oOR.US
.OR nonrural
oOR rural
Importance Gauge
60.7
$32,903
Percent of populationliving in rural places
29.5
[j
Average base teacher salary
Average number of rural students tonumber of grades
OREGON ranks near the middle on most of the "importance" indicators,
but pays its rural teachers poorly and a lot less than its nonrural teachers. Oregon has above average rural poverty rates, suffers declining enrollment in22% of its rural schools, and has above average rural school and class size. Itseriously needs an explicit rural education policy.
Importance Gauge OR Rank
A rank of 1 is most important
Percent of state's 29.5% 30population that is rural
Number of ruralpeople 839,050 29
Percent of public 21.8% 31schools in rural areas
Percentof public school11.6% 39students enrolledin
rural schools
Percentof studentsenrolled in rural schools 11.4% 26whoare minorities
Average number ofstudents to average 44.3 12number of grades
Percentof rural students 8% 29attending smallschools
Percentof rural students21in poverty 18.5%
Urgency Gauge OR Rank
A rank of 1 is most urgent
Average rural teacher's $25,457 13salary
Difference between ruralteachersalaries and
$7,446 6teachersalaries in therest of the state
Percentof rural studentswhoare free lunch 31.6% 19eligible
Percentof ruralcommunities scoring 4.1% 40belowaverage on theEducation Climate Index
Average rural student to 17.5 8teacherratio
Percentof rural24.6% 33householders with less
than 12yearsof school
Percentof rural schoolswith Internet access 79.5% 31
Percent of teachersteaching out-of-field 8.1% 44whoare rural
Percentof ruralexpenditures spenton 55.7% 38instruction
Percentof rural schoolswithdeclining
22% 18enrollments of at least10%

108 BEESON AND STRANGE
\
oPA.us
oPA.US
oPA rural
22.6
18
Urgency Gauge
30.5
[j
Percent of rural students in poverty
Percent of householders with less than12 years of school (no diploma)
Percent of public schools in rural areas
oPA.us
oPA.us
.PA nonrural
oPA rural
Percent of populationliving in rural places
16.5
Importance Gauge
31.1
[j
Average base teacher salary
$38,190$41,639
Percent of public school studentsenrolled in rural schools
PENNSYLVANIA has more rural people than any other state (3.7 million).
Its rural schools are poorly connected to the Internet, rural class sizes are large,and although rural teachers are paid quite well, they are paid a lot less thannonrural teachers in the state. Rural education is important in Pennsylvania,and policymakers need to give serious attention to rural school policy.
Importance Gauge PA Rank
A rank of 1 is mostimportant
Percent of state's 31.1% 26population that is rural
Number of rural people 3,693,348 I
Percent of public 20.6% 36schools in rural areas
Percent of public school16.5% 30students enrolled in
rural schools
Percent of studentsenrolled in rural schools 2.7% 40whoare minorities
Average number ofstudents to average 98.8 43number of grades
Percent of rural students 6.0% 39attending small schools
Percent of rural students33in poverty 14.1%
UrgencyGauge PA Rank
A rank of 1 is mosturgent
Average rural teacher's $38,190 46salary
Difference between ruralteacher salaries and
$3,449 20teacher salaries in therestof the state
Percent of rural studentswho are freelunch N/A N/Aeligible
Percent of ruralcommunities scoring 10.9% 24below average on theEducation Climate Index
Average rural student to 17.2 IIteacher ratio
Percent of rural30.5% 22householders with less
than 12years of school
Percent of rural schoolswith Internet access 62.3% 9
Percent of teachersteaching out-of-field 9.4% 42who are rural
Percent of ruralexpenditures spenton 51.9% 22instruction
Percent of rural schoolswithdeclining
16% 39enrollments of at least10%

STATE-BY-STATE RESULTS 109
\
oRI.US
oRI.US
oRI rural
.RI nonrural
22.6
18
24.8
Urgency Gauge
Percent of rural students in poverty
Percent of householders with less than12 years of school (no diploma)
Percent of public schools in rural areas
oRI.US
oRI&IUS
oRI rural
• RI nonrural
24.8
13
Importance Gauge
Percent of populationliving in rural places
Average base teacher salary
$37,512$40,360
Percent of public school studentsenrolled in rural schools
One of the least rural states, RHODE ISLAND has fewer rural people than
any state in the nation and ranks in the bottom lOon 7 of 8 "importance"indicators, and in the bottom half on 7 of 9 "urgency" indicators.
Importance Gauge RI Rank
A rank of 1 is most important
Percent of state's 14% 44population that is rural
Number of ruralpeople 140,083 49
Percent of public 8.6% 47schools in rural areas
Percent of public school9.5% 44students enrolled in
rural schools
Percent of studentsenrolled in rural schools 3.8% 38whoare minorities
Average number ofstudents to average 134.6 50number of grades
Percent of rural students 1.4% 49attending small schools
Percent of rural students47in poverty 6.1%
Urgency Gauge RI Rank
A rank of 1 is most urgent
Average rural teacher's $37,512 45salary
Difference between ruralteachersalaries and
$2,848 24teachersalaries in therest of the state
Percent of rural studentswhoare free lunch 11.3% 41eligible
Percent of ruralcommunities scoring 0 45belowaverage on theEducation Climate Index
Average rural studentto 14.6 29teacherratio
Percent of rural17.8% 45householders with less
than 12yearsof school
Percent of rural schoolswith Internet access 75% 22
Percent of teachersteaching out-of-field 2.5% 50whoare rural
Percent of ruralexpenditures spenton 60.1% 48instruction
Percentof rural schoolswithdeclining
8% 48enrollments of at least10%

110 BEESON AND STRANGE
\
oSC.us
oSC.US
.SC nonrural
oSC rural
16.6
Urgency Gauge
48
23.9
46.2
Percent of rural minority students
Percent of rural students in poverty
Percent of householders with less than12 years of school (no diploma)
oSC.US
oSC.us
oSC rural
.SC nonrural
24.8
Importance Gauge
18.1
45.4
Percent of populationliving in rural places
51.8
Percent of students who arefree lunch eligible
Percent of public school studentsenrolled in rural schools
SOUTH CAROLINA'S rural population is large (1.6 million) and demo
graphically important (45% of the total population). Nearly half its rural students are eligible for free lunches and more than half are minorities. Nearlyhalf of rural adults haven't finished high school (ranked fourth in the nation)and barely half of rural school expenditures go for instruction. Rural education is very important to South Carolina, and its policymakers urgently need toaddress rural school needs.
Importance Gauge SC Rank
A rank of 1 is mostimportant
Percent of state's 45.4% 12population that is rural
Number of ruralpeople 1,581,325 18
Percent of public 23.8% 28schools in ruralareas
Percent of publicschool18.1% 28students enrolled in
rural schools
Percent of studentsenrolled in rural schools 48% 5whoare minorities
Average number ofstudents to average 96.4 42number of grades
Percent of rural students 9.6% 18attending smallschools
Percent of ruralstudents10in poverty 23.9%
Urgency Gauge SC Rank
A rank of 1 is mosturgent
Average rural teacher's $28,068 27salary
Difference between ruralteacher salaries and
$315 47teacher salaries in therestof the state
Percent of ruralstudentswhoare free lunch 51.8% 2eligible
Percent of ruralcommunities scoring 54.7% 6belowaverage on theEducation Climate Index
Average ruralstudentto 15.3 23teacher ratio
Percent of rural46.2% 4householders withless
than 12yearsof school
Percent of rural schoolswith Internet access 73.8% 20
Percent of teachersteaching out-of-field 17.3% 30whoare rural
Percent of ruralexpenditures spenton 50.5% 13instruction
Percent of ruralschoolswithdeclining
21% 24enrollments of at least10%

STATE-BY-STATE RESULTS III
\
oSD.US
oSD.US
oSD rural
.SD nonrural
18
22.6
I
•
Urgency Gauge
25.5
73.5
32.7
Percent of rural students in poverty
Percent of householders with less than12 years of school (no diploma)
Percent of public schools in rural areas
oSO.US
oSD rural
.SD nonrural
24.8
50
13
oSD.US
Importance Gauge
Percent of populationliving in rural places
44.6
Average base teacher salary
$26,530
$21,295
Percent of public school studentsenrolled in rural schools
Nearly three quarters of SOUTH DAKOTA'S public schools are in ruralareas-more than in any other state. It ranks in the top five among states in thepercentage of people living in rural places, students attending rural schools,and the smallness of its average rural school. Moreover, more than one fourthof its rural students live in poverty and one sixth are minorities (mainly Native
American). South Dakota pays its rural teachers less than any state except NorthDakota, and they earn 20% less than nonrural teachers. Rural schools are crucial to the state's education system, and the need for rural education policy
attention is urgent.
Importance Gauge SO Rank
A rank of 1 is mostimportant
Percent of state's 50% 5population that is rural
Number of rural people 348,101 42
Percent of public73.5% I
schools in rural areas
Percent of public school44.6% 4students enrolled in
rural schools
Percent of studentsenrolled in rural schools 15.3% 22who are minorities
Average number ofstudents to average 24.5 5number of grades
Percent of rural students 12.1% 13attending small schools
Percent of rural students8in poverty 25.5%
Urgency Gauge SO Rank
A rank of 1 is mosturgent
Average rural teacher's $21,295 2salary
Difference between ruralteacher salaries and
$5,235 13teacher salaries in therest of the state
Percent of rural studentswho are free lunch 40.4% 12eligible
Percent of ruralcommunities scoring 29.2% 16below average on theEducation Climate Index
Average rural student to 14 36teacher ratio
Percent of rural32.7% 20householders with less
than 12 years of school
Percent of rural schoolswith Internet access 76.7% 24
Percent of teachersteaching out-of-field 60% Iwho are rural
Percent of ruralexpenditures spent on 56% 39instruction
Percent of rural schoolswith declining
31% 6enrollments of at least10%

112 BEESON AND STRANGE
\
oTN.us
oTN.us
.TNnonrural
oTN rural
Urgency Gauge
22.2
23.6 22.6
49.7
Percent of rural students in poverty
Percent of householders with less than12 years of school (no diploma)
Percent of public schools in rural areas
oTN.us
oTN.US
oTN rural
.TNnonrural
Percent of populationliving in rural places
18.8
39.1
Importance Gauge
Average base teacher salary
Percent of public school studentsenrolled in rural schools
$29,051
[]
With nearly two in five people living in rural places, TENNESSEE is amongthe most populous rural states (1.9 million rural people). Almost one fourth ofits rural students live in poverty and nearly half its rural adults didn't finishhigh school (rank second). Rural teachers are paid poorly and earn 15% lessthan their nonrural counterparts. Rural schools are very important to the educational system of Tennessee, and the policy needs of these schools urgentlyneed to be addressed.
Importance Gauge TN Rank
A rankof 1 is mostimportant
Percent of state's 39.1% 16population that is rural
Number of ruralpeople 1,907,237 11
Percent of public 23.6% 29schools in ruralareas
Percent of public school18.8% 25students enrolled in
ruralschools
Percent of studentsenrolled in ruralschools 7.9% 29whoare minorities
Average number ofstudents to average 87.5 37number of grades
Percent of rural students ,28
attending smallschools8.1%
Percent of rural students13in poverty 22.2%,
Urgency Gauge TN Rank
A rankof 1 is mosturgent
Average rural teacher's $24,687 12salary
Difference between ruralteacher salaries and
$4,364 16teacher salaries in therestof the state
Percent of ruralstudentswhoare free lunch N/A N/Aeligible \
Percent of ruralcommunities scoring 67.6% Ibelowaverage on theEducation Climate Index
Average rural studentto N/A N/Ateacher ratio
Percent of rural49.7% 2householders with less
than 12yearsof school
Percent of ruralschoolswith Internet access 75.8% 23
Percent of teachersteaching out-of-field 19.7% 26whoare rural
Percent of ruralexpenditures spenton 54.9% 36instruction
Percent of rural schoolswithdeclining
17% 33enrollments of at least10%

STATE-BY-STATE RESULTS 113
\
oTX.US
oTX.US
oTX rural
.TX nonrural
22.6
Urgency Gauge
20.9
20.4
37.6
Percent of rural students in poverty
Percent of householders with less than12 years of school (no diploma)
Percent of public schools in rural areas
oTX
.US
oTX.US
.TX nonrural
oTX rural
16.6
24.8
31
Importance Gauge
Percent of populationliving in rural places
Average base teacher salary
Percent of rural minority students
Over 3.3 million people live in rural TEXAS (rank second), but that is only20% of the state's population, making it far less "rural" demographically thanmost states. Only one tenth of its students attend school in a rural community,but more than one third qualify for free lunches and nearly one third are minorities. With a large rural population widely dispersed between big cities,Texas' rural schools are important to the educational performance of the state,and clearly in need of policy consideration.
Importance Gauge TX Rank
A rank of 1 is mostimportant
Percentof state's 19.7% 37population that is rural
Number of rural people 3,351,993 2
Percent of public 20.9% 33schools in rural areas
Percent of publicschool10.2% 41students enrolledin
rural schools
Percentof studentsenrolled in rural schools 31% II
whoare minorities
Average number ofstudents to average 58.7 25number of grades
Percent of rural students 7% 35attending smallschools
Percentof rural students16in poverty 20.4%
Urgency Gauge TX Rank
A rank of 1 is mosturgent
Average rural teacher's $26,716 21salary
Difference between ruralteachersalaries and
$2,164 34teachersalaries in therest of the state
Percent of rural studentswhoare free lunch 34.2% 15eligible
Percentof ruralcommunities scoring 24.1% 18belowaverage on theEducation ClimateIndex
Average rural student to 12.9 44teacherratio
Percent of rural37.6% 13householders with less
than 12yearsof school
Percentof rural schoolswith Internet access 83.9% 38
Percentof teachersteaching out-of-field 12.4% 37whoare rural
Percent of ruralexpenditures spenton 52.5% 26instruction
Percentof rural schoolswith declining
17% 30enrollments of at least .10%

114 BEESON AND STRANGE
\
oUT
.US
oUT
.US
oUT rural
.UT nonrural
22.6
Urgency Gauge
19.2 18
[]21.9
Percent of rural students in poverty
Percent of householders with less than12 years of school (no diploma)
Percent of public schools in rural areas
oUT
.US
oUT
.US
oUT rural
.UTnonrural
13
24.8
Importance Gauge
Percent of populationliving in rural places
27
Percent of students who arefree lunch eligible
Percent of public school studentsenrolled in rural schools
UTAH does not have many rural people (rank 44) and they do not constitute a very large percentage of the state's population (rank 45). Very few of itsstudents go to rural schools, and nearly one third of the rural schools sufferdeclining enrollment. Teacher pay in rural Utah is about average for ruralAmerica, and this is one of only two states (the other is Nevada) where theaverage rural teacher pay is higher than for nonrural teachers.
Importance Gauge UT Rank
A rankof 1 is mostimportant
Percent of state's 13% 45population that is rural
Number of rural people 223,769 44
Percent of public 20.2% 37schools in rural areas
Percent of public school9.3% 45students enrolled in
rural schools
Percent of studentsenrolled in rural schools 12% 25who are minorities
Average number ofstudents to average 63.3 27number of grades
Percent of rural students 6.2% 38attending small schools
Percent of rural students18in poverty 19.2%
Urgency Gauge UT Rank
A rank of 1 is mosturgent
Average rural teacher's $25,679 ISsalary
Difference between ruralteacher salaries and
$-283 49teacher salaries in therest of the state
Percent of rural studentswho are free lunch 27% 25eligible
Percent of ruralcommunities scoring 7.3% 29below average on theEducation Climate Index
Average rural student to 16.9 14teacher ratio
Percent of rural21.9% 42householders with less
than 12 years of school
Percent of rural schoolswith Internet access 76.7% 25
Percent of teachersteaching out-of-field 13.3% 34who are rural
Percent of ruralexpenditures spent on 51.7% 20instruction
Percent of rural schoolswith declining
29% 9enrollments of at least10%

STATE-BY-STATE RESULTS 115
\
oVT.us
oVT.US
oVT rural
.VT nonrural
60.6
22.6
Urgency Gauge
68.6
22.4
Average number of rural students tonumber of grades
Percent of householders with less than12 years of school (no diploma)
Percent of public schools in rural areas
oVT.us
oVT.us
oVT rural
.VTnonrural
24.8
$36,414
S8
Importance Gauge
Percent of populationliving in rural places
67.8
Average base teacher salary
Percent of public school studentsenrolled in rural schools
VERMONT ranks first in the percentage of its population living in ruralplaces and students attending rural schools, and ranks second in the percentageof schools located in rural places. There are few rural minorities and relativelylittle rural poverty. Rural teachers are paid about the national rural average, buta whopping 26% less than nonrural teachers in Vermont. Rural schools spendless of their budget on instruction than in any other state, but more than 95% ofrural schools are connected to the Internet. Rural schools are crucial to Vermont'seducational system, and the need for policy attention is critical.
Importance Gauge VT Rank
A rank of 1 is mostimportant
Percent of state's 67.8% Ipopulation that is rural
Number of rural people 381,609 40
Percent of public 68.6% 2schools in rural areas
Percent of publicschool58% Istudents enrolled in
rural schools
Percent of studentsenrolled in rural schools 1.6% 47whoare minorities
Average number ofstudents to average 40.3 9number of grades
Percent of rural students 15.1% 5attending small schools
Percentof rural students41in poverty 12%
Urgency Gauge VT Rank
A rank of 1 is mosturgent
Average rural teacher's $27,005 23salary
Difference between ruralteachersalaries and
$9,409 2teacher salaries in therest of the state
Percent of rural studentswhoare free lunch 32.6% 17eligible
Percent of ruralcommunities scoring 1.3% 42belowaverage on theEducation Climate Index
Average rural student to 13.4 40teacherratio
Percentof rural22.4% 41householders with less
than 12yearsof school
Percentof rural schoolswith Internet access 95.2% 48
Percentof teachersteaching out-of-field 25% 23whoare rural
Percent of ruralexpenditures spenton 42.2% Iinstruction
Percent of rural schoolswithdeclining
21% 22enrollments of at least10%

116 BEESON AND STRANGE
\
oVAII US
oVA.US
oVA rural
.VA nonrural
Urgency Gauge
21.1
26.3
42.5
Percent of rural minority students
Percent of householders with less than12 years of school (no diploma)
Percent of public schools in rural areas
oVA.US
oVA.US
.VA nonrural
oVA rural
Importance Gauge
Percent of populationliving in rural places
19
30.6
[j
Percent of students who arefree lunch eligible
Percent of public school studentsenrolled in rural schools
29.2
[j
In VIRGINIA, nearly 1.9 million people live in rural places, and on mostother indicators, the rural factor is moderately important. More than two infive rural adults lack a high school education and nearly one third of the teachers teaching out-of-field serve rural students. Overall, Virginia's rural schoolsare an important part of the state's education system, and the need for policyattention is critical.
Importance Gauge VA Rank
A rank of 1 is mostimportant
Percent of state's 30.6% 28population that is rural
Number of rural people 1,893,915 12
Percent of public 26.3% 24schools in rural areas
Percent of public school19% 24students enrolled in
rural schools
Percent of studentsenrolled in rural schools 21.1% 17who are minorities
Average number ofstudents to average 101.7 45number of grades
Percent of rural students 9.3% 21attending small schools
Percent of rural students29in poverty 14.9%
Urgency Gauge VA Rank
A rank of 1 is mosturgent
Average rural teacher's $27,358 26salary
Difference between ruralteacher salaries and
$3,655 19teacher salaries in therest of the state
Percent of rural studentswho are free lunch 29.2% 23eligible
Percent of ruralcommunities scoring 37.1% IIbelow average on theEducation Climate Index
Average rural student to N/A N/Ateacher ratio
Percent of rural42.5% 8householders with less
than 12 years of school
Percent Ofrural schoolswith Internet access 90.5% 45
Percent of teachersteaching out-of-field 31% 12who are rural
Percent of ruralexpenditures spent on 53.3% 30instruction
Percent of rural schoolswith declining
16% 40enrollments of at least10%

STATE-BY-STATE RESULTS 117
\
oWA.us
oWA.US
oWA rural
.WA nonrural
22.6
18
19.2
Urgency Gauge
I24.8
Percent of rural students in poverty
Percent of householders with less than12 years of school (no diploma)
Percent of public schools in rural areas
oWA.us
oWA.US
oWA rural
.WA nonrural
Importance Gauge
Percent of populationliving in rural places
23.6 24.8
12.6 13
Average base teacher salary
$32,549$34,783
Percent of public school studentsenrolled in rural schools
There are more than 1.1 million rural people in WASHINGTON, and it has
the second highest average rural student to teacher ratio. It does not score highon any other indicator. Overall, rural education is important in Washingtonsimply because there are so many rural people. .
Importance Gauge WA Rank
A rank of1 is most important
Percentof state's 23.6% 35population that is rural
Numberof rural people 1,148,744 22
Percentof public 20.7% 35schools in rural areas
Percentof public school12.6% 36studentsenrolled in
rural schools
Percentof studentsenrolled in rural schools 16.3% 21who are minorities
Average numberofstudents to average 63.4 28numberof grades
Percentof rural students 7.2% 33attending small schools
Percentof rural students26in poverty 15.9%
Urgency Gauge WA Rank
A rank of 1 is most urgent
Average rural teacher's $32,549 38salary
Difference betweenruralteacher salaries and
$2,234 33teacher salaries in therest of the state
Percentof rural studentswho are free lunch N/A N/Aeligible
Percentof ruralcommunities scoring 5.7% 34below average on theEducation Climate Index
Average rural student to 18.9 2teacher ratio
Percentof rural24.8% 32householders with less
than 12years of school
Percentof rural schoolswith Internetaccess 77.6% 28
Percentof teachersteachingout-of-field 15.2% 33who are rural
Percentof ruralexpenditures spent on 52.4% 25instruction
Percentof rural schoolswith declining
20% 25enrollmentsof at least10%

118 BEESON AND STRANGE
\
oWV.US
oWV.US
oWVrural
.WVnonrural
22.6
Urgency Gauge
28.5
49.6
44.1
Percent of rural students in poverty
Percent of householders with less than12 years of school (no diploma)
Percent of public schools in rural areas
oWV
.us
oWV.us
oWVrural
.WV nonrural
13
24.8
Importance Gauge
49.7
63.9
Percent of populationliving in rural places
Average base teacher salary
Percent of public school studentsenrolled in rural schools
In WEST VIRGINIA, nearly two out of three people live in a rural place(rank second). Half the public schools are rural, but only 13% of the studentsgo to those schools. More than one fourth of the rural students live in poverty,and nearly half qualify for free lunches. The state ranks in the top ten in thepercentage of rural adults with less than 12 years of school, percentage of ruralschools with declining enrollment, and percentage of teachers teaching out offield who serve rural schools. Rural education is crucial in West Virginia, andthe need for policy attention is urgent.
Importance Gauge WV Rank
A rankof 1 is mostimportant
Percent of state's 63.9% 2population that is rural
Number of ruralpeople 1,145,293 23
Percent of public 49.6% 9schools in ruralareas
Percent of public school49.7% 2students enrolled in
rural schools
Percent of studentsenrolled in rural schools 2.6% 41whoare minorities
Average number ofstudents to average 62.9 26number of grades
Percent of rural students 13.5% 8attending smallschools
Percent of rural students6in poverty 28.5%
Urgency Gauge WV Rank
A rankof 1 is mosturgent
Average rural teacher's $28,207 28salary
Difference between ruralteachersalaries and
$2,352 30teachersalaries in therest of the state
Percent of rural studentswhoare free lunch 46.6% 5eligible
Percent of ruralcommunities scoring 47.9% 8belowaverage on theEducation Climate Index
Average rural student to 14.4 33teacher ratio
Percent of rural44.1% 6householders with less
than 12 years of school
Percent of rural schools .with Internet access 83.5% 37
Percent of teachersteaching out-of-field 43% 5whoare rural
Percent of ruralexpenditures spenton 59.3% 47instruction
Percent of rural schoolswithdeclining
28% 10enrollments of at least10%

STATE-BY-STATE RESULTS 119
\
oWl.us
oWl.US
.WI nonrural
oWl rural
22.6
18
I
Urgency Gauge
33.9
28.9
[j
Percent of rural students in poverty
Percent of householders with less than12 years of school (no diploma)
Percent of public schools in rural areas
oWl.us
o wt rural
.WI nonrural
22
34.3
24.8
IoWl.us
Importance Gauge
Percent of populationliving in rural places
Average base teacher salary
Percent of public school studentsenrolled in rural schools
WISCONSIN is home to nearly 1.7 million rural people. It ranks above themiddle in 6 of the 8 rural "importance" indicators and 7 of the 10 "urgency"indicators. The pay gap between rural and nonrural teachers is the seventhlargest. Rural education is very important in Wisconsin, and the need for policyattention is critical.
Importance Gauge WI Rank
A rank of 1 is most important
Percentof state's 34.3% 20population that is rural
Number of rural people 1,679,813 15
Percent of public 33.9% 18schools in rural areas
Percent of publicschool22% 19students enrolled in
rural schools
Percent of studentsenrolled in rural schools 4.4% 35whoare minorities
Average number ofstudents to average 54.6 22number of grades
Percent of rural students 11.9% 14attending small schools
Percent of rural students38in poverty 12.8%
Urgency Gauge WI Rank
A rank of 1 is most urgent
Average rural teacher's $30,986 35salary
Difference between ruralteachersalaries and
$6,298 7teachersalaries in therest of the state
Percent of rural studentswhoare free lunch 15.7% 38eligible
Percent of ruralcommunities scoring 12.1% 21belowaverage on theEducation Climate Index
Average rural studentto 14.9 26teacherratio
Percentof rural28.9% 24householders with less
than 12yearsof school
Percent of rural schoolswith Internet access 72.7% 19
Percent of teachersteaching out-of-field 28.6% 17whoare rural
Percent of ruralexpenditures spenton 51.3% 18instruction
Percent of rural schoolswithdeclining
21% 23enrollments of at least10%

120 BEESON AND STRANGE
\
oWY.US
oWY.US
oWY rural
.WYnonrural
60.7
22.6
Urgency Gauge
46.2
22.8
Average number of rural students tonumber of grades
Percent of householders with less than12 years of school (no diploma)
Percent of public schools in rural areas
oWY.US
oWY.US
oWY rural
.WYnonrural
35
21.6
Importance Gauge
Percent of populationliving in rural places
Average base teacher salary
Percent of public school studentsenrolled in rural schools
Nearly half of WYOMING'S public schools are in rural places, they aresmall and they have small classes. Wyoming pays rural teachers well abovethe national average, explaining why it has among the highest proportion ofrural school expenditures going to instruction. Still, more than one third of itsrural schools suffer declining enrollment, one of the highest rates in the nation.Rural education is very important in Wyoming, and the need for policy attention is critical.
Importance Gauge WY Rank
A rank of 1 is mostimportant
Percent of state's 35% 19population that is rural
Number of rural people 158,953 47
Percent of public 46.2% IIschools in rural areas
Percent of public school21.6% 21students enrolled in
rural schools
Percent of studentsenrolled in rural schools 9.9% 28who are minorities
Average number ofstudents to average 28 6number of grades
Percent of rural students 10.7% 16attending small schools
Percent of rural students22in poverty 17.8%
Urgency Gauge WY Rank
A rank of 1 is mosturgent
Average rural teacher's $26,204 18salary
Difference between ruralteacher salaries and
$2,554 27teacher salaries in therest of the state
Percent of rural studentswho are free lunch 22.8% 28eligible
Percent of ruralcommunities scoring 7.1% 32below average on theEducation Climate Index
Average rural student to 11.9 46teacher ratio
Percent of rural23% 40householders with less
than 12 years of school
Percent of rural schoolswith Internet access 81% 34
Percent of teachersteaching out-of-field 29.9% 13who are rural
Percent of ruralexpenditures spent on 50% 12instruction
Percent of rural schoolswith declining
36% 3enrollments of at least10%

IMPORTANCE
INDICATORS
(STATE-BY-STATE COMPARISON)

122 BEESON AND STRANGE
Percentage of Population in Rural Places
l' -0T.8"WV -63.
ME-5 AMS - 52.9
SD-50~C - 49.6H-49
K - 48.2M" - 47.5
ND 46.7AR- 46.5
SC -4 Aill - 42.6
AL - 39.6A-39AN - 39.1
GA 36.8IN - 351WY-3
WI -34NE 33.9
AK - 32.5OK - 32.2
LA· 31.9MO -31.1PA - 31.1KS -30.9VA - 30.6
MN -30.1PR - 29.5~I - 29.5
NM 27DE 27
OH- 5.9US - 246
WA - 23.1CT - 20.9
TX -19.71\ D -18.7
CC -17.6NY- .7MA- 5.7IL -IS 4FL-l:~
RI -14UT-13
AZ -12.5NV - 11.7
HI -11NJ -10.6
CAI-7.4
o 10 20 30 40 50 60 70 80
Definition: The percentage of people living inplaces with 2,500 people or less, as designated bythe U.S. Census.
Source: U.S. Census Bureau, 1990 Census ofPopulation and Housing, "Population and HousingUnit Counts," CPH-2-1. Table 1. Urban and RuralPopulation: 1900 to 1990.

IMPORTANCE INDICATORS 123
Number of People Living in Rural Areas
8PA 3,693 34TX ~,351,993
NC3 ~90,859NY ,826,408
OH2~07,706M12,73~,455
G 2,380,877CA 2,18~ 700
L 1,970,598I ~ 1,946,060
T 1,907,237Vi 1,893,915
KY 1, 74,971IL 1,71 2,050
WI 1,679 13MO 1,601,0 ~
AL 1,601,03SC 1,581,325
MS 1,362,487LA ,348,214
MN ,318,625WA 1,148, 44WV 1,145 93
IA 1,093,69fjAR 1,092,70
OK 1,015,4461A 946,822
M ) 893,039OR 39,050NJ8 9,968
KS76 ,010CT685,6ME 680,1 114
CO 578,877NH 543,582NE 534,40i
Z 458,255I ~ 428,535
N rt 409,418VI 381,609M 379,239
SO 48,101N02 8,461
i====J UT 223 ~9
~ OE179,61 7~ AK178,8 8~ WY158,9 3~ NV 140,38~ R1140,083~ HI 122,058
o 500,000 1,000,000 1,500,000 2,000,000 2,500,000 3,000,000 3,500,000 4,000,000
Definition: The number of people living in placeswith populations of 2,500 or less.
Source: U.S. Census Bureau, 1990 Census ofPopulation and Housing, "Population and HousingUnit Counts," CPH-2-1. Table I. Urban and RuralPopulation: 1900 to 1990.

124 BEESON AND STRANGE
Percentage of Public Schools in Rural Areas, 1997-98
SU -73.5
'T - 68.6ND- 5.8
MT - 63.2NE - 57.4
ME 56.6AK-54~
NH -49.7WV -49.6
IA - 47.8WY- 46.2
KS-4 .2ID - 42.6
AR - 42.2OK- 41.7
KY- 5.8MO- ~.3
WI -33.~
MS - 32.1MN·30.2~C - 29.1
N1fi-28.1AL - 27.3
VA- '6.3US-24CO-24
LA-24IN - 23.9SC - 23.8TN· 23.6
MI - 22.7OR - 21.8IL - 21A
TX - 20.9OH-20.9WA -20.7PA - 20.6UT - 20.2
NV -19.6D I<.: - 18.3G'\ - 18.2
NY- 16.4HI-I 5.9CT- 5.7
MD-I .9MA -11.9
AZ - 11.1E1-8.6
FL- 7CA- .1
~NJ-4i
o 10 20 30 40 50 60 70 80
Definition: The number of public schools in eachstate located in areas with populations of 2,500 orless. These include elementary, middle, and highschools. All schools are included in this countexcept for closed schools.
Source: U.S. Department of Education, NationalCenter for Education Statistics, Common Core ofData, Public School Universe, 1997-98.

IMPORTANCE INDICATORS
Percentage of Students Enrolled in Rural Schools
125
V ·:l1S
Ivv . 49.1M ·48.1
SD· 44.~ND·42.3
MT·32.5NH·32.2
IA ·31.7NE·30.2
I\R·29.4~ S· 28.7K~· 28A
ID 27.8KS 27.1
NC·24.1OK· 23.1AK·23AL· 23
WI ·22MO· 21.9WY·21.6MN·21.4
IN -19.7A·19
N·18.8L!\·18.6M ·18.2S( • 18.1
DE 17.5PA· 6.5OH· 6.4
GA· I .8MD ·13.3US·13NM ·12.9HI ·12.8WA ·12.6CT ·12.6
CO· 11.7OR ·11.6NY ·11.4
TX·IO.2IL - 10.2
MA-9.9IRI . 9.5pT.9.3
N\ ·7.7AZ·5
r===::J FL· 4.7i====J NJ ·4.5P CA-2.1
o 10 20 30 40 50 60 70
Definition: The percentage of all public schoolsstudents who attend schools in rural areas.
Source: U.S. Department of Education, NationalCenter for Education Statistics, Common Core ofData, Public School Universe, 1997-98.

126 BEESON AND STRANGE
Percentage of Students Enrolled in Rural Schools Who Are Minorities
I HI - 7: f.'i\K - 69.3
NM-62.9MS-50
Sc - 48AZ - 41.1
LA - 37.7AL -33A
NC - 31.3DE - 31.2TX-31
CA - 29.7)K - 29.1
GA 26.8FL- 26.6
NV -23VA - 21.1
MD - 20.5CO 16.8AR- 16.5US- 6.4WA 16.3
SD - 1 .3MT -13.2
NJ - 12.2UT-12
OR-llAND -10.5
WY -9.9T ~ - 8
MN 6.6MI- ~.3
CT- ",.2KS- 6
~NY-4.~WI-4A
~ NE-4.3 \~IL-4.0
===:J RI - 3.8 \
~MA-3.8
~PA-2.7
:::::J WV - 2.6==:J KY - 2.6::::J MO- 2.3~ ME-2.2b IA-2.2:::J OR - 1.8pVT-1.6pIN-lA
b NH - lA
o 10 20 30 40 50 60 70 80
Definition: The number of rural minority studentsas a percentage of all rural students.
Source: U.S. Department of Education, NationalCenter for Education Statistics, Common Core ofData, Public School Universe, 1997-98.

IMPORTANCE INDICATORS
Average Number of Rural Students to Average Number of Grades
127
RI 134.6DE -12S I
GA ·127MD -126.NJ -125.7
VA -101.6NC·99.2PA - 98.8
S - 96.4N' - 95.3
FL - 9<.5CT -89
HI-87.7TN - 87.5
MS - 84.9MA·84.8MI - 84.7
N - 78.7( H -77.4
KY- 1'72.6LA-7(
AL·67.4WA-63.4UT - 63.3WV -62.9
US - 60.7Irx - 58.7
Atz -56.8NIl - 55.1WI - 54.610- 54MN 53.1
ME.~~.8AR - 5(.1CA - 4~ 7
NV-48.MO-48
IL - 45.7CO -44.4OR - 44.3IA·43.9
NM - 41.8VT - 40.3
~ S - 37.3CK -37
WY-28SD - 24.5
MT- 22.9ND - 21.4
. rlE -18.7AK 13.5
o 20 40 60 80 100 120 140 160
Definition: A ratio of the average number of ruralstudents in rural schools to the average number ofgrades in rural schools. Because schools havedifferent grade configurations, this is a proxy forschool size.
Source: U.S. Department of Education, NationalCenter for Education Statistics, Common Core ofData, Public School Universe, 1997-98.

128
RI - 1.4CA -1.4
BEESON AND STRANGE
Percentage of all Students Attending Small Rural Schools, 1997-98
ME-16ND -15.2
VT ·15.1KS 14.2
OK· 3.9WV -13 5
MO -12.7ID -12.6
KY ·12.4SO -12.1NH ·12.2
WI ·11.9MS ·11.5
WY -10.7NC -10.5
S - 9.6N ·9.5Lp - 9.4VA·9.3
AL 9.2MN· ;9
MT·8 ~
IN -8.AK-8.
NM - 8':TN ·8.1OR·8
OH - 7.8CO-7.7
IL·7.4WA -7.2MI· 7.2
US-7TX-7
GA - 6.9NY - 6.8
UT - 6.2PA-6
HI- 5.3NV -5.1MO-S.lCT - 5.1
OE 4.2AZ -3.~
MA·3FL - 2.8
AK·17.'J
IA -17.8
o 5 10 15 20
Definition: The number of students living in ruralareas and attending schools with enrollments belowthe state median, as a percentage of all public schoolstudents.
Note: Data not available for ID
Source: U.S Department of Education, NationalCenter for Education Statistics, Common core ofData, Public School Universe 1997-98.

IMPORTANCE INDICATORS
Percentage of Rural Children in Poverty
129
N1VI • .3~ •
AZ - 35.7A - 34.5
M - 33.7KY-3.4
'" V - 29AR - 25.9
SD - 25.5A - 24.1
S( - 23.9MT 23.4
FL- 3TN -22
OK - 21.7ND - 21.4
TX - 20.4GA -19.9
U~ -19.2N( - 19M ) - 19
OR 18.5US- 8
WY- 7.8DE -17
ID - 16.6CA - 16.4
WA-15.9MI - 15.7AK -15.7
VA -14.9S - 14.7
~E - 14.3
- 14.2P - 14.1Ofl-14.1C) - 14.1
MN 13.4IA - 1 .9WI -1 .8
IL - 12.NV-12NY -12VT-12
MD - 10.5IN - 10.2
NH- 8.1MA- .7
RI - 6.1CT - 5.7
NJ - 4.9
4
o 5 10 15 20 25 30 35 40
Definition: The percent of all children living inrural areas who are below the federal poverty level,as designated by the U.S. Census. Due to the factthat these figures are based on the 1990 U.S.Census, they are dated but are still the most recentfigures available for both state and locale.
Note: Data not available for HI
Source: U.S. Department of Education, NationalCenter for Education Statistics, Common Core ofData, Agency Universe, and Special CensusTabulation 1990.

URGENCY
INDICATORS
(STATE-BY-STATE COMPARISON)

URGENCY INDICATORS
Average Rural Teaching Salary, 1993-94
131
AK $44.127CT~ ~2,909
NY $40,69NJ $40,591
PA 1i'38,190RI$3 ,512
DE $35,9 2MA $35,7 2MI $35,51
MD $35,26CA 33,151
NV$ 2,747WA$~2,549
IN $31, 18HI$31, 46
WI $30,9 6OH $30,8 5
~~N $29,244F~ $29,026Kiv $28,858
A $28,693m $28,655NI $28,564
W' $28,207SC 28,068
VA$ 7,358KS$", ,338GA$2 ,094VT$2 ,005
NC$26 ,818TX$26 716ME $26 91CO $26, 00
WY $26. 04NM $26,( 6
UT$25,67OK $25,62OR $25,45
TN $24,687L $24,675
P $24,369A~ $24,114
IA $23,726LA $23,257MS 23,108AL 23,095MT 22,988
NE$ ~,434MO$21 1556
SD $21,2~5
ND $20.32~
$0 $5,000 $10,000 $15,000 $20,000 $25,000 $30,000 $35,000 $40,000 $45,000 $50,000
Definition: The average rural academic year baseteaching salary. Although these figures are from the1993-94 school year, they are the most recent figuresthat are available at both the state and locale levels.
Source: U.S. Department of Education, NationalCenter for Education Statistics, Schools and StaffingSurvey Public School Teacher Questionnaire, 199394.

132
UTNV ·$8
BEESON AND STRANGE
Difference Between Average Rural Teacher Salary and Teacher Salaryin the Rest of the State
IL IU,'J""VT$9,409
MI $8,~ 2
MS $7,9 °MO $7,511
OR $7,446WI$ ,298
US $6, 24NY $6, 11
CA $5,686NH $5,643
CO $5,559CT$5,241SD $5,235
IA $5,014M $4,519
TN 4,364ND $3,86
ME $3,77VA $3,655
PA $3,449IN $3,420
AR $3,196OH$3,0151$2,848
J1$2,740Z;$2,717$2,554
LA )2,484NE$ ,362WV 2,352KS$ ,309GA$ ,241WA$ .234
TX$2 ~64ID $2,~~9
FL $1,9 7MS $1,9 3
DE $1,678KY $1,589
AK $1,307AL $1,192
MD$I,093OK $1,092
c:::=:::J MA $904c::::::::J J$835CJNM 370o SC$ 15o NC$ 37
-$2830lL:::::J
($1,000) $1,000 $3,000 $5,000 $7,000 $9,000 $11,000 $13,000
Definition: The difference between the average ruralteacher salary and the teacher salary in the rest of thestate shows how much less or more rural teachersearn than their counterparts in the rest of the state.
Source: U.S. Department of Education, NationalCenter for Education Statistics, Schools and StaffingSurvey, Public School Teacher Questionnaire, 199394.

URGENCY INDICATORS
Percentage of Rural Students Who Are Free Lunch Eligible, 1997-98
133
I I I I I I MS _60.8
SC - 51.8} Y ·49
L 1\ - 48.6WV- ~6.6
GA-44CA· 43.5
OK-43AR - 42.4
FL - 42AL -40.7
SD·40.4K-39.1
HI- ~.8
NV - 34.2
TX - 34.2VT - 32.6
DE - 31.7OR - 31.6
MO- 30.1MT - 29.8S - 293A - 29.2
N - 28310- 7UT- 17
ME-24WY·22.8
MI - 21.9
CO - 21.4MN -20.6
NY - 203NC -203
NE -19.7IA 17.9
MD 17.2OH-l .8WI -1 .7
IN -ISNH -12.1
RJ-113NJ - 10.1
CT-5.
o 10 20 30 40 so 60 70
Definition: The percent of rural students who are freelunch eligible is the count, by each rural school, ofstudents eligible for free lunch programs. This is ameasure of the socioeconomic status of schools.
Note: Data not available for AZ, fL, MA, NM. PA,WA
Source: U.S. Department of Education, NationalCenter for Education Statistics, Common Core ofData, Public School Universe 1997-98.

134 BEESON AND STRANGE
Percentage of Rural Communities Scoring Below Average on the Education ClimateIndex, 1997-98
l~- b7.b- 67.2
KY - 63.5MS-63
AL- 5.7SC-54
LA-54W W' - 47.9
GA-43.MO - 42.3
VA 37.1NC-3 .2
NM-3 .8OK -32.6
.. ND - 30.2~D - 29.2
Fl - 27.7TX-24.
US - 21.8AK -19.8
AZ -1 .2WI -12.1MN -11.9
OH-11PA -10.9
A -8.9
Ii[E- 8.8- 7.9
IN 7.6UT -7.3MI -7.3CO -7.2M -7.1
ME 6.2WA- .7MT- .6MD- .510-5
P== IA-4.8~HI-4J11;=:= OR - 4.1~ KS-3.5i=J VT - 1.3
NY -0.6NH - 0.5
R - 0
~~--~l\' A-ODE-OCll' - 0
o 10 20 30 40 50 60 70 80
Definition: The Education Climate Index (ECI) is ameasure of socioeconomic status by zip codedeveloped by Quality Education Data. The factors ofthe index are income, educational attainment, andoccupation of persons within the zip code. The ECIdoes not reflect the status of any given school, but ofthe population of an entire zip code. It is divided intocategories of low, below average, average, aboveaverage, and high.
Note: Data not available for MA, MN, TN, and VA
Source: Cross-tabulation of public schoolsby state: ECI and metro status. Prepared byQuality Education Data, Denver, Colorado.August 1999.

URGENCY INDICATORS
Average Rural Student to Teacher Ratio, 1997-98
135
CI\ -19.4WA 18.9
Ml- U.5OH -1 .4
MD -18,IN - 17.9FL - 17.9
OR-17.5AZ - 17.4MS -17.3PA -17.210-17.2HI -17.2
UT -16.9DE -16.9
AL -16.7GA - 16.5
AR -16.4NV -16.2
LA - 15.8US -15.6NM -15.5
KY -15.4SC - 15.3IL - 15.3
CO - 15.1WI -14.9H -14.7~E -14.71- 14.6
~C -14.6
IK -14.5AIK - 14.5
W~ -14.4N' - 14.3NJ - 14.3
SD 14CT- 3.8MO- 3.7
MT-l .5VT -13 4KS -13 4IA -13
ND-13TX -12.9
NE -12.4WY -11.9
o 5 10 15 20 25
Definition: The average rural student to teacher ratiois a proxy for the average class size in rural schools.It is the count, by school, of the number of students toevery one teacher.
Note: Data not available for HI
Source: U.S. Department of Education, NationalCenter for Education Statistics, Common Core ofData, Public School Universe 1997-98.

136 BEESON AND STRANGE
Percentage of Rural Householders with Less Than 12 Years of School, No Diploma
I\. Y - :IV.,
TN - 49.7MS 47.5
SC - 46~AL-45
WV -44.1AR - 43.7
VA - 42.5LA - 42.3
GA - 41.8NC - 41.6
FL. -38.9TX 37.6
MO- 6.7ND - 35.3
NM -34.3AZ - 34.3
OK-33ADE - 33.3
SD - 32.7MN -32.1
PA - 30.5MD - 30.2
, 1-28.9L ~ - 28.8o ~ -28.5
MJ - 28.2AI - 28.2
IN 28IL 28
NY -25.10-25WA - 24.8OR - 24.6NE - 24.5IA - 24.5
MT - 24.2KS-24
ME- 23.4NV - 23.3
WY-23VT - 22.4
UT - 21.9~O -19.6
Nfl -18.6RI 17.8
CA- 6.9CT - ~.6
MA-l.lNJ-13.4
o 10 20 30 40 50 60
Definition: The percent of rural householders withless than 12 years of school and no diploma is basedon the 1990 U.S. Census. These figures represent thepercentage of householders in rural areas, aged 15and over, who have not completed high school. Asof yet, there are no reliable state-by-state statistics ondropouts by locale.
Source: U.S. Department of Education, NationalCenter for Education Statistics, Common Core ofData, Agency Universe 1997-98.

URGENCY INDICATORS
Percentage of Rural Schools with Internet Access, 1997-98
137
o 10 20 30 40 60 70 80 90 100
Definition: The percentage of rural schools that haveinternet access.
Source: Cross-tabulation of public schoolsby state: Internet access and metro status.Prepared by Quality Education Data,Denver, Colorado, February, 2000.

138 BEESON AND STRANGE
Percentage of Out-of-Field Teachers Who Are Rural
I su - 6UK~ - 58
ND-49.9MT-43.9
WV-43MS- 6.7IA -, .5
ID -35MN -351
OK -34.AR - 32.4
VA -31WY -29.9
Nc -29.5
~E - 28.9E -2871- 28.6
A} - 2808 -27AIN - 27.1MI- 27
NV -2 fsVT-25
KY-24.AL - 20.6
TN -19.7~A -19A
LA - 17.8NH 17ASC 17.3
MI- 6ANM- 6A
WA -1 .2UT - 13.3
MD- 13.1CO -12.8TX-12AIL -12.1
NE -10.8m -10.3
FL - 9.6PA-9A
l\ A - 8.50 - 8.1
AZ 7NJ - (.3
NY- .3CA-5~
CT-5b RI-2.5
o 10 20 30 40 50 60 70
Definition: The percentage of all teachers whosemain teaching assignments do not correspond withtheir major or minor. These figures represent theproportion of teachers who teach in rural schools.The data are from 1993-94, which is the most recentdata available that can be broken out by both stateand locale.
Source: U.S Department of Education, NationalCenter for Education Statistics, Schools and StaffingSurvey, Public School Teacher Questionnaire, 199394.

URGENCY INDICATORS
Average Percentage of Rural School Expenditures Spent on Instruction
. Nt!. - b~.Y
RI - 60.1WV.59.3
~ T - 58.9N - 58.3
CA 57.6OK - 56.6ME -~6.5
MS - 6.2AR - '~.2SD-5OR·5.7
AL-S5TN-54.
NC -54.1MI - 53.8MN - 53.8OH -53.7MD-53.4VA - 53.3US· 53.1ID - 53.0MO - 52.8AK - 52.6TX - 52.5WA-52.4LA - 52.3
DE - 51.6PA - 51.9KY - 51.8UT - 51.7GA - 51.6WI - 51.3CO·51.2
CT - 51.0IL·50.9IA - 50.9
SC - 50.5WY -50.0MA -49.7NH -49.7N - 49.2
NP -48.5N ·48.1
KS· 6.8FL- 6.6
NV· 45 4NM-44.AZ·44.5
139
o 10 20 30 40 50 60 70
Definition: The percent of all expenditures in ruraldistricts being spent on classroom interactionbetween teachers and students. The data are from1995-96, which was the most recent fiscal survey inthe Common Core of Data.
Source: U.S. Department of Education, NationalCenter for Education Statistics, Common Core ofData, Agency Universe, 1995-96.

140 BEESON AND STRANGE
Percentage of Rural Schools with Declines in Enrollment of at Least 10%,1993-97
K - -'ll.'ID-3 .7
WY -355rm -34.6MT-3 .4
SD·30.8CA - 29.9E-29A
lIT - 29.3wv , 7.6NM- 75
n. -24.6A - 23.9
N' -235LA 23.2
ME- ~2.8KS- 2.7
OR-2 1US- 21MN - 21.IA - 215MS - 21.5
VT- 21.3WI - 20.9
SC - 20.7WA-19.9110-195
OK -185MI- 18.2
MA 18AR-l .4TX-l .4
HI-17.CO -16.TN -16.NY -16.'AL -16.6
GA -16.3PA -15.6DE -15.6VA -155
II ~ - 14.3M -13.8NH -13.6
00 13.2AK-12
NC -10.2CT-9.2
IN - .9RI -~.9
FL - 6.3
o 5 10 15 20 25 30 35 40 45
Definition: The percentage of rural public schoolsthat have seen their enrollments decrease by at least10% between the school years 1993 and 1997.
Source: U.S. Department of Education, NationalCenter for Education Statistics, Common Core ofData, Public School Universe, 1993-94 and 1997-98.