Embed Size (px)
Citation preview
1
1/10/06 Marilyn Niemann, UAB/CORD 1
Why purify proteins?
• Detailed studies on function• Determination of structure• Industrial/pharmaceutical applications• Generate antibodies• Amino acid sequence determination
1/10/06 Marilyn Niemann, UAB/CORD 2
Protein purification issues• How much and how pure?
– Application– Source– Feasibility
• Native configuration?– Functional/structural (yes)– Microsequence (no)– Antibody (maybe)
• Detection Method– Functional assay– Antigenic assay– Band on gel
2
1/10/06 Marilyn Niemann, UAB/CORD 3
Affinitychromatography
binding to smallmolecules
Ion exchangechromatography
Isoelectric point(charge)
Size-exclusionchromatography
Size / shape
MethodsProperty
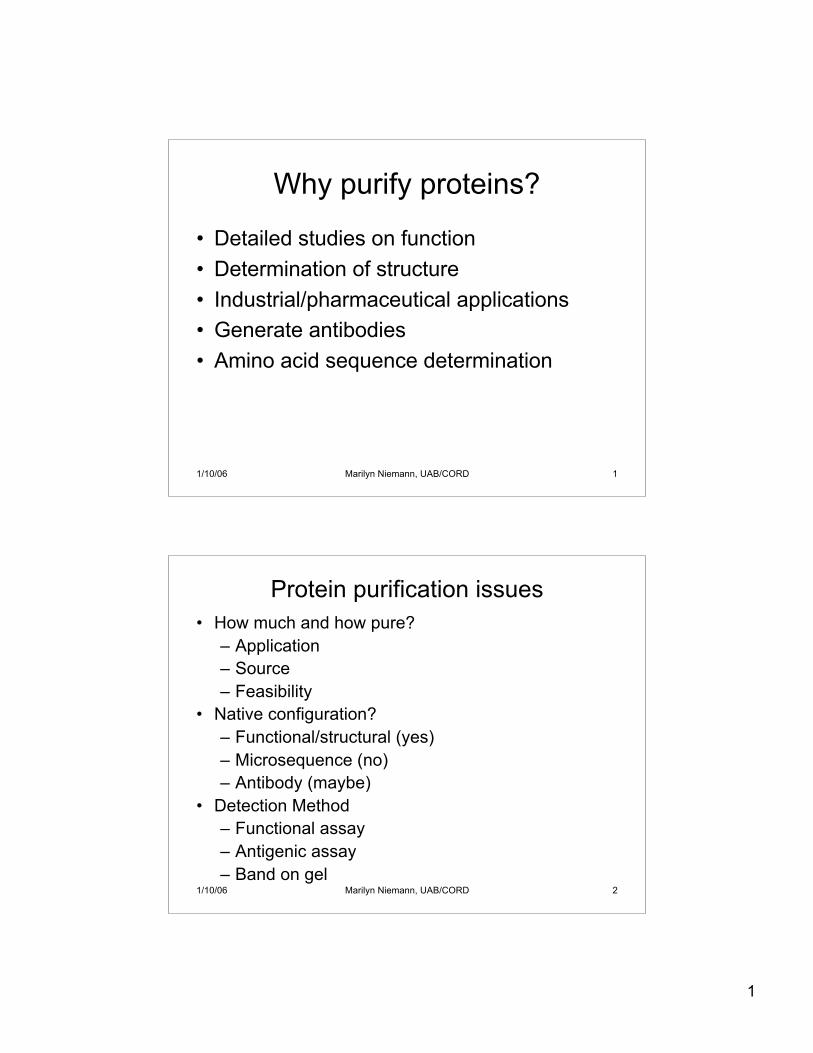
Table of common methods of protein purification
solubility Precipitation withammonium sulfate(salting out)*
*Ammonium sulfate precipitation is cheap, easy, and accommodates large sample sizes.It is commonly one of the first steps in a purification scheme.
• Purification proceduresattempt to maintain theprotein in native form.Although some proteinscan be re-natured, mostcannot!
• To purify a protein from amixture, biochemistsexploit the ways thatindividual proteins differfrom one another. Theydiffer in:– Thermal stability*
*For most protein purifications, all stepsare carried out at ~5°C to slow downdegradative processes.
1/10/06 Marilyn Niemann, UAB/CORD 4
3
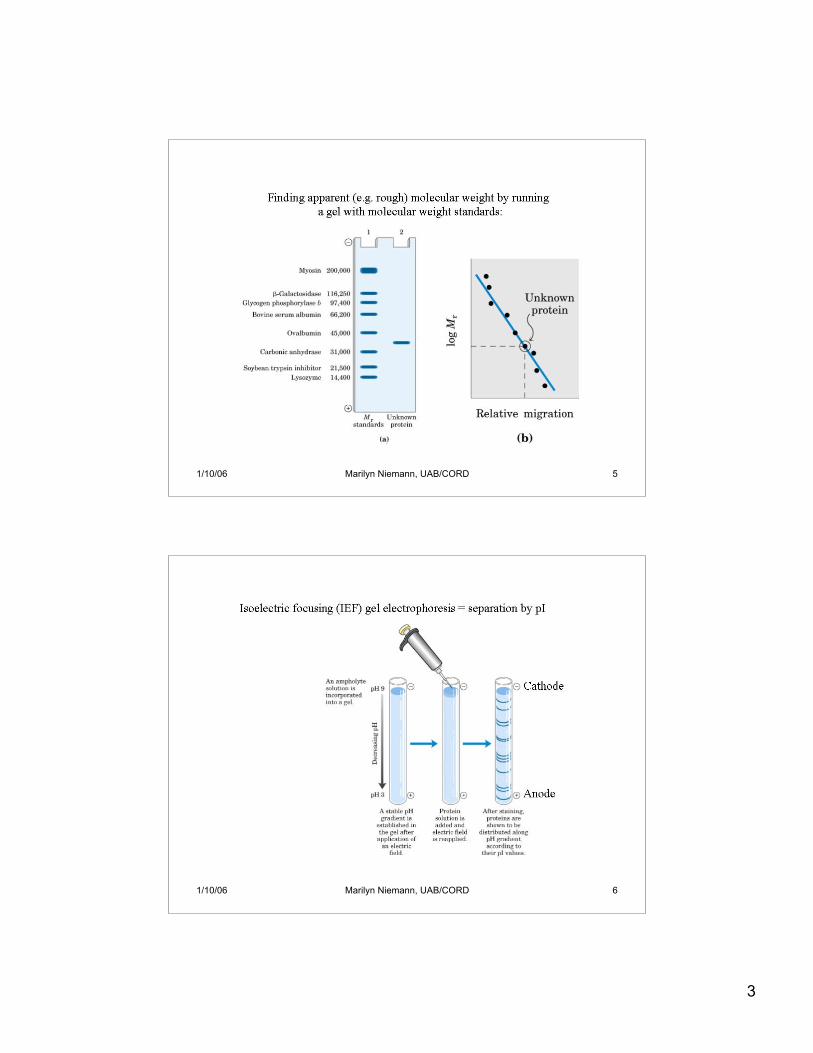
1/10/06 Marilyn Niemann, UAB/CORD 5
1/10/06 Marilyn Niemann, UAB/CORD 6
4
1/10/06 Marilyn Niemann, UAB/CORD 7
1/10/06 Marilyn Niemann, UAB/CORD 8
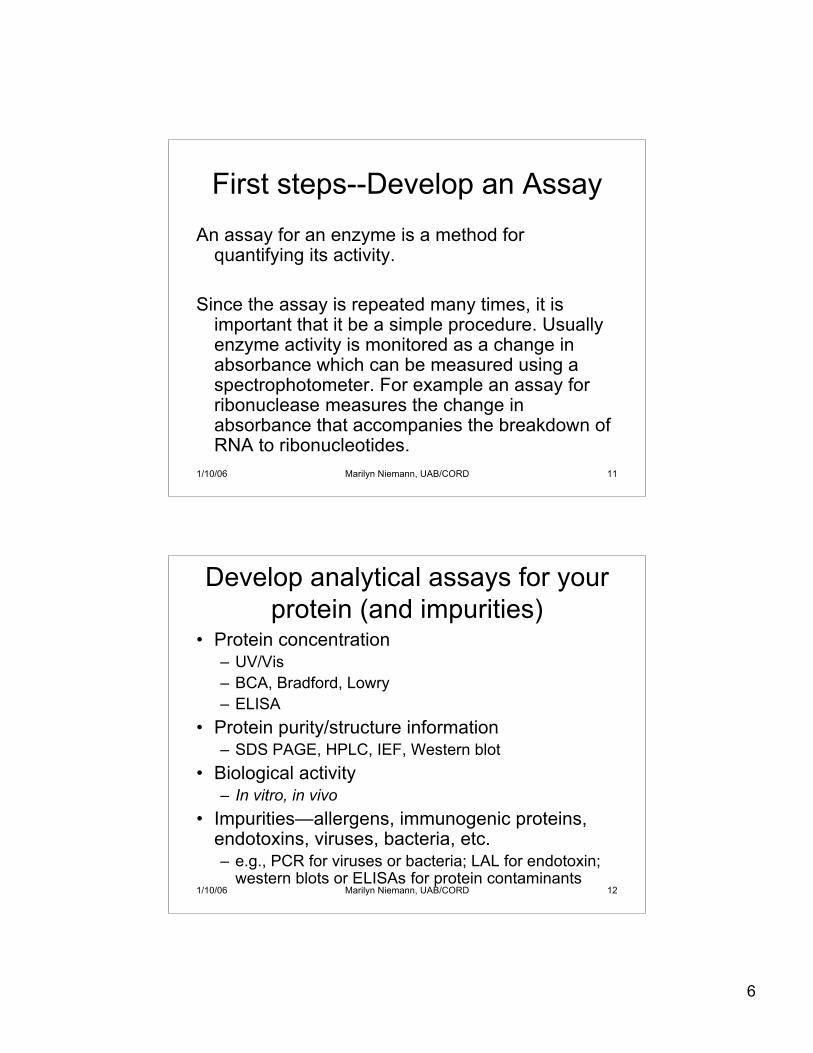
Define properties of target proteinand critical impurities
• Know your protein’s structure and function– pH, temperature stability (proteins may
precipitate at pH=IEP)– Effects of salt, detergent, organic solvent,
metal ions– Post-translational modifications that must be
present—these will affect structure andproperties
5
1/10/06 Marilyn Niemann, UAB/CORD 9
Strategy
1) Select a source2) Break open cells, separate components3) Keep the protein native (usually cold)4) Develop an assay to follow the protein5) Purification steps based on theproperties of the protein
1/10/06 Marilyn Niemann, UAB/CORD 10
First Steps
1. Source. A good source is cheap and readilyavailable. Many proteins are enriched inspecific tissues, for example hemoglobin inblood. For this reason, these tissues may beexcellent sources for your protein.
2. Assay. Most assays are chemical reactionscatalyzed by specific enzymatic activities.Proteins that have no activity are usuallyassayed using SDS polyacrylamide gels.
6
1/10/06 Marilyn Niemann, UAB/CORD 11
First steps--Develop an AssayAn assay for an enzyme is a method for
quantifying its activity.
Since the assay is repeated many times, it isimportant that it be a simple procedure. Usuallyenzyme activity is monitored as a change inabsorbance which can be measured using aspectrophotometer. For example an assay forribonuclease measures the change inabsorbance that accompanies the breakdown ofRNA to ribonucleotides.
1/10/06 Marilyn Niemann, UAB/CORD 12
Develop analytical assays for yourprotein (and impurities)
• Protein concentration– UV/Vis– BCA, Bradford, Lowry– ELISA
• Protein purity/structure information– SDS PAGE, HPLC, IEF, Western blot
• Biological activity– In vitro, in vivo
• Impurities—allergens, immunogenic proteins,endotoxins, viruses, bacteria, etc.– e.g., PCR for viruses or bacteria; LAL for endotoxin;
western blots or ELISAs for protein contaminants
7
1/10/06 Marilyn Niemann, UAB/CORD 13
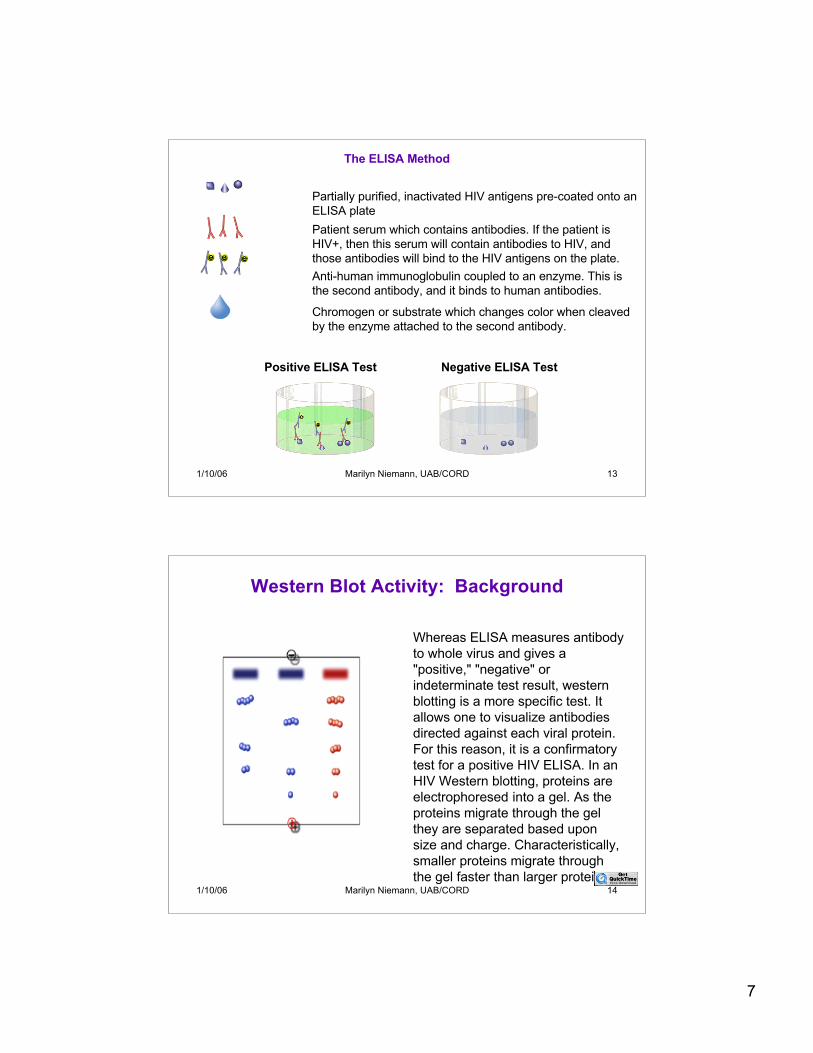
The ELISA Method
Chromogen or substrate which changes color when cleavedby the enzyme attached to the second antibody.
Anti-human immunoglobulin coupled to an enzyme. This isthe second antibody, and it binds to human antibodies.
Patient serum which contains antibodies. If the patient isHIV+, then this serum will contain antibodies to HIV, andthose antibodies will bind to the HIV antigens on the plate.
Partially purified, inactivated HIV antigens pre-coated onto anELISA plate
Negative ELISA TestPositive ELISA Test
1/10/06 Marilyn Niemann, UAB/CORD 14
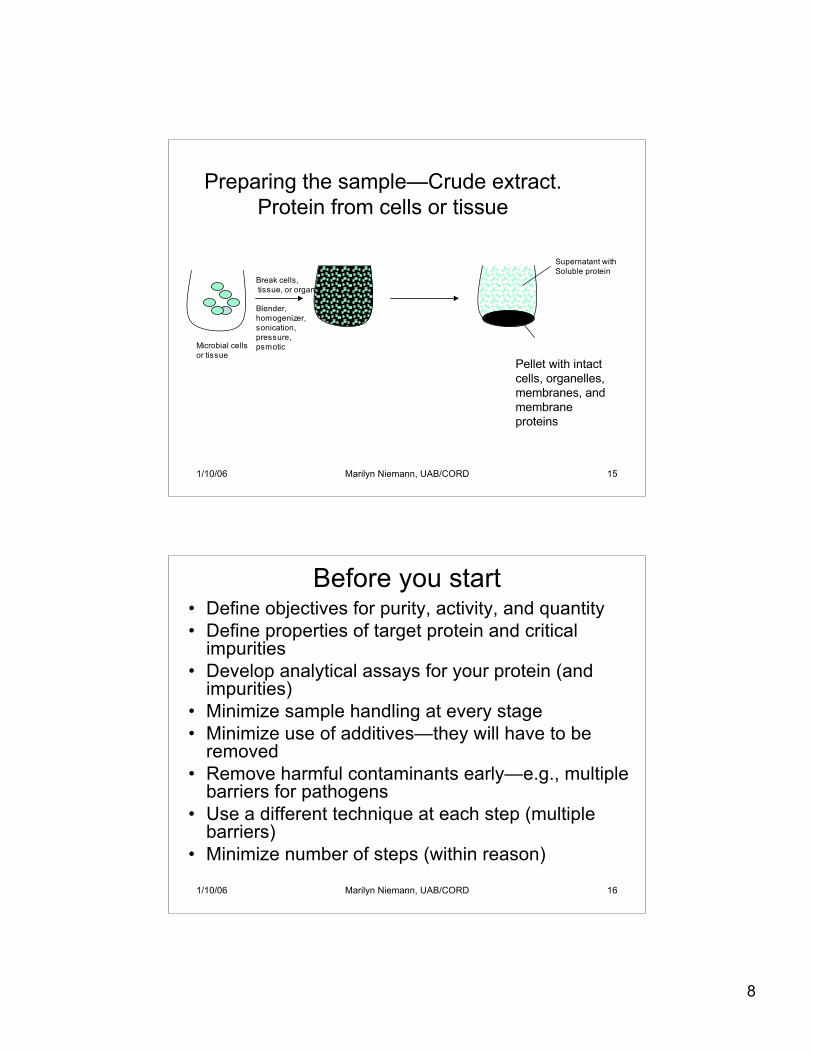
Western Blot Activity: Background
Whereas ELISA measures antibodyto whole virus and gives a"positive," "negative" orindeterminate test result, westernblotting is a more specific test. Itallows one to visualize antibodiesdirected against each viral protein.For this reason, it is a confirmatorytest for a positive HIV ELISA. In anHIV Western blotting, proteins areelectrophoresed into a gel. As theproteins migrate through the gelthey are separated based uponsize and charge. Characteristically,smaller proteins migrate throughthe gel faster than larger proteins.
8
1/10/06 Marilyn Niemann, UAB/CORD 15
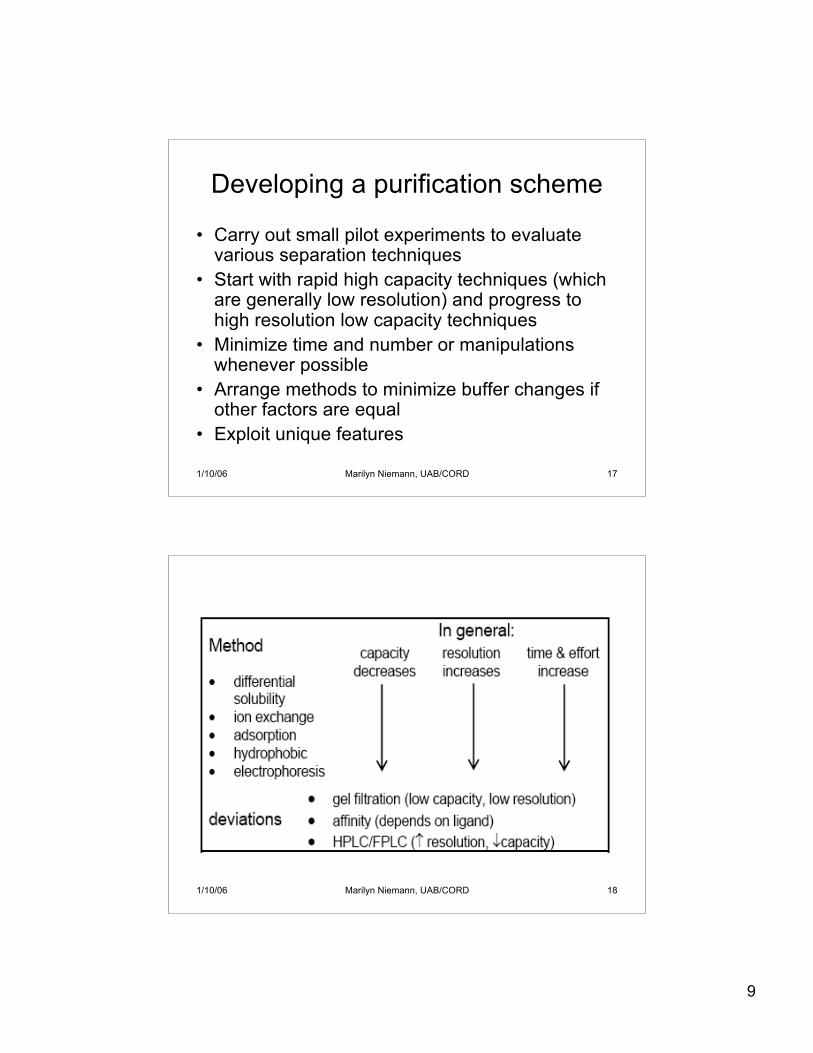
Preparing the sample—Crude extract.Protein from cells or tissue
Microbial cells or tissue
Break cells, tissue, or organ
Blender, homogenizer, sonication,pressure,psmotic
Supernatant withSoluble protein
Pellet with intactcells, organelles,membranes, andmembraneproteins
1/10/06 Marilyn Niemann, UAB/CORD 16
Before you start• Define objectives for purity, activity, and quantity• Define properties of target protein and critical
impurities• Develop analytical assays for your protein (and
impurities)• Minimize sample handling at every stage• Minimize use of additives—they will have to be
removed• Remove harmful contaminants early—e.g., multiple
barriers for pathogens• Use a different technique at each step (multiple
barriers)• Minimize number of steps (within reason)
9
1/10/06 Marilyn Niemann, UAB/CORD 17
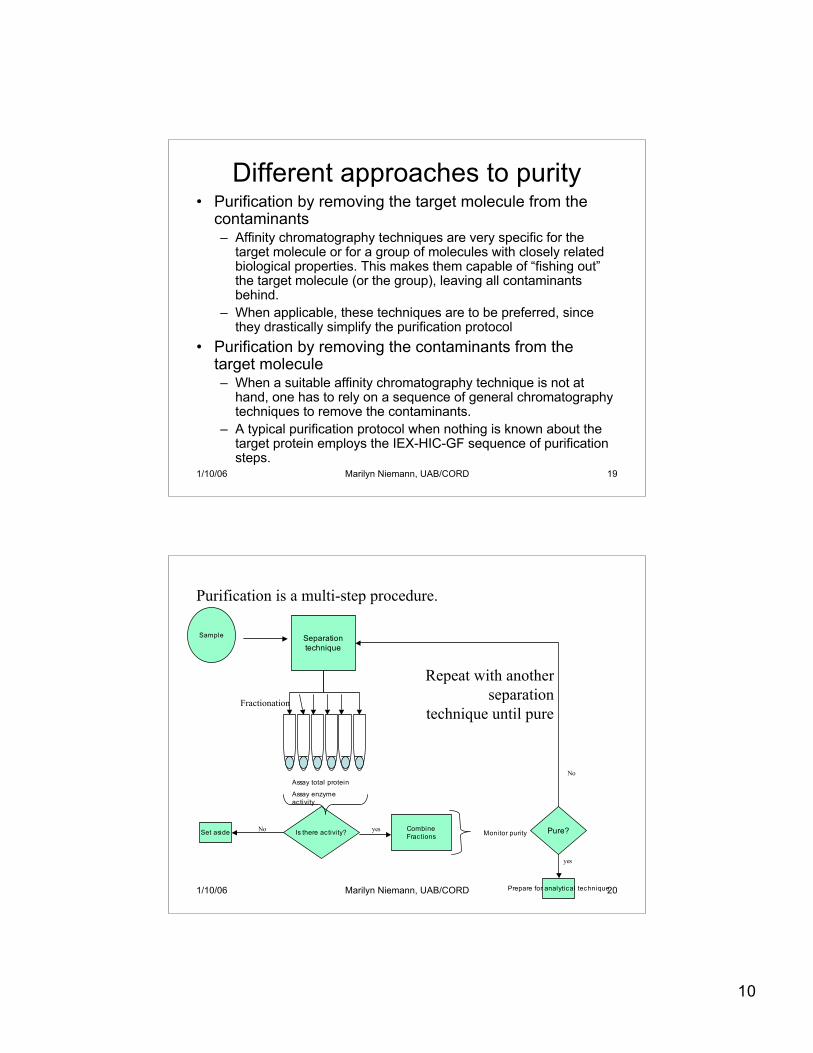
Developing a purification scheme
• Carry out small pilot experiments to evaluatevarious separation techniques
• Start with rapid high capacity techniques (whichare generally low resolution) and progress tohigh resolution low capacity techniques
• Minimize time and number or manipulationswhenever possible
• Arrange methods to minimize buffer changes ifother factors are equal
• Exploit unique features
1/10/06 Marilyn Niemann, UAB/CORD 18
10
1/10/06 Marilyn Niemann, UAB/CORD 19
Different approaches to purity• Purification by removing the target molecule from the
contaminants– Affinity chromatography techniques are very specific for the
target molecule or for a group of molecules with closely relatedbiological properties. This makes them capable of “fishing out”the target molecule (or the group), leaving all contaminantsbehind.
– When applicable, these techniques are to be preferred, sincethey drastically simplify the purification protocol
• Purification by removing the contaminants from thetarget molecule– When a suitable affinity chromatography technique is not at
hand, one has to rely on a sequence of general chromatographytechniques to remove the contaminants.
– A typical purification protocol when nothing is known about thetarget protein employs the IEX-HIC-GF sequence of purificationsteps.
1/10/06 Marilyn Niemann, UAB/CORD 20
Sample Separationtechnique
Fractionation
Purification is a multi-step procedure.
Is there activity?Set aside No CombineFractions
yes Monitor purity
Assay total protein
Assay enzymeactivity
Pure?
Prepare for analytical technique
yes
No
Repeat with anotherseparation
technique until pure
11
1/10/06 Marilyn Niemann, UAB/CORD 21
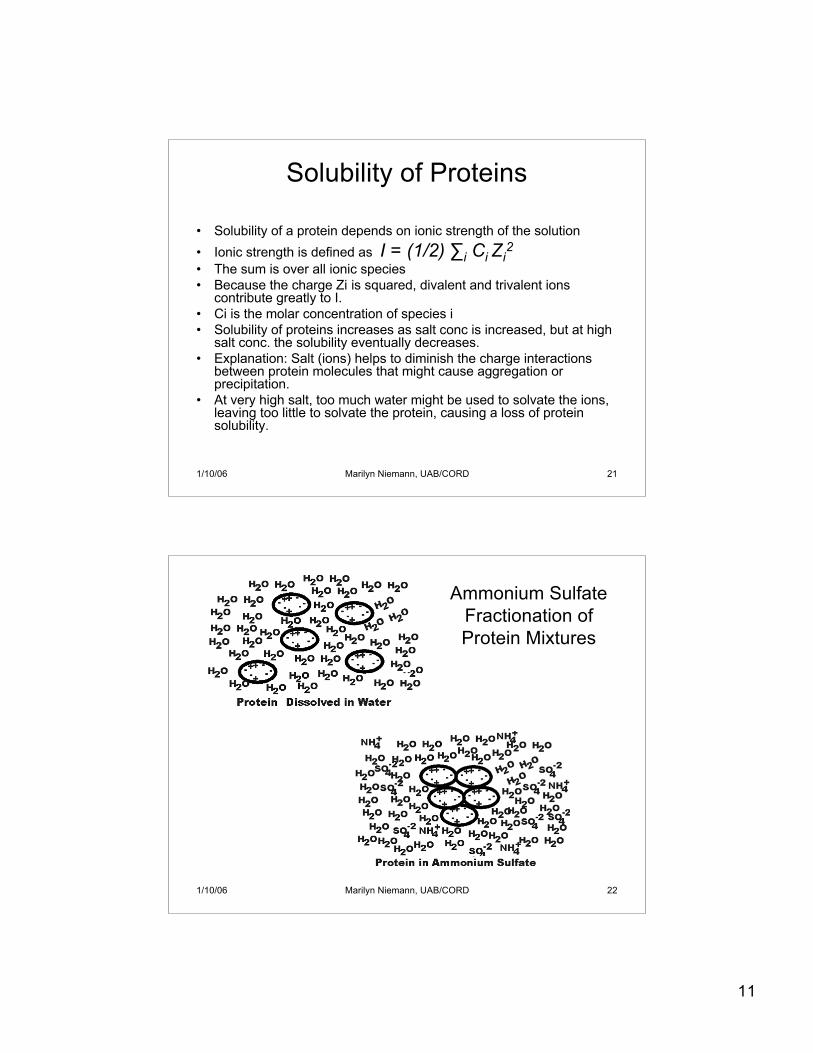
Solubility of Proteins
• Solubility of a protein depends on ionic strength of the solution• Ionic strength is defined as I = (1/2) ∑i Ci Zi
2
• The sum is over all ionic species• Because the charge Zi is squared, divalent and trivalent ions
contribute greatly to I.• Ci is the molar concentration of species i• Solubility of proteins increases as salt conc is increased, but at high
salt conc. the solubility eventually decreases.• Explanation: Salt (ions) helps to diminish the charge interactions
between protein molecules that might cause aggregation orprecipitation.
• At very high salt, too much water might be used to solvate the ions,leaving too little to solvate the protein, causing a loss of proteinsolubility.
1/10/06 Marilyn Niemann, UAB/CORD 22
Ammonium SulfateFractionation ofProtein Mixtures
12
1/10/06 Marilyn Niemann, UAB/CORD 23
1/10/06 Marilyn Niemann, UAB/CORD 24
13
1/10/06 Marilyn Niemann, UAB/CORD 25
1/10/06 Marilyn Niemann, UAB/CORD 26
Note - this should be shown asa single band (possibly brownor striped with four colors)
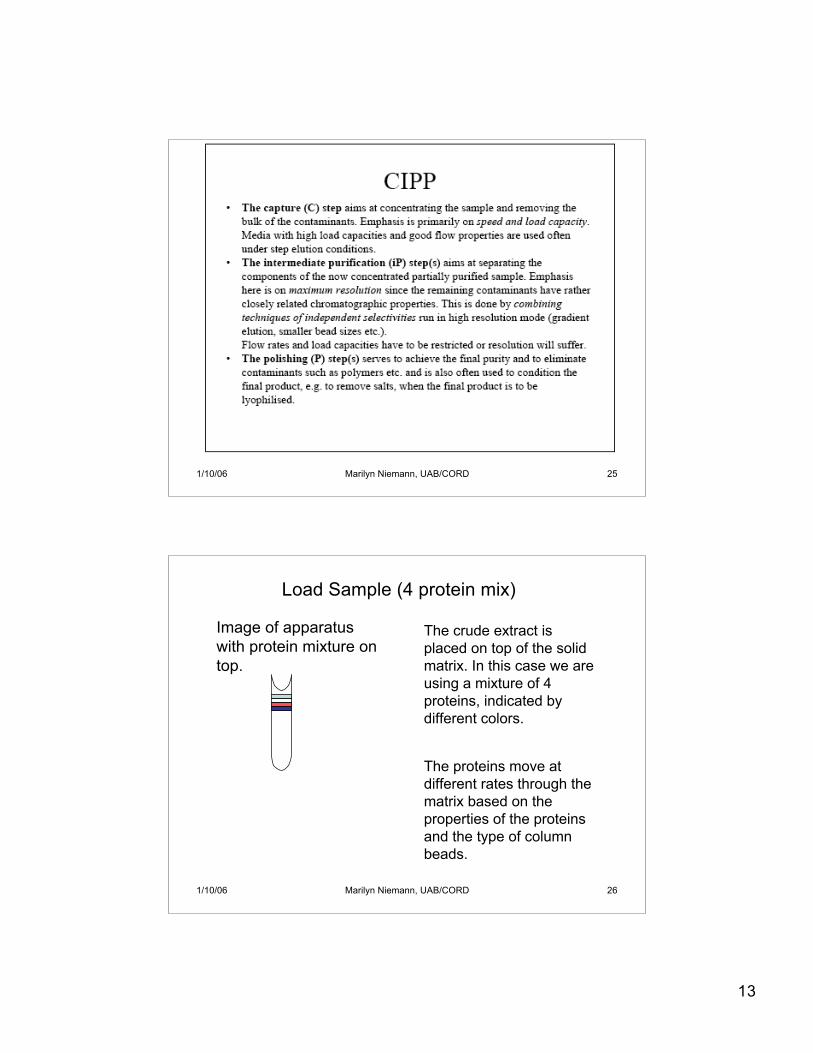
Load Sample (4 protein mix)
Image of apparatuswith protein mixture ontop.
The crude extract isplaced on top of the solidmatrix. In this case we areusing a mixture of 4proteins, indicated bydifferent colors.
The proteins move atdifferent rates through thematrix based on theproperties of the proteinsand the type of columnbeads.
14
1/10/06 Marilyn Niemann, UAB/CORD 27
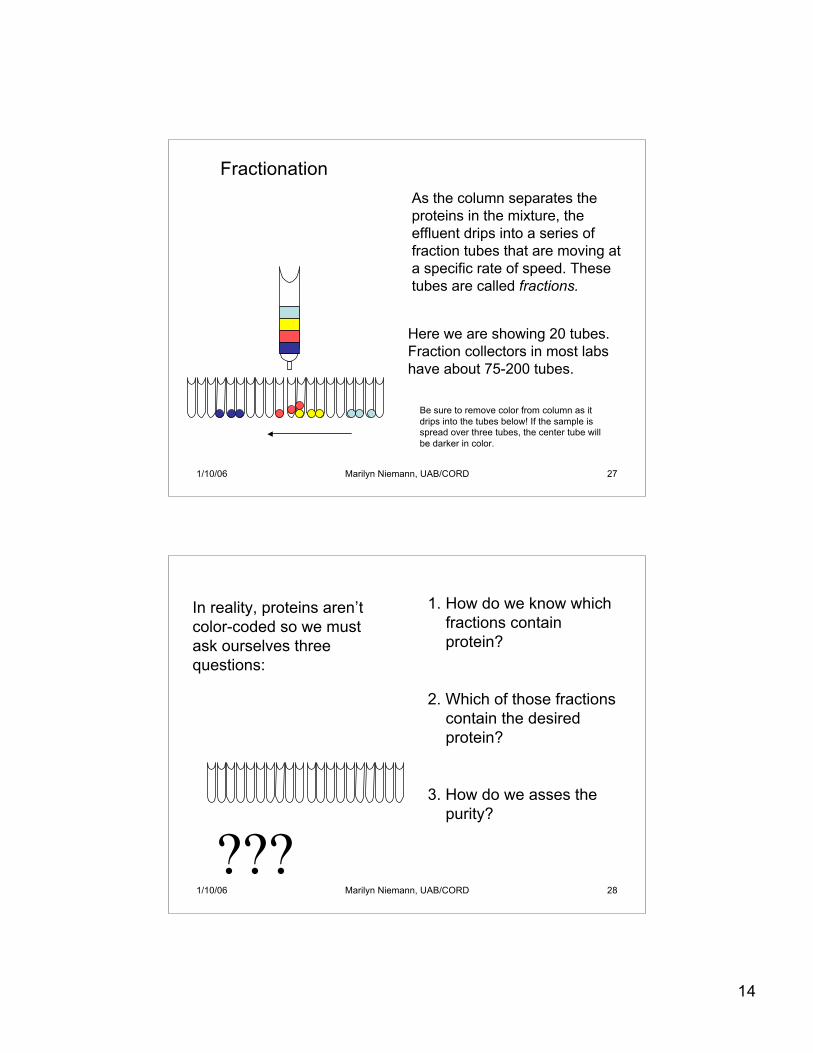
FractionationAs the column separates theproteins in the mixture, theeffluent drips into a series offraction tubes that are moving ata specific rate of speed. Thesetubes are called fractions.
Here we are showing 20 tubes.Fraction collectors in most labshave about 75-200 tubes.
Be sure to remove color from column as itdrips into the tubes below! If the sample isspread over three tubes, the center tube willbe darker in color.
1/10/06 Marilyn Niemann, UAB/CORD 28
???
In reality, proteins aren’tcolor-coded so we mustask ourselves threequestions:
1. How do we know whichfractions containprotein?
2. Which of those fractionscontain the desiredprotein?
3. How do we asses thepurity?
15
1/10/06 Marilyn Niemann, UAB/CORD 29
1 2 3 4 5 6 7 8 9 10 11 12 13 14 15 16 17 18 19 20
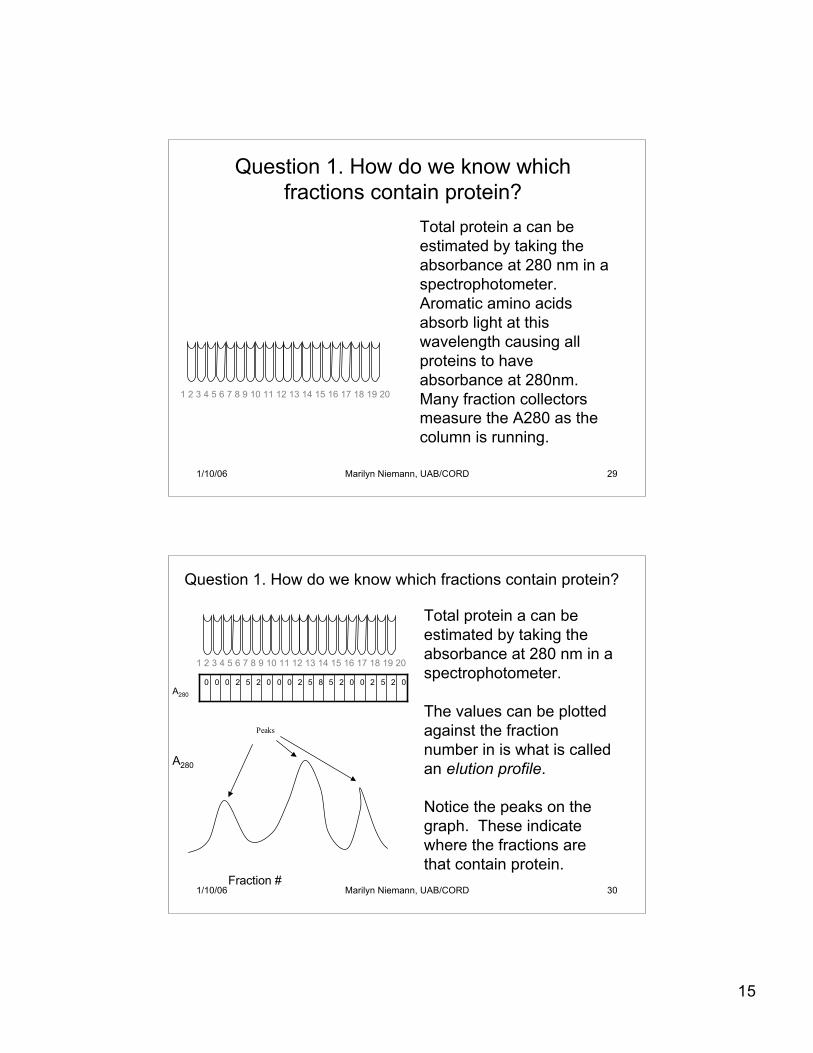
Question 1. How do we know whichfractions contain protein?
Total protein a can beestimated by taking theabsorbance at 280 nm in aspectrophotometer.Aromatic amino acidsabsorb light at thiswavelength causing allproteins to haveabsorbance at 280nm.Many fraction collectorsmeasure the A280 as thecolumn is running.
1/10/06 Marilyn Niemann, UAB/CORD 30
1 2 3 4 5 6 7 8 9 10 11 12 13 14 15 16 17 18 19 20
Question 1. How do we know which fractions contain protein?
Total protein a can beestimated by taking theabsorbance at 280 nm in aspectrophotometer.
02520025852000252000
Peaks
A280
A280
Fraction #
The values can be plottedagainst the fractionnumber in is what is calledan elution profile.
Notice the peaks on thegraph. These indicatewhere the fractions arethat contain protein.
16
1/10/06 Marilyn Niemann, UAB/CORD 31
02520025852000252000
Fraction #
A280
A280
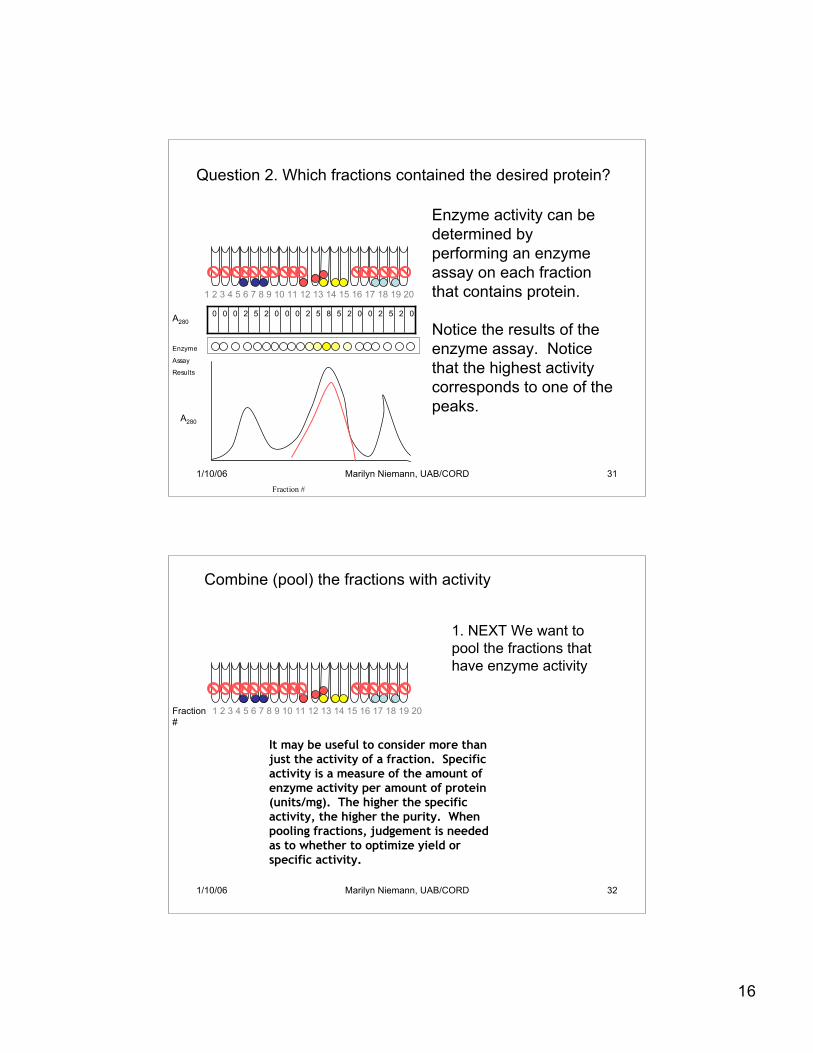
Question 2. Which fractions contained the desired protein?
Enzyme
Assay
Results
1 2 3 4 5 6 7 8 9 10 11 12 13 14 15 16 17 18 19 20
Enzyme activity can bedetermined byperforming an enzymeassay on each fractionthat contains protein.
Notice the results of theenzyme assay. Noticethat the highest activitycorresponds to one of thepeaks.
1/10/06 Marilyn Niemann, UAB/CORD 32
1 2 3 4 5 6 7 8 9 10 11 12 13 14 15 16 17 18 19 20
Combine (pool) the fractions with activity
1. NEXT We want topool the fractions thathave enzyme activity
Fraction#
It may be useful to consider more thanjust the activity of a fraction. Specificactivity is a measure of the amount ofenzyme activity per amount of protein(units/mg). The higher the specificactivity, the higher the purity. Whenpooling fractions, judgement is neededas to whether to optimize yield orspecific activity.
17
1/10/06 Marilyn Niemann, UAB/CORD 33
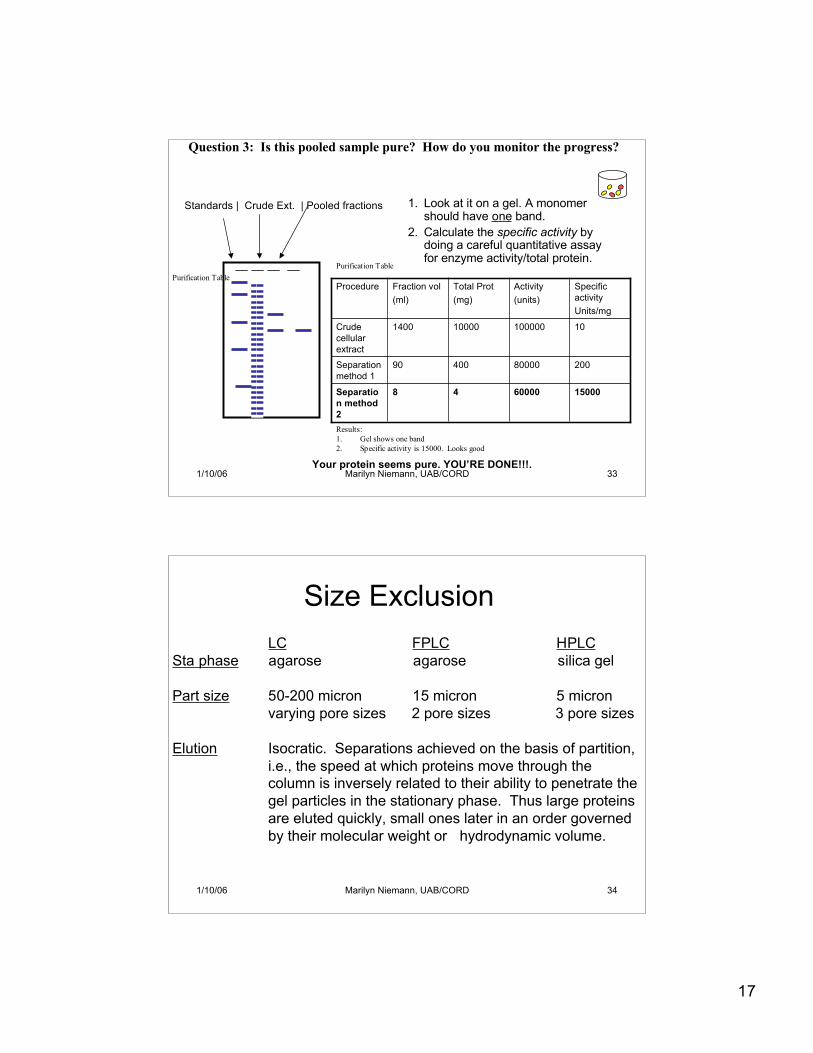
1. Look at it on a gel. A monomershould have one band.
2. Calculate the specific activity bydoing a careful quantitative assayfor enzyme activity/total protein.
Question 3: Is this pooled sample pure? How do you monitor the progress?
Standards | Crude Ext. | Pooled fractions
60000
80000
100000
Activity(units)
1500048Separation method2
20040090Separationmethod 1
10100001400Crudecellularextract
SpecificactivityUnits/mg
Total Prot(mg)
Fraction vol(ml)
Procedure
Purification TablePurification Table
Results:1. Gel shows one band2. Specific activity is 15000. Looks good
Your protein seems pure. YOU’RE DONE!!!.
1/10/06 Marilyn Niemann, UAB/CORD 34
LC FPLC HPLCSta phase agarose agarose silica gel
Part size 50-200 micron 15 micron 5 micronvarying pore sizes 2 pore sizes 3 pore sizes
Elution Isocratic. Separations achieved on the basis of partition,i.e., the speed at which proteins move through the column is inversely related to their ability to penetrate thegel particles in the stationary phase. Thus large proteinsare eluted quickly, small ones later in an order governedby their molecular weight or hydrodynamic volume.
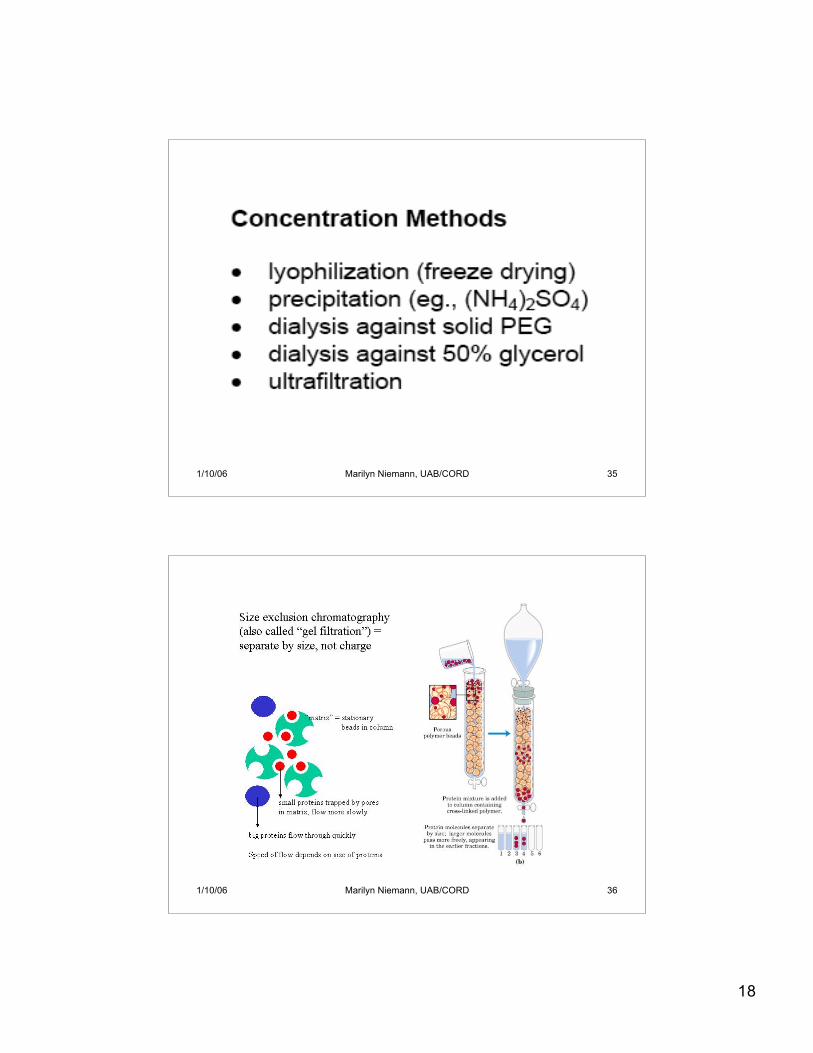
Size Exclusion
18
1/10/06 Marilyn Niemann, UAB/CORD 35
1/10/06 Marilyn Niemann, UAB/CORD 36
19
1/10/06 Marilyn Niemann, UAB/CORD 37
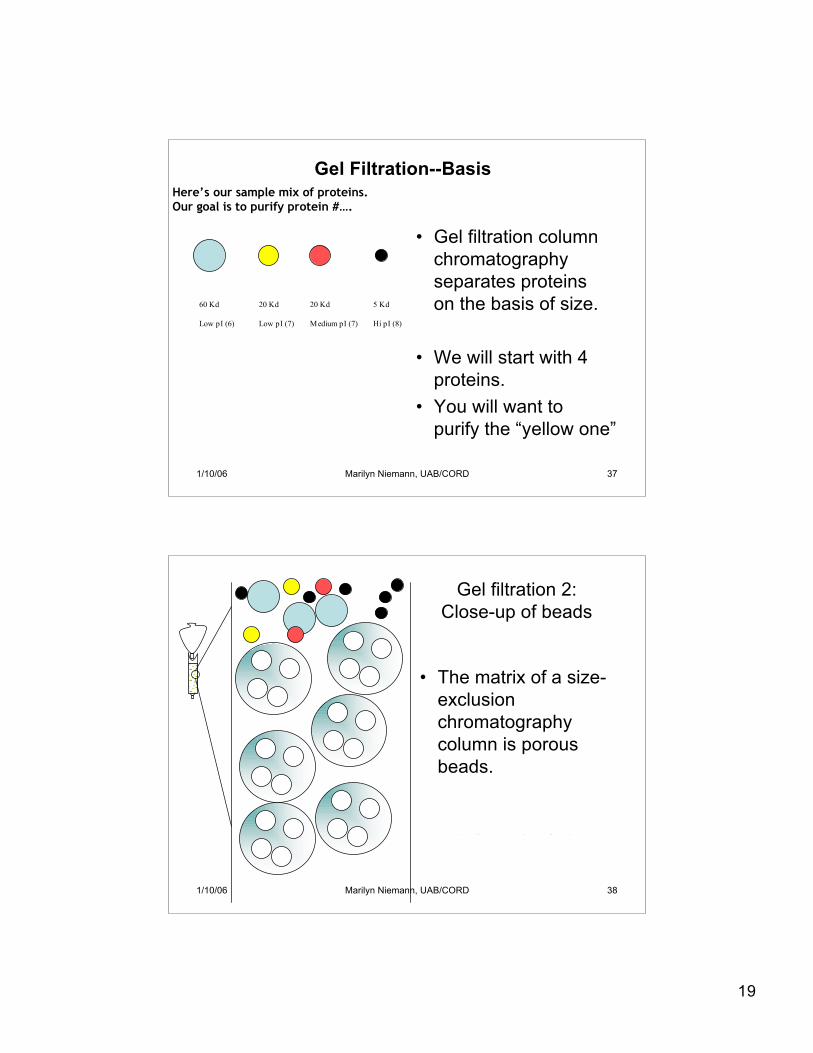
• Gel filtration columnchromatographyseparates proteinson the basis of size.
• We will start with 4proteins.
• You will want topurify the “yellow one”
60 Kd
Low pI (6)
20 Kd
Low pI (7)
20 Kd
Medium pI (7)
5 Kd
Hi pI (8)
Here’s our sample mix of proteins.Our goal is to purify protein #….
Gel Filtration--Basis
1/10/06 Marilyn Niemann, UAB/CORD 38
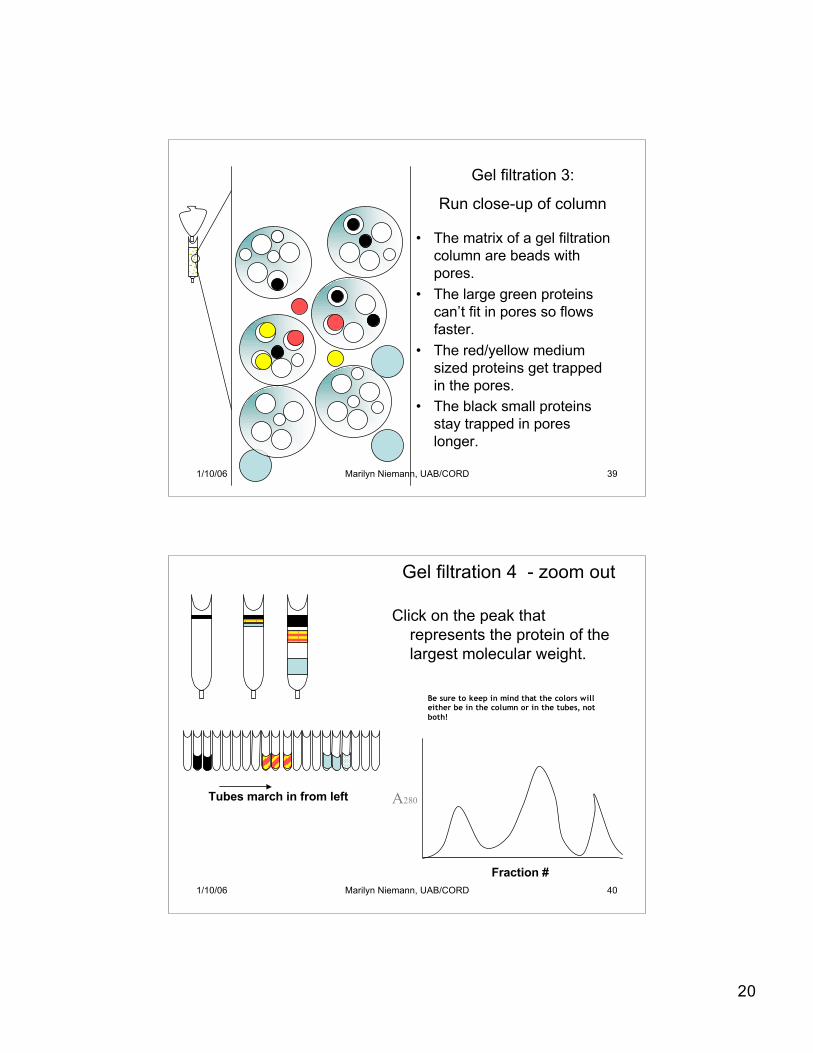
• The matrix of a size-exclusionchromatographycolumn is porousbeads.
Need two pore sizes (other sizebigger than black proteins,smaller than existing pores.)
Gel filtration 2:Close-up of beads
20
1/10/06 Marilyn Niemann, UAB/CORD 39
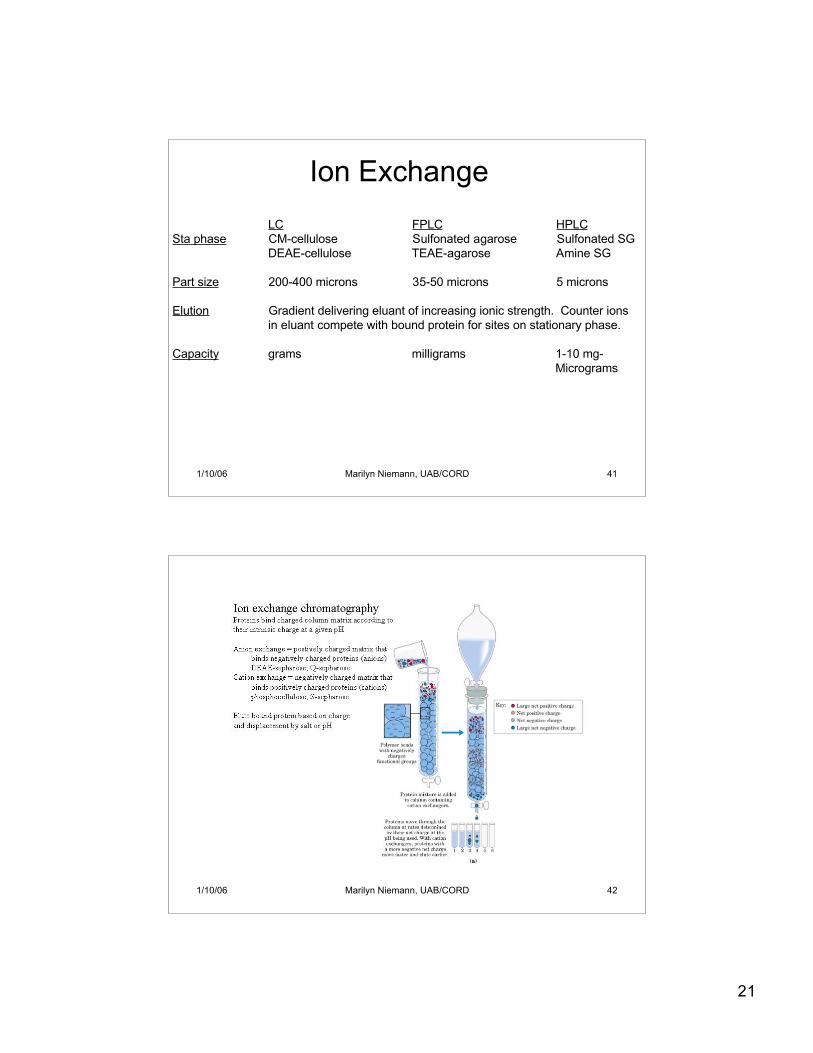
• The matrix of a gel filtrationcolumn are beads withpores.
• The large green proteinscan’t fit in pores so flowsfaster.
• The red/yellow mediumsized proteins get trappedin the pores.
• The black small proteinsstay trapped in poreslonger.
Gel filtration 3:
Run close-up of column
1/10/06 Marilyn Niemann, UAB/CORD 40
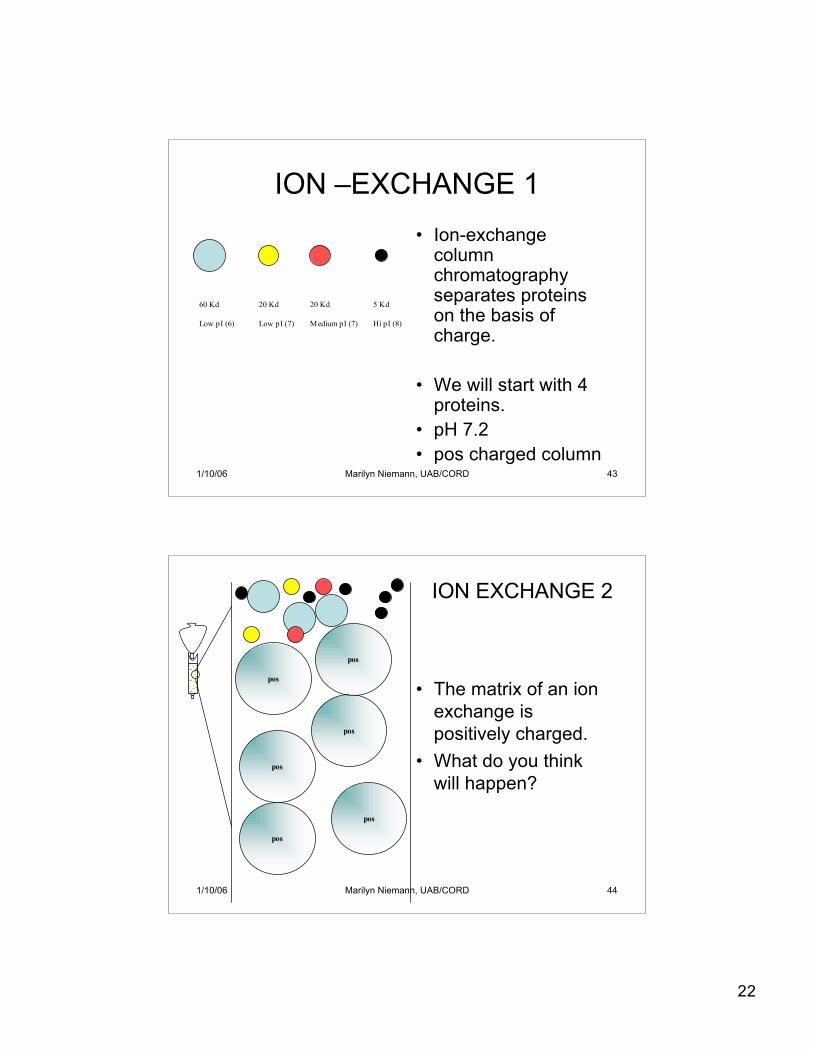
Gel filtration 4 - zoom out
Click on the peak thatrepresents the protein of thelargest molecular weight.
Tubes march in from left A280
Fraction #
Be sure to keep in mind that the colors willeither be in the column or in the tubes, notboth!
21
1/10/06 Marilyn Niemann, UAB/CORD 41
LC FPLC HPLCSta phase CM-cellulose Sulfonated agarose Sulfonated SG
DEAE-cellulose TEAE-agarose Amine SG
Part size 200-400 microns 35-50 microns 5 microns
Elution Gradient delivering eluant of increasing ionic strength. Counter ionsin eluant compete with bound protein for sites on stationary phase.
Capacity grams milligrams 1-10 mg-Micrograms
Ion Exchange
1/10/06 Marilyn Niemann, UAB/CORD 42
22
1/10/06 Marilyn Niemann, UAB/CORD 43
ION –EXCHANGE 1• Ion-exchange
columnchromatographyseparates proteinson the basis ofcharge.
• We will start with 4proteins.
• pH 7.2• pos charged column
60 Kd
Low pI (6)
20 Kd
Low pI (7)
20 Kd
Medium pI (7)
5 Kd
Hi pI (8)
1/10/06 Marilyn Niemann, UAB/CORD 44
• The matrix of an ionexchange ispositively charged.
• What do you thinkwill happen?
pos
pos
pos
pos
pos
pos
ION EXCHANGE 2
23
1/10/06 Marilyn Niemann, UAB/CORD 45
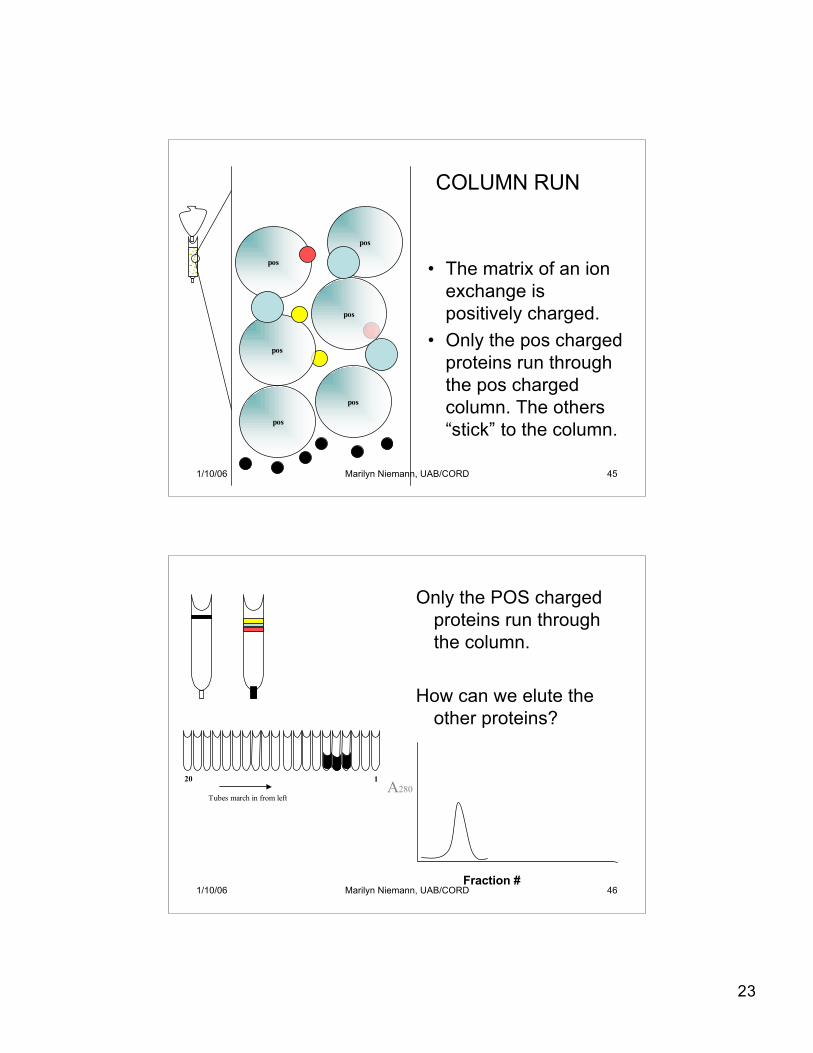
• The matrix of an ionexchange ispositively charged.
• Only the pos chargedproteins run throughthe pos chargedcolumn. The others“stick” to the column.
pos
pos
pos
pos
pos
pos
COLUMN RUN
1/10/06 Marilyn Niemann, UAB/CORD 46
Only the POS chargedproteins run throughthe column.
How can we elute theother proteins?
Tubes march in from left A280
Fraction #
120
24
1/10/06 Marilyn Niemann, UAB/CORD 47
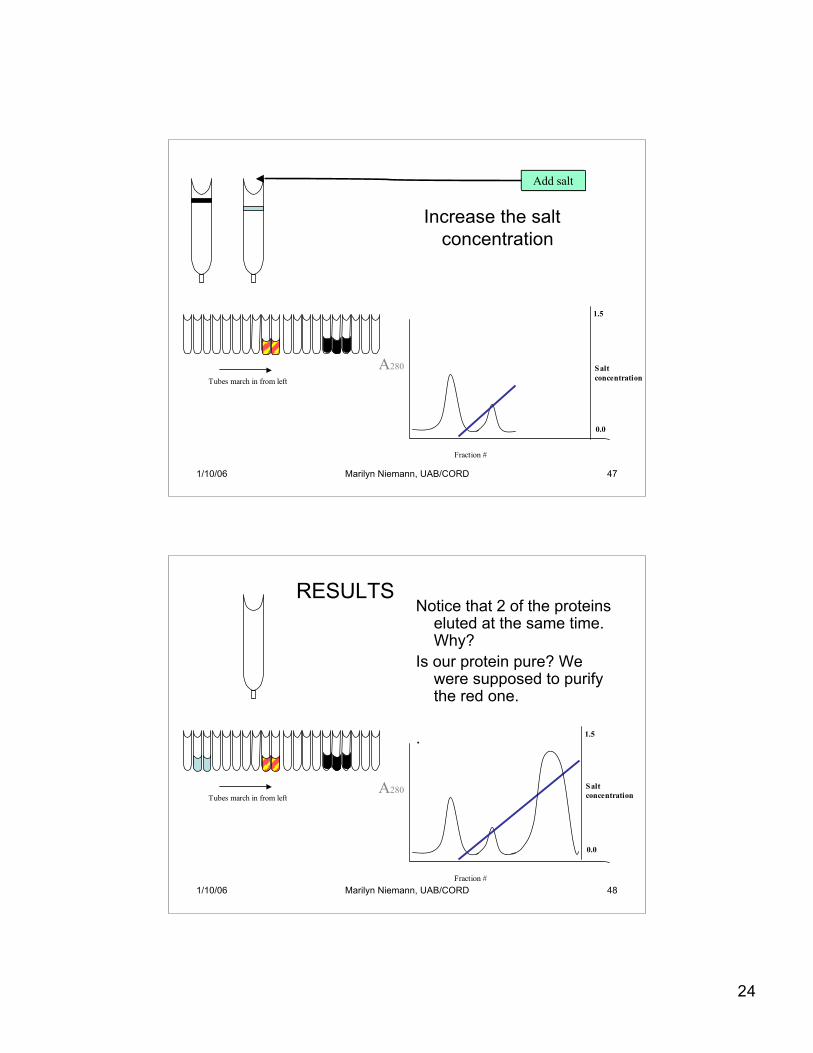
Increase the saltconcentration
Tubes march in from left
A280
Fraction #
Salt concentration
1.5
0.0
Add salt
1/10/06 Marilyn Niemann, UAB/CORD 48
Notice that 2 of the proteinseluted at the same time.Why?
Is our protein pure? Wewere supposed to purifythe red one.
.
Tubes march in from left Salt concentrationA280
Fraction #
1.5
0.0
RESULTS
25
1/10/06 Marilyn Niemann, UAB/CORD 49
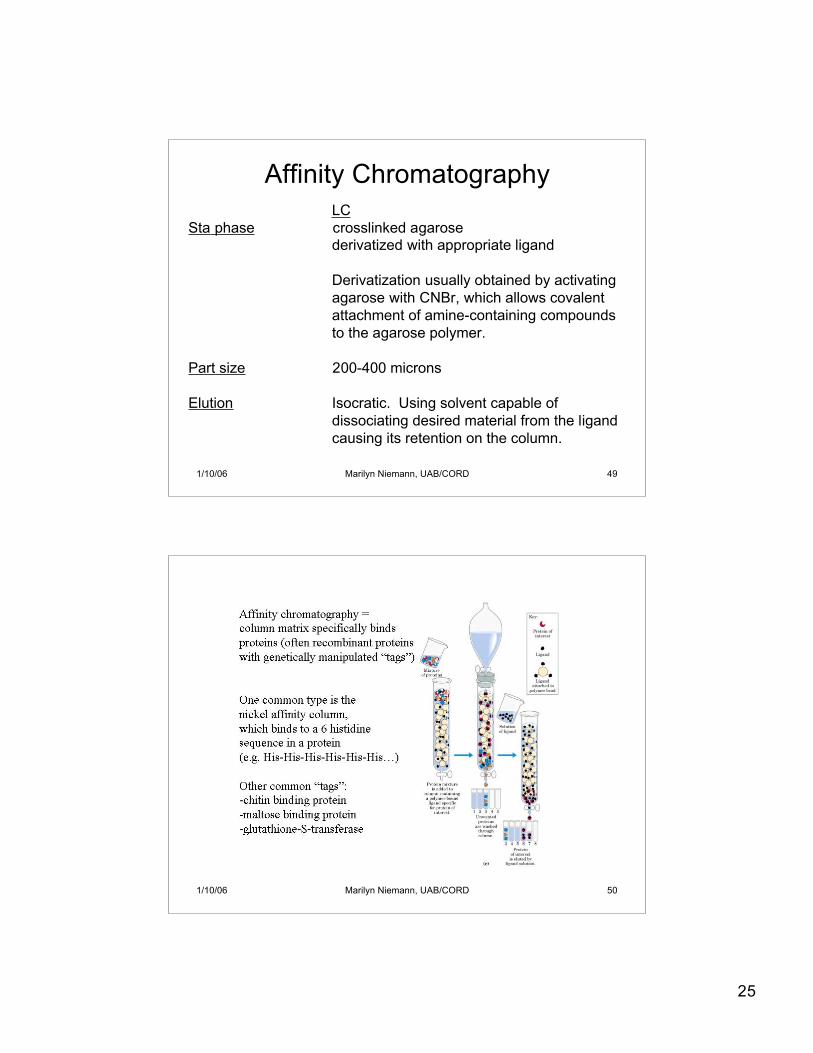
LCSta phase crosslinked agarose
derivatized with appropriate ligand
Derivatization usually obtained by activatingagarose with CNBr, which allows covalent attachment of amine-containing compoundsto the agarose polymer.
Part size 200-400 microns
Elution Isocratic. Using solvent capable ofdissociating desired material from the ligandcausing its retention on the column.
Affinity Chromatography
1/10/06 Marilyn Niemann, UAB/CORD 50
26
1/10/06 Marilyn Niemann, UAB/CORD 51
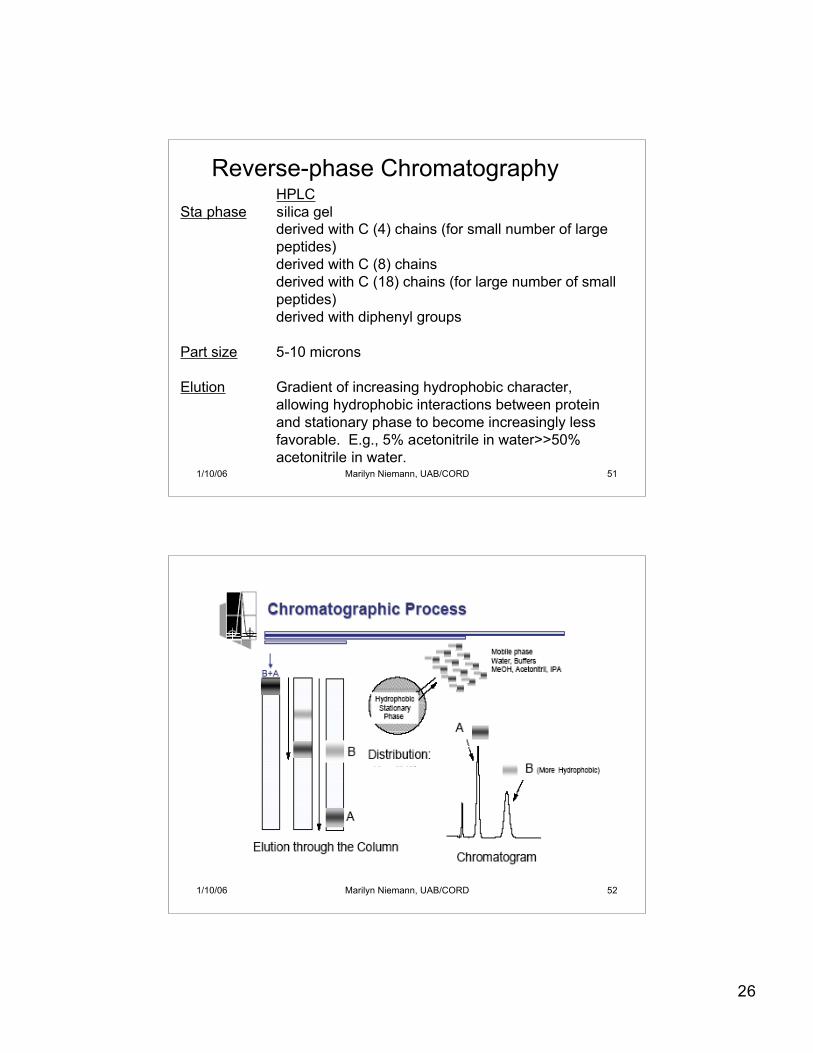
HPLCSta phase silica gel
derived with C (4) chains (for small number of largepeptides)derived with C (8) chainsderived with C (18) chains (for large number of smallpeptides)derived with diphenyl groups
Part size 5-10 microns
Elution Gradient of increasing hydrophobic character, allowing hydrophobic interactions between protein and stationary phase to become increasingly less favorable. E.g., 5% acetonitrile in water>>50% acetonitrile in water.
Reverse-phase Chromatography
1/10/06 Marilyn Niemann, UAB/CORD 52
27
1/10/06 Marilyn Niemann, UAB/CORD 53
1/10/06 Marilyn Niemann, UAB/CORD 54
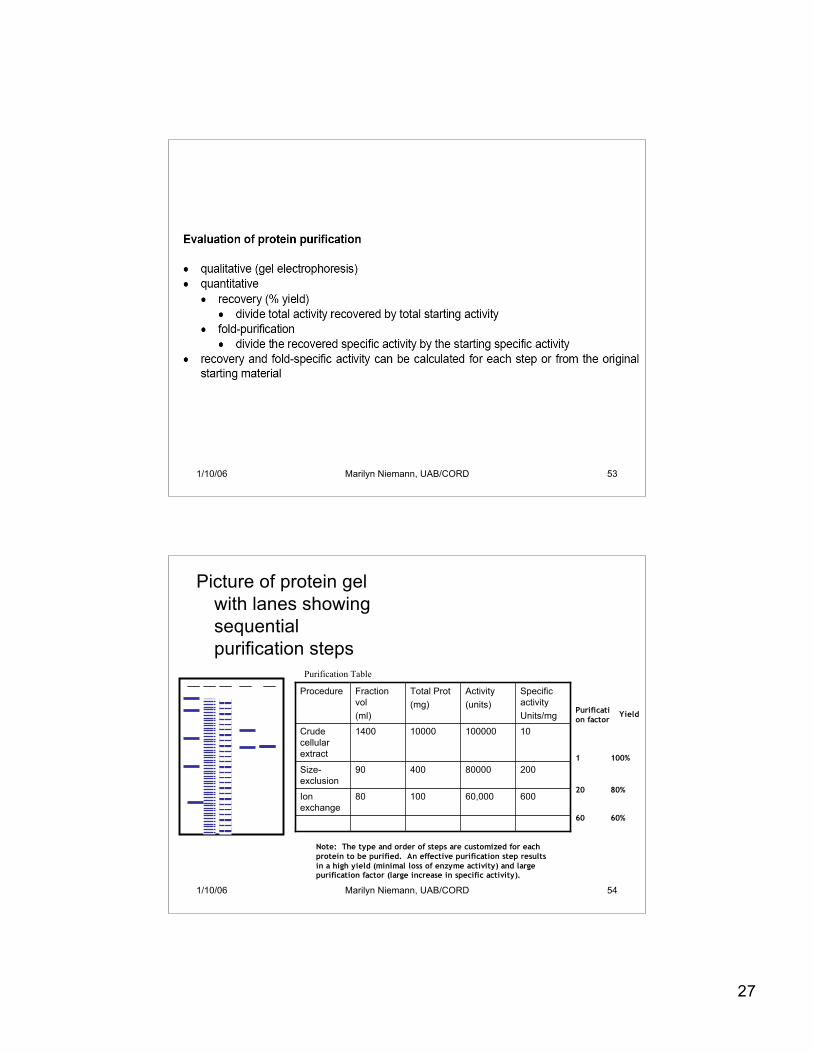
Picture of protein gelwith lanes showingsequentialpurification steps
60060,00010080Ionexchange
80000
100000
Activity(units)
20040090Size-exclusion
10100001400Crudecellularextract
SpecificactivityUnits/mg
Total Prot(mg)
Fractionvol(ml)
Procedure
Purification Table
Purification factor
Yield
100%
20 80%
60 60%
1
Note: The type and order of steps are customized for eachprotein to be purified. An effective purification step resultsin a high yield (minimal loss of enzyme activity) and largepurification factor (large increase in specific activity).