Embed Size (px)
Citation preview

7/29/2019 Why LRT is not the answer
http://slidepdf.com/reader/full/why-lrt-is-not-the-answer 1/16
Five reasons tooppose Light RailTransit in Surrey
• At-grade Light Rail provides slower transit comparedand potentially less reliable transit compared to evenprovides less options for citizens (esp. young citizenstime of economic recession, desperately need more o
• At-grade Light Rail has a smaller impact on pressing auto use growth because it attracts less modal shift
• At-grade Light Rail causes traffic mayhem and
disrupcommunities by taking away road capacity on major such as 104th Ave and creating less auto to transit mo
• At-grade Light Rail will generate less benefits than it
• No Surrey Rapid Transit options involving Light Rail w
transportation modal shift goals
Oppose LRT
Scroll down tofind out why LRTis not the bestsolution forSurrey’s issues
7/29/2019 Why LRT is not the answer
http://slidepdf.com/reader/full/why-lrt-is-not-the-answer 2/16
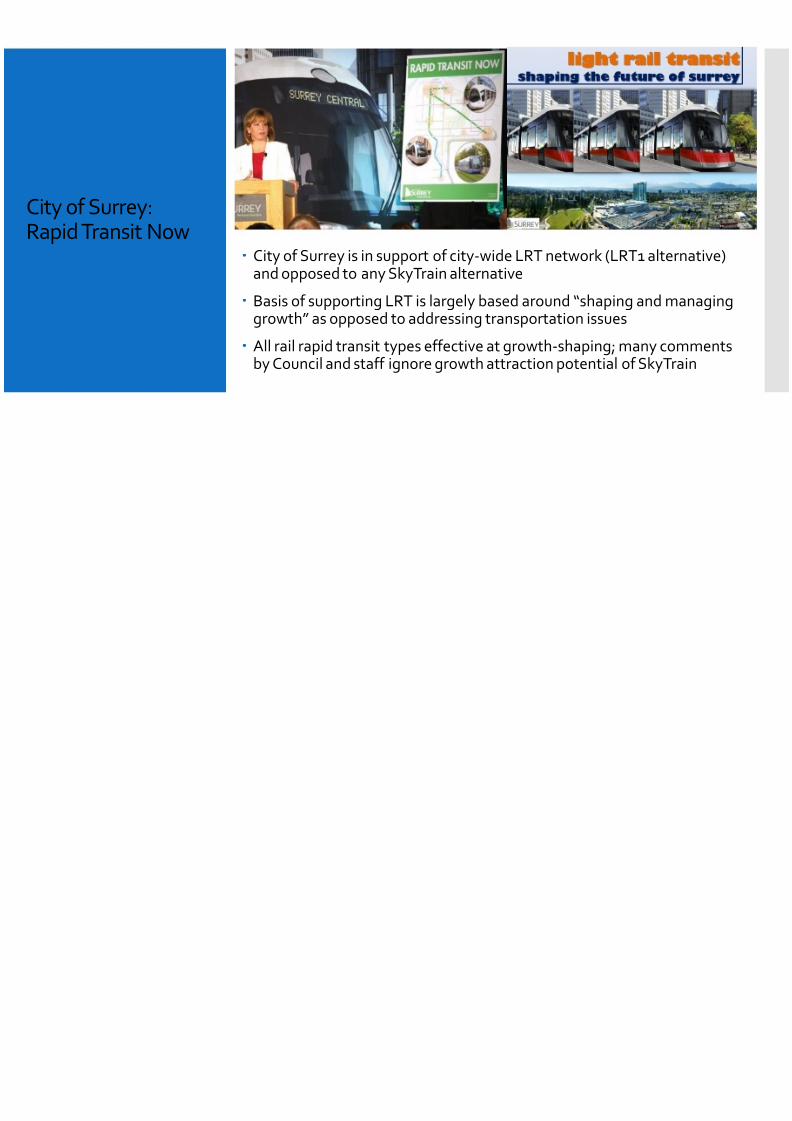
City of Surrey:Rapid Transit Now
City of Surrey is in support of city-wide LRT network (LRT
and opposed to any SkyTrain alternative Basis of supporting LRT is largely based around “shaping
growth” as opposed to addressing transportation issues
All rail rapid transit types effective at growth-shaping; mby Council and staff ignore growth attraction potential o

7/29/2019 Why LRT is not the answer
http://slidepdf.com/reader/full/why-lrt-is-not-the-answer 3/16
At-grade LRT isinferior transit
SkyTrain(grade-separated rail transit)
Full grade segregation meansbetter reliability
Current SkyTrain service morethan 96% on-time
Higher speed (80-90 km/h)
Higher capacity expansion
potential to deal with growthbeyond 2041
Better off-peak operatingfrequencies due to lower cost
Light Rail Transit(at-grade rail trans
At-grade runninginterfacing with opedestrians; riskymay compromis
All at-grade transspeed of road (50
Accidents blockinfull disruption (i.KGB & 88th will caclosure until clear
Higher cost may peak operating fr

7/29/2019 Why LRT is not the answer
http://slidepdf.com/reader/full/why-lrt-is-not-the-answer 4/16
At-grade LRT isinferior transit
In the top-left pLight Rail Line hfor 3 hours whil
was cleared.
When the LRT libecause an accitrack, it can takeuntil service ca
At-grade and onservice is more to accidents, vebreakdowns, petc. and typicalreliability than fseparated altern

7/29/2019 Why LRT is not the answer
http://slidepdf.com/reader/full/why-lrt-is-not-the-answer 5/16
At-grade LRTattracts less ridersonto transit
New transit trips
(LRT on Fraser Hi
Alternative has toridership of 178,0
4250 passengersFraser Highway
Just 12,500 new d
trips across regioJust 1.4 billion vetravelled reducti
New transit trips with RRT1a
(RRT on Fraser Highway + BRT)Alternative has total dailyridership of 202,000 in 2041
6600 passengers peak load onFraser Highway
24,500 new daily transit trips
across region2.4 billion vehicle kmtravelled reduction to 2041
LRT makes half the impact compared to
Source: Surrey Rapid Transit Study
Final Analysis PDF page 171

7/29/2019 Why LRT is not the answer
http://slidepdf.com/reader/full/why-lrt-is-not-the-answer 6/16
At-grade LRTattracts less ridersonto transit
Canada Line SkyTrain – 19kmOpened in August 2009
Original projections involveddaily ridership of 100,000 by 2013and 141,000 by 2021
Summer 2011 ridership was over136,000 daily (weekdayboardings)
Averaged growth rate: approx.68000 riders yearly
Portland MAX LRTOpened 1986, 1998, 2
MAX LRT lines hagenerated ridersprojections
Total MAX system2011 was recordedaily (weekday b
Averaged growth5100 riders yearly
Sources: TransLink media releases
TriMet ridership data (Portland)
Canada Line has more riders in 3 yea
entire MAX LRT system has in 26 y

7/29/2019 Why LRT is not the answer
http://slidepdf.com/reader/full/why-lrt-is-not-the-answer 7/16
Modal shift inVancouver vsPortland
Vancouver, British ColumbiaServiced by 69km (then 50km) SkyTrain system
0%
10%
20%
30%
40%
50%
60%
1996 2006
Journey-to-work trips by
transit, walking or cycling
Trips from outside the city
Trips within the city
Combined
Portland, OregoServiced by 85km MAX LR
0%
10%
20%
30%
40%
50%
60%
1997
Journey-to-wo
by transit, walk
cycling
Combined
At-grade LRT in Portland did not create anchoice-ridership modal shift until the 200
Three LRT lines were opened between 19Sources: City of Vancouver Transportation Plan Update
City of Portland mode-share surveys

7/29/2019 Why LRT is not the answer
http://slidepdf.com/reader/full/why-lrt-is-not-the-answer 8/16
LRT vs SkyTrainService and ridership
0
1000
2000
3000
4000
5000
6000
7000
King George Blvd to Newton Fraser Highway
2041 forecast peak load (passengers
per hour per direction)
Bus Rapid Transit Light Rail Transit SkyTrain
SkyTrain proj
more peak hthan LRT on
Average rideSkyTrain ove53% on both
This additionincludes morriders, not juswitching frolike 321/502.
Sources: Final Analysis PDF page 171

7/29/2019 Why LRT is not the answer
http://slidepdf.com/reader/full/why-lrt-is-not-the-answer 9/16
City of SurreyLRT proposal“LRT1”
• Surrey Mayorsee Light Rail
corridors fromto Guildford, and Newton.

7/29/2019 Why LRT is not the answer
http://slidepdf.com/reader/full/why-lrt-is-not-the-answer 10/16
LRT benefits vscosts
-2000
-1500
-1000
-500
0
500
1000
1500
M I L L I O N S
LRT1 Benefits-Costs
Benefits Net Costs Final Net Present Value
LRT1 net presen
-$510 mi LRT1 estimated
not exceed cost
Taxpayers to pa
in costs for $1.1 benefits. Net lo
Sources: Surrey Rapid Transit Study
Final Analysis PDF pages 349-369

7/29/2019 Why LRT is not the answer
http://slidepdf.com/reader/full/why-lrt-is-not-the-answer 11/16
Study areamode-sharewith LRT1 alt.
Evident that mogoals will not be
with full LRT net
550.00%
Regional
Transit, walking and
73.09%
15.01%
11.90%
26.91%
2041 study area mode shares
with LRT1
(AM peak hour,
to/from/within)
Auto Transit Walking/Cycling Source: Final Analysis P

7/29/2019 Why LRT is not the answer
http://slidepdf.com/reader/full/why-lrt-is-not-the-answer 12/16
Study areamode-sharewith LRT1 alt.
0.00%
5.00%
10.00%
15.00%
20.00%
25.00%
30.00%
35.00%
With full LRT network
2041 mode-shares
(AM peak hour)
Transit + walking + cycling % (region)
Transit + walking + cycling % (study area)
Metro Vancaverage mohit 50% goa
(Surrey, etcwith LRT1 wMetro Vancaverage
Source: Final Analysi
50.00%
Regi
Transit, walki

7/29/2019 Why LRT is not the answer
http://slidepdf.com/reader/full/why-lrt-is-not-the-answer 13/16
Study areamode-sharewith LRT1 alt.
Evident that mogoals will not be
with full LRT ne
550.00%
Regiona
Transit, walking and
66.78%
12.50%
20.72%
33.22%
2041 study area mode shares
with LRT1
(AM peak hour, within only)
Auto Transit Walking/Cycling Source: Final Analysis P

7/29/2019 Why LRT is not the answer
http://slidepdf.com/reader/full/why-lrt-is-not-the-answer 14/16
Surrey 2021-2041 vsVancouver 1996-2006with LRT1 alternative
0.3
0.1605
0
0.05
0.1
0.15
0.2
0.25
0.3
0.35
Vancouver 1996-2006 Surrey 2021-2041, LRT1
Average yearly modal shift
Average yearly additional mode-share captured in %
Previous Vanccapture rate isexpected annucapture rate wnetwork in sur
Sources: Final Analysis PDF page 342-344,
Vancouver Transportation Plan Update
TDM adjustments are not included in this comparison as such measures had not been implemented
of Vancouver. See report: Assessing the potential for road and parking charges to reduce demand focommuting in the Greater Vancouver region, page 9 - http://research.rem.sfu.ca/theses/Washbroo

7/29/2019 Why LRT is not the answer
http://slidepdf.com/reader/full/why-lrt-is-not-the-answer 15/16
Surrey 2021-2041 vsVancouver 1996-2006with LRT1 alternative
1.73%
1.36%
0.00%
0.20%
0.40%
0.60%
0.80%
1.00%
1.20%
1.40%
1.60%
1.80%
2.00%
Vancouver 1996-2006 Surrey 2021-2041, LRT1
Average yearly modal shift
Average yearly mode share growth
Surrey to see slomodal shift withthan Vancouver previously beforebuilt
Sources: Final Analysis PDF page 342-344,
Vancouver Transportation Plan Update
TDM adjustments are not included in this comparison as such measures had not been implemented
of Vancouver. See report: Assessing the potential for road and parking charges to reduce demand focommuting in the Greater Vancouver region, page 9 - http://research.rem.sfu.ca/theses/Washbroo

7/29/2019 Why LRT is not the answer
http://slidepdf.com/reader/full/why-lrt-is-not-the-answer 16/16
“Slow transit doesn’t make peoplelive slower lives. Instead, it makes
people use their cars because thosebecome the only way to access thecity quickly…”
Jarrett WalkerPublic Transit Planning Consultant, author of Human Transit