Embed Size (px)
Citation preview
Why Is There So Little Money in U.S. Politics?1
Stephen AnsolabehereDepartment of Political Science
Massachusetts Institute of Technology
John de FigueiredoSloan School of Management
Massachusetts Institute of Technology
James M. Snyder, Jr.Departments of Political Science and Economics
Massachusetts Institute of Technology
June, 2002
1Professor Ansolabehere thanks the Carnegie Corporation for their generous ¯nancial supportunder the Carnegie Scholars Program.
Abstract
Thirty years ago, Gordon Tullock posed a provocative puzzle: considering the value of public
policies at stake and the reputed in°uence of campaign contributions in policy-making, why is
there so little money in U.S. politics? In this paper, we argue that campaign contributions are
not a form of policy-buying, but are rather a form of political participation and consumption.
We summarize the data on campaign spending, and show through our descriptive statistics
and our econometric analysis that individuals, not special interests, are the main source of
campaign contributions. Moreover, we demonstrate that campaign giving is a normal good,
dependent upon income, and campaign contributions as a percent of GDP have not risen
appreciably in over 100 years - if anything, they have probably fallen. We then show that only
one in four studies from the previous literature support the popular notion that contributions
buy legislators' votes. Finally, we illustrate that when one controls for unobserved constituent
and legislator e®ects, there is little relationship between money and legislator votes. Thus,
the question is not why there is so little money politics, but rather why organized interests
give at all. We conclude by o®ering potential answers to this question.
1. Introduction
Thirty years ago, Gordon Tullock posed a provocative puzzle. Considering the value of
public policies at stake and the reputed in°uence of campaign contributors in policy making,
why is there so little money in U.S. politics? Estimates put total campaign spending at about
$200 million in 1972, when Tullock ¯rst o®ered his critique. Assuming a reasonable rate of
return, such an investment could have yielded at most $250-300 million, a sum dwarfed by the
hundreds of billions of dollars worth of public expenditures and anti-competitive regulations
supposedly at stake (Tullock, 1972).
Tullock's observation challenges the basic premises of both economic analyses of cam-
paign ¯nance and public discourse about reform. Campaign fundraising is widely viewed
as a market for public policy. Candidates and parties need money to run e®ective election
campaigns. And, donations come from ¯rms, associations, and individuals that seek private
bene¯ts in the form of subsidies, favorable regulations and other policies set by the govern-
ment. With thousands of ¯rms and other interests bidding for private bene¯ts and thousands
of candidates vying for funds, something like a market for legislation emerges. As with any
competitive market, the rate of return on the investment in politics should resemble that of
other investments. Otherwise, ¯rms and individuals will take assets out of other investments
and put them in the political market.
The puzzle has not disappeared in the past three decades. Candidates, parties, and
organizations raised and spent $3 billion in the 2000 national elections { like 1972, another
record. This represents a growth in campaign spending twice the rate of in°ation from
1972 to 2000. However, total federal government spending in 2000 equaled $2 trillion, and
consumption and gross investment of the federal government was $590 billion.
The puzzle comes into sharper focus still when we examine speci¯c interests and policies.
Consider three important U.S. industries { defense contracting, agriculture, and energy.1
1Estimates of total industry contributions come from the Center for Responsive Politics:www.opensecrets.org. They include donations from political action committees and from individuals em-ployed in an industry. They include hard money contributions and soft money contributions (i.e., contri-butions to parties directly from corporate treasuries or by individuals). We view these as overestimates.
1
Defense Contracting. All defense ¯rms and individuals associated with those ¯rms gave
approximately $10.6 million to candidates and parties in 1998 and $13.2 million in 2000.
The U.S. government spent approximately $134 billion on defense procurement contracts in
¯scal year 2000.
Agriculture. Crop producers and processors contributed $3.3 million to candidates and
parties in 2000; U.S. commodity loans and price supports equaled $22.1 billion that year.
Dairy producers, who since 1996 have had to have subsidies renewed annually, gave $1.3
million in 2000 and received price supports worth almost $1 billion in the 2002 Farm Bill.
Energy. Firms, individuals, and industry associations of the oil and gas industry gave
$21.6 million to candidates and party organizations in 1998 and $33.6 million in 2000. The
Department of Energy values subsidies to the industry in 1999 at $1.7 billion.
Digging down to the micro level, the puzzle persists. Consider the case of sugar subsidies.
Stratmann (1991) estimates that a \$3,000 sugar PAC contribution maps into a yes vote
with almost certainty" (Stratmann 1991, p. 615). Without sugar industry contributions, he
further estimates, the ¯nal vote on the sugar amendment to the 1985 agriculture bill would
have been 203-210, e®ectively ending the sugar subsidy. With contributions, the subsidy
survived: the ¯nal vote was 267-146. A 1993 GAO study values that the annual transfer
from consumers to sugar producers and processors at $1.1 billion a year from 1989 to 1991.2
In other words, a $192,000 worth of contributions in 1985 bought more $5 billion worth of
value for the industry over a ¯ve year period.
The discrepancy between the value of policy and the amounts contributed strains basic
economic intuitions. There are twin problems.
First, given the value of policy at stake, ¯rms and other interest groups should give
more. The ¯gures above imply astronomically high average rates of return on investments.
Figures on defense contracts are from the U.S. Census Bureau, Consolidated Federal Funds Report, 2000,www.census.gov/govs/c®r/00c®us.htm. Figures on commodity support programs are from the U.S. Depart-ment of Agriculture, www.usda.gov/agencies/agencies.html. Figures on subsidies to energy sources are fromthe Energy Information Agency, Federal Financial Interventions and Subsidies in Energy Markets 1999:Primary Energy, September 1999, U.S. Department of Energy, Washington DC.
2U.S. General Accounting O±ce (1993), \Sugar Program: Changing Domestic and International Condi-tions Require Program Changes" (April): GAO/RCED-93-84.
2
In a normal market, with such high rates of return, any donor should want to increase
their contributions. There are, of course, legal limits on what one can do. However, these
constraints are rarely binding. And even the large loopholes that allow donors to skirt the
limits { such as \soft" money, independent expenditures, and leadership PACs { account for
only a small fraction of the money.
Second, exceptionally high average rates of return, if real, imply that more ¯rms and
industries should enter the political marketplace. If a relatively small investment of approxi-
mately $200,000 brings a return of $1 billion, or even one-thousandth that amount, then any
investor should want to shift assets out of other investments and enter the political market.
A surpringly large number of ¯rms { even ¯rms in the Fortune 500 { do not participate at
all, even though there are virtually no barriers to entry.
The existing theoretical work in economics and political science cannot account for these
facts. One body of research posits that campaign ¯nance re°ects a competitive market for
private bene¯ts from public laws or for services and e®ort from politicians.3 Such a market
might exist, but the small amounts given imply that it must be small. As we discuss below, it
likely cannot explain most of the money given, let alone most of the value of policy reputedly
for sale.
A second strain in the theoretical literature posits that there is a market failure in politics
that gives legislators more of the bargaining power.4 In particular, legislators hold key \gate
keeping" positions, and can threaten regulation or harassing oversight unless interest groups
contribute. Such extortionary practices seem unlikely given the trivial amounts of money
raised.
A third strain of theorizing argues that donors are monopoly providers of campaign funds
and that legislators compete for contributions (Dal-Bo, 2001; Helpman and Persson, 2001).
The prediction of such models is that donors get a lot for a little, which is one possible
answer to Tullock's puzzle. However, the lack of entry presents a severe problem for these3See, e.g., Denzau and Munger (1986), Baron (1989), Snyder (1990), Baron and Mo (1991), and Grier
and Munger (1991).4Grossman and Helpman (1994) examine a range of cases, including this case.
3
models. If there are average rates of return in the many thousands, then we would expect
¯rms, individuals, and associations to °ock to campaign ¯nance. But, most ¯rms and people
do not give, even though entry is essentially costless.
Why are interest groups' campaign contributions so small? Why aren't more ¯rms and
industries involved?
We favor an alternative explanation: Campaign contributing is a form of consumption,
or, in the language of politics, participation. As we show below, almost all money in the
existing campaign ¯nance system comes ultimately from individuals and in relatively small
sums. Individuals give because they are ideologically motivated, because they are excited by
the politics of particular elections, because they are asked by their friends or colleagues, and
because they have the resources necessary to engage in this particular form of participation,
namely money. By far the single strongest predictor of contributing is income. The people
who give to politics are also disproportionately likely to participate in other ways, including
attending meetings, writing letters, talking to others, and voting (Rosenstone and Hansen,
1992; Verba, Schlozman, and Brady, 1995). We call these donors \consumer contributors."
They account for most of the campaign money in politics.
Individuals not only give the average dollar to campaigns, they also give the marginal
dollar. Candidates in competitive races raise and spend more than those in lopsided races,
and most of the additional money comes from individual contributors and parties. Senate
candidates in large states raise and spend many times more money as those in small states,
and almost all of the additional money comes from individuals. Consistent with the notion
that campaign spending re°ects participation, trends in aggregate spending over the last 100
years are explained entirely by growth in personal income.
It is true that corporations, labor unions and other interest groups give nontrivial amounts
of money to politics. They raise money from individuals and contribute those funds through
the groups' political action committees to candidates and parties. They also give \soft"
money to parties, skirting federal contribution limits. When economic interest groups give,
4
they usually appear to act as rational investors.5 However, this \investor" money accounts
for only a small fraction of overall campaign funds.
Corporations and other investor contributors may still have substantial in°uence on pol-
icy. Evidence for this idea, however, is thin. We have surveyed an extensive literature and
conducted our own analyses of legislative decision making. Legislators' votes depend almost
entirely on their own beliefs and the preferences of their voters and their party. Contributions
explain a miniscule fraction of the variation in voting behavior in the U.S. Congress.
Investor contributors have little leverage because politicians can raise su±cient funds
from consumer contributors. Members of Congress care foremost about winning reelection.
They must attend to the constituency that elects them, voters in a district or state, and the
constituency that nominates them, the party. Legislators can run e®ective campaigns by ap-
pealing to individuals for funds. Interest groups can get only a little from their contributions,
so they give only a little.
In sections 2-4 below we document that the levels and trends in campaign funds do not
follow basic predictions of rent-seeking models. Instead, campaign ¯nance looks more like
consumption or participation. Section 2 of the paper presents a portrait of where campaign
funds come from in U.S. politics today. Section 3 examines what drives the level and °uctu-
ations in campaign spending. Section 4 considers what explains legislation. The ¯nal section
o®ers tentative answers to the puzzle we pose: Why give at all?
2. Sources and Sums
Stepping back from the theories, it is useful to observe who gives what and how.
For most of the last century, campaign contributions have been regulated in the United
States. In 1911, Congress banned corporate contributions to parties and candidates and
provided for disclosure of expenditures and contributions. Over the subsequent 60 years,
that ban was extended to other organizations, including unions and trade associations. But5See, e.g., Snyder (1990, 1992, 1993), Grier and Munger (1991), Romer and Snyder (1994), Kroszner and
Stratmann (1998, 2000), and Ansolabehere and Snyder (1999, 2000).
5
these rules lacked enforcement and were far from comprehensive. Individuals, for instance,
could give unlimited amounts.
The Federal Election Campaign Act of 1974 (FECA) created a comprehensive system of
disclosure and contribution limits. The logic behind FECA is simple.
There are two types of campaign organizations: candidate campaign committees and
party committees. Candidates and parties conduct the actual election campaigns in the
United States. They are the ultimate recipients of campaign money. Individuals and groups
may run their own advocacy or independent campaigns on behalf of or against individual
candidates, but in practice such campaign expenditures pale in comparison with the activities
of candidates and parties.
There are two sources of funds: individuals and interest groups. Candidates and parties
may raise funds from individuals, ¯rms, unions, trade associations and other interest groups.6
Individuals, groups, and parties may also run their own advocacy or independent campaigns
on behalf of or against individual candidates. Individuals, groups, party committees and
candidates must report all contributions, receipts, and expenditures to the Federal Elections
Commission (FEC).7
FECA constrains how money can be raised and how much can be given. Sorauf (1988,
Chapter 2) provides an excellent overview. Brie°y, the rules are as follows.
First, to ensure transparency in accounting, organizations wishing to contribute to federal
candidates and parties must create \separate and segregated funds," commonly known as
political action committees (PACs). Organizations may not give money directly to their
PACs, except to cover start-up, administrative, and fund-raising expenses. All money that
is contributed to candidates or parties (or spent on independent political advertising) must
be raised by voluntary donations from individuals. Corporate PACs raise almost all of their
money from their managers, and unions, trade associations, and professional associations
raise almost all of their money from their members. Thus, individuals are the ultimate6Parties and candidates may give to each other, but such transfers account for a trivial percent of total
funds.7Sorauf (1992) provides an excellent summary of the FECA system.
6
source of all PAC contributions.
Second, individuals, PACs, and party committees can give only limited amounts directly
to federal candidates and committees. The lowest limits are on individuals, not groups.
PACs may give $10,000 in a two-year election cycle to a candidate ($5,000 each calendar
year). Party committees may give no more than $17,500 to a candidate in a two-year election
cycle. Individuals may give no more than $2,000 to a candidate in an election cycle ($1,000
each calendar year), no more than $5,000 to a PAC in a calendar year, and no more than
$20,000 to a party committee in a calendar year. An individual may give no more than
$25,000 total in a calendar year.8
Third, presidential candidates may receive public funds if they agree to abide by spending
limits. General election candidates may receive complete federal funding; primary election
candidates may receive public funds to match privately raised contributions. FECA set
the general election spending limit at $20 million in 1976, and this limit increases with the
consumer price index.
A fourth set of constraints created in 1974 limited candidate and group campaign ex-
penditures. In 1976, the Supreme Court struck down spending limits as a violation of free
speech in Buckley v. Valeo. Presidential spending limits survived judicial scrutiny because
they are voluntary: any candidate who wishes to receive federal funding must abide by the
limits. Congress reestablished FECA in 1976, and amended it again in 1979 and 2002. The
1979 amendments prohibited personal use of campaign funds by candidates or their families.
The 2002 amendments raised the hard money limits on party contributions.
Two important loopholes in the constraints have received extensive criticism. One was
created by the Courts, the other was created by the Federal Election Commission. The ¯rst
loophole consists of \independent expenditures." The Buckley decision allows individuals,
groups, and corporations to spend unlimited amounts on behalf of or against a candidate,
so long as such expenditures are not coordinated with candidate or party campaigns. The
second loophole consists of money raised through national party organizations for non-federal8See Sorauf (1988, Appendices A and B) for more details.
7
accounts, so- called \soft" money. Individuals and groups may give unlimited amounts to
non-federal party funds for the purpose of party building activities. The Federal Election
Commission (FEC) created soft party money through a set of administrative rulings in 1978
and 1979. Such funds, it was hoped, would strengthen party organizations in the individual
states. In fact, soft money has just become an accounting convention used by the national
party organizations to raise even more money. Although unlimited in amount, independent
expenditures and soft party donations must still be publicly disclosed. The 2002 amendments
to the FECA restricted soft money.9
Even with these substantial loopholes, almost all campaign money comes in the form of
\hard" contributions that must abide by the limits, and all of these funds come ultimately
from individuals. A simple accounting for the 2000 elections reveals this immediately.
Candidate and party committees raised nearly $3 billion during the 1999-2000 election
cycle. Congressional candidates raised and spent just over $1 billion in the 2000 election;
presidential candidates raised and spent just over $500 million; and political party hard
and soft money accounts totaled $1.2 billion. PACs raised $600 million, approximately $320
million of which was for fundraising and other expenses and $20 million of which was devoted
to independent expenditures; the remainder was contributed to congressional candidates.10
The majority of this money came from individuals in small amounts. We estimate that
of the $3 billion, individuals contributed nearly $2.4 billion, the public treasury paid $235
million, and about $380 million came directly from the treasuries of corporations, unions,
and other associations.11 And campaign money comes mainly in dribs and drabs. According
to survey research, in the 2000 election approximately 10 percent of the Americans over 18
(21 million people) gave to political candidates, party committees, or political organizations.
9A further loophole allows legislators to set up leadership PACs which allow donors to give up to $10,000to a candidate, but such funds cannot be used on that candidate's campaigns.
10The party accounts are the most di±cult to analyze. Transfers between party accounts amount toapproximately 10 percent of all party money. The correct ¯gure is probably, then, about $1 billion.
11The FEC does not provide a direct accounting of this ¯gure because only the total amount of contri-butions under $200 must be reported, not the speci¯c donations. We estimated the total amount of softmoney from ¯rms and organizations (approximately $380 million) using the individual donor ¯les and on-linereports from the Federal Election Commission: www.fec.gov.
8
The average contribution from an individual to a candidate, party committee or PAC, then,
is approximately $115.12
Of the estimated $2.4 billion in individuals' contributions, about $1.1 billion takes the
form of direct contributions to congressional and presidential candidates; $700 million goes
to the parties; and $600 million goes to PACs.
Much of the focus of the academic literature focuses on interest groups and their PACs,
so they deserve a closer look. Approximately 4,500 PACs are registered with the Federal
Election Commission. In the 2000 election, 3,000 PACs gave to federal candidates or parties
or engaged in some form of independent expenditure campaign; the remaining one-third
were inactive. It is noteworthy that the number of active PACs has declined by 12% since
1988. Among the active PACs, 1,400 are associated with corporations, 670 are tied to a
membership or industry group (such as the American Medical Association), and 240 are
associated with labor unions. Another 670 are ideological groups.
Strikingly few ¯rms give money to federal candidates. Only 60 percent of the Fortune
500 companies have PACs. The Fortune 500 companies have revenues in excess of $3 billion
a year (each), and all are a®ected by government policies. As noted above, roughly one-third
of all industries have no ¯rms with PACs.
Perhaps the most surprising feature of the PAC world is the fact that the constraints on
contributions are not binding. Only 4 percent of all PAC contributions to House and Senate
candidates are at or near the $10,000 limit. The average PAC contribution is $1,700. Corpo-
rations give an average contribution of approximately $1,400 to legislators; trade associations
and membership groups give average contributions of approximately $1,700, and labor unions
give average contributions of $2,200. Viewed from the perspective of rent-seeking legislature,
these sums are quite small. If such models capture the essence of campaign fundraising,
then legislators should extract much larger contributions from interested donors. If donors
reached the maximum allowed amount, PACs would have given six times as much as they12Divide by 2.4 billion by 21 million. Survey estimates come from the National Election Study: ICPSR
study number 3131, available at http://www.umich.edu/ nes/studyres/nes2000/nes2000.htm. See Rosen-stone and Hansen (1992).
9
do, or nearly $2 billion.
Comparing the di®erent sorts of contributions, it is evident that individuals are by far
the most important source of campaign funds. Even in congressional elections, where PACs
are most active, candidates raised over 3 times more from individuals directly than they did
from PACs.
3. What Drives Campaign Spending?
Individual contributions are the core of the campaign ¯nance system. We therefore expect
that the factors that determine why individuals give are the factors that drive total campaign
spending.
The tiny size of the average contribution made by private citizens suggests that little
private bene¯t could be bought with such donations. Instead, political giving must be a
form of consumption not unlike giving to charities, such as the United Way or public radio.
Economic theory predicts relatively little about such consumption goods, except that like
any normal good they will grow with income. Survey researchers in political science and
sociology have documented exactly this pattern. Income is the main predictor of giving to
political campaigns and organizations, and it is the main predictor of contributing to non-
religious charities. And, individuals give very little to politics, much less than to charities.
Political contributions in 2000 were just 4 hundredths of one percent of national income.
The contribution behavior of top corporate executives proves the rule. We examined the
political contributions of 94 top executives from 12 large corporations { some of the wealthiest
people in America.13 On average, these executives gave $3,000 to their own corporations'
political action committees in the 1997-1998 election cycle. They gave an additional $4,500
to candidates, parties, and other committees, for an average total political contribution of
$7,500 per executive, far below the $25,000 allowed under FECA. Dividing by their annual13The corporations are AT&T, Boeing, Citigroup, Exxon Mobil, General Electric, General Motors, Home
Depot, IBM, Microsoft, P¯zer, Verizon, and Wal-Mart. Data on executives and their compensation comefrom the ExecuComp Database. Data on contributions came from the Center for Responsive Politics:www.opensecrets.org.
10
compensation, these executives gave $51 for every $100,000 of income each year. In other
words, top corporate executives gave about 5 hundredths of one percent of their annual
compensation to political campaigns, only slightly above the national average.14
As with the public at large, giving to charity is much more important to ¯rms and
executives than giving to politics. Milyo, Primo, and Groseclose (2000) studied 15 large
corporations in 1998. The ¯rms in their sample gave $1,611 million to charities and just $16
million to political campaigns.15
The notion that campaign contributions mainly re°ect consumption and participation
of many individuals suggests that personal income should determine the amount raised and
spent in campaigns.
Alternatively, a basic prediction of rent-seeking models is that total government spending
should explain total campaign spending. The growth of government over the last 60 years,
the argument goes, has meant that government regulations, taxes and subsidies, and other
policies, can have substantial e®ects on private interests. The very threat of regulation or
other unfavorable treatment may induce private interests to give to politics. As a result,
the more government spends, the more private interests must contribute (Lott 2000). This
should hold even if donors are able to buy a lot for a little.
We constructed three data sets: a time-series of campaign spending under the Federal
Election Campaign Act from 1978 to 2000, a time-series of candidate and party expenditures
in presidential elections from 1884 to 2000, and a panel of campaign spending by guberna-
torial candidates from 1976 to the present. The FECA data o®ers the best accounting of
campaign spending in any context. The presidential election series o®ers a very long time
series, but the quality of the data is less good. The state data o®ers the advantage of a
panel, with enough observations to allow us to test competing hypotheses.14This ¯gure even overstates the share of income devoted to politics, because we do not include income
from capital gains, dividends, and interest.15The response to the 9/11 terrorist attack also suggests that campaign contributions might be properly
viewed simply as one item in a portfolio of voluntary donations. Stevens (2001) reports that politicalcontributions dropped signi¯cantly in the month following 9/11, as individuals diverted their funds to variouscharities. Interestingly, PACs were probably a®ected most severely.
11
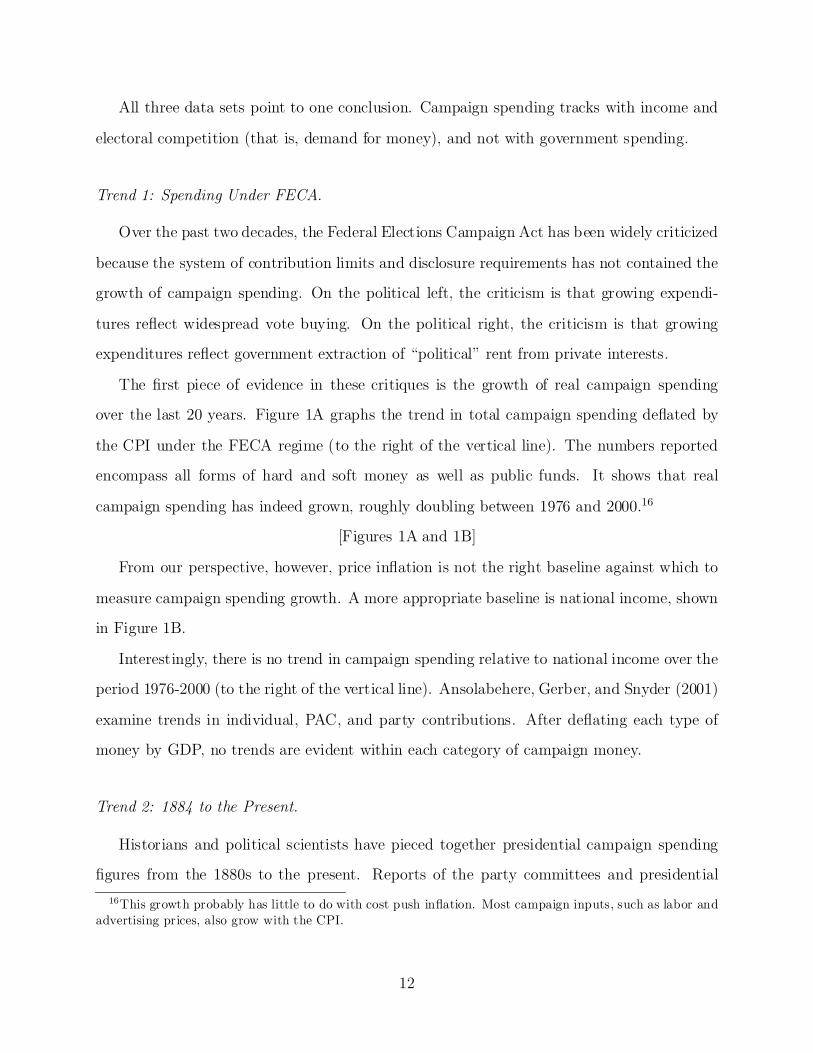
All three data sets point to one conclusion. Campaign spending tracks with income and
electoral competition (that is, demand for money), and not with government spending.
Trend 1: Spending Under FECA.
Over the past two decades, the Federal Elections Campaign Act has been widely criticized
because the system of contribution limits and disclosure requirements has not contained the
growth of campaign spending. On the political left, the criticism is that growing expendi-
tures re°ect widespread vote buying. On the political right, the criticism is that growing
expenditures re°ect government extraction of \political" rent from private interests.
The ¯rst piece of evidence in these critiques is the growth of real campaign spending
over the last 20 years. Figure 1A graphs the trend in total campaign spending de°ated by
the CPI under the FECA regime (to the right of the vertical line). The numbers reported
encompass all forms of hard and soft money as well as public funds. It shows that real
campaign spending has indeed grown, roughly doubling between 1976 and 2000.16
[Figures 1A and 1B]
From our perspective, however, price in°ation is not the right baseline against which to
measure campaign spending growth. A more appropriate baseline is national income, shown
in Figure 1B.
Interestingly, there is no trend in campaign spending relative to national income over the
period 1976-2000 (to the right of the vertical line). Ansolabehere, Gerber, and Snyder (2001)
examine trends in individual, PAC, and party contributions. After de°ating each type of
money by GDP, no trends are evident within each category of campaign money.
Trend 2: 1884 to the Present.
Historians and political scientists have pieced together presidential campaign spending
¯gures from the 1880s to the present. Reports of the party committees and presidential16This growth probably has little to do with cost push in°ation. Most campaign inputs, such as labor and
advertising prices, also grow with the CPI.
12
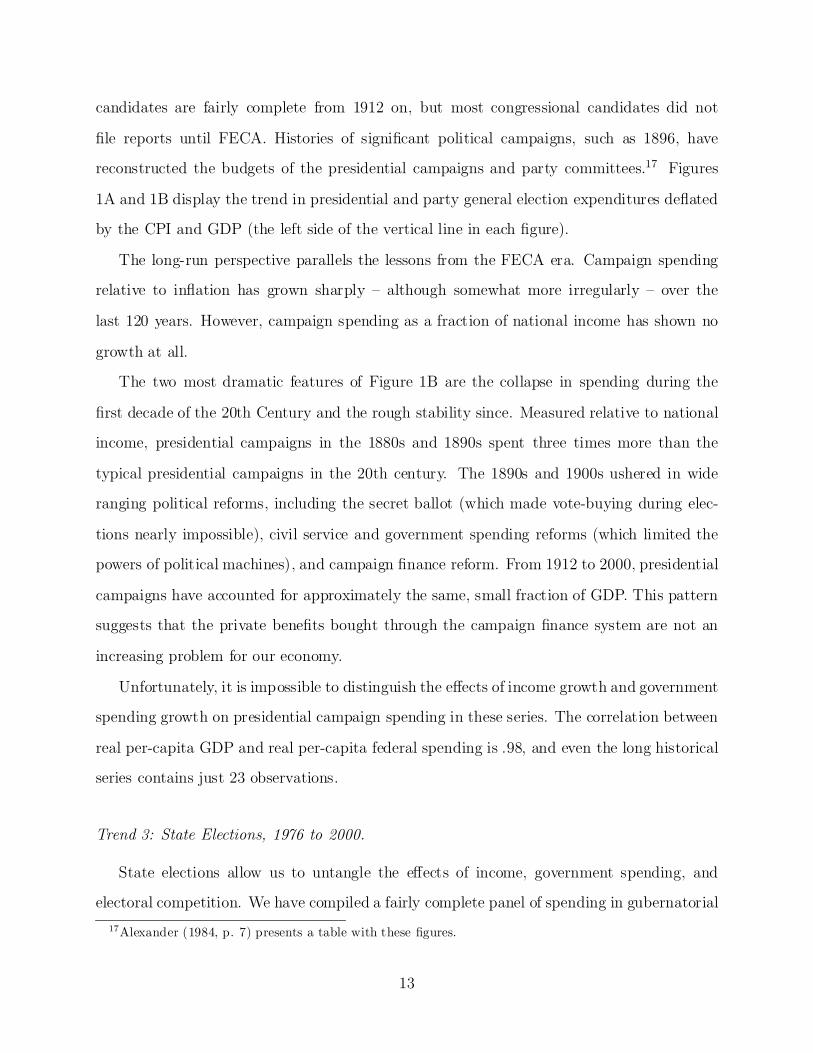
candidates are fairly complete from 1912 on, but most congressional candidates did not
¯le reports until FECA. Histories of signi¯cant political campaigns, such as 1896, have
reconstructed the budgets of the presidential campaigns and party committees.17 Figures
1A and 1B display the trend in presidential and party general election expenditures de°ated
by the CPI and GDP (the left side of the vertical line in each ¯gure).
The long-run perspective parallels the lessons from the FECA era. Campaign spending
relative to in°ation has grown sharply { although somewhat more irregularly { over the
last 120 years. However, campaign spending as a fraction of national income has shown no
growth at all.
The two most dramatic features of Figure 1B are the collapse in spending during the
¯rst decade of the 20th Century and the rough stability since. Measured relative to national
income, presidential campaigns in the 1880s and 1890s spent three times more than the
typical presidential campaigns in the 20th century. The 1890s and 1900s ushered in wide
ranging political reforms, including the secret ballot (which made vote-buying during elec-
tions nearly impossible), civil service and government spending reforms (which limited the
powers of political machines), and campaign ¯nance reform. From 1912 to 2000, presidential
campaigns have accounted for approximately the same, small fraction of GDP. This pattern
suggests that the private bene¯ts bought through the campaign ¯nance system are not an
increasing problem for our economy.
Unfortunately, it is impossible to distinguish the e®ects of income growth and government
spending growth on presidential campaign spending in these series. The correlation between
real per-capita GDP and real per-capita federal spending is .98, and even the long historical
series contains just 23 observations.
Trend 3: State Elections, 1976 to 2000.
State elections allow us to untangle the e®ects of income, government spending, and
electoral competition. We have compiled a fairly complete panel of spending in gubernatorial17Alexander (1984, p. 7) presents a table with these ¯gures.
13
elections from 1976 to 2000. The data set includes campaign expenditures or contributions
by all candidates, population, personal income, state government expenditures, and primary
and general election results.18
It is di±cult to compare campaign spending levels across states, because states operate
under di®erent regulatory regimes. Some states have no limits on contribution or expenditure
levels (AL, PA, UT), while others have relatively strict limits that have been in place for
many years. Some states allow direct corporate and labor contributions (IL, NM), while
others do not. And some states have generous public funding mechanisms (MI, NJ). Instead
of comparing across states, we can exploit the panel structure of the data and compare
changes in spending and other variables over time within states.
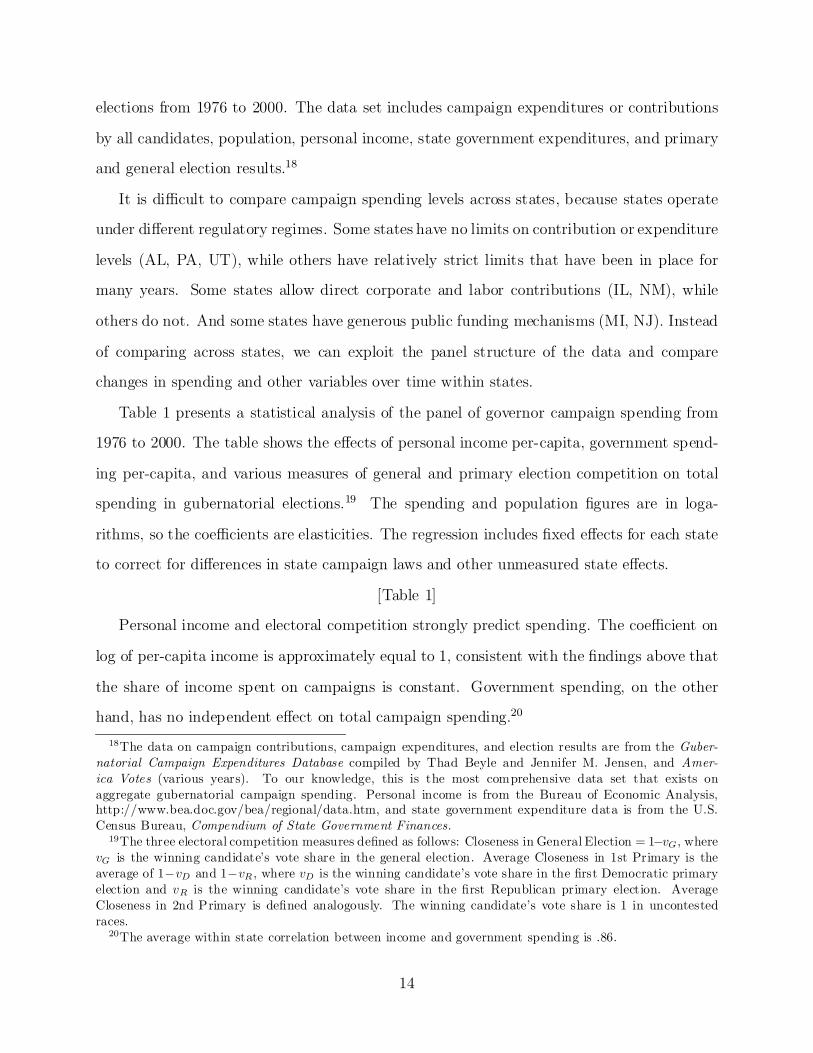
Table 1 presents a statistical analysis of the panel of governor campaign spending from
1976 to 2000. The table shows the e®ects of personal income per-capita, government spend-
ing per-capita, and various measures of general and primary election competition on total
spending in gubernatorial elections.19 The spending and population ¯gures are in loga-
rithms, so the coe±cients are elasticities. The regression includes ¯xed e®ects for each state
to correct for di®erences in state campaign laws and other unmeasured state e®ects.
[Table 1]
Personal income and electoral competition strongly predict spending. The coe±cient on
log of per-capita income is approximately equal to 1, consistent with the ¯ndings above that
the share of income spent on campaigns is constant. Government spending, on the other
hand, has no independent e®ect on total campaign spending.20
18The data on campaign contributions, campaign expenditures, and election results are from the Guber-natorial Campaign Expenditures Database compiled by Thad Beyle and Jennifer M. Jensen, and Amer-ica Votes (various years). To our knowledge, this is the most comprehensive data set that exists onaggregate gubernatorial campaign spending. Personal income is from the Bureau of Economic Analysis,http://www.bea.doc.gov/bea/regional/data.htm, and state government expenditure data is from the U.S.Census Bureau, Compendium of State Government Finances.
19The three electoral competition measures de¯ned as follows: Closeness in General Election = 1¡vG, wherevG is the winning candidate's vote share in the general election. Average Closeness in 1st Primary is theaverage of 1¡vD and 1¡vR , where vD is the winning candidate's vote share in the ¯rst Democratic primaryelection and vR is the winning candidate's vote share in the ¯rst Republican primary election. AverageCloseness in 2nd Primary is de¯ned analogously. The winning candidate's vote share is 1 in uncontestedraces.
20The average within state correlation between income and government spending is .86.
14
Using the coe±cients in Table 1, one can calculate that per-capita income growth and
population growth explain nearly all of the growth in per-capita campaign spending in the
states. Both per-capita income and population grew from the 1970s to the 1990s. The e®ect
of income growth on predicted levels of campaign spending is roughly 4 times larger than
the e®ect of population growth.
Electoral competition has a strong positive e®ect on total spending. However, these
variables trend downward over the period studied. Gubernatorial elections were, on average,
more competitive in the 1970s than in the 1990s, and fewer seats came open during the
1990s. Thus, the trend in electoral competition cannot explain the growth in spending.
Rather, these variables would predict a trend in the opposition direction.
Cross-Sectional Analysis.
Looking across elections teaches a similar lesson. The average House election cost
$834,000 in the 1990s (Democratic and Republican candidate spending combined), but
spending varied considerably across districts.
District income and electoral competition predict variation in total spending in congres-
sional elections. per-capita income in congressional districts ranges from a low of $7,000 to
a high of $41,000, with an average of $15,000. During the 1990s, total campaign spending
averaged $696,000 in low income districts (per-capita income below $12,000), $806,000, in
middle income districts (per-capita income between $12,000 and $20,000), and $1,052,000
in high income districts (per-capita income above $20,000). Holding constant the competi-
tiveness of the race, an additional $1,000 dollars of per-capita income in a district translates
into an additional $20,000 of total campaign spending.21
Competitiveness of the race has even stronger e®ects on total spending. The typical House
election in the 1990s was decided by 17 percentage points, but many races were determined
by small margins. During the 1990s, total spending averaged $1.5 million in House elections21To correct for the skew in both district income and total spending, we convert spending and income can
into logarithmic scale. The elasticity of total spending in terms of per-capita income is .43
15
decided by fewer than 5 percentage points; $1.2 million in House elections decided by 5 to 15
percentage points; $846,000 in elections decided by 15 to 30 percentage points; and $489,000
in elections decided by more than 30 percentage points. Holding constant district income, a
1 percentage point reduction in the electoral margin between the candidates corresponds to
an increase in combined total spending of $20,000.
Importantly, individual donors grow in importance as demand for campaign cash in-
creases. In safe House seats, those decide by a margin of 30 percentage points or more,
48% of campaign funds came from individuals and 46% from PACs. In close House races,
those decided by fewer than 5 percentage points, 60% of campaign funds came from indi-
viduals and 31% came from PACs. Most of the di®erence in the share from individuals is
accounted for by contributions in amounts less than $500. On the margin, then, candidates
raise disproportionately more from individuals than from interest groups.
A more dramatic pattern holds in U.S. Senate elections. The average U.S. Senate can-
didate receives approximately $1 to $2 million from interest groups, and this amount varies
little with state size. Total PAC contributions to California Senate elections (Democrat and
Republican candidates combined) average of $2 million from PACs during the 1990s. Total
PAC contributions to Wyoming and North Dakota Senate elections received an average of
$950,000 from PACs during the 1990s. Overall, however, California Senate elections are
much more expensive than elections in Wyoming and North Dakota. The typical U.S. Sen-
ate election in California during the 1990s cost $24 million, while the typical U.S. Senate
election in small states cost $2 million total in the 1990s. The di®erence is accounted for
almost entirely by individual contributors. California is both wealthier and more populous
than Wyoming and North Dakota.22
4. What Explains Legislative Decisions?
The critical evidence for the argument that campaign ¯nance re°ects a market for policy22See Snyder (1993) and Ansolabehere and Snyder (1999) for more comprehensive and detailed analyses
of this phenomenon.
16
is whether contributions have substantial e®ects on legislative decisions and policy outcomes.
Almost all research on donors' in°uence in legislative politics the e®ects of contributions on
roll call votes cast by members of Congress.23
Dozens of studies have considered the e®ects of contributions on legislative votes, across
hundreds of pieces of legislation. We surveyed nearly fourty articles in economics and political
science that examine the relationship between PAC contributions and congressional voting
behavior. Table 2 summarizes the key ¯ndings reported in these papers and some details
about the analyses. Typically, these papers regresses roll call votes { either a single vote,
a vote count, or a vote index { on a number of independent variables, including the PAC
contributions received by the legislator. Some papers study broad issues and include broad
measures such as total corporate PAC contributions and/or total labor PAC contributions.
Others study narrower issues and include more narrowly de¯ned contribution measures {
e.g., regressing votes on dairy price supports on contributions from dairy industry PACs.
[Table 2 here]
Setting aside questions about the right speci¯cation, what do these studies suggest?
We count the number of coe±cients on PAC contributions that are signed correctly and
statistically signi¯cant at the 5% level (two-tailed).24
PAC contributions show relatively few e®ects. In three out of four instances, campaign
contributions had no statistically signi¯cant e®ects on legislation or had the wrong sign (sug-
gesting that more contributions lead to less support). Also, given the di±culty of publishing
\non-results" in academic journals, we suspect that the true incidence of papers written
showing campaign contributions in°uence votes is even smaller.23Exceptions are Hall and Wayman (1990), who study e®ort on behalf of groups, and Langbein (1986),
who study minutes spent with lobbyists. Hansen and Park (1995) study policy outputs { antidumpingand countervailing duty decisions by the International Trade Administration { and ¯nd that total PACcontributions by an industry typically have no e®ect on the industry's chances of obtaining a favorabledecision.
24Many papers run a similar model many times, adding di®erent variables to the model to check robustness.We count these as one regression equation. If the coe±cients of interest in these nested models are signedcorrectly and statistically signi¯cant at the 5% level of signi cance for a two-tailed test in at least halfthe models, we count this as ¯nding campaign contributions as statistically signi cant. We also considerthe speci¯cation as \one regression" if there are only small changes to the speci¯cation, such as a di®erentmeasure of a control variable, such as ideology.
17
We are interested not only in statistical signi¯cance, but also in magnitudes. Unfortu-
nately, it is di±cult to interpret the relative magnitude and meaning of the coe±cients for
most of the analyses in Table 2, because few of these papers report enough information about
the data (e.g., means and standard deviations of the underlying variables). In addition, two
well-known speci¯cation issues plague most of these studies. First, there is likely simultane-
ity between contributions and votes { in many studies the level of PAC contributions is the
dependent variable and a roll-call-based measure of \ideology" is one of the independent
variables. This issue is ignored in most studies (see Table 2). Second, although most pa-
pers attempt to control for district interests and members' own preferences, the variables
used are typically crude because of limits on the available data. This is a serious problem
because of the tendency for groups to contribute to \friendly" legislators. Such a strategy
is well-grounded theoretically { groups may contribute in part to help re-elect their friends,
and legislators from \friendly" districts may be able provide services to the groups at lower
marginal cost { and is well documented empirically.25
To address these problems, we perform our own statistical analysis. Our dependent
variable is the roll call voting score produced by the Chamber of Commerce of the U.S.
(CCUS). We collected this for the U.S. House from 1978 to 1994. Like many interest groups,
the CCUS identi¯es 12-20 bills in each Congress that are important to its interests, and
calculates the percentage of times that each member of Congress votes with the group.
Scores therefore run from 0 to 100.26
We estimate six models, which cover much of the range found in the existing literature.
First, we consider three di®erent ways of controlling for district and legislator preferences:
including party a±liation of the member and a measure of district preferences based on
voting patterns; including party a±liation of the member and a district-speci¯c ¯xed e®ect;25See, e.g., Herndon (1982), Poole and Romer (1985), Grier and Munger (1986, 1991, 1993), Poole, Romer
and Rosenthal (1987), and Evans (1988).26We conducted similar analyses for ¯ve other organizations as well. The organizations are the AFL-CIO,
the American Security Council, the Consumer Federation of America, the League of Conservation Voters,and the National Education Association. Since the basic patterns are similar in all cases, we only report theresults for the CCUS.
18
and including a legislator-speci¯c ¯xed e®ect. The last two speci¯cations exploit the panel
structure of the data { we observe most legislators several times in the sample. We believe
that using legislator-speci¯c ¯xed e®ects provides the most compelling estimates, because
this controls for legislators' own (average) preferences in addition to district preferences.
There is strong evidence that legislators are not tightly constrained by their constituencies
when casting roll call votes.27
In addition, we estimate each speci¯cation using both ordinary least squares (OLS) and
instrumental variables (IV). We follow Chappell (1981, 1982), Welch (1982), and others in
choosing instruments. Two types of variables are used: the degree of electoral competition,
and measures of members' relative \power" inside the House. The idea is that a close race
increases an incumbent's demand for PAC contributions, producing an exogenous shift in
contributions via in increase in the propensity to \sell" services, including roll call votes.
Groups give more to powerful members because their support is especially valuable.28
The results are shown in Table 3. The ¯rst three columns of present the OLS estimates
and the second three columns present the IV estimates.
Columns 1 and 4 are similar to the most common speci¯cations found in the literature,
which use direct measures to control for district and legislator preferences. Contributions
have signi¯cant e®ects on votes. Even so, taking the most charitable estimates (from column
1), the e®ects of contributions are quite small compared to other factors. An additional
$60,000 in corporate PAC contributions (approximately one standard deviation) changes the
voting score by at most 2 points; an additional $50,000 in labor PAC contributions changes
the voting score by 6 point. By comparison, changing the party of a district's representative
changes the voting score by more than 30 points. Using instrumental variables reduces the27See, e.g., Poole and Rosenthal (1984, 1997), Levitt (1996), and Ansolabehere, Snyder and Stewart
(2001). Two recent papers noted in Table 2 employ member-speci¯c ¯xed e®ects (Bronars and Lott, 1997;and Stratmann, 2002). They reach opposite conclusions about the importance of contributions.
28The instrumental variables are: total campaign spending by the opponent, |vote-share minus .5|, adummy variable indicating that the member ran unopposed, a dummy variable indicating that the memberis a party leader, a dummy variable indicating that the member is a committee chair, and a dummy variableindicating that the member was on the Ways and Means or Energy and Commerce committee (probably thetwo most powerful committees with respect to business issues).
19
estimated e®ects of contributions substantially, and reverse the sign on corporate donations
(column 4).
Controlling for voters' preferences using district ¯xed e®ects almost completely eliminates
the e®ects of contributions on legislative voting, in both the OLS and IV estimates. And
the e®ect of a change in party actually increases, to 40 points on the scale.
Using legislator ¯xed e®ects eliminates the e®ects of contributions entirely, in both the
OLS and IV. The estimated coe±cients are tiny and statistically insigni¯cant. Evidently,
changes in donations to an individual legislator do not translate into changes in that legis-
lator's roll call voting behavior.
Overall, our ¯ndings parallel that of the broader literature. Indicators of party, ideology,
and district preferences account for most of the systematic variation in legislators' roll call
voting behavior. Interest group contributions account for at most a small amount of the
variation. In fact, after controlling adequately for legislator ideology, these contributions
have no detectable e®ects on legislative behavior.
5. Why Do Interest Groups Give at All?
Aggregate campaign spending in the United States, we conjecture, mainly re°ects the
consumption value that individuals receive from giving to campaigns. Perhaps the sharpest
evidence in support of this conjecture is the ¯nding that income, not government spending,
explains campaign spending in the states. In addition, individual contributors provide the
average and the marginal dollar to political campaigns. Because politicians can readily raise
campaign funds from individuals, rent-seeking donors lack the leverage to extract excessively
large private bene¯ts from legislation.
This argument suggest a reorientation of future research on campaign ¯nance.
First, it is still possible that campaign contributions have signi¯cant e®ects on economic
and social policies. To raise su±cient funds, candidates might skew policies in ways preferred
by donors. Campaign contributions might therefore act like weighted votes. And contrib-
utors, who are disproportionately wealthy, might have di®erent policy preferences than the
20
median voter. Whether this has signi¯cant e®ects on policy is unknown. Fleshing this out
requires careful study of how policy responds to the preferences of contributors and the
overall level of contributions.
Second, more empirical and theoretical work remains to make the argument convincing.
As with other forms of voluntary public-spirited activities such as giving to charities or
voting, the theoretical underpinnings of small campaign donations are not well developed.
It is unclear what speci¯c empirical predictions distinguish consumption from rent-seeking,
or what evidence will prove compelling.
The consumption idea itself needs re¯nement. Consumption might take many forms,
including expression, citizen duty, and social life. Do fundraising strategies of PACs look
like those of charitable organizations or like those of venture capitalists? Charities hold
events, bring in speakers with as much celebrity status as possible, and conduct mass-mail
drives. If campaign contributions are a form of expression, then we might expect certain
types of people go give to like types of candidates and organizations, e.g., women to women
candidates. Are contributors more interested in politics on a personal level than other
citizens? Is politics an important part of their social life?
Finally, if the consumption/participation/expression argument is correct, then it turns
Tullock's puzzle on its head. The question is not why do corporations, unions, and other
interest groups give so little, but why do they give at all? Why do they form PACs?29 Why
do they behave so strategically when they give?
We think there are four possible answers, each deserving of further exploration.
One possible answer is that interest groups give a little and get a little. Although aggre-
gate expenditures primarily re°ect consumption, a subset of donors { mainly corporate and
industry PACs { behave as if they expected favors in return. These contributors may in fact
receive a reasonable rate of return, say 20 percent, but their investments do not account for
most money, and they do not explain much government activity.
A second answer is that money buys access, rather than policy directly. Legislators29One possibility is that PACs coordinate individual donations and help overcome collective action prob-
lems. See Marx and Matthews (2000) for an interesting model that might be applicable.
21
and their sta®ers are busy people. Campaign contributions are one way to improve the
chances of getting to see the legislator about matters of concern to the group. There is
some evidence that campaign contributions are tied to lobbying activities. Groups that give
large amounts to political campaigns emphasize lobbying.30 The behavior of interest groups
speaks to the value of lobbying: organizations spend 10 times more on lobbying than they
do on campaign contributions.31 Of course, access itself does not guarantee in°uence, but
only the opportunity to provide information that might in°uence legislators.
A third explanation is that groups seek to a®ect elections { to elect legislators that are
sympathetic to their views and defeat legislators known to be hostile. Our analysis of roll
call voting above reveals that who is in the legislature { a Republican or a Democrat {
has an enormous e®ect on support for a range of policies of importance to groups. Helping
to elect friends might have much larger marginal e®ects on legislation than trying to buy
support from those already in Congress. Why doesn't this lead groups to contribute untold
billions of dollars to friendly candidates? There are two reasons. First, statistical analyses
estimate that the marginal e®ect of an additional $100,000 of campaign spending is quite
small, probably no more than 1 percentage point in the vote in the typical House race even in
the observed ranges (e.g., Jacobson, 1980; Levitt, 1994). Second, collective action problems
abound, leading to under-investment in activities that may bene¯t, say business as a whole.
A ¯nal possibility is that even interest groups give for consumption. PAC contribu-
tions are solicited at events attended by prominent national politicians { people of celebrity
status. Organizations' executives and managers may value being part of the Washington
establishment.
30Sabato (1984) discusses the general connection between contributions and lobbying. Ansolabehere,Snyder and Tripathi (2002) ¯nd a strong correlation between between the amount groups contribute andthe amount they lobby. Langbein (1986) estimates the price of a legislator's time. The estimate { that onehour of time costs around $10,000 { does not appear unreasonable.
31The Lobby Reform Act (1995) provides for disclosure of expenditures on executive and legislative lob-bying. In 1997-1998, interest groups spent $3 billion on lobbying, compared to $300 million on PAC contri-butions (Ansolabehere, Snyder and Tripathi (2002).
22
References
Alexander, Herbert E. 1984. Financing Politics. Washington DC: CQ Press.
Ansolabehere, Stephen and James M. Snyder, Jr. 1999. \Money and Institutional Power."Texas Law Review 77: 1673-1704.
Ansolabehere, Stephen and James M. Snyder, Jr. 2000. \Money and O±ce." In Continu-ity and Change in Congressional Elections, edited by David Brady and John Cogan.Stanford, CA: Stanford University Press.
Ansolabehere, Stephen, Alan Gerber, and James M. Snyder, Jr. 2001. \Corruption andthe Growth of Campaign Spending." In A User's Guide to Campaign Finance Reform,edited by Gerald C. Lubenow. New York: Rowman and Little¯eld.
Ansolabehere, Stephen, James M. Snyder, Jr., and Charles Stewart, III. 2001. \CandidatePositioning in U.S. House Elections." American Journal of Political Science 45: 136-159.
Ansolabehere, Stephen, James M. Snyder, Jr., and Micky Tripathi. 2002. \Are PACContributions and Lobbying Linked? New Evidence from the 1995 Lobby DisclosureAct." Business and Politics, forthcoming.
Bailey, Michael. 2002. \Do Campaign Contributions Lead to Policies That Favor theWealthy? An Examination of Taxing and Spending in the American States." Unpub-lished manuscript, Georgetown University.
Baron, David P. 1989. \Service-Induced Campaign Contributions and the Electoral Equi-librium." Quartely Journal of Economics 104: 45-72.
Baron, David P. 1991. \Campaign Contributions and Party-Candidate Competition inServices and Policies." In Political Economy: Institutions, Competition, and Rep-resentation, edited by W.A. Barnett, M.J. Hinich, and N.J. Scho¯eld. Cambridge:Cambridge University Press.
Bronars, Stephen G., and John R. Lott, Jr. 1997. \Do Campaign Donations Alter Howa Politician Votes? Or, Do Donors Support Candidates Who Value the Same ThingsThat They Do?" Journal of Law and Economics 40: 317-350.
Chappell, Henry W., Jr. 1981. \Campaign Contributions and Voting on the Cargo Pref-erence Bill: A Comparison of Simultaneous Models." Public Choice 36: 301-312.
Chappell, Henry W., Jr. 1982. \Campaign Contributions and Congressional Voting: ASimultaneous Probit-Tobit Model." Review of Economics and Statistics 62: 77-83.
Coughlin, Cletus C. 1985. \Domestic Content Legislation: House Voting and the EconomicTheory of Regulation." Economic Inquiry 23: 437-448.
Dal-Bo, Ernesto. 2001. \Bribing Voters." Unpublished manuscript, Oxford University.
23
Denzau, Arthur T., and Michael C. Munger. 1986. \Legislators and Interest Groups:How Unorganized Interests Get Represented." American Political Science Review 80:89-106.
Durden, Garey C., Jason F. Shogren, and Jonathan I. Silberman. 1991. \The E®ects ofInterest Group Pressure on Coal Strip-Mining Legislation." Social Science Quarterly72: 239-250.
Evans, Diana. 1986. \PAC Contributions and Roll-Call Voting: Conditional Power." InInterest Group Politics, 2nd ed., edited by Allan J. Cigler and Burdett A. Loomis.Washington, D.C.: Congressional Quarterly.
Evans, Diana. 1988. \Oil PACs and Aggressive Contribution Strategies." Journal ofPolitics 50: 1047-1056.
Feldstein, Paul J., and Glenn Melnick. 1984. \Congressional Voting Behavior on HospitalLegislation: An Exploratory Study." Journal of Health Politics 8: 686-701.
Frendreis, John P., and Richard Waterman, 1986. \PAC Contributions and LegislativeBehavior: Senate Voting on Trucking Deregulation." Social Science Quarterly 66:401-412.
Grenzke, Janet M. 1989. \PACS and the Congressional Supermarket: The Currency isComplex." American Journal of Political Science 33: 1-24.
Grier, Kevin, and Michael Munger. 1986. \The Impact of Legislator Attributes on Interest-Group Campaign Contributions." Journal of Labor Research 7: 349-361.
Grier, Kevin B., and Michael C. Munger. 1991. \Committee Assignments, ConstituentPreferences, and Campaign Contributions." Economic Inquiry 29: 24-43.
Grier, Kevin B., and Michael C. Munger. 1993. \Comparing Interest Group PAC Con-tributions to House and Senate Insumcumbents, 1980-1986." Journal of Politics 55:615-643.
Grier, Kevin B., Michael C. Munger, and Brian E. Roberts. 1994. \The Determinants ofIndustry Political Activity, 1978-1986." American Political Science Review 88: 911-926.
Grossman, Gene, and Elhanan Helpman. 1994. \Protection for Sale." American EconomicReview 84: 833-850.
Hall, Richard L., and Frank W. Wayman. 1990. \Buying Time: Moneyed Interests andthe Mobilizations of Bias in Congressional Committees." American Political ScienceReview 3: 797-820.
Hansen, Wendy L., and Kee Ok Park. 1995. \Nation-State and Pluralistic Decision Makingin Trade Policy: The Case of the International Trade Administration." InternationalStudies Quarterly 39: 181-211.
Helpman, Elhanan, and Torsten Persson. 2001. \Lobbying and Legislative Bargaining."Advances in Economic Analysis and Policy 1, article 3.
24

Herndon, James. 1982. \Access, Record, and Competition as In°uences on Interest GroupContributions to Congressional Campaigns." Journal of Politics 44: 996-1019.
Jacobson, Gary C. 1980. Money in congressional elections. New Haven, CT: Yale Univer-sity Press.
Johnson, Linda L. 1985. \The E®ectiveness of Savings and Loan Political Action Commit-tees." Public Choice 46: 289-304.
Jones, Woodrow, Jr., and K. Robert Keiser. 1987. \Issue Visibility and the E®ects of PACMoney." Social Science Quarterly 68: 170-176.
Kau, James B., and Paul H. Rubin. 1981. \The Impact of Labor Unions on the Passageof Economic Legislation." Journal of Labor Research 2: 133-145.
Kau, James B., and Paul H. Rubin. 1984. \Economic and Ideological Factors in Congres-sional Voting: The 1980 Election." Public Choice 44: 385-388.
Kau, James B., Donald Keenan, and Paul H. Rubin. 1982. \A General Equilibrium Modelof Congressional Voting." Quarterly Journal of Economics 97: 271-293.
Kroszner, Randall S., and Thomas Stratmann. 1998. \Interest Group Competition andthe Organization of Congress: Theory and Evidence from Financial Services PoliticalAction Committees." American Economic Review 88: 1163-87.
Kroszner, Randall S., and Thomas Stratmann. 2000. \Congressional Committees asReputation-Building Mechanisms: Repeat PAC Giving and Seniority on the HouseBanking Committee." Business and Politics, 2: 35-52.
Langbein, Laura I. 1986. \Money and Access: Some Empirical Evidence." Journal ofPoltiics 48: 1052-62.
Langbein, Laura I. 1993. \PACs, Lobbies, and Political Con°ict: The Case of Gun Con-trol." Public Choice 75: 254-271.
Langbein, Laura I., and Mark Lotwis. 1990. \The Political E±cacy of Lobbying andMoney: Gun Control in the U.S. House, 1986." Legislative Studies Quarterly 15: 413-440.
Levitt, Steven D. 1994. \Using Repeat Challengers to Estimate the E®ect of CampaignSpending on Election Outcomes in the U.S. House." Journal of Political Economy102:777-798.
Levitt, Steven D. 1996. \How Do Senators Vote? Disentangling the Role of Voter Pref-erences, Party A±liation, and Senator Ideology." American Economic Review 86:425-441.
Lott, John R., Jr. 2000. \A Simple Explanation for Why Campaign Expenditures areIncreasing: The Government is Getting Bigger." Journal of Law and Economics 43:359-xxx.
25
Marks, Stephen V. 1993. \Economic Interests and Voting on the Ominbus Trade Bill of1987." Public Choice 75: 21-42.
Mayer, Kenneth R. 1991. The Political Economy of Defense Contracting. New Haven, CT:Yale University Press.
McArthur, John, and Stephen V. Marks. 1988. \Constituent Interest vs. LegislatorIdeology: The Role of Political Opportunity Cost." Economic Inquiry 26: 461-470.
Milyo, Je®rey, David Primo, and Timothy Groseclose. 2000. \Corporate PAC CampaignContributions in Perspective." Business and Politics 2: 75-88.
Nollen, Stanley D., and Dennis P. Quinn. 1994. \Free Trade, Fair Trade, Strategic Trade,and Protectionism in the U.S. Congress, 1987-88." International Organization 48:491-525.
Neustadtl, Alan. 1990. \Interest-Group PACsmanship: An Analysis of Campaign Contri-butions, Issue Visibility, and Legislative Impact." Social Forces 69: 549-564.
Peltzman, Sam. 1984. \Constituent Interest and Congressional Voting." Journal of Lawand Economics 27: 181-210.
Poole, Keith T., and Howard Rosenthal. 1984. \The Polarization of American Politics."Journal of Politics 46: 1061-1079.
Poole, Keith T., and Howard Rosenthal. 1997. Congress: A Political-Economic History ofRoll Call Voting. Oxford: Oxford University Press.
Poole, Keith T., and Thomas Romer. 1985. \Patterns of Political Action CommitteeContributions to the 1980 Campaigns for the U.S. House of Representatives." PublicChoice 47:63-112.
Poole, Keith T., Thomas Romer, and Howard Rosenthal. 1987. \The Revealed Preferencesof Political Action Committees." American Economic Review 77:298-302.
Romer, Thomas, and James M. Snyder. 1994. \An Empirical Investigation of the Dynamicsof PAC Contributions." American Journal of Political Science 38: 745-769.
Rosenstone, Steven J., and John Mark Hansen. 1992. Mobilization, Participation, andDemocracy in America. New York: MacMillan Publishing Co.
Rothenberg, Lawrence S. 1992. Linking Citizens to Government: Interest Group Politicsat Common Cause. Cambridge: Cambridge University Press.
Sabato, Larry. 1984. PAC Power. New York: W.W. Norton.
Saltzman, Gregory M. 1987. \Congressional Voting on Labor Issues: The Role of PACs."Industrial and Labor Relations Review 40: 163-179.
Schroedel, Jean R. 1986. \Campaign Contributions and Legislative Outcomes." WesternPolitical Quarterly 39: 371-389.
26
Silberman, Jonathan I., and Garey Durden. 1976. \Determining Legislative Preferenceson the Minimum Wage: An Economic Approach." Journal of Political Economy 84:317-329.
Snyder, James M., Jr. 1990. \Campaign Contributions as Investments: The House ofRepresentatives, 1980-86." Journal of Political Economy 98: 1195-1227.
Snyder, James M., Jr. 1992. \Long-Term Investing in Politicians, or Give Early, GiveOften." Journal of Law and Economics 35: 15-44.
Snyder, James M., Jr. 1993. \The Market for Campaign Contributions: Evidence for theU.S. Senate, 1980-1986." Economics and Politics 5: 219-240.
Sorauf, Frank. 1988. Money in American Elections. Glenview, IL: Scott, Foresman andCompany.
Sorauf, Frank J. 1992. Inside Campaign Finance: Myths and Realities. New Haven, CT:Yale University Press.
Stevens, Allison. 2001. \Despite Terrorism, Candidates Make Slow Return to Fundraising."The Hill, October 24 (www.hillnews.com/102401).
Stratmann, Thomas. 1991. \What Do Campaign Contributions Buy? Deciphering CausalE®ects of Money and Votes." Southern Economic Journal 57: 606-620.
Stratmann, Thomas. 1995. \Campaign Contributions and Congressional Voting: Does theTiming of Contributions Matter?" Review of Economics and Statistics 77: 127-136.
Stratmann, Thomas. 2002. \Can Special Interests Buy Congressional Votes? Evidencefrom Financial Services Legislation." Journal of Law and Economics, forthcoming.
Tosini, Suzanne C., and Edward Tower. 1987. \The Textile Bill of 1985: Determinants ofCongressional Voting Patterns." Public Choice 54: 19-25.
Tullock, Gordon. 1972. \The Purchase of Politicians." Western Economic Journal 10:354-355.
Verba, Sidney, Kay Lehman Schlozman, and Henry E. Brady. 1995. Voice and Equality:Civic Voluntarism and American Politics. Cambridge, MA: Harvard University Press.
Vesenka, Mary H. 1989. \Economic Interests and Ideological Conviction: A Note on PACsand Agricultural Acts." Journal of Economic Behavior and Organization 12: 259-263.
Wayman, Frank W. 1985a. xx. [we cite this in table 2]
Wayman, Frank W. 1985b. \Arms Control and Strategic Arms Voting in the U.S. Senate:Patterns of Change, 1967-1983." Journal of Con°ict Resolution 29: 225-251.
Welch, William P. 1982. \Campaign Contributions and Legislative Voting: Milk Moneyand Dairy Price Supports." Western Political Quarterly 35: 478-495.
Wilhite Allen, and John Theilmann. 1987. \Labor PAC Contributions and Labor Legisla-tion: A Simultaneous Logit Approach." Public Choice 53: 267-76.
27
Wright, John R. 1985. \PACs , Contributions, and Rolls Calls: An Organizational Per-spective." American Political Science Review 79: 400-14.
Wright, John R. 1989. \PAC Contributions, Lobbying, and Representatives." Journal ofPolitics 51: 713-29.
Wright, John R. 1990. \Contributions, Lobbying, and Committee Voting in the U.S. Houseof Representatives." American Political Science Review 84: 417-38.
28
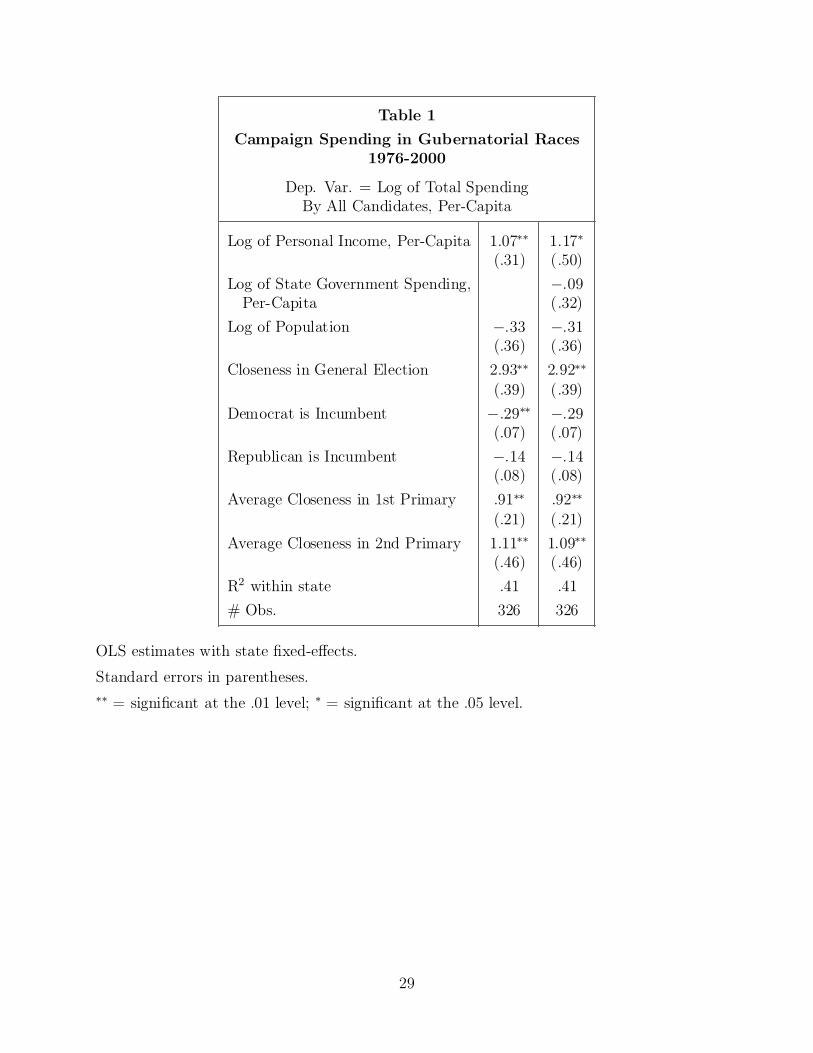
Table 1Campaign Spending in Gubernatorial Races
1976-2000
Dep. Var. = Log of Total SpendingBy All Candidates, Per-Capita
Log of Personal Income, Per-Capita 1:07¤¤ 1:17¤
(:31) (:50)Log of State Government Spending, ¡:09
Per-Capita (:32)Log of Population ¡:33 ¡:31
(:36) (:36)Closeness in General Election 2:93¤¤ 2:92¤¤
(:39) (:39)Democrat is Incumbent ¡:29¤¤ ¡:29
(:07) (:07)Republican is Incumbent ¡:14 ¡:14
(:08) (:08)Average Closeness in 1st Primary :91¤¤ :92¤¤
(:21) (:21)Average Closeness in 2nd Primary 1:11¤¤ 1:09¤¤
(:46) (:46)R2 within state :41 :41# Obs. 326 326
OLS estimates with state ¯xed-e®ects.
Standard errors in parentheses.¤¤ = signi¯cant at the .01 level; ¤ = signi¯cant at the .05 level.
29
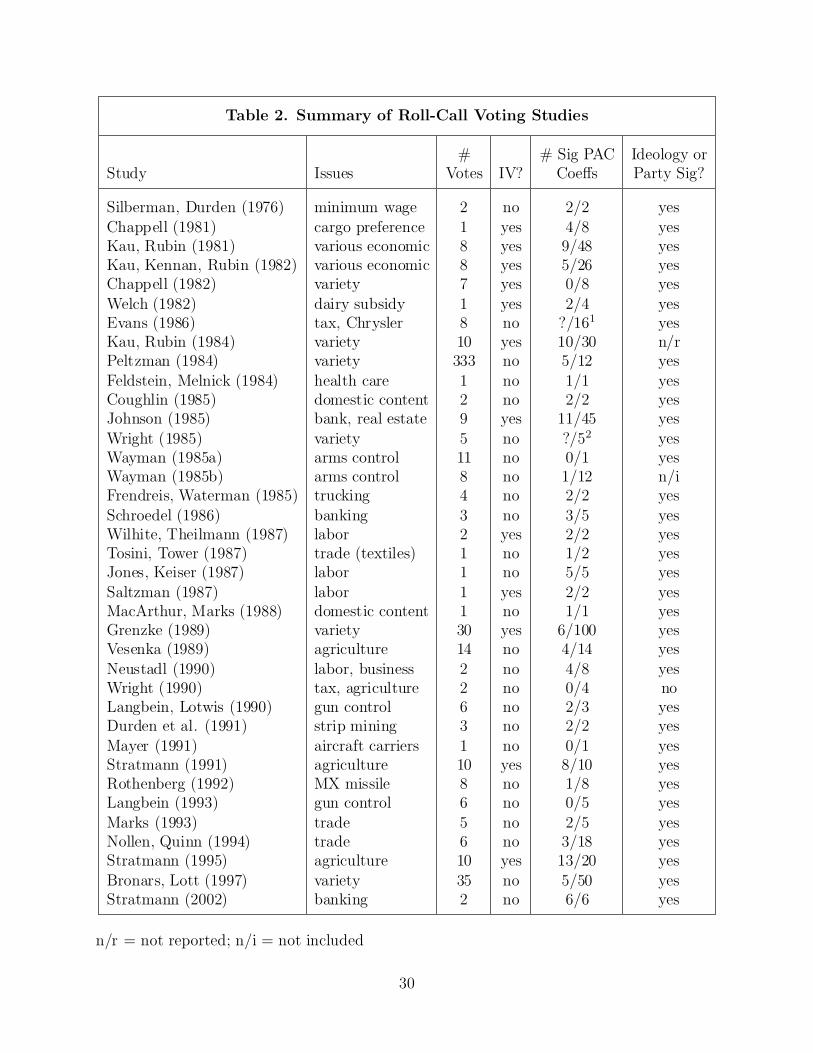
Table 2. Summary of Roll-Call Voting Studies
# # Sig PAC Ideology orStudy Issues Votes IV? Coe®s Party Sig?
Silberman, Durden (1976) minimum wage 2 no 2/2 yesChappell (1981) cargo preference 1 yes 4/8 yesKau, Rubin (1981) various economic 8 yes 9/48 yesKau, Kennan, Rubin (1982) various economic 8 yes 5/26 yesChappell (1982) variety 7 yes 0/8 yesWelch (1982) dairy subsidy 1 yes 2/4 yesEvans (1986) tax, Chrysler 8 no ?/161 yesKau, Rubin (1984) variety 10 yes 10/30 n/rPeltzman (1984) variety 333 no 5/12 yesFeldstein, Melnick (1984) health care 1 no 1/1 yesCoughlin (1985) domestic content 2 no 2/2 yesJohnson (1985) bank, real estate 9 yes 11/45 yesWright (1985) variety 5 no ?/52 yesWayman (1985a) arms control 11 no 0/1 yesWayman (1985b) arms control 8 no 1/12 n/iFrendreis, Waterman (1985) trucking 4 no 2/2 yesSchroedel (1986) banking 3 no 3/5 yesWilhite, Theilmann (1987) labor 2 yes 2/2 yesTosini, Tower (1987) trade (textiles) 1 no 1/2 yesJones, Keiser (1987) labor 1 no 5/5 yesSaltzman (1987) labor 1 yes 2/2 yesMacArthur, Marks (1988) domestic content 1 no 1/1 yesGrenzke (1989) variety 30 yes 6/100 yesVesenka (1989) agriculture 14 no 4/14 yesNeustadl (1990) labor, business 2 no 4/8 yesWright (1990) tax, agriculture 2 no 0/4 noLangbein, Lotwis (1990) gun control 6 no 2/3 yesDurden et al. (1991) strip mining 3 no 2/2 yesMayer (1991) aircraft carriers 1 no 0/1 yesStratmann (1991) agriculture 10 yes 8/10 yesRothenberg (1992) MX missile 8 no 1/8 yesLangbein (1993) gun control 6 no 0/5 yesMarks (1993) trade 5 no 2/5 yesNollen, Quinn (1994) trade 6 no 3/18 yesStratmann (1995) agriculture 10 yes 13/20 yesBronars, Lott (1997) variety 35 no 5/50 yesStratmann (2002) banking 2 no 6/6 yes
n/r = not reported; n/i = not included
30
# Sig PAC Coe®s column: The ¯rst number gives the number of coe±cients on PAC contri-bution variables that are statistically signi¯cant at the .05 level (two-tailed test) and havethe predicted sign. The second number gives the total number of PAC contribution variablesin the analysis.1 Reports that \PAC contributions were usually among the less important in°uences onHouse members' voting on the two bills" (p. 126).2 Reports that \In none of the ¯ve cases examined were campaign contributions an importantenough force to change the legislative outcomes from what they would have been withoutany contributions" (p. 411).
31
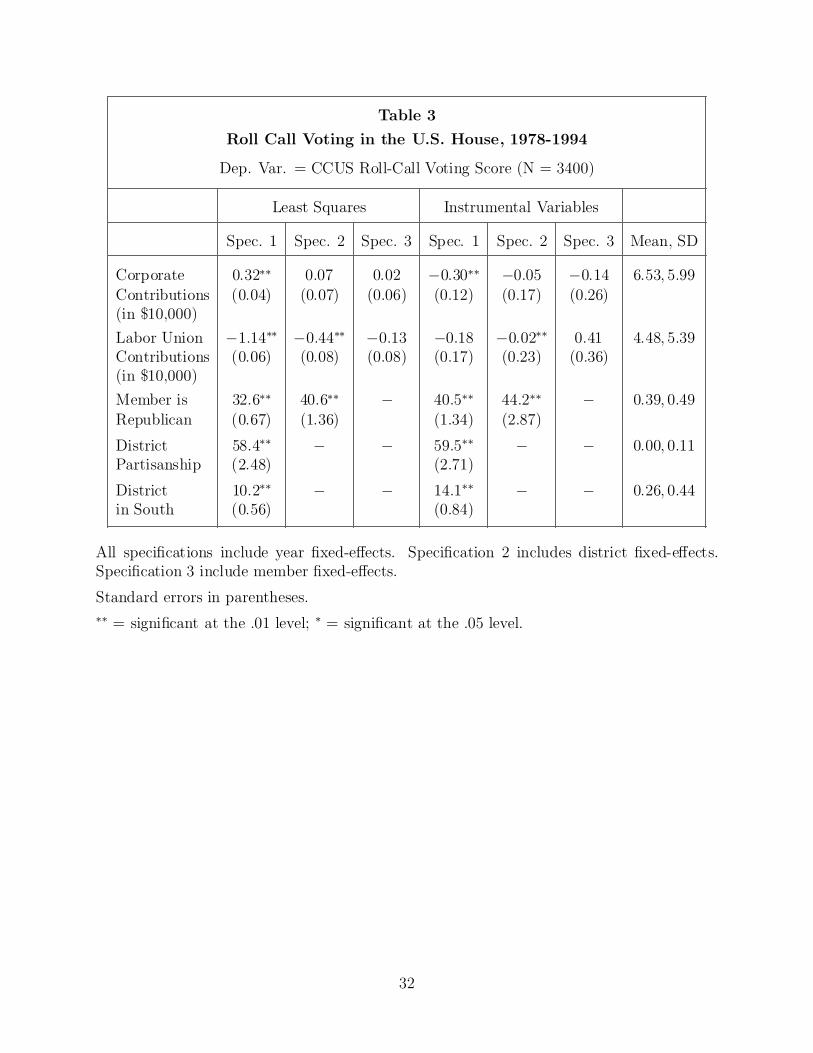
Table 3Roll Call Voting in the U.S. House, 1978-1994
Dep. Var. = CCUS Roll-Call Voting Score (N = 3400)
Least Squares Instrumental Variables
Spec. 1 Spec. 2 Spec. 3 Spec. 1 Spec. 2 Spec. 3 Mean, SD
Corporate 0:32¤¤ 0:07 0:02 ¡0:30¤¤ ¡0:05 ¡0:14 6:53; 5:99Contributions (0:04) (0:07) (0:06) (0:12) (0:17) (0:26)(in $10,000)Labor Union ¡1:14¤¤ ¡0:44¤¤ ¡0:13 ¡0:18 ¡0:02¤¤ 0:41 4:48; 5:39Contributions (0:06) (0:08) (0:08) (0:17) (0:23) (0:36)(in $10,000)Member is 32:6¤¤ 40:6¤¤ ¡ 40:5¤¤ 44:2¤¤ ¡ 0:39; 0:49Republican (0:67) (1:36) (1:34) (2:87)
District 58:4¤¤ ¡ ¡ 59:5¤¤ ¡ ¡ 0:00; 0:11Partisanship (2:48) (2:71)
District 10:2¤¤ ¡ ¡ 14:1¤¤ ¡ ¡ 0:26; 0:44in South (0:56) (0:84)
All speci¯cations include year ¯xed-e®ects. Speci¯cation 2 includes district ¯xed-e®ects.Speci¯cation 3 include member ¯xed-e®ects.
Standard errors in parentheses.¤¤ = signi¯cant at the .01 level; ¤ = signi¯cant at the .05 level.
32
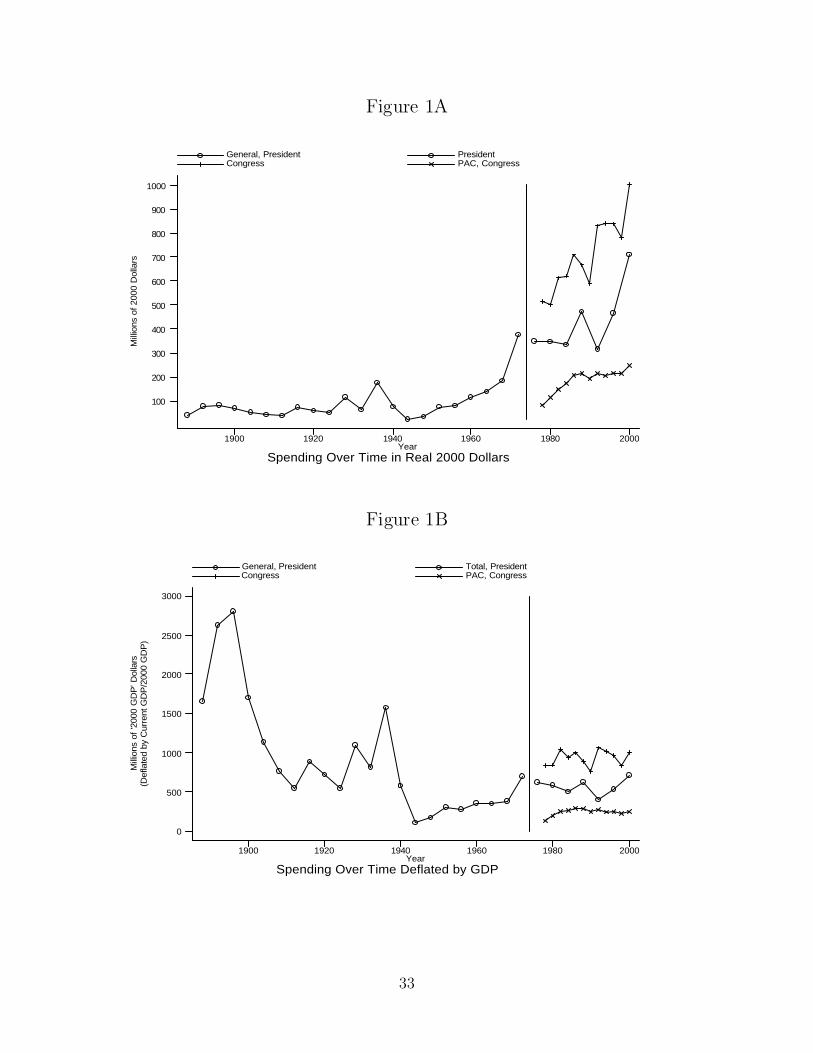
Figure 1AM
illio
ns o
f 200
0 D
olla
rs
Spending Over Time in Real 2000 DollarsYear
General, President President Congress PAC, Congress
1900 1920 1940 1960 1980 2000
100
200
300
400
500
600
700
800
900
1000
Figure 1B
Mill
ions
of
'200
0 G
DP
' Dol
lars
(Def
late
d by
Cur
rent
GD
P/2
000
GD
P)
Spending Over Time Deflated by GDPYear
General, President Total, President Congress PAC, Congress
1900 1920 1940 1960 1980 2000
0
500
1000
1500
2000
2500
3000
33