Embed Size (px)
Citation preview

Why is the oil & gas industry underrepresented in the CDM and Carbon Markets?
Session Two - Day Two of Global Gas Flaring Workshop 4th -6th October 2009 in Doha, Qatar
October 5, 2009
Carbon Limits AS
2
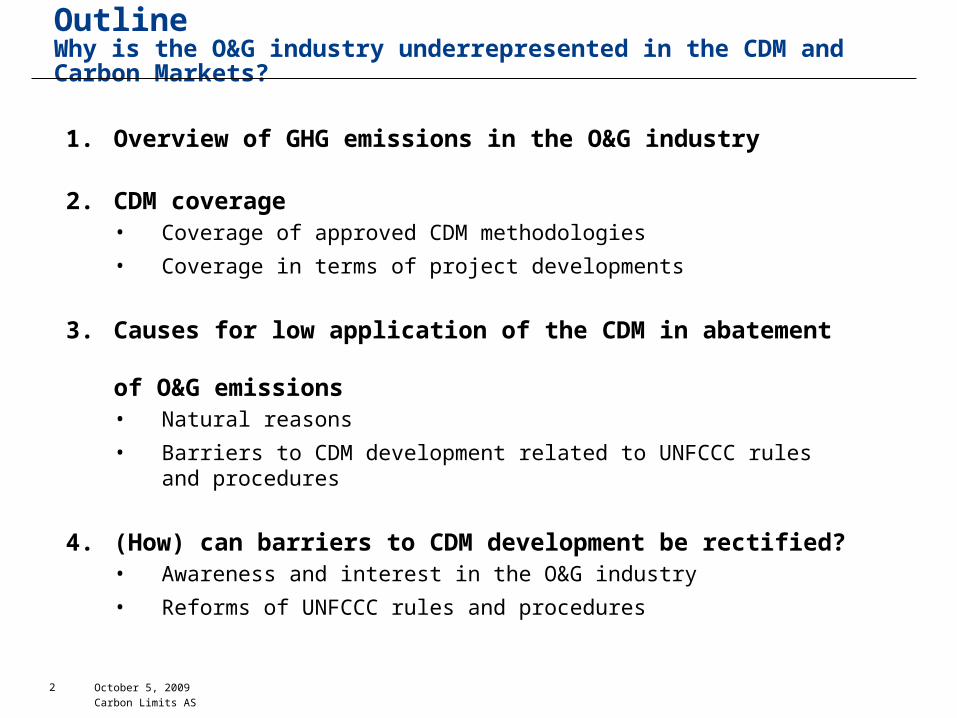
1. Overview of GHG emissions in the O&G industry
2. CDM coverage• Coverage of approved CDM methodologies• Coverage in terms of project developments
3. Causes for low application of the CDM in abatement of O&G emissions• Natural reasons• Barriers to CDM development related to UNFCCC rules and procedures
4. (How) can barriers to CDM development be rectified?• Awareness and interest in the O&G industry• Reforms of UNFCCC rules and procedures
OutlineWhy is the O&G industry underrepresented in the CDM and Carbon Markets?

October 5, 2009
Carbon Limits AS
3
1. Overview of O&G GHG emission sources
* Estimates calculated by Carbon Limits, based on data from DMSP/GGFR (2006), EPA (1992/1994/2004) , M2M (2008) and IEA (2008). Very low level of accuracy due to absence of aggregated, monitored operational data.
MMtCO2e
500
1,000
Venting (CH4) Fugitives (CH4) Flaring (CO2+CH4) Gas treatment (CO2) Useful energy (CO2)
Wasted energy
630570 ~550
~500
1,500+
~ 8% of global GHG emissions
October 5, 2009
Carbon Limits AS
4
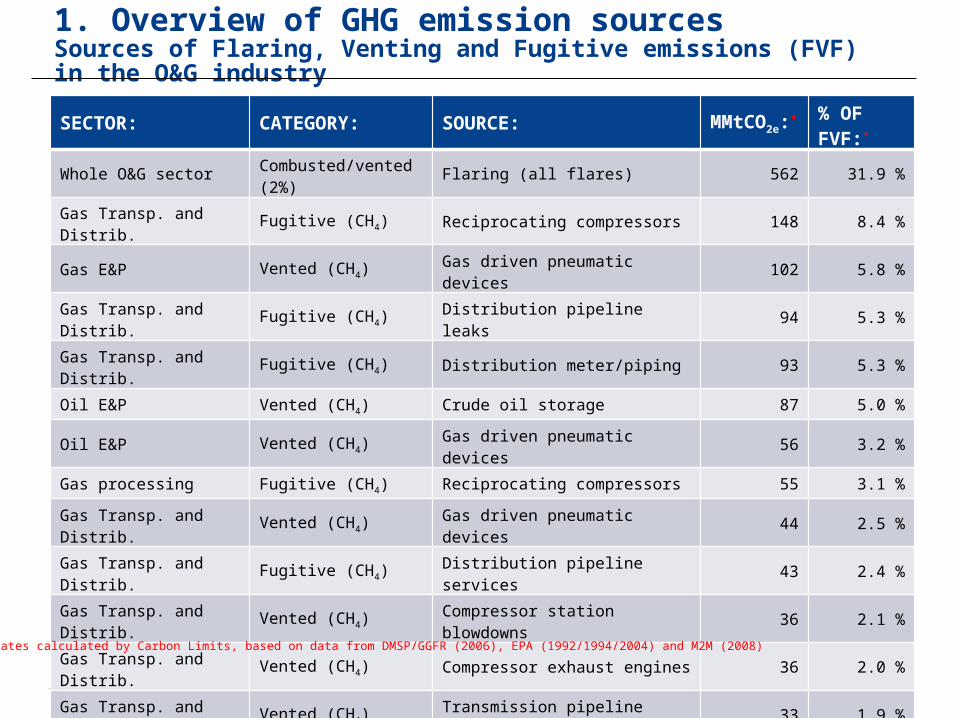
1. Overview of GHG emission sourcesSources of Flaring, Venting and Fugitive emissions (FVF) in the O&G industry
SECTOR: CATEGORY: SOURCE: MMtCO2e:* % OF FVF:*
Whole O&G sector Combusted/vented (2%) Flaring (all flares) 562 31.9 %
Gas Transp. and Distrib. Fugitive (CH4) Reciprocating compressors 148 8.4 %
Gas E&P Vented (CH4) Gas driven pneumatic devices 102 5.8 %
Gas Transp. and Distrib. Fugitive (CH4) Distribution pipeline leaks 94 5.3 %
Gas Transp. and Distrib. Fugitive (CH4) Distribution meter/piping 93 5.3 %
Oil E&P Vented (CH4) Crude oil storage 87 5.0 %
Oil E&P Vented (CH4) Gas driven pneumatic devices 56 3.2 %
Gas processing Fugitive (CH4) Reciprocating compressors 55 3.1 %
Gas Transp. and Distrib. Vented (CH4) Gas driven pneumatic devices 44 2.5 %
Gas Transp. and Distrib. Fugitive (CH4) Distribution pipeline services 43 2.4 %
Gas Transp. and Distrib. Vented (CH4) Compressor station blowdowns 36 2.1 %
Gas Transp. and Distrib. Vented (CH4) Compressor exhaust engines 36 2.0 %
Gas Transp. and Distrib. Vented (CH4) Transmission pipeline blowdowns 33 1.9 %
Gas Transp. and Distrib. Fugitive (CH4) Centrifugal compressors (wet seals) 28 1.6 %
Gas Transp. and Distrib. Fugitive (CH4) Compressor stations 28 1.6 %
Whole O&G sector Vented/fugitive (CH4) All other sources 317 18.0 %
Total All Flare/Venting All sources 1,762 100.0 %* Estimates calculated by Carbon Limits, based on data from DMSP/GGFR (2006), EPA (1992/1994/2004) and M2M (2008)
October 5, 2009
Carbon Limits AS
5
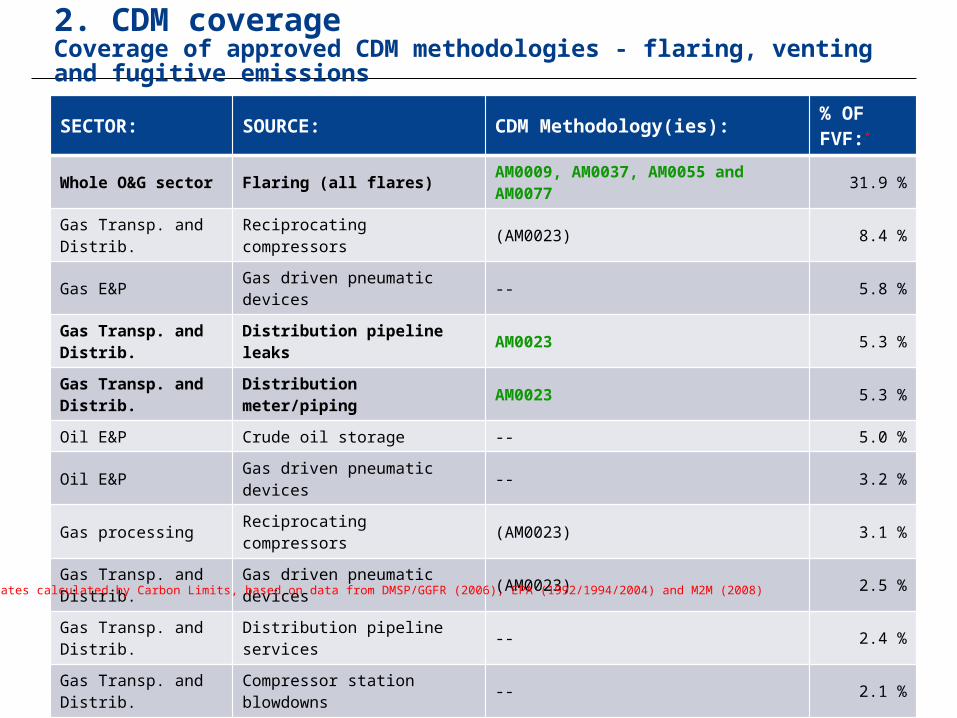
SECTOR: SOURCE: CDM Methodology(ies): % OF FVF:*
Whole O&G sector Flaring (all flares) AM0009, AM0037, AM0055 and AM0077 31.9 %
Gas Transp. and Distrib. Reciprocating compressors (AM0023) 8.4 %
Gas E&P Gas driven pneumatic devices -- 5.8 %
Gas Transp. and Distrib. Distribution pipeline leaks AM0023 5.3 %
Gas Transp. and Distrib. Distribution meter/piping AM0023 5.3 %
Oil E&P Crude oil storage -- 5.0 %
Oil E&P Gas driven pneumatic devices -- 3.2 %
Gas processing Reciprocating compressors (AM0023) 3.1 %
Gas Transp. and Distrib. Gas driven pneumatic devices (AM0023) 2.5 %
Gas Transp. and Distrib. Distribution pipeline services -- 2.4 %
Gas Transp. and Distrib. Compressor station blowdowns -- 2.1 %
Gas Transp. and Distrib. Compressor exhaust engines -- 2.0 %
Gas Transp. and Distrib. Transmission pipeline blowdowns -- 1.9 %
Gas Transp. and Distrib. Centrifugal compressors (wet seals) (AM0023) 1.6 %
Gas Transp. and Distrib. Compressor stations AM0023 1.6 %
* Estimates calculated by Carbon Limits, based on data from DMSP/GGFR (2006), EPA (1992/1994/2004) and M2M (2008)
2. CDM coverageCoverage of approved CDM methodologies - flaring, venting and fugitive emissions
October 5, 2009
Carbon Limits AS
6
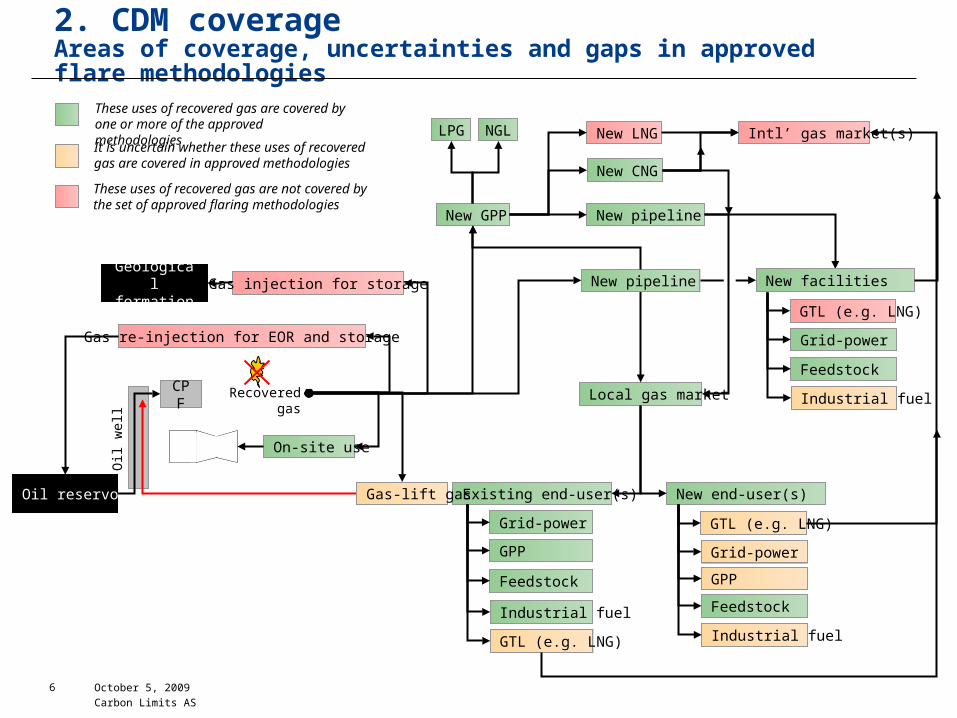
2. CDM coverageAreas of coverage, uncertainties and gaps in approved flare methodologies
Oil reservoir
Oil
wel
l
New GPP
Gas re-injection for EOR and storage
On-site use
Local gas market
New end-user(s)Existing end-user(s)
LPG NGL
New pipeline
New LNG
New CNG
Intl’ gas market(s)
Grid-power
Feedstock
Industrial fuel
Grid-power
Feedstock
Industrial fuel
GPP
Geological formation
GPP
Gas injection for storage
GTL (e.g. LNG)
GTL (e.g. LNG)
Gas-lift gas
CPF Recovered gas
New pipeline New facilities
Grid-power
Feedstock
Industrial fuel
GTL (e.g. LNG)
These uses of recovered gas are covered by one or more of the approved methodologies
It is uncertain whether these uses of recovered gas are covered in approved methodologies
These uses of recovered gas are not covered by the set of approved flaring methodologies

October 5, 2009
Carbon Limits AS
7
• A few emission sources are covered by one or more approved CDM methodologies (e.g. flaring and fugitive emission in gas infrastructure)
• Each approved CDM methodology has limited coverage of alternative abatement technologies/options (e.g. flare reduction methodologies)
• Significant emission sources within the O&G sector are not covered by any approved CDM methodology (e.g. vented sources)
2. CDM coverageCoverage of approved CDM methodologies – flaring, venting and fugitive emissions
The coverage of GHG abatement opportunities in the O&G sector is insufficient in approved CDM methodologies

October 5, 2009
Carbon Limits AS
8
2. CDM coverageCoverage in terms of project developments
Status: Number: ERs/yr: CERs issued: Comments:
AM0009: Recovery and utilization of gas from oil wells that would otherwise be flared or vented
Registered 6 6,559,543 22 % of est. 4.5 mill CERs issued for 2001 -2005 vintages
Rejected/terminated 10 1,039,451 -- Additionality and lack of ”methodology fit ”
At validation 6 2,055,347 -- One old, five recent/new
AM0037: Recovery and utilization of gas for production of a chemical product
Registered 2 105,127 -- Registered under old AM0037v1
Rejected/terminated 4 2,534,810 -- Lack of ”methodology fit”, victime of meth. revison
At validation 0 -- --
Other flare gas projects at validation (refineries and CNG)
AM0055 3 -- --
AM0077 1 -- --
AM0023: Leak reduction from natural gas pipeline compressor or gate stations
Registered 0 -- --
Rejected/terminated 0 -- --
At validation 3 1,229,401 -- Gas trans. & distrib. and dry seals for compressors
October 5, 2009
Carbon Limits AS
9
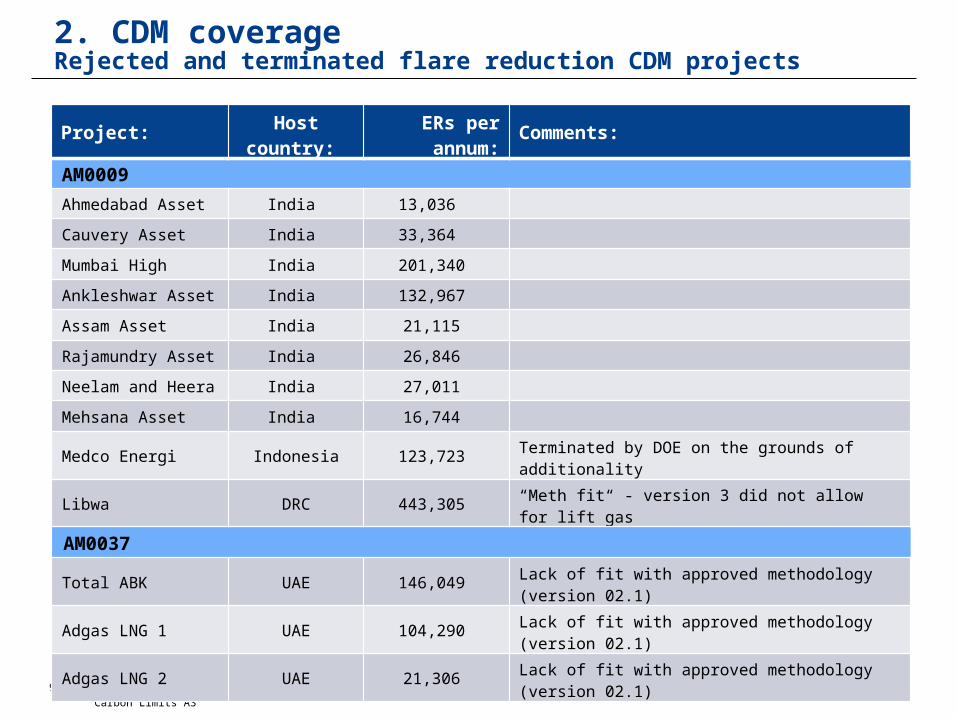
2. CDM coverageRejected and terminated flare reduction CDM projects
Project: Host country: ERs per annum: Comments:
AM0009
Ahmedabad Asset India 13,036
Cauvery Asset India 33,364
Mumbai High India 201,340
Ankleshwar Asset India 132,967
Assam Asset India 21,115
Rajamundry Asset India 26,846
Neelam and Heera India 27,011
Mehsana Asset India 16,744
Medco Energi Indonesia 123,723 Terminated by DOE on the grounds of additionality
Libwa DRC 443,305 “Meth fit“ - version 3 did not allow for lift gas
AM0037
Total ABK UAE 146,049 Lack of fit with approved methodology (version 02.1)
Adgas LNG 1 UAE 104,290 Lack of fit with approved methodology (version 02.1)
Adgas LNG 2 UAE 21,306 Lack of fit with approved methodology (version 02.1)

October 5, 2009
Carbon Limits AS
10
• Limited number of CDM projects under development/implementation in the O&G sector compared both to the level of emissions in the sector and the abatement efforts undertaken by O&G companies
• There is a problematic track record with respect to:
• CDM validation and registration – fit with methodologies and additionality• Monitoring, verification and issuance – very low issuance rate so far
• Apparent lack of awareness and interest in the O&G sector – few active players
2. CDM coverageCoverage in terms of project developments
The CDM has not been instrumental in leading to real, measurable and verifiable ERs in the O&G sector to date
October 5, 2009
Carbon Limits AS
11
• Project opportunities at brownfield sites are typically not studied in detail (as required for PDD development) until market conditions are perceived as favorable or environmental regulations get tougher
• Projects, especially flare reduction projects, are complex and have long lead times. CDM development must be integral to project planning and execution, and timely action and dedicated resources are required over a long time period
• The perceived value of the CDM is limited due to low historical success rate, a politically unstable market, significant transaction costs (especially if methodology development is required) and changing and unpredictable rules and procedures
• Many flare reduction projects are capital intensive, and CDM revenues does not provide a reliable source of income until after CDM registration is secured
3. Causes for low application of the CDMNatural reasons
October 5, 2009
Carbon Limits AS
12
• Project activities must be developed with reference to an approved CDM methodology to qualify under the CDM:
• There is limited coverage of realistic abatement opportunities in the O&G sector• Attempts to expand the applicability of approved CDM methodologies related to the
O&G sector have been limited and relatively unsuccessful to date• CDM methodologies are public goods and expensive, complex and time consuming to
develop for individual project opportunities
• Project designs and financial assessments must be close to final prior to initiating PDD development, validation and registration
• Rules and procedures are constantly changing, requiring up-to-date knowledge and timely action to secure CDM registration
• The CDM fails to provide timely and reliable input to investors due to long lead times for CDM registration (minimum one year after start of validation)
3. Causes for low application of the CDMBarriers to CDM development related to UNFCCC rules and procedures

October 5, 2009
Carbon Limits AS
13
• The CDM holds the potential to make many investments, that would otherwise not be considered viable, financially attractive to O&G companies
• Identification of CDM project opportunities must be done as an integral part of normal project evaluation and should focus on investment opportunities that fit approved methodologies and have a strong additionality for reasonable near to mid-term changes in framework conditions
• Internal resources should be allocated to clarify project concepts and develop financial assessments to the level of detail required for CDM registration at an early stage of project development
• An application for CDM registration should be submitted prior to making an investment decision, requiring willingness to undertake limited up-front investments in PDD development and validation
4. (How) can barriers to CDM development be rectified?Integrating CDM development with normal project evaluation and execution

October 5, 2009
Carbon Limits AS
14
• Project developers should actively follow developments in CDM rules and procedures and participate in discussions that shape the perception and coverage of O&G projects in the CDM
• Development of new or revised CDM methodologies should be initiated or supported to help qualify project types with significant emission reduction potential and low abatement costs under the CDM
4. (How) can barriers to CDM development be rectified?Reforms of UNFCCC rules and procedures