Embed Size (px)
Citation preview
Why Has IPO Underpricing Increased Over Time?
Tim Loughran University of Notre Dame
P.O. Box 399 Notre Dame IN 46556-0399
219.631.8432 voice [email protected]
and
Jay R. Ritter
University of Florida P.O. Box 117168
Gainesville FL 32611-7168 352.846.2837 voice
[email protected] http://bear.cba.ufl.edu/ritter
March 18, 2002 We wish to thank Hsuan-Chi Chen, Craig Dunbar, Todd Houge, Josh Lerner, Alexander Ljungqvist, Donghang Zhang, two anonymous referees, and seminar participants at Boston College, Southern Methodist University, Texas Christian University, and the Universities of Colorado, Houston, Illinois, Indiana, Iowa, Notre Dame, and Pennsylvania for useful comments. Chris Barry, Laura Field, Paul Gompers, Josh Lerner, Scott Smart, Li-Anne Woo, and Chad Zutter generously provided IPO data. Bruce Foerster assisted us in ranking underwriters. Underwriter ranks are available online at http://bear.cba.ufl.edu/ritter/rank.htm. Donghang Zhang supplied useful research assistance.
1
Why Has IPO Underpricing Increased Over Time?
Abstract
In the 1980s, the average first-day return on initial public offerings (IPOs) was 7%. The average first-day return doubled to almost 15% during 1990-1998, before jumping to 65% during the internet bubble years of 1999-2000. Part of the increase can be attributed to changes in the composition of the companies going public. We attribute much of the increase in underpricing, however, to previously latent agency problems between underwriters and issuing firms. We argue that the increase in valuations over time has caused issuers to be more complacent about leaving money on the table. Keywords: Initial public offerings; agency problems; internet bubble; underwriter reputation
2
1. Introduction
What explains the severe underpricing of initial public offerings in 1999-2000, where the
average first-day return of 65% is an order of magnitude higher than anything previously seen?
In this paper, we address this and the related question of why IPO underpricing doubled from 7%
during 1980-1989 to almost 15% during 1990-1998, before exploding during the internet bubble
period. Part of the increased underpricing can be attributed to changes in the composition of
firms going public. We argue that the other part of the rise can be explained by increased
valuations associated with the bull market of the 1980s and 1990s, and the effect that this had on
the willingness of issuing firms to bargain for a higher offer price. Alternatively stated, agency
problems between issuing firms and underwriters that were largely latent in the 1980s increased
in importance in the 1990s, before becoming of paramount importance during the internet bubble
period. We refer to these two hypotheses as the changing composition hypothesis and the
agency hypothesis.
The changing composition hypothesis is based on the assumption that riskier IPOs will be
underpriced by more than less-risky IPOs. If the proportion of IPOs that represent risky stocks
increases, the average underpricing should increase (Ritter (1984a)). (Throughout this paper, we
use “first-day returns” and “underpricing” as synonyms.) We document that the proportion of
IPOs representing technology firms has increased over time. Surprisingly, there is no evidence
that the companies going public in 1980-1989 (“the 1980s”) were older than those going public
in 1990-1998 (“the 1990s”). The median age of an issuing firm was 7 years old in the 1980s and
8 years old in the 1990s, before falling to 5 years old during 1999-2000 (“the internet bubble”).
A similar pattern holds for sales: prior to the internet bubble, there was no secular trend in the
median sales of firms going public.
Unlike the 1980s, IPOs managed by high-prestige underwriters during the 1990s and the
internet bubble are associated with more underpricing than IPOs managed by lower prestige
underwriters. Our agency hypothesis offers an explanation for this reversal. We argue that IPO
underwriting became more lucrative due to the increased willingness of firms to leave money on
the table, where money on the table is defined as the first-day price change (offer price to close)
times the number of shares issued. Underwriters benefit from the money left on the table
3
through the rent-seeking activity of buy-side investors. Investors are willing to offer quid pro
quos to underwriters in return for receiving IPO allocations. Prestigious underwriters have
responded to this change in the economics of IPO underwriting by lowering their standards. At
the same time, issuing firms have been increasingly willing to accept greater underpricing from
prestigious underwriters because of increases in the perceived importance of analyst coverage
and higher wealth levels.
Alternatively stated, a necessary but not sufficient condition for severe underpricing is
that underwriters want to underprice IPOs, in spite of the gross spread revenue that they forego.
A second necessary but not sufficient condition for severe underpricing is that issuing firms do
not aggressively bargain for a higher offer price when good news arrives that demand for the
offering is unexpectedly strong. During the internet bubble period, both of these necessary
conditions were satisfied for an unusually large fraction of the firms going public, resulting in
high average underpricing. An unusually large number of IPOs had unexpectedly strong demand
because of the rapid escalation of valuations during the internet bubble, with the Nasdaq
Composite index increasing by 256% in just 17 months, from a low of 1,419 in October 1998 to
5,048 in March 2000.
A closely related working paper by Ljungqvist and Wilhelm (2002) also addresses the
increase in underpricing, albeit for the shorter time period of 1996-2000. Ljungqvist and
Wilhelm document that during this time period, the fraction of IPOs with directed share
programs (“friends and family shares”) increased dramatically. Furthermore, the percentage of
shares owned by managers and directors fell, as did the fraction of shares owned by venture
capitalists in VC-backed IPOs. They argue that these changes gave managers less incentive to
avoid severe underpricing. They seem to argue that severe underpricing results from a
combination of intentional underpricing by issuing firms, who are hypothesized to view it as a
way of attracting attention, and necessary underpricing in order to extract information from
potential investors about demand for the IPO.
The rest of this paper is as follows. In Section 2, we present our agency hypothesis. In
Section 3, we describe our data. In Section 4, we report year-by-year mean and median first-day
returns and valuations. In Section 5, we report average first-day returns for various univariate
sorts. In all of our analysis, we report results separately for the 1980-1989, 1990-1998, and
1999-2000 subperiods. In Section 6, we report the results of multiple regressions with first-day
4
returns as the dependent variable. Section 7 discusses alternative explanations for the high
underpricing of IPOs during the internet bubble period. Section 8 presents our conclusions. The
four appendices provide detailed descriptions of our data on founding dates, post-issue shares
outstanding, underwriter rankings, and internet IPO identification.
2. The agency hypothesis
Most models of IPO underpricing are based on asymmetric information. Two agency
models of underpricing exist in the IPO literature. Baron (1982) presents a model of
underpricing where issuers delegate the pricing decision to underwriters. Underwriters find it
less costly to market an IPO that is underpriced. Loughran and Ritter (2002) instead emphasize
the quid pro quos that underwriters receive from buy-side clients in return for allocating
underpriced IPOs to them. The managers of issuing firms do not strongly object to this
underpricing if they are simultaneously receiving good news about their personal wealth
increasing. In this paper, we argue that the frequency with which these situations occur has
increased over time, resulting in higher underpricing. Specifically, as valuations increased
during the bull market of 1982-1999, issuers became more complacent about leaving money on
the table. The frequency of upward revisions in the offer price relative to the original file price
range increased, and the average first-day return, conditional on this occurring, increased
dramatically.
Underwriters, as intermediaries, need to balance the interests of the sell side (issuers) and
the buy side (investors). Investment bankers advise the issuer on pricing the issue, both at the
time of issuing a preliminary prospectus that includes a file price range, and at the pricing
meeting where the final offer price is set. If underwriters receive compensation from both the
issuer (the gross spread, or underwriting discount, typically 7% of the proceeds for moderate-size
IPOs) and investors (through quid pro quos in return for leaving money on the table), the
underwriter has an incentive to recommend a lower offer price than if the compensation was
merely the gross spread. This is true provided that the underwriter is able to capture at least 7%
of the money left on the table, since lowering the offer price decreases the spread revenue in a
proportional manner.
With bookbuilding, the mechanism used for pricing and allocating IPOs in over 99.9% of
our sample, underwriters have complete discretion to allocate shares. (Auctions were used in
5
0.1% of the IPOs.) This discretion, as emphasized by Benveniste and Wilhelm (1997) and
Sherman (2000), can be to the benefit of issuing firms. Underwriters can reduce the average
amount of underpricing, therefore increasing the expected proceeds of issuing firms, by favoring
regular investors who provide information about their demand that is useful in pricing an IPO.
Shares can be allocated to those who are likely to be buy-and-hold investors, minimizing any
costs associated with price stabilization activities. Furthermore, underwriter discretion can
completely eliminate the winner’s curse problem if underwriters allocate shares in hot issues
only to those investors who are willing to buy other IPOs. As Ritter and Welch (2002) argue, if
underwriters used their discretion to bundle IPOs, problems caused by asymmetric information
could be nearly eliminated. The resulting average level of underpricing that would be observed
if hot issues were allocated only to those investors who also purchased cold issues would be no
more than several percent. Thus, given the use of bookbuilding, the joint hypothesis that issuers
desire to maximize their proceeds and that underwriters act in the best interests of issuers can be
rejected whenever average underpricing exceeds several percent. Furthermore, lawsuit
avoidance concerns do not change this conclusion. Underpricing is a very cost-ineffective way
of reducing the costs of lawsuits.
This discretion can be desirable for issuing firms, but it can also be disadvantageous if
agency problems are not controlled. This is analogous to giving stock options to executives. In
principle, this can be good for shareholders in that stock options align the interests of managers
and equityholders. But it can be bad for shareholders if excessive dilution results. There is an
opportunity for self-dealing if managers influence the compensation committee of the board of
directors. Benveniste and Wilhelm (1997) and Sherman (2000) emphasize the bright side of
discretion, but do not mention the dark side.
Securities and Exchange Commission (SEC) regulations require that the prospectus
disclose underwriter compensation. As of 2001, reported underwriter compensation has been
restricted to the direct compensation of the gross spread plus any nonaccountable expense
allowance that is sometimes present for smaller IPOs. Underwriters readily acknowledge that in
recent years IPOs were being allocated to investors partly on the basis of past and future
commission business on other trades. The willingness of buy-side clients to generate
commissions and send trades to integrated securities firms depends upon the amount of money
left on the table in IPOs.
6
As an example, Credit Suisse First Boston (CSFB) is alleged to have received
commission business equal to one-third to one-half the profits that some investors received from
certain hot IPOs, such as the December 1999 IPO of VA Linux.1 The VA Linux IPO involved
5.06 million shares, including the overallotment option, at $30 per share, with a 7% gross spread
equal to $2.10 per share. For an investor who was allocated shares at $30, and who then sold at
the closing market price of $239.25, the capital gains would have amounted to $209.25 per share.
If the investor then traded shares to generate commissions of one-half of this profit, the total
underwriter compensation per share was $2.10 plus $104.625, or $106.725. Note that this is not
all profit for CSFB, since there are costs involved in both doing the IPO and trading shares.
Underwriters benefit from the quid pro quos received from buy-side clients. This creates
an incentive to underprice IPOs. But the incentive to underprice presumably would have been as
great in the 1980s as during the internet bubble period, unless there was a “supply” shift in the
willingness of firms to hire underwriters with a history of underpricing. We argue that such a
shift did indeed occur, resulting in increased underpricing.
3. Data
Our primary datasource for IPOs from 1980-2000 is the Thomson Financial Securities
Data new issues database. We have made hundreds of corrections to their data, and missing
information for thousands of observations has been collected from a number of sources,
including direct inspection of the prospectuses, Howard and Co.’s Going Public: The IPO
Reporter for IPOs from 1980-1985, Dealogic (also known as CommScan) for IPOs after 1990,
and the SEC’s Electronic Data Gathering and Retrieval (EDGAR) system for IPOs after 1996.
Final prospectuses are identified on EDGAR as document 424B at http://www.sec.gov. For
trading volume on the day of issue, we use information from the University of Chicago’s Center
for Research in Securities Prices (CRSP).
In all of our analysis, we exclude best efforts offers (typically very small offerings, these
are not covered by Thomson Financial Securities Data), ADRs (American Depositary Receipts,
issued by foreign firms that list in at least one other market outside of the U.S.), closed-end
1 See Susan Pulliam and Randall Smith “Linux Deal is Focus of IPO-Commission Probe” December 12, 2000 Wall Street Journal, p. C1, and Susan Pulliam and Randall Smith “CSFB Official Set Quota for Repayment of IPO Profits in Form of Commissions” August 10, 2001 Wall Street Journal, p. C1.
7
funds, REITs (real estate investment trusts), banks and savings and loans (S&Ls), partnerships,
and firms not covered by CRSP within six months of the offering.2 CRSP covers stocks listed on
the American Stock Exchange, New York Stock Exchange, and Nasdaq, although foreign firms
on Nasdaq are not covered. We also exclude IPOs with an offer price below $5.00 per share.
What remains are almost all IPOs of domestic operating companies that are large enough to be of
interest to institutional investors. The sample size is 6,169 firms, although in some of our tables
we are missing up to 3% of the sample due to incomplete information.
Our main source of information on venture capital backing is from Thomson Financial.
Supplemental data on venture capital backing has been provided by Chris Barry, Paul Gompers,
and Josh Lerner.
Information on the founding date of companies has come from a variety of sources,
discussed in more detail in Appendix 1. Laura Field and Li-Anne Woo provided many of the
founding dates. We are missing a reliable founding date for 177 firms (this will drop to 114 after
incorporating data supplied by Alexander Ljungqvist).
The original file price ranges for IPOs from 1980-1982 have been transcribed from
Howard and Co.’s Going Public: The IPO Reporter. File price ranges for IPOs from 1983-1987
have been supplied by Kathleen Weiss Hanley, who downloaded them from the IDD new issues
database in late 1987 when she worked at the Securities and Exchange Commission. The IDD
database was subsequently acquired by Securities Data Co., which was then acquired by
Thomson Financial. We are missing the file price range for 11 firms in the early 1980s.
To calculate the market value of the IPO, we use the offer price multiplied by the post-
issue number of shares outstanding. For firms with a single class of shares outstanding, our
primary source of data on the post-issue number of shares is CRSP. For firms with more than
one class of shares outstanding (dual-class firms), we use data from a variety of sources, as
described in Appendix 2.
Information on sales and earnings per share (EPS) in the year prior to going public comes
mainly from Thomson Financial Securities Data. When available, we use the sales and earnings
per share for the most recent twelve months (commonly known as LTM for last twelve months)
2 Banks, S&Ls, and their holding companies are excluded for several reasons. First, their offer prices are regulated. Second, many of these are conversions from mutuals to stock ownership of institutions that were reorganized in the 1930s, and they would dominate the patterns associated with age. Third, for these conversions, depositors and other affiliated parties are given preference in the share allocations.
8
prior to going public. When unavailable, we use the most recent fiscal year numbers. Additional
sources of information include Dealogic for post-1991 IPOs, Howard and Co.’s Going Public:
The IPO Reporter for 1980-1995 IPOs, and EDGAR. If a firm has zero trailing sales, we assign
a sales value of $0.01 million, since in our empirical work we use logarithms, and the logarithm
of zero is undefined. If we are unsure whether the sales are zero or are missing, we treat it as
missing. We are missing the sales number for 83 firms.
For underwriter prestige rankings, we have started with the Carter and Manaster (1990)
and Carter, Dark, and Singh (1998) rankings. We have created rankings for 1992-2000 in the
spirit of their methodology. Appendix 3 contains a detailed description of the procedures. The
underwriter prestige rankings are on a 0 to 9 scale, and are based upon the pecking order that is
present in “tombstone” advertisements.
Appendix 4 provides a brief description of how we identify internet IPOs. Appendix 4
also lists the SIC codes that we use to categorize IPOs by whether they are a technology (tech)
firm or not.
Ljungqvist and Wilhelm (2002), in their analysis of IPOs from 1996-2000, also report
substantial error rates in SDC’s data on post-issue shares outstanding, EPS, venture-capital
backing, founding dates, etc. They rely on EDGAR to correct SDC’s data on these and other
variables.
4. The Time-series of First-day Returns and Valuations
Figure 1 plots the annual volume and average first-day return on IPOs from 1980-2000.
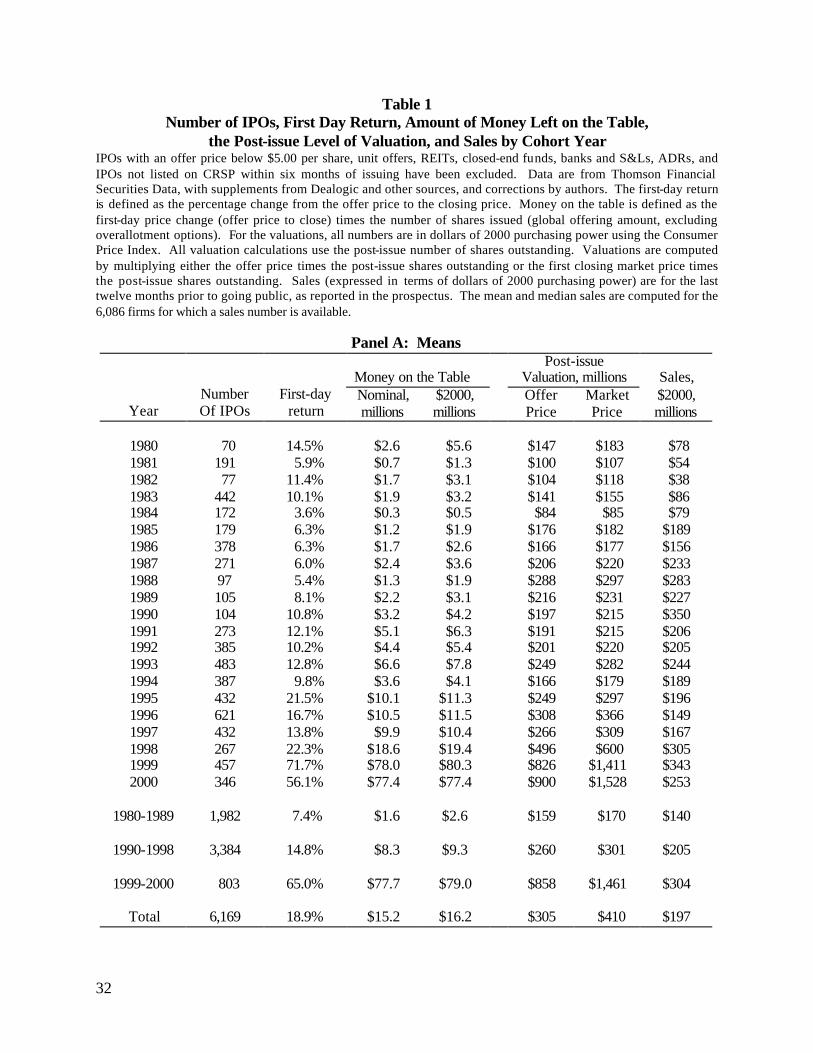
Table 1 reports the means (Panel A) and medians (Panel B) of the first-day returns on IPOs, by
year of issue. Also reported are the means and medians for three subperiods. In all of our
analysis, we split the sample into three subperiods: January 1980-December 1989 (“the 1980s”),
January 1990-December 1998 (“the 1990s”), and January 1999-December 2000 (“the internet
bubble”).
In the 1980s, the average first-day return was slightly over 7%. In the 1990s, the average
first-day return increased to almost 15%, and then jumped to 65% in the internet bubble period.
Although not reported in the table, the number of IPOs that doubled in price on the first day of
trading increased from nine in the 1980s to 40 in the 1990s and 182 in the internet bubble period.
9
Table 1 also reports the amount of money left on the table, the valuation of the IPO
computed using the post-issue number of shares outstanding multiplied by, respectively, the offer
price and the first closing market price, and the sales in the year prior to issuing. The amount of
money left on the table represents the profits made by investors on the first day of trading. The
amount of money left on the table, the valuations, and the sales numbers have all been converted
to dollars of 2000 purchasing power using the Consumer Price Index.
Inspection of Table 1 shows that from 1980 through 1994, the underpricing of IPOs was
typically quite modest, as was the amount of money left on the table. Every year from 1995-
1998, the average first-day return was higher than in any year between 1981 and 1994.
Underpricing took a discrete jump in 1999-2000, as did the amount of money left on the table.
Focusing on Panel B, one observes that for IPOs in the 1980s, the median valuation of
$68 million using the offer price was less than twice the annual sales of $36 million. In the
1990s, this market-to-sales ratio increased to 2.6 (the median valuation of $113 million relative
to median sales of $43 million). During the internet bubble period, the median valuation using
the offer price jumped to $361 million while the median sales fell to $14 million, giving a
market-to-sales ratio of 26. Using the valuation implied by the first closing market price, the
market-to-sales ratio is even higher, at 38.
In Table 1, years with high first-day returns also have valuations that are high relative to
sales. This pattern is not just coincidental. Our agency hypothesis predicts that when valuations
are high, more money will be left on the table. This occurs for two reasons. First, when an
entrepreneur’s level of wealth is high, the issuing firm does not bargain as hard for a high offer
price. Second, when wealth unexpectedly increases in a short period of time, the issuing firm
bargains even less effectively.
5. Univariate Sorts
Can the changing composition of IPOs explain the increase in underpricing over time?
Some of the characteristics of IPOs have changed over time. In Table 2, we report the mean
first-day returns on IPOs after several simple sorts: small vs. large, young vs. old, low sales vs.
high sales, tech vs. nontech, venture capital (VC) backed vs. nonVC backed, low and high share
overhang, and non-prestigious underwriter vs. prestigious underwriter. Overhang is defined as
the shares retained by pre-issue shareholders divided by the shares issued. We report the average
10
underpricing for three subperiods: the 1980s, the 1990s, and the internet bubble. The table
shows that some of the cross-sectional patterns that existed in the 1980s have been reversed in
the 1990s. In the 1990s, larger offers have been underpriced more than smaller IPOs, and IPOs
with a prestigious lead underwriter have been underpriced more than those without prestigious
underwriters.3 Several other patterns have increased in magnitude. Going across each row in
Table 2, underpricing has increased over time.
In Table 2, during the 1980s, tech stock IPOs had an average first-day return of 10.4%.
This is the highest average first-day return of any category during the 1980s except for the set of
IPOs whose offer price was revised upwards from the file price maximum. If the changing
composition of IPOs explained all of the changes in underpricing across time, it would be hard to
imagine that the average first-day return in the 1990s would have increased to much more than
10.4% if the first-day returns were drawn from a stationary distribution. But the average first-
day return on IPOs in the 1990s was 14.8%, and the average during the internet bubble period
was 65.0%. Thus, Table 2 suggests that very little of the increase in underpricing over time can
be attributed to a change in the composition of the types of firms going public. We now look at
the patterns in more detail.
Sales
In Table 3, we categorize issuing firms on the basis of their sales in the 12 months prior
to issuing. Inspection of Table 3 shows that, holding sales constant, underpricing roughly
doubled from the 1980s to the 1990s, and then exploded during the internet bubble period.
Within each subperiod, there is less underpricing the larger the sales are, although firms in the
lowest sales category sometimes have slightly lower average first-day returns than those with
sales of just above $10 million. Figure 2 plots the numbers reported in Table 3.
Technology Stocks
In Table 4, we report the mean first-day returns on IPOs for our three subperiods after
categorizing firms on the basis of industry. We use a very broad industry classification:
technology and internet-related stocks versus all others. In Appendix 4 we list the detailed
criteria for how firms are classified into these two categories. Needless to say, there is some
3 The difference in underpricing of 7.4% for small firms and 7.3% for large firms in the 1980s is smaller than found in other studies because we have screened out IPOs with an offer price below $5.00 per share. These low price IPOs had an average first-day return of 20.5%, and their inclusion would boost the average return on small IPOs during the 1980s to 8.8%.
11
arbitrariness in allocating firms into these categories, and one could use a broader or a narrower
definition of technology. But the general patterns would not be altered. For simplicity, we will
refer to these two categories as “tech” and “nontech.”
In Panel A of Table 4, we document that in each subperiod, tech stocks have been
underpriced by more than nontech stocks. Furthermore, the difference has increased over time.
Also noteworthy is that the proportion of IPOs that are tech stocks has increased over time, from
roughly 25% in the 1980s to roughly 70% during the internet bubble period. Inspection of Panel
A shows, however, that the underpricing of both tech and nontech stocks has increased over
time. Thus, the increased underpricing of IPOs in general is not attributable merely to an
increased proportion of tech stocks in the mix of companies going public. Of note is that
nontech stocks had higher first-day returns during the internet bubble period than in prior
periods. Thus, the high average returns on IPOs during the internet bubble period affected the
whole IPO market, not just internet and technology stocks.
In Panel B of Table 4, we report mean and median market values (post-issue shares
outstanding multiplied by the offer price) and annual sales in the year prior to going public for
our industry categories. We also report the ratio of the median market value to the median sales
for each subperiod. Inspection of the patterns shows that higher first-day returns are associated
with higher market-to-sales ratios.
In unreported results, we investigate the underpricing of internet, non-internet technology
stocks, and other stocks during 1998, 1999, and 2000. Specifically, we divide the internet and
technology IPOs on the basis of whether they were internet-related or not. Internet IPOs had
average first-day returns of 80% or more in each year during 1998-2000. Other technology
stocks (including telecom but not biotech) had modest average first-day returns during 1998
before the average jumped to over 50% in both 1999 and 2000.4 Nontech stocks saw their
average first-day returns increase from 10% in 1998 to 18% in 1999 and 29% in 2000. Thus, the
high proportion of internet IPOs, with their severe underpricing, accounts for part of the high
average first-day returns during 1999-2000. But during the internet bubble period, underpricing
for all IPOs, irrespective of industry, was at a high level.
4 During 1998-2000, 45 IPOs that were not internet stocks doubled in price on the first day of trading (although none of these were during 1998). Almost all of these were technology or telecom stocks. Amo ng the non-internet IPOs that doubled in price are Gadzoox Networks, Wink Communications, Triton PCS Holdings, Palm, Capstone Turbine, Airspan Networks, Speechworks International, McData Corp., and Ciphergen Biosystems.
12
Overhang
Bradley and Jordan (2001) document that the ratio of retained shares to the public float,
which they refer to as share overhang, predicts first-day returns. Explanations for why share
overhang predicts first-day returns include the “scarcity value” hypothesis. If the float, the
number of shares issued in the IPO, is small relative to the shares retained by pre-issue
shareholders, the market price will be higher if there is a negatively sloped demand for shares.
This translates into higher first-day returns if the offer price has not incorporated this scarcity
value. Leland and Pyle’s (1977) asymmetric information model views the relative float as a
signal of firm value. Managers with positive private information about firm value will signal this
value by selling only a small fraction of the firm in the IPO. Grinblatt and Huang (1989) extend
the Leland and Pyle model to incorporate underpricing.
Another explanation for the relation between underpricing and overhang is offered by
Barry (1989) and Habib and Ljungqvist (2001). They argue that the opportunity cost of
underpricing to issuers is less if the relative float is small. Ritter (1984b) argues that the relative
float may be small (and the overhang large) if the firm has a fixed proceeds in mind, but the
market is willing to place a high value on the firm. In other words, the higher the valuation, the
higher will be the overhang for a given amount of proceeds. In this paper, we argue that if
valuations are high, underpricing will be greater because issuers will not bargain as hard for a
higher offer price, and underwriters will take advantage of this by leaving more money on the
table.
In Table 5, we document the patterns after categorizing IPOs on the basis of their share
overhang. Firms that sell 30% or more of the post-issue shares in the IPO are deemed to have a
low overhang. The table shows that as valuations have increased over time, both first-day
returns and the share overhang also have increased. Causality is unclear, however. Firms could
be selling less of themselves because underpricing has increased. Underpricing could have
increased because the overhang has gotten bigger. Or both the overhang and underpricing could
have increased because valuations and the attendant agency problems have increased. Note that,
in the 1980s, underpricing was virtually identical whether the share overhang was large or small.
Inspection of Table 5 shows that, in the 1990s and internet bubble period, the median
proceeds of low overhang and high overhang firms were virtually identical. Not identical,
13
however, are the valuations. High overhang firms have a much higher valuation, so they are able
to sell a smaller fraction of the firm to raise the same proceeds.
Turnover
In Table 6, we report the average turnover on the first day of trading. Turnover is defined
as volume, as reported by CRSP, divided by the global number of shares offered, exclusive of
overallotment options. Because of the different conventions for reporting volume on Nasdaq
versus the American or New York Stock Exchanges, we double the reported volume numbers for
Amex and NYSE IPOs. Of our sample of IPOs, 87% are initially listed on Nasdaq.
Panel A of Table 6 reports that the proportion of IPOs with first-day turnover greater than
100% increased from less than 2% of IPOs in the 1980s to 24% of IPOs during the 1990s and
75% during the bubble period. In other words, what was once a rare event became
commonplace.
In Panel B, we report the average turnover after classifying IPOs on the basis of their
first-day return. In general, the average turnover is higher the higher is the first-day return. Our
numbers are consistent with those reported by Aggarwal (2002), Krigman, Shaw, and Womack
(1999), and Ellis, Michaely, and O’Hara (2000, Table IV). This correlation of volume and
returns may be partly due to the implementation of penalty bids by investment bankers on IPOs
that do not jump in price. A penalty bid is the term used by investment bankers whereby a
stockbroker loses his or her commission on the IPO if the buyer then sells the shares within a
short period of time. If a broker suspects that a penalty bid will be implemented, the broker has
an incentive to allocate IPO shares to a buy-and-hold investor. More controversially, a penalty
bid also creates incentives for the broker to dissuade a buyer from selling the shares after the
stock has started trading.
Because underpricing has increased over time, in Panel C we attempt to disentangle these
effects by reporting the relation between returns and turnover for each subperiod. Panel C shows
that, for each first-day return category, turnover has increased over time. The panel also shows
that for each subperiod, the positive relation between turnover and first-day returns exists.
Looking across each row, turnover roughly doubled between the 1980s and 1990s, and then
roughly doubled again during the internet bubble period. This suggests that selling IPO shares
immediately after the offering, a practice known as “flipping,” has become much more common
over time. This is consistent with the hypothesis that underwriters have increasingly used IPOs
14
to induce buy-side clients to generate profitable commission business. These clients frequently
flip their IPO allocations, unlike buy-and-hold investors. Thus, the patterns documented in Table
6 are consistent with our agency hypothesis for the increase in underpricing over time.
Age
In Table 7, we report the average first-day return in each subperiod after classifying firms
by their age at the time of going public. Figure 3 plots the average first-day returns. Inspection
of the table and graph shows that in each subperiod there is more underpricing of young firms
than of old firms, although the relation is not strictly monotonic. Our results for the 1980s are
consistent with those reported by Muscarella and Vetsuypens (1990).
Even more noteworthy is the increase in underpricing, holding age constant, as one
moves from the 1980s to the 1990s to the internet bubble period.5 Thus, Table 7 and Figure 3
show that the increase in underpricing over time is not due merely to a shift towards younger
firms in the age distribution of firms going public. Instead, the relation between age and first-
day returns is nonstationary.
In Figure 4, we report the 25th, 50th, and 75th percentiles of the age distribution for the
IPOs in each cohort year, from 1980-2000. Three patterns stand out. First, in the early 1990s,
the proportion of young firms dropped. This drop is associated with an increase in the number of
“reverse LBOs,” firms going public after having previously been involved in a leveraged buyout.
Second, in 1999, more young firms went public. This increase in the proportion of young firms
is associated with the internet bubble. Third, there is no strong secular trend in the age
distribution of firms going public. With only temporary aberrations, the median age has stayed
remarkably constant at about 7 years.6
Market Conditions
In Panel A of Table 8, we report the average first-day returns conditional on the market
return during the registration period, as represented by the Nasdaq Composite index return
5 The greater variation of average first-day returns during the internet bubble period is due to two features of the data. First, the internet bubble period has a smaller sample size, so each age group has fewer firms in it. Second, as Table 7 reports, for any age group, the standard deviation of first-day returns is higher. 6 It should be noted that we have screened out best efforts offers, unit offers, and IPOs with an offer price of below $5.00. This segment of the IPO market historically has been intensive in fraud and has been avoided by institutional investors. There has been a decrease in these issues over time, and most of these offers are from fairly young firms. The decrease in these offers is partly attributable to tighter listing requirements on Nasdaq, and partly due to greater regulatory pressures on this part of the IPO market.
15
during the 15 trading days (three weeks) prior to the offering. In all subperiods, first-day returns
are higher, the higher is the market return in the three weeks prior to setting the offer price. In
other words, there is partial adjustment to public information. As Loughran and Ritter (2002)
note, this is consistent with the prospect theory explanation of underpricing.7 The patterns are
economically important: for the entire sample, IPOs that follow negative Nasdaq returns have
mean first-day returns of 13.0%, versus 33.0% for those IPOs that follow periods where the
three-week Nasdaq return exceeds 4%.
Panel B of Table 8 reports the sample sizes conditional on the market returns. The high
volatility of Nasdaq during the internet bubble period is apparent, with only 19% of IPOs
occurring following a three-week period during which the Nasdaq index had a return of between
zero and 4%. The bottom row of Panel B shows that the mean Nasdaq return in the three weeks
prior to the IPO did not differ much between the three subperiods. Because of the asymmetric
response of underpricing to market movements, however, the higher volatility during the bubble
period matters.
In Panel C of Table 8, we show that the offer price is more likely to be revised upwards if
the market return during the road show period is high, although the sensitivity is only modest. In
the bottom row, we report that the frequency of upward offer price revisions has increased over
time, from 12% of IPOs in the 1980s to 23% in the 1990s to 45% during the internet bubble
period. The prospect theory explanation of underpricing argues that it is in these situations,
where the issuer is receiving good news about wealth changes, that severe underpricing is most
prevalent.
Prestigious Underwriters
In Table 9, we categorize IPOs on the basis of the prestige of their lead underwriter.
Inspection of the sample sizes shows that prestigious lead underwriters have increased their
market share over time. Lead underwriters with a Carter and Manaster rank of 8.0 or higher (on
7 In Loughran and Ritter’s (2001) Table 3, the results for 1990-1998 are slightly different than in our Table 8 because of the different sample selection procedures. In Loughran and Ritter (2001), IPOs with a midpoint of the file price range of below $8.00 are excluded. In this paper, we exclude IPOs with an offer price below $5.00. The difference in selection criteria increases the number of IPOs by approximately 10% in this paper. Of the IPOs with an offer price below $5.00 that we exclude, only one company had a midpoint of the file price range of $8.00 or more.
16
a scale of 0 to 9) increased their market share from under 50% in the 1980s to over 60% in the
1990s and to over 80% during the internet bubble period.8
In general, underwriters with a rank of 8.0 to 9.0 are considered to be prestigious national
underwriters. Those with a rank of 5.0 to 7.9 are considered to be quality regional or niche
underwriters. Underwriters with a rank of 0 to 4.9 are generally associated with penny stocks,
and many of those with ranks of below 3.0 have been charged with market manipulation by the
SEC.
Beatty and Welch (1996), Cooney, Singh, Carter, and Dark (2001), and others have
documented that the negative relation between underwriter prestige and underpricing that existed
in the 1980s reversed itself in the 1990s. Our Table 9 findings confirm this reversal. To
rationalize the pattern of the 1980s that prestigious underwriters are associated with less
underpricing, Carter and Manaster (1990) and Carter, Dark, and Singh (1998) argue that IPOs
taken public by prestigious underwriters benefit from superior certification. Because of the
greater reputation capital that is committed, investors do not demand as large a discount on these
offers. The higher underpricing associated with prestigious underwriters in the 1990s and
internet bubble period is inconsistent with the certification argument, however.
The pattern of greater underpricing for IPOs associated with prestigious underwriters is
consistent with the Loughran and Ritter (2002) agency argument that investment bankers seek to
underprice IPOs to their own advantage. In the 1980s and earlier, prestigious underwriters
refused to take public young, unproven companies. For example, Goldman Sachs was lead
underwriter on only one technology IPO with inflation-adjusted annual sales of less than $20
million in the entire decade of the 1980s. For comparison, Goldman Sachs was the lead
underwriter on 15 such companies in the 1990s and 47 more during the internet bubble period.
Because they were taking public relatively mature firms, the average underpricing on IPOs done
by prestigious underwriters was low.
Table 9 shows that over time, especially in the internet bubble period, prestigious
underwriters relaxed their underwriting standards and took public an increasing number of very
young, unprofitable companies. The median sales of firms taken public by prestigious
8 Since in all subperiods the biggest deals are more commonly managed by prestigious underwriters, if market share is computed using gross proceeds, rather than the number of IPOs, the market share of prestigious underwriters would be uniformly higher.
17
underwriters dropped from $75 million in the 1980s to just $16 million during the internet
bubble period. As they gained market share, prestigious underwriters chose to not charge higher
direct fees, but instead to charge higher indirect fees by leaving more money on the table. The
average underpricing on their deals increased both due to the shift into riskier deals and due to
this increase in indirect fees. Table 9 also shows that prestigious underwriters were more likely
to increase the offer price to above the maximum of the file price range. How much of this
pattern is due to success at creating demand versus intentional low-balling of the file price range
is an open question.9
In the early 1980s, most underwriters were thinly capitalized firms where risk-sharing
was important. On a $50 million deal at 7%, the underwriters shared $3.5 million in fees. The
lead underwriter might get 20% of this, or $0.7 million. As underwriters got bigger, the lead
manager was able to keep 60% of the fees, or $2.1 million. Furthermore, with more money left
on the table, the lead underwriter could get quid pro quos that might be worth another $2.1
million. So it became a lot more lucrative to be the lead underwriter. To get this business, it was
important to have an analyst who would be bullish. According to Lise Buyer, Director of
Internet/New Media Research at CSFB during the internet bubble, “Some of the bigger stars
were cheerleaders, not analysts…”.10 Cheerleading is the term that describes the bullish tilt to
analyst recommendations, with “buy” and “strong buy” recommendations becoming more
common, much as grade inflation by professors became common.
We are arguing that IPO underwriting became more lucrative over time as valuations
increased. The higher valuations made issuing firms more willing to leave money on the table.
Underwriters found that they could recoup some of the money left on the table in the form of
commissions from rent-seeking buyers. The time series evidence is consistent with this story,
but what about cross-sectional implications? A cross-sectional implication of this story is that at
each point in time, firms with higher valuations will be underpriced more, ceteris paribus. We
now test this prediction.
9 Cooney, Singh, Carter, and Dark (2001) and Logue, Rogalski, Seward, and Foster-Johnson (2001) also document that during the 1990s prestigious underwriters were more likely to revise the offer price upwards. Lowry and Schwert (2001) report similar results for the 1985-1997 time period. Logue et al. interprets this as success in creating demand, rather than low-balling the file price range. 10 As quoted on the PBS Frontline episode “dotcon” on January 24, 2002. A transcript is available at http://www.pbs.org.
18
6. Multiple regression results
One explanation for the cross-sectional pattern between age and first-day returns is that
younger firms are riskier firms, and investors need to be compensated for this risk. The negative
relation between sales and first-day returns documented in Table 3 and Figure 2 can also be
interpreted as demonstrating a relation between the risk of an IPO and underpricing. The
univariate sorts in Tables 2-9, however, are not independent. Tech firms are much more likely to
be young firms, for instance. Thus, to examine marginal effects, we report multiple regression
results with the first-day return as the dependent variable. Our explanatory variables are chosen
on the basis either of their association with first-day returns in our univariate sorts, or to test our
agency hypothesis.
In the first row of Table 10, we use seven explanatory variables: a tech stock dummy, the
logarithm of (1 + age), a prestigious underwriter dummy variable, share overhang, the logarithm
of (market-to-sales), a dummy variable for IPOs from 1990-1998, and a dummy variable for
IPOs from 1999-2000.11, 12 In rows 5-8, we add an offer price upgrade dummy, which takes on
the value one when the offer price is above the maximum of the original file price range, the
lagged 15-trading day return on the Nasdaq Composite index, and one or more interaction terms.
We use dummy variables for tech stock status, underwriter prestige, whether the offer price is
above the maximum of the file price range, and subperiods. For several of these variables, we
could boost the R2 substantially by using a continuous measurement instead. We use dummy
variables because the economic interpretation of the coefficients is easier. The lagged Nasdaq
return and the offer price upgrade dummy variable and its interactions with ln(Mkt/Sales), the
nineties dummy, and the bubble dummy are used to test our agency hypothesis. We could also
11 Firms with trailing sales of zero are assigned a value of $10,000. Market value of equity is computed using the offer price multiplied by the post-issue number of shares outstanding, as reported by CRSP for IPOs with a single class of stock. For IPOs with multiple classes of stock outstanding (where typically only one class is covered by CRSP), we include all classes of stock, as described in Appendix 2, and use the price per share of the traded class. Age is expressed in years, and represents the number of years between founding and the IPO. Tech stocks include both technology stocks and internet stocks. 12 Our regression specification ignores the endogeneity of several variables. For example, firms anticipating a high first-day return may choose to sell only a small fraction of the firm in the IPO, resulting in a high share overhang. See Habib and Ljungqvist (2001) for a discussion of endogeneity issues in the context of IPO underpricing regressions.
19
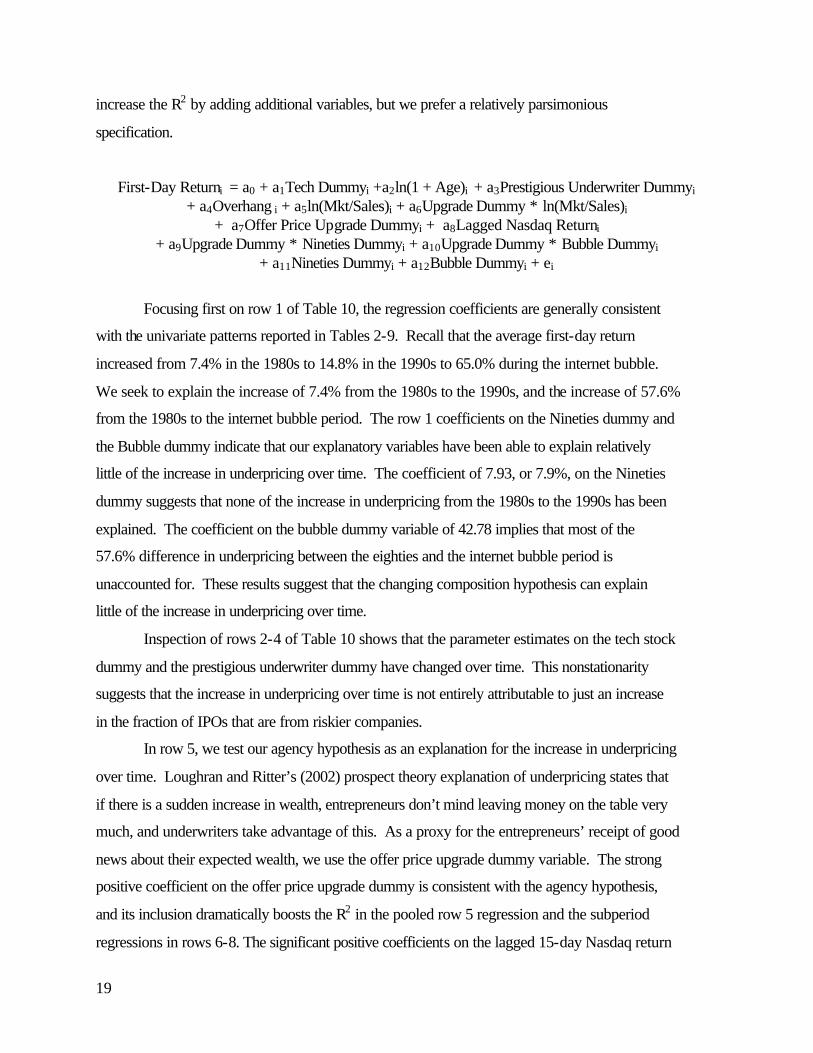
increase the R2 by adding additional variables, but we prefer a relatively parsimonious
specification.
First-Day Returni = a0 + a1Tech Dummyi +a2ln(1 + Age)i + a3Prestigious Underwriter Dummyi + a4Overhang i + a5ln(Mkt/Sales)i + a6Upgrade Dummy ∗ ln(Mkt/Sales)i
+ a7Offer Price Upgrade Dummyi + a8Lagged Nasdaq Returni + a9Upgrade Dummy ∗ Nineties Dummyi + a10Upgrade Dummy ∗ Bubble Dummyi
+ a11Nineties Dummyi + a12Bubble Dummyi + ei
Focusing first on row 1 of Table 10, the regression coefficients are generally consistent
with the univariate patterns reported in Tables 2-9. Recall that the average first-day return
increased from 7.4% in the 1980s to 14.8% in the 1990s to 65.0% during the internet bubble.
We seek to explain the increase of 7.4% from the 1980s to the 1990s, and the increase of 57.6%
from the 1980s to the internet bubble period. The row 1 coefficients on the Nineties dummy and
the Bubble dummy indicate that our explanatory variables have been able to explain relatively
little of the increase in underpricing over time. The coefficient of 7.93, or 7.9%, on the Nineties
dummy suggests that none of the increase in underpricing from the 1980s to the 1990s has been
explained. The coefficient on the bubble dummy variable of 42.78 implies that most of the
57.6% difference in underpricing between the eighties and the internet bubble period is
unaccounted for. These results suggest that the changing composition hypothesis can explain
little of the increase in underpricing over time.
Inspection of rows 2-4 of Table 10 shows that the parameter estimates on the tech stock
dummy and the prestigious underwriter dummy have changed over time. This nonstationarity
suggests that the increase in underpricing over time is not entirely attributable to just an increase
in the fraction of IPOs that are from riskier companies.
In row 5, we test our agency hypothesis as an explanation for the increase in underpricing
over time. Loughran and Ritter’s (2002) prospect theory explanation of underpricing states that
if there is a sudden increase in wealth, entrepreneurs don’t mind leaving money on the table very
much, and underwriters take advantage of this. As a proxy for the entrepreneurs’ receipt of good
news about their expected wealth, we use the offer price upgrade dummy variable. The strong
positive coefficient on the offer price upgrade dummy is consistent with the agency hypothesis,
and its inclusion dramatically boosts the R2 in the pooled row 5 regression and the subperiod
regressions in rows 6-8. The significant positive coefficients on the lagged 15-day Nasdaq return
20
variable show that there is partial adjustment to public information, also consistent with the
prospect theory explanation of underpricing.
As reported in Table 8, the proportion of IPOs where the offer price has been revised to
above the maximum of the original file price range has increased over time. In the subperiod
regressions in rows 6-8, the coefficients on the offer price upgrade dummy get bigger over time.
This raises the question of why the effect has increased over time. Our answer is that we must
look to the increased level of valuations that has occurred over our sample period. We argue that
richer entrepreneurs are more blasé about leaving money on the table when they receive good
news than entrepreneurs who are not as rich. This is a variant of the prospect theory prediction
that changes in wealth affect bargaining. To measure this effect, in rows 5-8 we include the
logarithm of the market value-to-sales ratio interacted with the offer price upgrade dummy. In
all of the regressions, the coefficient on this interaction term is positive. This is consistent with
our agency hypothesis.
In rows 6-8 of Table 10, the coefficient on the offer price upgrade dummy increases from
13.5% in the 1980s to 15% in the 1990s and 53% in the internet bubble period. This increase in
coefficients is consistent with our agency hypothesis. As valuations increased, issuing firms
became increasingly willing to accept underpricing that is accompanied by simultaneous good
news about increases in personal wealth. Underwriters were more than willing to take advantage
of this complacency.
In row 5, the coefficients on the time-period dummy variables (Nineties and Bubble)
directly test whether first-day returns on IPOs are drawn from a stationary distribution, with the
changing composition of IPOs and increased agency problems accounting for the variation in
average underpricing over time. If all of the time-series variation in underpricing can be
accounted for by these two hypotheses (and our empirical implementation), the time period
dummy variables should have coefficients of zero. Instead, in row 5 the nineties dummy
variable has a coefficient of 5.41, or 5.4%. Given that Table 1 shows a difference of 7.4%
between mean first-day return in the 1980s and 1990s (14.8% minus 7.4%), little of the increase
in underpricing from the 1980s to the 1990s is explained by these two hypotheses. By contrast,
the row 5 coefficient on the bubble dummy variable of 12.12, or 12.1%, implies that most of the
57.6% difference (65.0% minus 7.4%) in underpricing between the eighties and the bubble
period is explained by our two hypotheses.
21
In Table 11, we decompose the change in underpricing over time into components.
Using the coefficients in row 5 of Table 10, we multiply the coefficients by the change in the
sample characteristics. Specifically, the changing composition hypothesis is associated with the
changing percentage of tech stocks. The agency hypothesis is associated with the increased
frequency of offer price upgrades and its interaction with the log of market-to-sales. Several
other variables are more ambiguous to classify. For example, the increased share overhang
might result in more underpricing due to scarcity value.
Table 11 shows that the changing composition hypothesis is relatively unsuccessful in
explaining the change in underpricing over time. Instead, most of the increased underpricing is
associated with the agency hypothesis.
7. Alternative Explanations for the Underpricing of Internet Stocks
Many alternative explanations have been given for the severe underpricing of IPOs
during the internet bubble, with few complaints from the issuing firms.13 One view is that many
issuers were more concerned with what the market price would be when the lockup expired than
with what the offer price was. Developing this idea, Aggarwal, Krigman, and Womack (2001)
argue that severe underpricing generates “information momentum,” resulting in a higher market
price at the time that the lockup period expires, when insiders sell some of their shares.
During the internet bubble, there were widespread concerns about the valuation of
internet stocks. One explanation for the severe underpricing of internet IPOs is that underwriters
were unwilling to price the stocks at the level that the market was willing to pay out of concern
about lawsuits and a tarnished reputation if and when the stocks eventually dropped in price. The
argument is that unsophisticated day traders and others were bidding up the price to unjustified
levels, and the underwriters were unwilling to price the IPOs at the market price determined by
“noise traders.” A variant of the argument is that in many cases day trader demand boosted the
share price no matter what the offer price was.
13 DuCharme, Rajgopal, and Sefcik (2001) and Ofek and Richardson (2001), among others, examine various hypotheses for the high underpricing of internet stocks. Many of the explanations offered, such as “the IPO as a marketing event,” may be viewed as a subset of our agency hypothesis, in that underwriters used many stories to try and convince issuers that severe underpricing was really in their interest. Arosio, Giudici, and Paleari (2001) present evidence for the severe underpricing of European internet stocks which they argue is consistent with the prospect theory explanation of underpricing.
22
While there may be some truth to these stories, we are skeptical that underwriters were
resisting higher offer prices merely out of concern that the market prices were hard to justify.
Loughran and Ritter (2002, Table 4) partition IPOs from 1990-1998 on the basis of revisions in
the offer price. If underwriters were “leaning against the wind,” then the high returns associated
with upward revisions should be transitory. They find no evidence that IPOs where the offer
price was revised up are associated with unexpectedly poor market-adjusted returns, measured
from the first-day close, during the following three years.
More importantly, if underwriters were concerned that the market prices on internet
stocks were too high, presumably their analyst recommendations once the quiet period ends
would have been bearish relative to their recommendations on other stocks. Bradley, Jordan, and
Ritter (2001) find that this was in fact not the case. Thus, while we are not making any claims as
to the cause of the high valuations on internet stocks, there is no evidence that underwriters were
actively trying to deflate the bubble. Instead, the extreme underpricing of internet IPOs is
consistent with our agency hypothesis that underwriters took advantage of the high market
valuations, at the cost to issuing firms of lower proceeds.
8. Conclusions
Why has underpricing increased over time? This paper presents two non-mutually
exclusive explanations, the changing composition hypothesis and the agency hypothesis. Part of
the increase can be attributed to the changing composition of the universe of firms going public.
Most of the increase, however, is not attributable to changes in the risk of firms going public.
We argue that higher valuations have resulted in issuers being more complacent about leaving
money on the table. This, combined with the desire of underwriters to leave money on the table
and receive indirect compensation from buy-side clients eager to receive IPO allocations in
return, results in greater underpricing. This accounts for most of the increase in underpricing
over time. In other words, agency problems between underwriters and issuing firms, largely
latent in the 1980s, have become increasingly important. While it is true that internet firms were
underpriced dramatically more than other firms, we maintain that internet firms were particularly
susceptible to agency problems between issuers and their underwriters.
This paper also documents patterns in the U.S. IPO market. The universe of companies
going public in the U.S. has changed over time. For example, there has been a pronounced shift
23
towards technology stocks. How firms are brought public has changed over time, too. The
market share of the prestigious national underwriters has increased, with regional investment
banking firms increasingly shut out of lead underwriter positions. The trading volume on the
first day of trading has increased over time, roughly doubling from the 1980s to the 1990s, and
roughly doubling again during the internet bubble period.
The reasons that IPOs are underpriced varies depending upon the environment. In the
1980s, it is conceivable that the winner’s curse problem and dynamic information acquisition
were the main explanations for underpricing that averaged 7% in the U.S. During the internet
bubble, these were not the main reasons for underpricing. Instead, we argue that agency
problems increased in importance. Prospect theory is a necessary, but not sufficient, condition
for severe underpricing to exist if the conditions are right. Conflicts of interest between issuers
and underwriters are a necessary, but not sufficient, condition for severe underpricing to exist. If
issuers cared a lot about the dilution costs associated with severe underpricing, and chose a lead
underwriter accordingly, the agency problems would be minimized. But together, when market
conditions are such that valuations are high and getting higher, both of these necessary
conditions are satisfied and underpricing can be severe.
24
References
Aggarwal, Rajesh, Laurie Krigman, Kent Womack (2001) “Strategic IPO underpricing, information momentum, and lockup expiration selling,” Journal of Financial Economics forthcoming. . Aggarwal, Reena (2002) “Allocation of initial public offerings and flipping activity,” Journal of Financial Economics forthcoming. Arosio, R., G. Giudici, and S. Paleari (2001) “Why do (or did?) internet-stock IPOs leave so
much money on the table?” unpublished Politiecnico di Milano (Italy) working paper. Baron, David (1982) “A model of the demand of investment banking advising and distribution services for new issues” Journal of Finance 37, 955-976. Barry, Chris (1989) “Initial public offerings underpricing: The issuer’s view—A comment” Journal of Finance 44, 1099-1103. Beatty, Randolph P., and Ivo Welch (1996) “Issuer expenses and legal liability in initial public
offerings,” Journal of Law and Economics 39, 545-602. Benveniste, Lawrence M., and William J. Wilhelm (1997) “Initial public offerings: Going by
the book,” Journal of Applied Corporate Finance 10 (Spring), 98-108. Bradley, Daniel and Brad Jordan (2001) “Partial adjustment to public information and IPO
underpricing,” Journal of Financial and Quantitative Analysis forthcoming.
Bradley, Daniel, Brad Jordan, and Jay R. Ritter (2002) “The quiet period goes out with a bang,” unpublished University of Kentucky working paper.
Carter, Richard B., and Steven Manaster (1990) “Initial public offerings and underwriter reputation,” Journal of Finance 45, 1045-1068. Carter, Richard B., Frederick H. Dark, and Ajai K. Singh (1998) “Underwriter reputation, initial returns, and the long-run performance of IPO stocks,” Journal of Finance 53, 285-311. Cooney, John W., Ajai K. Singh, Richard B. Carter, and Frederick H. Dark (2001) “IPO initial returns and underwriter reputation: Has the inverse relationship flipped in the 1900s?” unpublished University of Kentucky, Case Western Reserve, and Iowa State working paper. DuCharme, Larry L., Shivaram Rajgopal, and Stephan E. Sefcik (2001) “Why was internet IPO
underpricing so severe?” unpublished University of Washington working paper.
25
Ellis, Katrina, Roni Michaely, and Maureen O’Hara (2000) “When the underwriter is the market maker: An examination of trading in the IPO aftermarket,” Journal of Finance 55, 1039- 1074.
Field, Laura C., Wayne Mikkelson, and Megan Partch (2001) “The consequences of going public early,” unpublished Penn State and University of Oregon working paper. Foerster, Bruce (2000) Securities Industry Association’s Capital Markets Handbook (2nd edition)
Aspen, CO: Aspen Publishers.
Grinblatt, Mark, and Chuan-Yuan Hwang (1989) “Signalling and the pricing of new issues,” Journal of Finance 44, 393-420. Habib, M., and A. Ljungqvist (2001) “Underpricing and entrepreneurial wealth losses: Theory and evidence,” Review of Financial Studies 14, 433-458. Krigman, L., W. Shaw, and K. Womack (1999) “The persistence of IPO mispricing and the predictive power of flipping,” Journal of Finance 54, 1015-1044. Leland, Hayne, and David Pyle (1977) “Informational asymmetries, financial structure, and
financial intermediation,” Journal of Finance 32, 371-387.
Ljungqvist, Alexander P., and William J. Wilhelm (2002) “IPO pricing in the dot-com bubble: Complacency or incentives?” unpublished NYU working paper.
Logue, D., Rogalski, R., Seward, J., and Foster-Johnson, L. (2001) “What’s special about the role of underwriter reputation and market activities in IPOs?” Journal of Business, forthcoming. Loughran, Tim, and Jay R. Ritter (2002) “ Why don’t issuers get upset about leaving money
on the table in IPOs?” Review of Financial Studies 15, 413-443. Lowry, Michelle, and G. William Schwert (2001) “Biases in the IPO pricing process,”
unpublished Penn State and University of Rochester working paper. Muscarella, Chris, and Michael Vetsuypens (1990) “Firm age, uncertainty, and IPO
underpricing: Some new empirical evidence,” unpublished Southern Methodist University working paper.
Ofek, Eli, and Matthew Richardson (2001) “Dotcom mania: A survey of market efficiency in
the internet sector” unpublished NYU working paper. Ritter, Jay R. (1984a) “The ‘hot issue’ market of 1980” Journal of Business 57, 215-240. Ritter, Jay R. (1984b) “Signalling and the valuation of unseasoned new issues: A comment”
Journal of Finance 39, 1231-1237.
26
Sherman, Anne (2000) “IPOs and long-term relationships: An advantage of bookbuilding,”
Review of Financial Studies 13, 697-714.
Smart, Scott, and Chad J. Zutter (2001) “Control as a motivation for underpricing: A comparison of dual- and single-class IPOs,” unpublished Indiana University working paper.
White, Hal (1980) “A heteroskedasticity-consistent covariance matrix estimator and a direct test for heteroskedasticity,” Econometrica 48, 817-838.
27
Appendix 1: Founding Dates The founding date is generally defined as the date of incorporation. An attempt has been made to make this the date of original incorporation, rather than a later date if the firm has reincorporated in Delaware or changed its name. Founding dates for 1980-1984 generally come from inspection of the prospectus. For 1985-1995, most of the founding dates have been provided by Laura Field. For 1985-1987, Moody’s is the main source of data. For 1988-1992, the prospectus is the main source. For 1993-1995, Disclosure and S&P Corporate Descriptions are the main sources. For 1993, some of the founding dates have come from Renaissance Capital. For 1996-2000, founding dates have come from a variety of sources: Securities Data Co., Moody’s, Dunn and Bradstreet’s Million Dollar Directory, inspection of the prospectuses on Edgar, etc. and have been collected primarily by Laura Field (Field, Mikkelson, and Partch (2001)) and Li-Anne Woo. Some founding dates for 1999-2000 are from Thomson Financial’s The IPO Reporter, an industry newsletter. References can be found at www.uflib.ufl.edu/cm/business. According to Laura Field, for 1988-1992, the founding date is earlier than the date of the most recent incorporation for 48% of the firms. An example of this is from the April 2000 prospectus of Krispy Kreme doughnuts. The firm going public was incorporated in 1999, but the predecessor corporation was incorporated in 1982. Elsewhere in the prospectus, however, one finds the statement that their first doughnut shop was opened in 1937. We would use 1937 as the founding date. Renaissance Capital lists 1937 as the founding date. For 1996-2000, we have used some of the founding dates that Alexander Ljungqvist and William Wilhelm have tabulated for their paper (Ljungqvist and Wilhelm (2002)). They inspected the prospectuses and made judgments on many spinoffs. Firms with inflation-adjusted (2000 purchasing power) sales in the last twelve months prior to going public of $200 million or more and less than 2 years of age are frequently “reverse LBOs” or divisional spinoffs. For spinoffs, the founding date of the division is used, when possible. This may be the founding date of the parent corporation. For example, Lucent Technologies (a 1996 IPO) is the former Bell Labs division of AT&T. Its founding date is given as the founding date of Bell Labs. In general, “roll-ups” are given a founding date corresponding to the founding date of the parent firm (frequently a year before the IPO). Age is defined as the calendar year of offering minus the calendar year of founding. Thus, a 2-year old firm may be anywhere from 13 months old to 35 months old. Because some years (1980-1984,1988-1993, and 2000) have founding dates that are primarily from the prospectus, rather than dates of incorporation from Moody’s et al, some of the variation over time may be due to using different data sources.
28
Appendix 2: Dual-class Shares Of the 6,169 IPOs in our sample, 386 are identified as having multiple classes of shares outstanding after the IPO. Most of these are firms where the IPO is composed of Class A shares. Class B shares with superior voting rights are owned by pre-issue shareholders, and are not publicly traded. For computing the market capitalization, these firms present a problem. CRSP only reports the shares outstanding for share classes that are publicly traded on Nasdaq, the Amex, or the NYSE. Thus, if one uses the CRSP-reported shares outstanding to compute the market capitalization, only part of the market value is captured. To take an extreme example, the United Parcel Services IPO of November 9, 1999 issued 109,400,000 shares of Class A stock, but 1,093,832,427 shares of Class B stock also existed. Using only the Class A shares outstanding would underestimate the market value by 91%. The December 9, 1998 IPO of Infinity Broadcasting is another example. 140,000,000 Class A shares were issued. CRSP reports this as the number of shares outstanding. But there were also 700,000,000 Class B shares outstanding, giving a market cap six times as big when all of the shares are included. In all of our calculations of market capitalization, we assume that non-traded shares have the same price per share as the publicly traded class. Unfortunately, Thomson Financial Securities Data has many errors in reporting the number of post-issue shares outstanding, although they attempt to capture all classes. For single-class IPOs, CRSP is much more reliable. For dual-class IPOs, Thomson Financial is more reliable. For 1992 and later, Dealogic is more reliable than Thomson Financial, so we use the Dealogic number if there is a discrepancy for 1992-1995 IPOs. If we use just the CRSP-reported shares outstanding, the median market cap figure that we calculate is 4% lower than the Table 1, Panel B numbers that we report. The mean market cap using CRSP data is 17% lower than the numbers reported in Table 1, Panel A. Scott Smart and Chad Zutter have supplied us with a list of 258 dual-class IPOs from 1990-1998, along with the post-issue shares outstanding. A further description of the Smart and Zutter data can be found in their 2001 Indiana University working paper. CRSP does not identify all of the IPOs that involve dual-class shares that Smart and Zutter identify. The post-issue shares outstanding number that Smart and Zutter have recorded is the same as the Thomson Financial number only a little over 50% of the time. For discrepancies where we could check the prospectus using EDGAR (beginning in 1996), we found that Smart and Zutter were correct almost 90% of the time. For dual-class IPOs where we could not verify the number, we use the Smart and Zutter number as the first choice and the maximum of the Dealogic, Thomson Financial, and the CRSP number as the second choice. Of these latter three sources, for 1992 and later, the Dealogic number is the most reliably accurate.

29
Appendix 3: Underwriter Rank for IPOs from 1992-2000 For underwriter prestige rankings, we have started with the Carter and Manaster (1990) and Carter, Dark, and Singh (1998) rankings. When a firm goes public, the underwriting section of the prospectus lists all of the investment banking firms that are part of the underwriting syndicate, along with the number of shares that each underwrites. More prestigious underwriters are listed higher in the underwriting section, in brackets, with the underwriters in higher brackets underwriting more shares. If an underwriter always appears in the highest bracket, it is assigned the top ranking of 9 on a 0-9 scale. For underwriters in the 1992-2000 period, we have assigned a ranking based on the following: The May 1999 Goldman Sachs prospectus lists over 120 underwriters, with numerous brackets. Managing and co-managing underwriters are assigned a ranking of 9, with other underwriters given a ranking based on the bracket they are in, with a few minor adjustments made by the authors. For other underwriters that are not included in the Goldman Sachs prospectus, we assign a ranking of 1 or 2 if they were penny stock underwriters that had been subject to enforcement actions by the SEC during 1995-1999 (the information on enforcement actions was provided by the Chicago office of the SEC’s Division of Enforcement). The numerical reputation ranking of remaining underwriters was determined by Bruce Foerster of South Beach Capital in Miami. Foerster has been an investment banker for close to thirty years, participating in the underwriting of 150 IPOs and hundreds of other transactions while a managing director at A.G. Becker Paribas, Paine Webber, Lehman Brothers, and South Beach Capital. He is also the editor of the Securities Industry Association’s Capital Markets Handbook (Foerster (2000)), and has an encyclopedia’s knowledge of the investment banking industry during the last few decades. For the handful of other underwriters that Bruce Foerster was not familiar with and that were not identified from our other procedures, we assigned a rank based upon the offer price of IPOs that they underwrote, with penny stocks getting the lowest ranks. We have made several alterations to the Carter and Manaster rankings for 1980-1984 and the Carter, Dark, and Singh rankings for 1985-1991. Carter, Dark, and Singh assign Hambrecht & Quist a 9.0, which we have lowered to 8.1. Carter and Manaster assign a rank of 2.0 to D.H. Blair in the 1980-1984 period, and Carter, Dark, and Singh assign a rank of 8.0 to D.H. Blair during 1985-1991. We assign a 4.1 to D.H. Blair for all years, since it is about the highest quality of the penny stock underwriters. In our opinion, D.H. Blair’s prestige has never been close to 8.0. A potential flaw with the Carter and Manaster methodology is that a penny stock underwriter that is never allowed into a syndicate of reputable underwriters might never be in a low bracket. Our judgment methodology avoids this problem. It should be noted, however, that relatively few major changes in rankings are present. All of the rankings that we have assigned are integers followed by a 0.1 (1.1 up to 9.1). The purpose of attaching a 0.1 to all of our rankings is so that other researchers can easily distinguish between our rankings and those from Carter and Manaster and Carter, Dark, and Singh, which never end with a 0.1. For IPOs where there are co-lead underwriters, we use the first co-lead reported by Thomson Financial Securities Data. In the eighteen years from 1980-1997, there were 17 IPOs with a joint book manager. In the three years from 1998-2000, there were 57 IPOs with a joint book manager. All 57 have a rank of 8 or higher for the first joint lead manager.

30
In 2000, our prestigious underwriter list is composed of ABN Amro, Banc of America Securities, BancBoston Robertson Stephens, Bear Stearns, CIBC, Credit Suisse First Boston, Chase H&Q, Deutsche Banc Alex Brown, Donaldson Lufkin Jenrette, Goldman Sachs, JP Morgan, Lehman Brothers, Merrill Lynch, Morgan Stanley, PaineWebber, Salomon Smith Barney, Thomas Weisel Partners LLC, and UBS Warburg.
31
Appendix 4: Internet and Technology Firms To identify IPOs that are internet-related at the time of their offer, we merge the internet identifications of Thomson Financial Securities Data, Dealogic, and IPOMonitor.com. In 1998, Securities Data classified only 18 IPOs as internet stocks, omitting such firms as uBID, Ticketmaster Online/Citysearch, NetGravity, and Verio. IPOMonitor.com classified 27 IPOs from 1998 as internet stocks, but omitted Cdnow and Interactive Magic, among others. Since these sources generally did not backdate the identification of early internet companies, we also have assigned a “1” value to America On-Line, Spyglass, and Netscape. The classifications have some inherent arbitrariness. For example, Storage Area Network (SAN) companies and telecommunications companies are not internet stocks, nor are such IPOs as VA Linux and Perot Systems. Tech stocks are defined as those in SIC codes 3571, 3572, 3575, 3577, 3578 (computer hardware), 3661, 3663, 3669 (communications equipment), 3674 (electronics), 3812 (navigation equipment), 3823, 3825, 3826, 3827, 3829 (measuring and controlling devices), 3841, 3845 (medical instruments), 4812, 4813 (telephone equipment), 4899 (communications services), and 7370, 7371, 7372, 7373, 7374, 7375, 7378, and 7379 (software).
32
Table 1 Number of IPOs, First Day Return, Amount of Money Left on the Table,
the Post-issue Level of Valuation, and Sales by Cohort Year IPOs with an offer price below $5.00 per share, unit offers, REITs, closed-end funds, banks and S&Ls, ADRs, and IPOs not listed on CRSP within six months of issuing have been excluded. Data are from Thomson Financial Securities Data, with supplements from Dealogic and other sources, and corrections by authors. The first-day return is defined as the percentage change from the offer price to the closing price. Money on the table is defined as the first-day price change (offer price to close) times the number of shares issued (global offering amount, excluding overallotment options). For the valuations, all numbers are in dollars of 2000 purchasing power using the Consumer Price Index. All valuation calculations use the post-issue number of shares outstanding. Valuations are computed by multiplying either the offer price times the post-issue shares outstanding or the first closing market price times the post-issue shares outstanding. Sales (expressed in terms of dollars of 2000 purchasing power) are for the last twelve months prior to going public, as reported in the prospectus. The mean and median sales are computed for the 6,086 firms for which a sales number is available.
Panel A: Means Money on the Table
Post-issue Valuation, millions
Sales,
Year
Number Of IPOs
First-day return
Nominal, millions
$2000, millions
Offer Price
Market Price
$2000, millions
1980 70 14.5% $2.6 $5.6 $147 $183 $78 1981 191 5.9% $0.7 $1.3 $100 $107 $54 1982 77 11.4% $1.7 $3.1 $104 $118 $38 1983 442 10.1% $1.9 $3.2 $141 $155 $86 1984 172 3.6% $0.3 $0.5 $84 $85 $79 1985 179 6.3% $1.2 $1.9 $176 $182 $189 1986 378 6.3% $1.7 $2.6 $166 $177 $156 1987 271 6.0% $2.4 $3.6 $206 $220 $233 1988 97 5.4% $1.3 $1.9 $288 $297 $283 1989 105 8.1% $2.2 $3.1 $216 $231 $227 1990 104 10.8% $3.2 $4.2 $197 $215 $350 1991 273 12.1% $5.1 $6.3 $191 $215 $206 1992 385 10.2% $4.4 $5.4 $201 $220 $205 1993 483 12.8% $6.6 $7.8 $249 $282 $244 1994 387 9.8% $3.6 $4.1 $166 $179 $189 1995 432 21.5% $10.1 $11.3 $249 $297 $196 1996 621 16.7% $10.5 $11.5 $308 $366 $149 1997 432 13.8% $9.9 $10.4 $266 $309 $167 1998 267 22.3% $18.6 $19.4 $496 $600 $305 1999 457 71.7% $78.0 $80.3 $826 $1,411 $343 2000 346 56.1% $77.4 $77.4 $900 $1,528 $253
1980-1989
1,982
7.4%
$1.6
$2.6
$159
$170
$140
1990-1998
3,384
14.8%
$8.3
$9.3
$260
$301
$205
1999-2000
803
65.0%
$77.7
$79.0
$858
$1,461
$304
Total
6,169
18.9%
$15.2
$16.2
$305
$410
$197
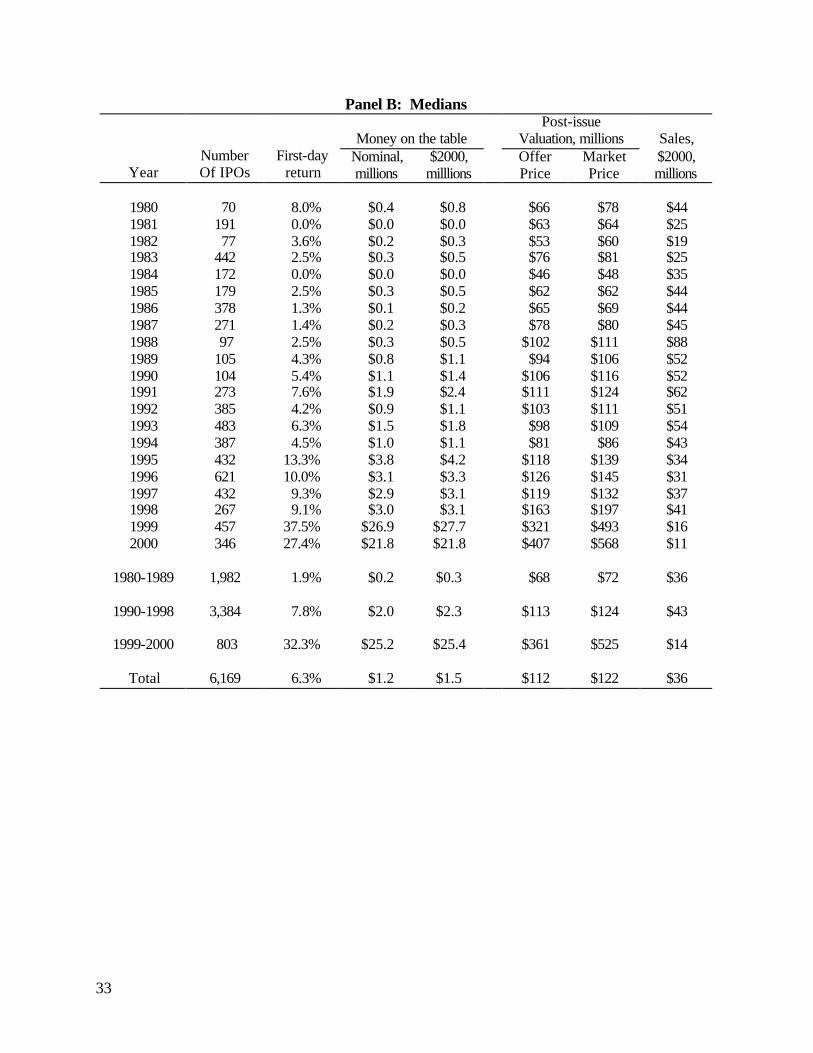
33
Panel B: Medians
Money on the table Post-issue
Valuation, millions
Sales,
Year
Number Of IPOs
First-day return
Nominal, millions
$2000, milllions
Offer Price
Market Price
$2000, millions
1980 70 8.0% $0.4 $0.8 $66 $78 $44 1981 191 0.0% $0.0 $0.0 $63 $64 $25 1982 77 3.6% $0.2 $0.3 $53 $60 $19 1983 442 2.5% $0.3 $0.5 $76 $81 $25 1984 172 0.0% $0.0 $0.0 $46 $48 $35 1985 179 2.5% $0.3 $0.5 $62 $62 $44 1986 378 1.3% $0.1 $0.2 $65 $69 $44 1987 271 1.4% $0.2 $0.3 $78 $80 $45 1988 97 2.5% $0.3 $0.5 $102 $111 $88 1989 105 4.3% $0.8 $1.1 $94 $106 $52 1990 104 5.4% $1.1 $1.4 $106 $116 $52 1991 273 7.6% $1.9 $2.4 $111 $124 $62 1992 385 4.2% $0.9 $1.1 $103 $111 $51 1993 483 6.3% $1.5 $1.8 $98 $109 $54 1994 387 4.5% $1.0 $1.1 $81 $86 $43 1995 432 13.3% $3.8 $4.2 $118 $139 $34 1996 621 10.0% $3.1 $3.3 $126 $145 $31 1997 432 9.3% $2.9 $3.1 $119 $132 $37 1998 267 9.1% $3.0 $3.1 $163 $197 $41 1999 457 37.5% $26.9 $27.7 $321 $493 $16 2000 346 27.4% $21.8 $21.8 $407 $568 $11
1980-1989
1,982
1.9%
$0.2
$0.3
$68
$72
$36
1990-1998
3,384
7.8%
$2.0
$2.3
$113
$124
$43
1999-2000
803
32.3%
$25.2
$25.4
$361
$525
$14
Total
6,169
6.3%
$1.2
$1.5
$112
$122
$36
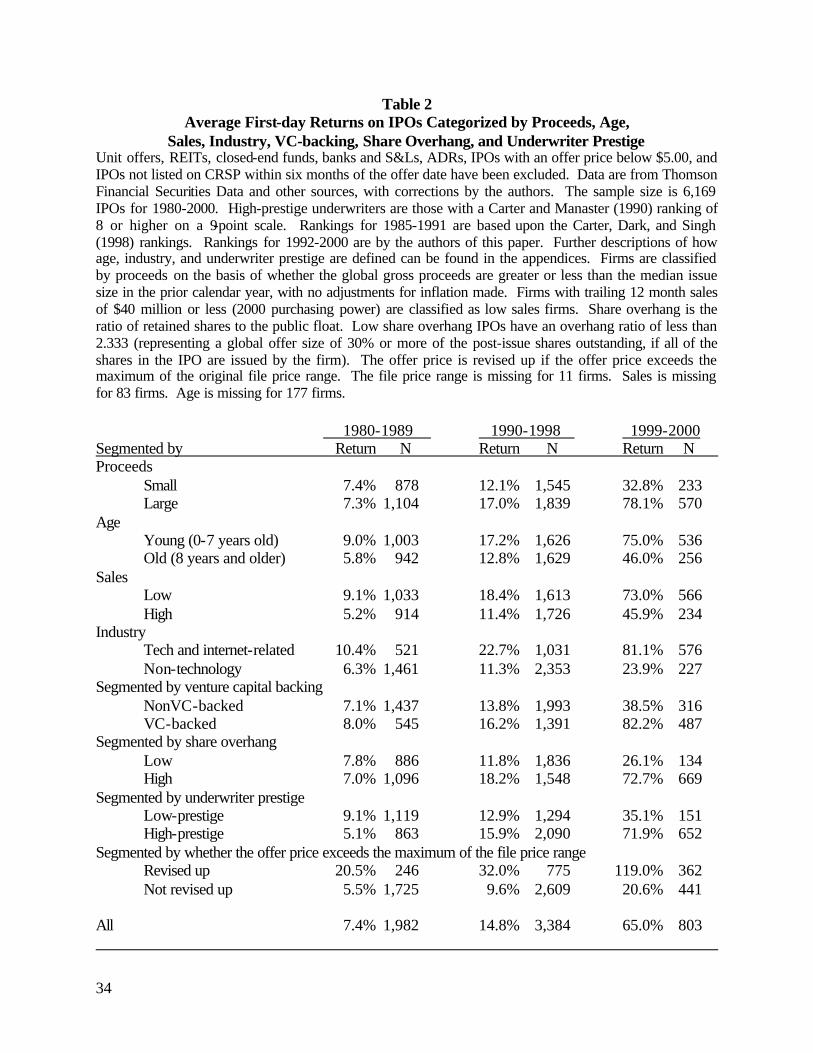
34
Table 2 Average First-day Returns on IPOs Categorized by Proceeds, Age,
Sales, Industry, VC-backing, Share Overhang, and Underwriter Prestige Unit offers, REITs, closed-end funds, banks and S&Ls, ADRs, IPOs with an offer price below $5.00, and IPOs not listed on CRSP within six months of the offer date have been excluded. Data are from Thomson Financial Securities Data and other sources, with corrections by the authors. The sample size is 6,169 IPOs for 1980-2000. High-prestige underwriters are those with a Carter and Manaster (1990) ranking of 8 or higher on a 9-point scale. Rankings for 1985-1991 are based upon the Carter, Dark, and Singh (1998) rankings. Rankings for 1992-2000 are by the authors of this paper. Further descriptions of how age, industry, and underwriter prestige are defined can be found in the appendices. Firms are classified by proceeds on the basis of whether the global gross proceeds are greater or less than the median issue size in the prior calendar year, with no adjustments for inflation made. Firms with trailing 12 month sales of $40 million or less (2000 purchasing power) are classified as low sales firms. Share overhang is the ratio of retained shares to the public float. Low share overhang IPOs have an overhang ratio of less than 2.333 (representing a global offer size of 30% or more of the post-issue shares outstanding, if all of the shares in the IPO are issued by the firm). The offer price is revised up if the offer price exceeds the maximum of the original file price range. The file price range is missing for 11 firms. Sales is missing for 83 firms. Age is missing for 177 firms. 1980-1989 1990-1998 1999-2000 Segmented by Return N Return N Return N Proceeds Small 7.4% 878 12.1% 1,545 32.8% 233 Large 7.3% 1,104 17.0% 1,839 78.1% 570 Age Young (0-7 years old) 9.0% 1,003 17.2% 1,626 75.0% 536 Old (8 years and older) 5.8% 942 12.8% 1,629 46.0% 256 Sales Low 9.1% 1,033 18.4% 1,613 73.0% 566 High 5.2% 914 11.4% 1,726 45.9% 234 Industry Tech and internet-related 10.4% 521 22.7% 1,031 81.1% 576 Non-technology 6.3% 1,461 11.3% 2,353 23.9% 227 Segmented by venture capital backing NonVC-backed 7.1% 1,437 13.8% 1,993 38.5% 316 VC-backed 8.0% 545 16.2% 1,391 82.2% 487 Segmented by share overhang Low 7.8% 886 11.8% 1,836 26.1% 134 High 7.0% 1,096 18.2% 1,548 72.7% 669 Segmented by underwriter prestige Low-prestige 9.1% 1,119 12.9% 1,294 35.1% 151 High-prestige 5.1% 863 15.9% 2,090 71.9% 652 Segmented by whether the offer price exceeds the maximum of the file price range Revised up 20.5% 246 32.0% 775 119.0% 362 Not revised up 5.5% 1,725 9.6% 2,609 20.6% 441 All 7.4% 1,982 14.8% 3,384 65.0% 803
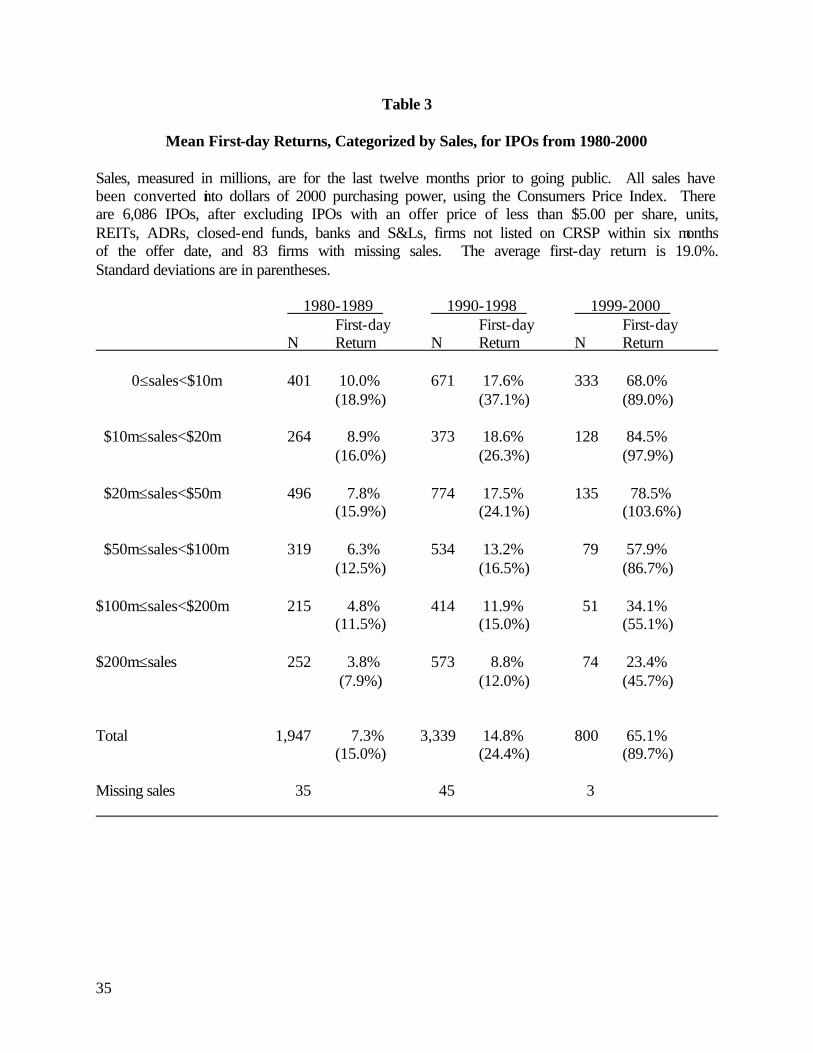
35
Table 3
Mean First-day Returns, Categorized by Sales, for IPOs from 1980-2000
Sales, measured in millions, are for the last twelve months prior to going public. All sales have been converted into dollars of 2000 purchasing power, using the Consumers Price Index. There are 6,086 IPOs, after excluding IPOs with an offer price of less than $5.00 per share, units, REITs, ADRs, closed-end funds, banks and S&Ls, firms not listed on CRSP within six months of the offer date, and 83 firms with missing sales. The average first-day return is 19.0%. Standard deviations are in parentheses. 1980-1989 1990-1998 1999-2000 First-day First-day First-day N Return N Return N Return 0≤sales<$10m 401 10.0% 671 17.6% 333 68.0% (18.9%) (37.1%) (89.0%) $10m≤sales<$20m 264 8.9% 373 18.6% 128 84.5% (16.0%) (26.3%) (97.9%) $20m≤sales<$50m 496 7.8% 774 17.5% 135 78.5% (15.9%) (24.1%) (103.6%) $50m≤sales<$100m 319 6.3% 534 13.2% 79 57.9% (12.5%) (16.5%) (86.7%) $100m≤sales<$200m 215 4.8% 414 11.9% 51 34.1% (11.5%) (15.0%) (55.1%) $200m≤sales 252 3.8% 573 8.8% 74 23.4% (7.9%) (12.0%) (45.7%) Total 1,947 7.3% 3,339 14.8% 800 65.1% (15.0%) (24.4%) (89.7%) Missing sales 35 45 3
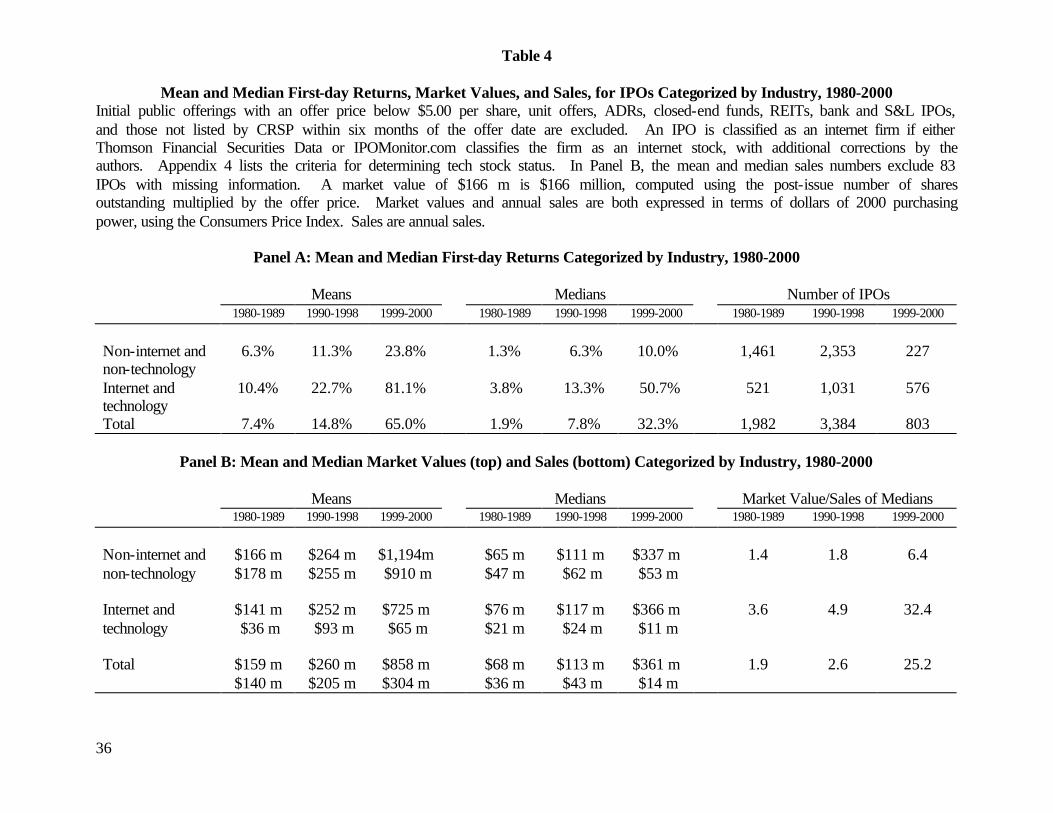
36
Table 4
Mean and Median First-day Returns, Market Values, and Sales, for IPOs Categorized by Industry, 1980-2000 Initial public offerings with an offer price below $5.00 per share, unit offers, ADRs, closed-end funds, REITs, bank and S&L IPOs, and those not listed by CRSP within six months of the offer date are excluded. An IPO is classified as an internet firm if either Thomson Financial Securities Data or IPOMonitor.com classifies the firm as an internet stock, with additional corrections by the authors. Appendix 4 lists the criteria for determining tech stock status. In Panel B, the mean and median sales numbers exclude 83 IPOs with missing information. A market value of $166 m is $166 million, computed using the post-issue number of shares outstanding multiplied by the offer price. Market values and annual sales are both expressed in terms of dollars of 2000 purchasing power, using the Consumers Price Index. Sales are annual sales.
Panel A: Mean and Median First-day Returns Categorized by Industry, 1980-2000
Means Medians Number of IPOs 1980-1989 1990-1998 1999-2000 1980-1989 1990-1998 1999-2000 1980-1989 1990-1998 1999-2000
Non-internet and non-technology
6.3%
11.3%
23.8%
1.3%
6.3%
10.0%
1,461
2,353
227
Internet and technology
10.4% 22.7% 81.1% 3.8% 13.3% 50.7% 521 1,031 576
Total 7.4% 14.8% 65.0% 1.9% 7.8% 32.3% 1,982 3,384 803
Panel B: Mean and Median Market Values (top) and Sales (bottom) Categorized by Industry, 1980-2000
Means Medians Market Value/Sales of Medians 1980-1989 1990-1998 1999-2000 1980-1989 1990-1998 1999-2000 1980-1989 1990-1998 1999-2000
Non-internet and non-technology
$166 m $178 m
$264 m $255 m
$1,194m $910 m
$65 m $47 m
$111 m $62 m
$337 m $53 m
1.4
1.8
6.4
Internet and technology
$141 m $36 m
$252 m $93 m
$725 m $65 m
$76 m $21 m
$117 m $24 m
$366 m $11 m
3.6 4.9 32.4
Total $159 m $140 m
$260 m $205 m
$858 m $304 m
$68 m $36 m
$113 m $43 m
$361 m $14 m
1.9 2.6 25.2
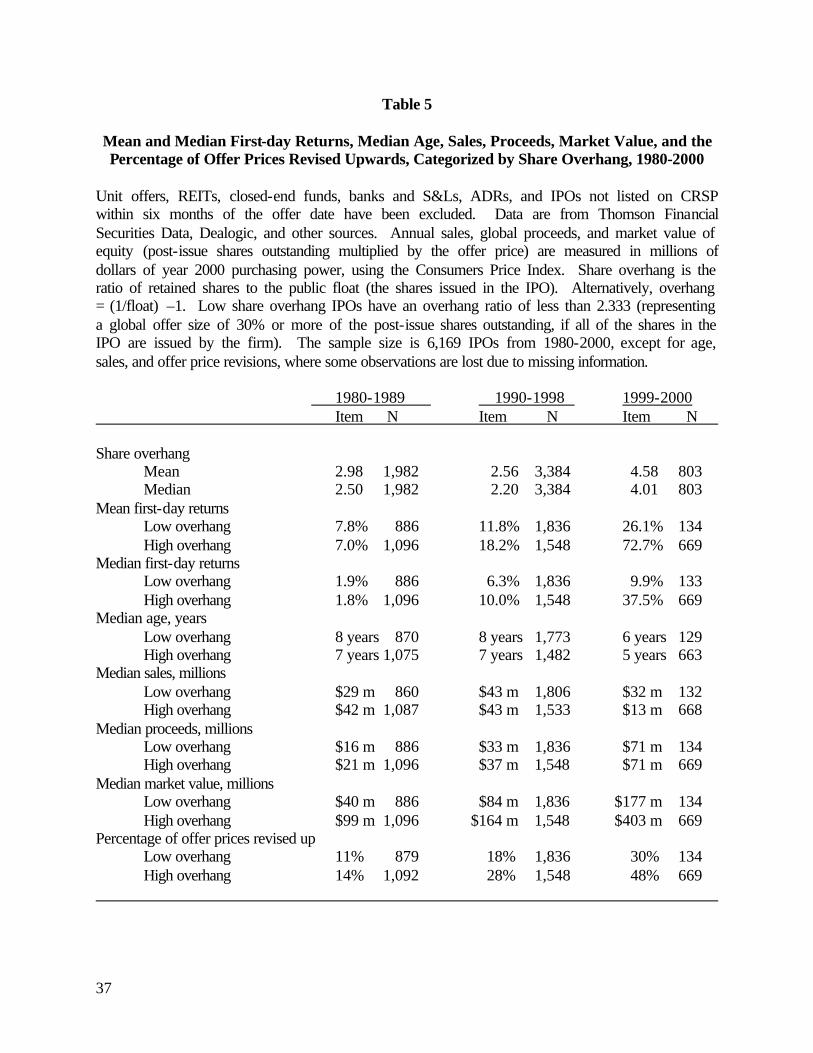
37
Table 5 Mean and Median First-day Returns, Median Age, Sales, Proceeds, Market Value, and the Percentage of Offer Prices Revised Upwards, Categorized by Share Overhang, 1980-2000
Unit offers, REITs, closed-end funds, banks and S&Ls, ADRs, and IPOs not listed on CRSP within six months of the offer date have been excluded. Data are from Thomson Financial Securities Data, Dealogic, and other sources. Annual sales, global proceeds, and market value of equity (post-issue shares outstanding multiplied by the offer price) are measured in millions of dollars of year 2000 purchasing power, using the Consumers Price Index. Share overhang is the ratio of retained shares to the public float (the shares issued in the IPO). Alternatively, overhang = (1/float) –1. Low share overhang IPOs have an overhang ratio of less than 2.333 (representing a global offer size of 30% or more of the post-issue shares outstanding, if all of the shares in the IPO are issued by the firm). The sample size is 6,169 IPOs from 1980-2000, except for age, sales, and offer price revisions, where some observations are lost due to missing information. 1980-1989 1990-1998 1999-2000 Item N Item N Item N Share overhang Mean 2.98 1,982 2.56 3,384 4.58 803 Median 2.50 1,982 2.20 3,384 4.01 803 Mean first-day returns Low overhang 7.8% 886 11.8% 1,836 26.1% 134 High overhang 7.0% 1,096 18.2% 1,548 72.7% 669 Median first-day returns Low overhang 1.9% 886 6.3% 1,836 9.9% 133 High overhang 1.8% 1,096 10.0% 1,548 37.5% 669 Median age, years Low overhang 8 years 870 8 years 1,773 6 years 129 High overhang 7 years 1,075 7 years 1,482 5 years 663 Median sales, millions Low overhang $29 m 860 $43 m 1,806 $32 m 132 High overhang $42 m 1,087 $43 m 1,533 $13 m 668 Median proceeds, millions Low overhang $16 m 886 $33 m 1,836 $71 m 134 High overhang $21 m 1,096 $37 m 1,548 $71 m 669 Median market value, millions Low overhang $40 m 886 $84 m 1,836 $177 m 134 High overhang $99 m 1,096 $164 m 1,548 $403 m 669 Percentage of offer prices revised up Low overhang 11% 879 18% 1,836 30% 134 High overhang 14% 1,092 28% 1,548 48% 669
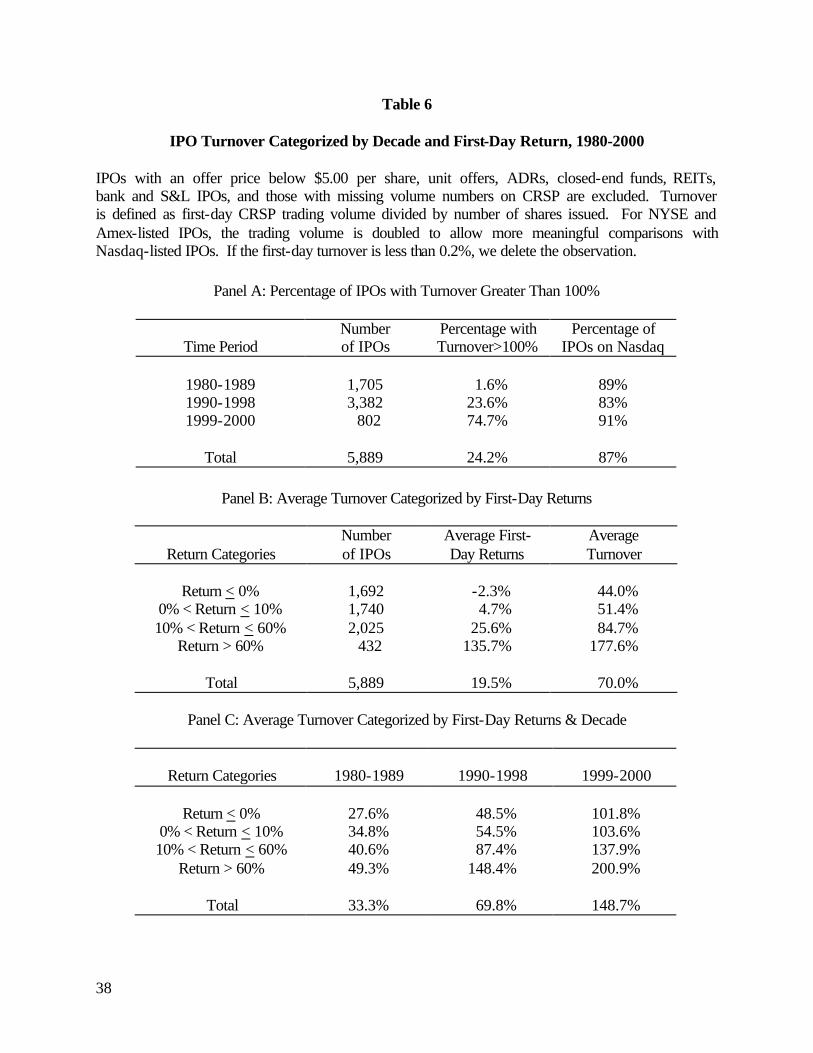
38
Table 6
IPO Turnover Categorized by Decade and First-Day Return, 1980-2000 IPOs with an offer price below $5.00 per share, unit offers, ADRs, closed-end funds, REITs, bank and S&L IPOs, and those with missing volume numbers on CRSP are excluded. Turnover is defined as first-day CRSP trading volume divided by number of shares issued. For NYSE and Amex-listed IPOs, the trading volume is doubled to allow more meaningful comparisons with Nasdaq-listed IPOs. If the first-day turnover is less than 0.2%, we delete the observation.
Panel A: Percentage of IPOs with Turnover Greater Than 100%
Time Period Number of IPOs
Percentage with Turnover>100%
Percentage of IPOs on Nasdaq
1980-1989
1,705
1.6%
89%
1990-1998 3,382 23.6% 83% 1999-2000 802 74.7% 91%
Total
5,889
24.2%
87%
Panel B: Average Turnover Categorized by First-Day Returns
Return Categories Number of IPOs
Average First-Day Returns
Average Turnover
Return < 0%
1,692
-2.3%
44.0%
0% < Return < 10% 1,740 4.7% 51.4% 10% < Return < 60% 2,025 25.6% 84.7%
Return > 60% 432 135.7% 177.6%
Total
5,889
19.5%
70.0%
Panel C: Average Turnover Categorized by First-Day Returns & Decade
Return Categories
1980-1989
1990-1998
1999-2000
Return < 0%
27.6%
48.5%
101.8%
0% < Return < 10% 34.8% 54.5% 103.6% 10% < Return < 60% 40.6% 87.4% 137.9%
Return > 60% 49.3% 148.4% 200.9%
Total
33.3%
69.8%
148.7%
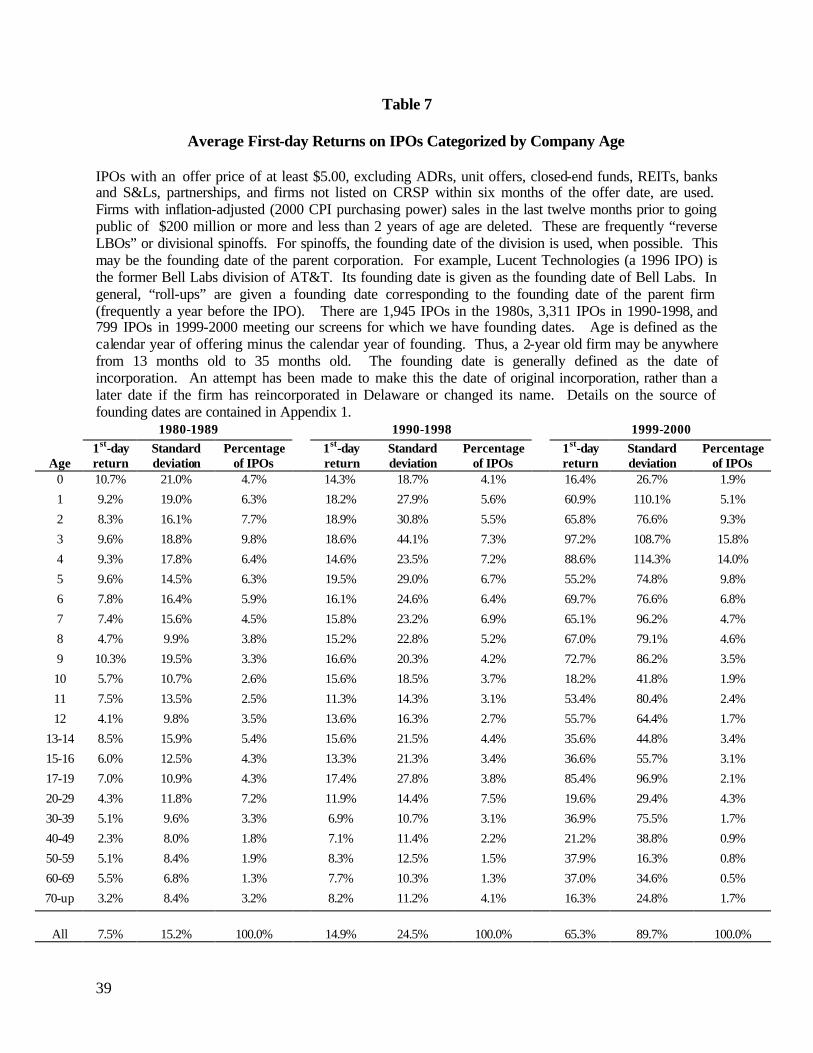
39
Table 7
Average First-day Returns on IPOs Categorized by Company Age IPOs with an offer price of at least $5.00, excluding ADRs, unit offers, closed-end funds, REITs, banks and S&Ls, partnerships, and firms not listed on CRSP within six months of the offer date, are used. Firms with inflation-adjusted (2000 CPI purchasing power) sales in the last twelve months prior to going public of $200 million or more and less than 2 years of age are deleted. These are frequently “reverse LBOs” or divisional spinoffs. For spinoffs, the founding date of the division is used, when possible. This may be the founding date of the parent corporation. For example, Lucent Technologies (a 1996 IPO) is the former Bell Labs division of AT&T. Its founding date is given as the founding date of Bell Labs. In general, “roll-ups” are given a founding date corresponding to the founding date of the parent firm (frequently a year before the IPO). There are 1,945 IPOs in the 1980s, 3,311 IPOs in 1990-1998, and 799 IPOs in 1999-2000 meeting our screens for which we have founding dates. Age is defined as the calendar year of offering minus the calendar year of founding. Thus, a 2-year old firm may be anywhere from 13 months old to 35 months old. The founding date is generally defined as the date of incorporation. An attempt has been made to make this the date of original incorporation, rather than a later date if the firm has reincorporated in Delaware or changed its name. Details on the source of founding dates are contained in Appendix 1.
1980-1989 1990-1998 1999-2000
Age 1st-day return
Standard deviation
Percentage of IPOs
1st-day return
Standard deviation
Percentage of IPOs
1st-day return
Standard deviation
Percentage of IPOs
0 10.7% 21.0% 4.7% 14.3% 18.7% 4.1% 16.4% 26.7% 1.9%
1 9.2% 19.0% 6.3% 18.2% 27.9% 5.6% 60.9% 110.1% 5.1%
2 8.3% 16.1% 7.7% 18.9% 30.8% 5.5% 65.8% 76.6% 9.3%
3 9.6% 18.8% 9.8% 18.6% 44.1% 7.3% 97.2% 108.7% 15.8%
4 9.3% 17.8% 6.4% 14.6% 23.5% 7.2% 88.6% 114.3% 14.0%
5 9.6% 14.5% 6.3% 19.5% 29.0% 6.7% 55.2% 74.8% 9.8%
6 7.8% 16.4% 5.9% 16.1% 24.6% 6.4% 69.7% 76.6% 6.8%
7 7.4% 15.6% 4.5% 15.8% 23.2% 6.9% 65.1% 96.2% 4.7%
8 4.7% 9.9% 3.8% 15.2% 22.8% 5.2% 67.0% 79.1% 4.6%
9 10.3% 19.5% 3.3% 16.6% 20.3% 4.2% 72.7% 86.2% 3.5%
10 5.7% 10.7% 2.6% 15.6% 18.5% 3.7% 18.2% 41.8% 1.9%
11 7.5% 13.5% 2.5% 11.3% 14.3% 3.1% 53.4% 80.4% 2.4%
12 4.1% 9.8% 3.5% 13.6% 16.3% 2.7% 55.7% 64.4% 1.7%
13-14 8.5% 15.9% 5.4% 15.6% 21.5% 4.4% 35.6% 44.8% 3.4%
15-16 6.0% 12.5% 4.3% 13.3% 21.3% 3.4% 36.6% 55.7% 3.1%
17-19 7.0% 10.9% 4.3% 17.4% 27.8% 3.8% 85.4% 96.9% 2.1%
20-29 4.3% 11.8% 7.2% 11.9% 14.4% 7.5% 19.6% 29.4% 4.3%
30-39 5.1% 9.6% 3.3% 6.9% 10.7% 3.1% 36.9% 75.5% 1.7%
40-49 2.3% 8.0% 1.8% 7.1% 11.4% 2.2% 21.2% 38.8% 0.9%
50-59 5.1% 8.4% 1.9% 8.3% 12.5% 1.5% 37.9% 16.3% 0.8%
60-69 5.5% 6.8% 1.3% 7.7% 10.3% 1.3% 37.0% 34.6% 0.5%
70-up 3.2% 8.4% 3.2% 8.2% 11.2% 4.1% 16.3% 24.8% 1.7%
All
7.5%
15.2%
100.0%
14.9%
24.5%
100.0%
65.3%
89.7%
100.0%
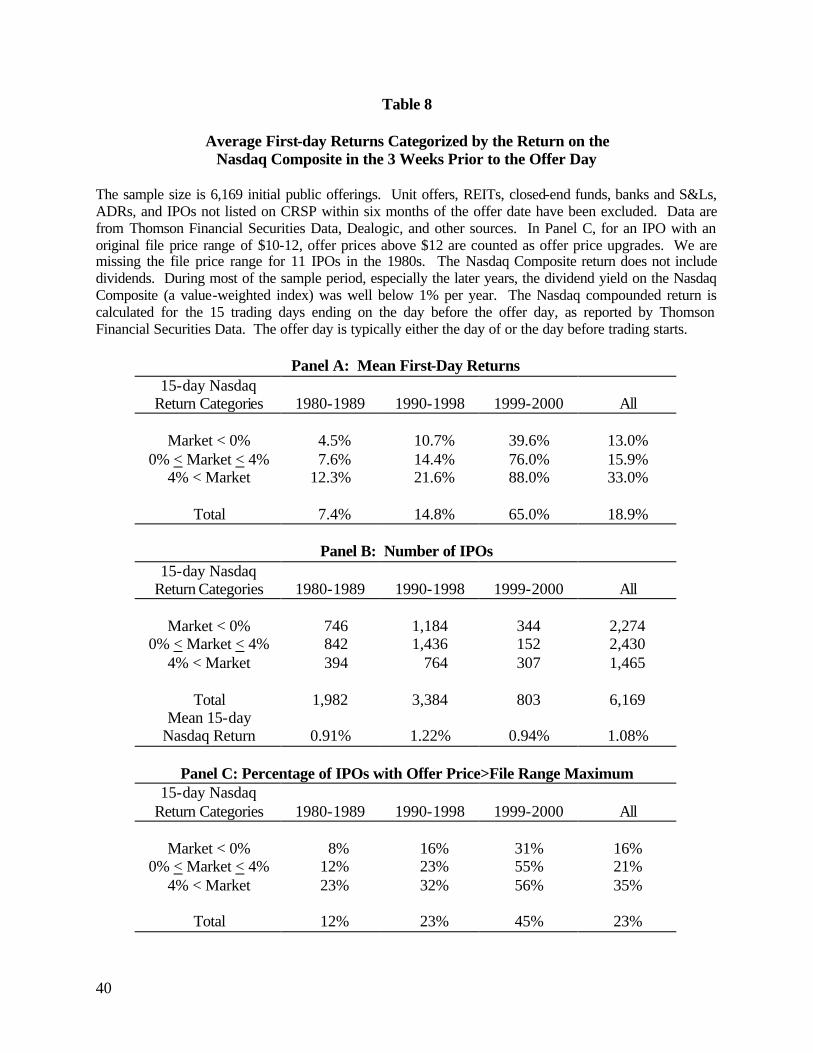
40
Table 8
Average First-day Returns Categorized by the Return on the Nasdaq Composite in the 3 Weeks Prior to the Offer Day
The sample size is 6,169 initial public offerings. Unit offers, REITs, closed-end funds, banks and S&Ls, ADRs, and IPOs not listed on CRSP within six months of the offer date have been excluded. Data are from Thomson Financial Securities Data, Dealogic, and other sources. In Panel C, for an IPO with an original file price range of $10-12, offer prices above $12 are counted as offer price upgrades. We are missing the file price range for 11 IPOs in the 1980s. The Nasdaq Composite return does not include dividends. During most of the sample period, especially the later years, the dividend yield on the Nasdaq Composite (a value-weighted index) was well below 1% per year. The Nasdaq compounded return is calculated for the 15 trading days ending on the day before the offer day, as reported by Thomson Financial Securities Data. The offer day is typically either the day of or the day before trading starts.
Panel A: Mean First-Day Returns
15-day Nasdaq Return Categories
1980-1989
1990-1998
1999-2000
All
Market < 0%
4.5%
10.7%
39.6%
13.0%
0% < Market < 4% 7.6% 14.4% 76.0% 15.9% 4% < Market 12.3% 21.6% 88.0% 33.0%
Total
7.4%
14.8%
65.0%
18.9%
Panel B: Number of IPOs
15-day Nasdaq Return Categories
1980-1989
1990-1998
1999-2000
All
Market < 0%
746
1,184
344
2,274
0% < Market < 4% 842 1,436 152 2,430 4% < Market 394 764 307 1,465
Total
1,982
3,384
803
6,169
Mean 15-day Nasdaq Return
0.91%
1.22%
0.94%
1.08%
Panel C: Percentage of IPOs with Offer Price>File Range Maximum
15-day Nasdaq Return Categories
1980-1989
1990-1998
1999-2000
All
Market < 0%
8%
16%
31%
16%
0% < Market < 4% 12% 23% 55% 21% 4% < Market 23% 32% 56% 35%
Total
12%
23%
45%
23%
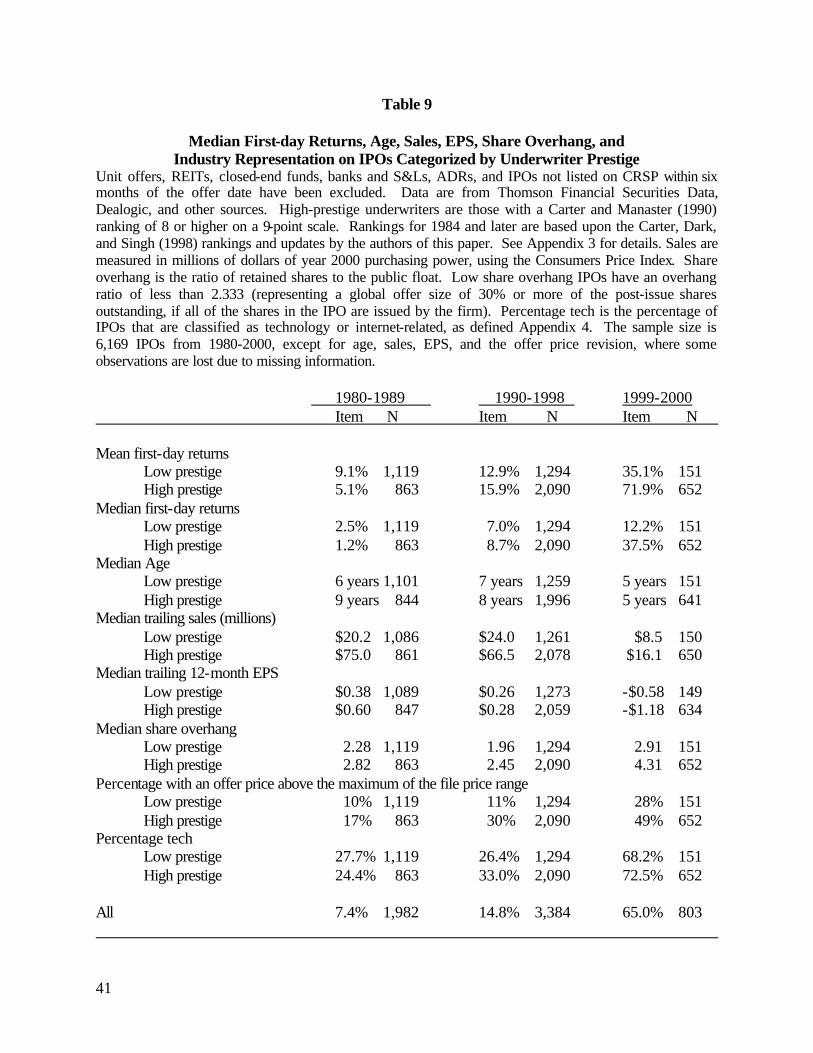
41
Table 9
Median First-day Returns, Age, Sales, EPS, Share Overhang, and Industry Representation on IPOs Categorized by Underwriter Prestige
Unit offers, REITs, closed-end funds, banks and S&Ls, ADRs, and IPOs not listed on CRSP within six months of the offer date have been excluded. Data are from Thomson Financial Securities Data, Dealogic, and other sources. High-prestige underwriters are those with a Carter and Manaster (1990) ranking of 8 or higher on a 9-point scale. Rankings for 1984 and later are based upon the Carter, Dark, and Singh (1998) rankings and updates by the authors of this paper. See Appendix 3 for details. Sales are measured in millions of dollars of year 2000 purchasing power, using the Consumers Price Index. Share overhang is the ratio of retained shares to the public float. Low share overhang IPOs have an overhang ratio of less than 2.333 (representing a global offer size of 30% or more of the post-issue shares outstanding, if all of the shares in the IPO are issued by the firm). Percentage tech is the percentage of IPOs that are classified as technology or internet-related, as defined Appendix 4. The sample size is 6,169 IPOs from 1980-2000, except for age, sales, EPS, and the offer price revision, where some observations are lost due to missing information. 1980-1989 1990-1998 1999-2000 Item N Item N Item N Mean first-day returns Low prestige 9.1% 1,119 12.9% 1,294 35.1% 151 High prestige 5.1% 863 15.9% 2,090 71.9% 652 Median first-day returns Low prestige 2.5% 1,119 7.0% 1,294 12.2% 151 High prestige 1.2% 863 8.7% 2,090 37.5% 652 Median Age Low prestige 6 years 1,101 7 years 1,259 5 years 151 High prestige 9 years 844 8 years 1,996 5 years 641 Median trailing sales (millions) Low prestige $20.2 1,086 $24.0 1,261 $8.5 150 High prestige $75.0 861 $66.5 2,078 $16.1 650 Median trailing 12-month EPS Low prestige $0.38 1,089 $0.26 1,273 -$0.58 149 High prestige $0.60 847 $0.28 2,059 -$1.18 634 Median share overhang Low prestige 2.28 1,119 1.96 1,294 2.91 151 High prestige 2.82 863 2.45 2,090 4.31 652 Percentage with an offer price above the maximum of the file price range Low prestige 10% 1,119 11% 1,294 28% 151 High prestige 17% 863 30% 2,090 49% 652 Percentage tech Low prestige 27.7% 1,119 26.4% 1,294 68.2% 151 High prestige 24.4% 863 33.0% 2,090 72.5% 652 All 7.4% 1,982 14.8% 3,384 65.0% 803
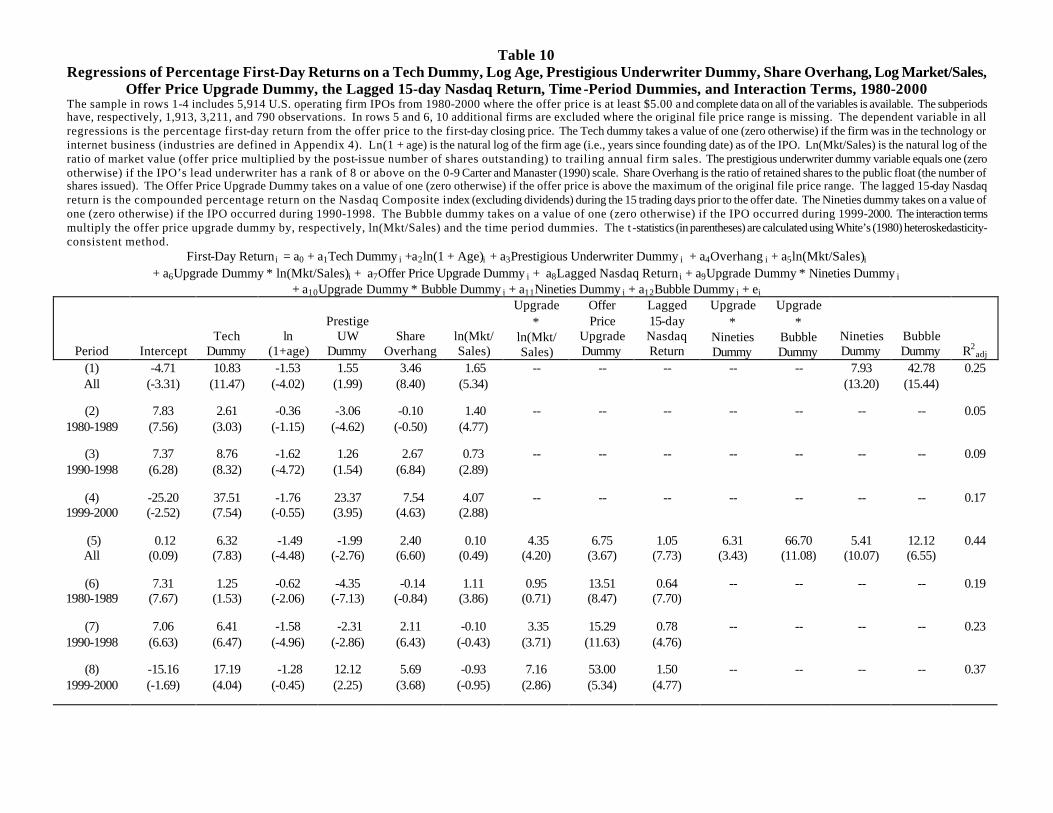
Table 10 Regressions of Percentage First-Day Returns on a Tech Dummy, Log Age, Prestigious Underwriter Dummy, Share Overhang, Log Market/Sales,
Offer Price Upgrade Dummy, the Lagged 15-day Nasdaq Return, Time-Period Dummies, and Interaction Terms, 1980-2000 The sample in rows 1-4 includes 5,914 U.S. operating firm IPOs from 1980-2000 where the offer price is at least $5.00 and complete data on all of the variables is available. The subperiods have, respectively, 1,913, 3,211, and 790 observations. In rows 5 and 6, 10 additional firms are excluded where the original file price range is missing. The dependent variable in all regressions is the percentage first-day return from the offer price to the first-day closing price. The Tech dummy takes a value of one (zero otherwise) if the firm was in the technology or internet business (industries are defined in Appendix 4). Ln(1 + age) is the natural log of the firm age (i.e., years since founding date) as of the IPO. Ln(Mkt/Sales) is the natural log of the ratio of market value (offer price multiplied by the post-issue number of shares outstanding) to trailing annual firm sales. The prestigious underwriter dummy variable equals one (zero otherwise) if the IPO’s lead underwriter has a rank of 8 or above on the 0-9 Carter and Manaster (1990) scale. Share Overhang is the ratio of retained shares to the public float (the number of shares issued). The Offer Price Upgrade Dummy takes on a value of one (zero otherwise) if the offer price is above the maximum of the original file price range. The lagged 15-day Nasdaq return is the compounded percentage return on the Nasdaq Composite index (excluding dividends) during the 15 trading days prior to the offer date. The Nineties dummy takes on a value of one (zero otherwise) if the IPO occurred during 1990-1998. The Bubble dummy takes on a value of one (zero otherwise) if the IPO occurred during 1999-2000. The interaction terms multiply the offer price upgrade dummy by, respectively, ln(Mkt/Sales) and the time period dummies. The t -statistics (in parentheses) are calculated using White’s (1980) heteroskedasticity-consistent method.
First-Day Return i = a0 + a1Tech Dummy i +a2ln(1 + Age)i + a3Prestigious Underwriter Dummy i + a4Overhang i + a5ln(Mkt/Sales)i + a6Upgrade Dummy ∗ ln(Mkt/Sales)i + a7Offer Price Upgrade Dummy i + a8Lagged Nasdaq Return i + a9Upgrade Dummy ∗ Nineties Dummy i
+ a10Upgrade Dummy ∗ Bubble Dummy i + a11Nineties Dummy i + a12Bubble Dummy i + ei
Period
Intercept
Tech Dummy
ln (1+age)
Prestige
UW Dummy
Share Overhang
ln(Mkt/ Sales)
Upgrade ∗
ln(Mkt/ Sales)
Offer Price
Upgrade Dummy
Lagged 15-day Nasdaq Return
Upgrade ∗
Nineties Dummy
Upgrade ∗
Bubble Dummy
Nineties Dummy
Bubble Dummy
R2adj
(1) All
-4.71 (-3.31)
10.83 (11.47)
-1.53 (-4.02)
1.55 (1.99)
3.46 (8.40)
1.65 (5.34)
-- -- -- -- -- 7.93 (13.20)
42.78 (15.44)
0.25
(2) 1980-1989
7.83 (7.56)
2.61 (3.03)
-0.36 (-1.15)
-3.06 (-4.62)
-0.10 (-0.50)
1.40 (4.77)
-- -- -- -- -- -- -- 0.05
(3) 1990-1998
7.37 (6.28)
8.76 (8.32)
-1.62 (-4.72)
1.26 (1.54)
2.67 (6.84)
0.73 (2.89)
-- -- -- -- -- -- -- 0.09
(4) 1999-2000
-25.20 (-2.52)
37.51 (7.54)
-1.76 (-0.55)
23.37 (3.95)
7.54 (4.63)
4.07 (2.88)
-- -- -- -- -- -- -- 0.17
(5) All
0.12 (0.09)
6.32 (7.83)
-1.49 (-4.48)
-1.99 (-2.76)
2.40 (6.60)
0.10 (0.49)
4.35 (4.20)
6.75 (3.67)
1.05 (7.73)
6.31 (3.43)
66.70 (11.08)
5.41 (10.07)
12.12 (6.55)
0.44
(6) 1980-1989
7.31 (7.67)
1.25 (1.53)
-0.62 (-2.06)
-4.35 (-7.13)
-0.14 (-0.84)
1.11 (3.86)
0.95 (0.71)
13.51 (8.47)
0.64 (7.70)
-- -- -- -- 0.19
(7) 1990-1998
7.06 (6.63)
6.41 (6.47)
-1.58 (-4.96)
-2.31 (-2.86)
2.11 (6.43)
-0.10 (-0.43)
3.35 (3.71)
15.29 (11.63)
0.78 (4.76)
-- -- -- -- 0.23
(8) 1999-2000
-15.16 (-1.69)
17.19 (4.04)
-1.28 (-0.45)
12.12 (2.25)
5.69 (3.68)
-0.93 (-0.95)
7.16 (2.86)
53.00 (5.34)
1.50 (4.77)
-- -- -- -- 0.37
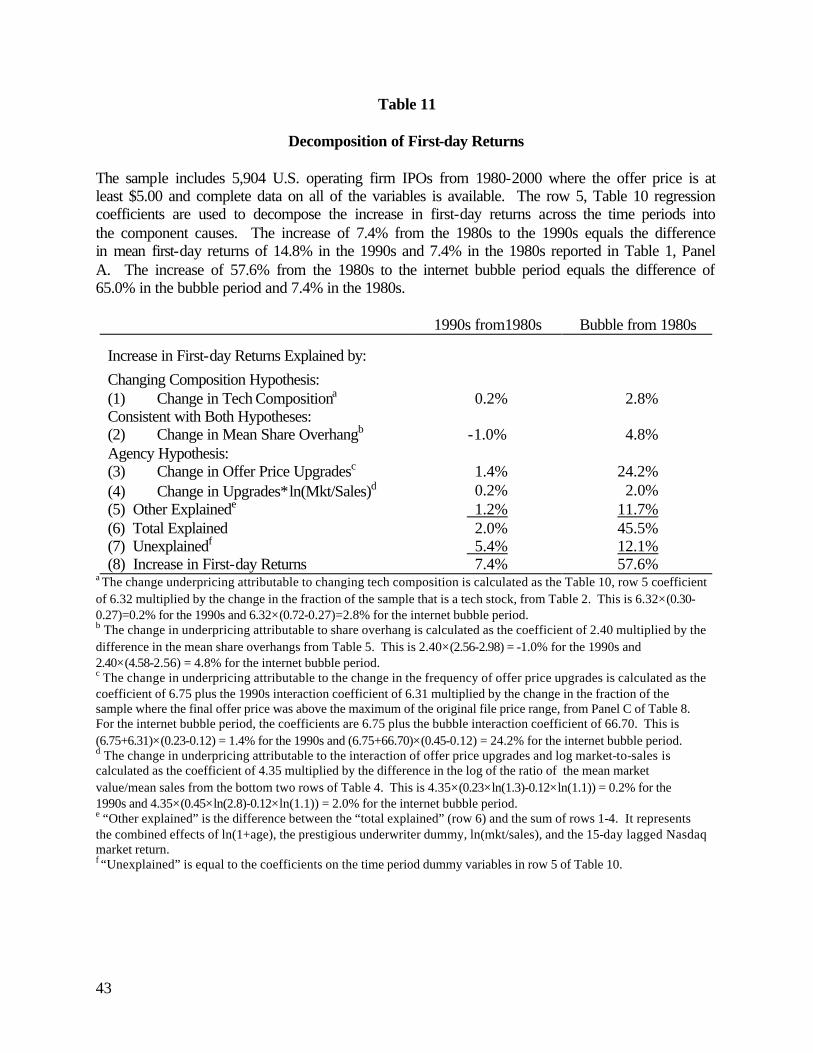
43
Table 11
Decomposition of First-day Returns
The sample includes 5,904 U.S. operating firm IPOs from 1980-2000 where the offer price is at least $5.00 and complete data on all of the variables is available. The row 5, Table 10 regression coefficients are used to decompose the increase in first-day returns across the time periods into the component causes. The increase of 7.4% from the 1980s to the 1990s equals the difference in mean first-day returns of 14.8% in the 1990s and 7.4% in the 1980s reported in Table 1, Panel A. The increase of 57.6% from the 1980s to the internet bubble period equals the difference of 65.0% in the bubble period and 7.4% in the 1980s.
1990s from1980s Bubble from 1980s
Increase in First-day Returns Explained by:
Changing Composition Hypothesis: (1) Change in Tech Compositiona 0.2% 2.8% Consistent with Both Hypotheses: (2) Change in Mean Share Overhangb -1.0% 4.8% Agency Hypothesis: (3) Change in Offer Price Upgradesc 1.4% 24.2% (4) Change in Upgrades∗ln(Mkt/Sales)d 0.2% 2.0% (5) Other Explainede 1.2% 11.7% (6) Total Explained 2.0% 45.5% (7) Unexplainedf 5.4% 12.1% (8) Increase in First-day Returns 7.4% 57.6%
a The change underpricing attributable to changing tech composition is calculated as the Table 10, row 5 coefficient of 6.32 multiplied by the change in the fraction of the sample that is a tech stock, from Table 2. This is 6.32×(0.30-0.27)=0.2% for the 1990s and 6.32×(0.72-0.27)=2.8% for the internet bubble period. b The change in underpricing attributable to share overhang is calculated as the coefficient of 2.40 multiplied by the difference in the mean share overhangs from Table 5. This is 2.40×(2.56-2.98) = -1.0% for the 1990s and 2.40×(4.58-2.56) = 4.8% for the internet bubble period. c The change in underpricing attributable to the change in the frequency of offer price upgrades is calculated as the coefficient of 6.75 plus the 1990s interaction coefficient of 6.31 multiplied by the change in the fraction of the sample where the final offer price was above the maximum of the original file price range, from Panel C of Table 8. For the internet bubble period, the coefficients are 6.75 plus the bubble interaction coefficient of 66.70. This is (6.75+6.31)×(0.23-0.12) = 1.4% for the 1990s and (6.75+66.70)×(0.45-0.12) = 24.2% for the internet bubble period. d The change in underpricing attributable to the interaction of offer price upgrades and log market-to-sales is calculated as the coefficient of 4.35 multiplied by the difference in the log of the ratio of the mean market value/mean sales from the bottom two rows of Table 4. This is 4.35×(0.23×ln(1.3)-0.12×ln(1.1)) = 0.2% for the 1990s and 4.35×(0.45×ln(2.8)-0.12×ln(1.1)) = 2.0% for the internet bubble period. e “Other explained” is the difference between the “total explained” (row 6) and the sum of rows 1-4. It represents the combined effects of ln(1+age), the prestigious underwriter dummy, ln(mkt/sales), and the 15-day lagged Nasdaq market return. f “Unexplained” is equal to the coefficients on the time period dummy variables in row 5 of Table 10.
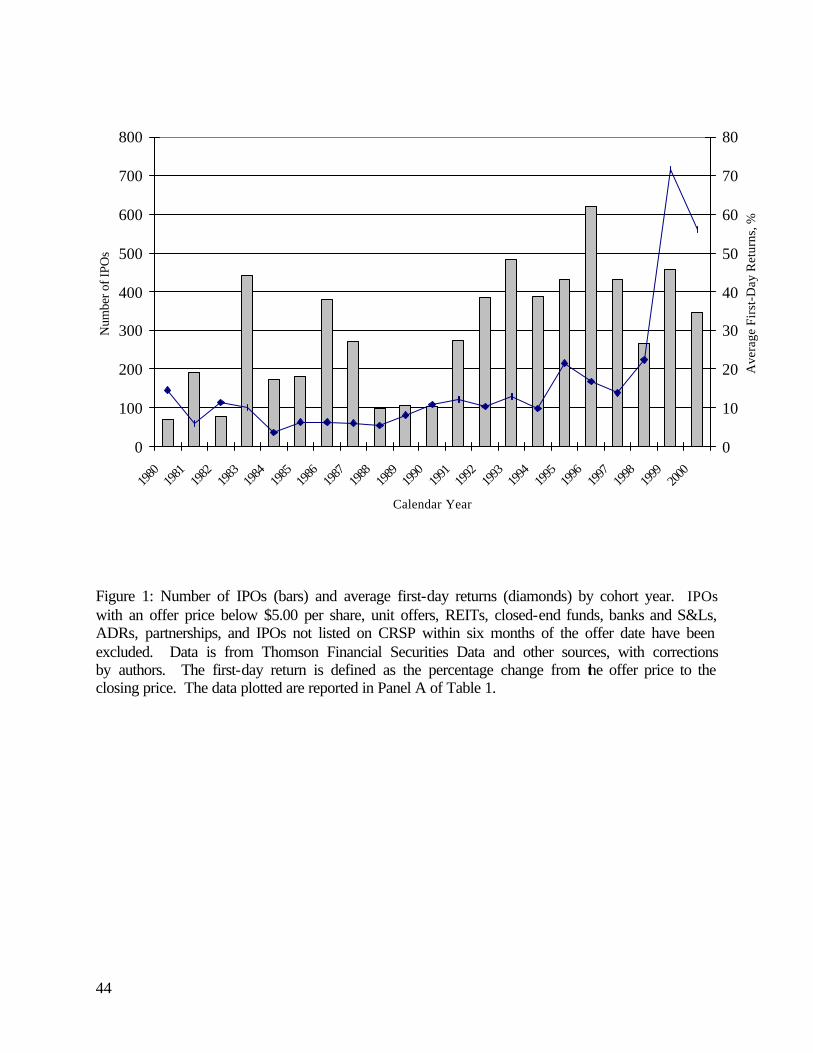
44
Figure 1: Number of IPOs (bars) and average first-day returns (diamonds) by cohort year. IPOs with an offer price below $5.00 per share, unit offers, REITs, closed-end funds, banks and S&Ls, ADRs, partnerships, and IPOs not listed on CRSP within six months of the offer date have been excluded. Data is from Thomson Financial Securities Data and other sources, with corrections by authors. The first-day return is defined as the percentage change from the offer price to the closing price. The data plotted are reported in Panel A of Table 1.
0
100
200
300
400
500
600
700
800
1980
1981
1982
1983
1984
1985
1986
1987
1988
1989
1990
1991
1992
1993
1994
1995
1996
1997
1998
1999
2000
Calendar Year
Num
ber
of I
POs
0
10
20
30
40
50
60
70
80
Ave
rage
Fir
st-D
ay R
etur
ns, %
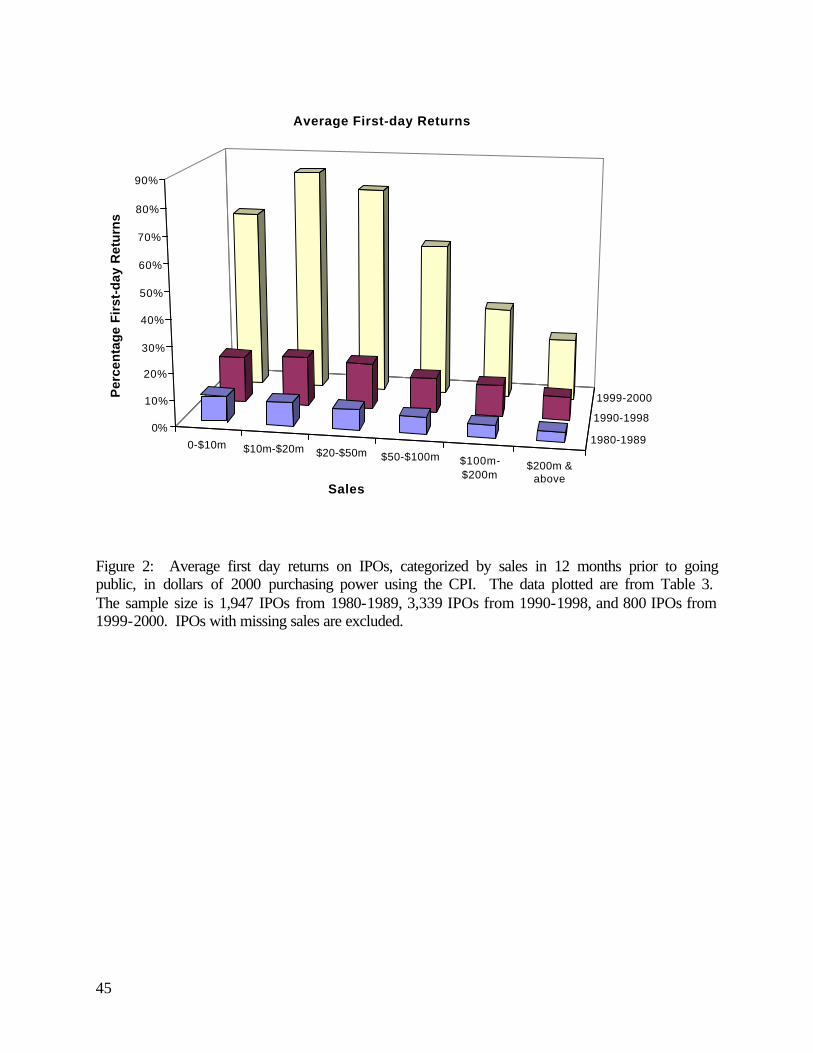
45
0-$10m $10m-$20m $20-$50m $50-$100m $100m-$200m
$200m &above
1980-1989
1990-1998
1999-2000
0%
10%
20%
30%
40%
50%
60%
70%
80%
90%
Per
cen
tag
e F
irst
-day
Ret
urn
s
Sales
Average First-day Returns
Figure 2: Average first day returns on IPOs, categorized by sales in 12 months prior to going public, in dollars of 2000 purchasing power using the CPI. The data plotted are from Table 3. The sample size is 1,947 IPOs from 1980-1989, 3,339 IPOs from 1990-1998, and 800 IPOs from 1999-2000. IPOs with missing sales are excluded.
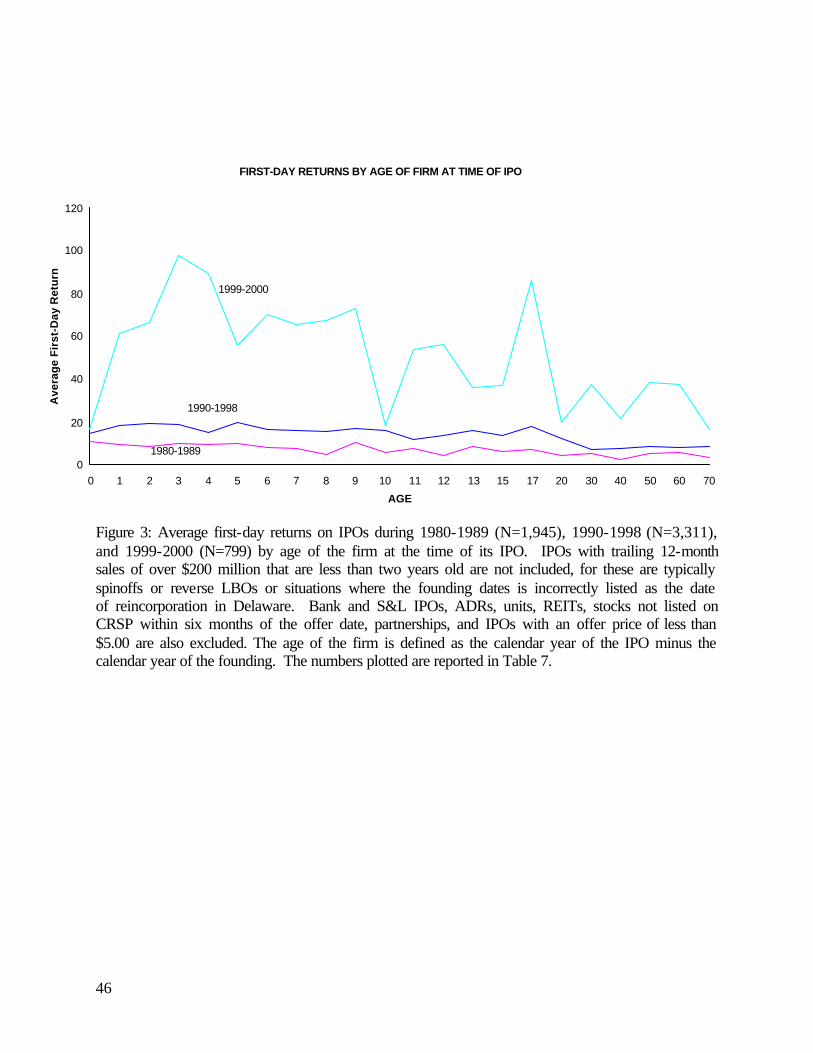
46
Figure 3: Average first-day returns on IPOs during 1980-1989 (N=1,945), 1990-1998 (N=3,311), and 1999-2000 (N=799) by age of the firm at the time of its IPO. IPOs with trailing 12-month sales of over $200 million that are less than two years old are not included, for these are typically spinoffs or reverse LBOs or situations where the founding dates is incorrectly listed as the date of reincorporation in Delaware. Bank and S&L IPOs, ADRs, units, REITs, stocks not listed on CRSP within six months of the offer date, partnerships, and IPOs with an offer price of less than $5.00 are also excluded. The age of the firm is defined as the calendar year of the IPO minus the calendar year of the founding. The numbers plotted are reported in Table 7.
FIRST-DAY RETURNS BY AGE OF FIRM AT TIME OF IPO
0
20
40
60
80
100
120
0 1 2 3 4 5 6 7 8 9 10 11 12 13 15 17 20 30 40 50 60 70
AGE
Ave
rag
e F
irst
-Day
Ret
urn
%
1999-2000
1990-1998
1980-1989
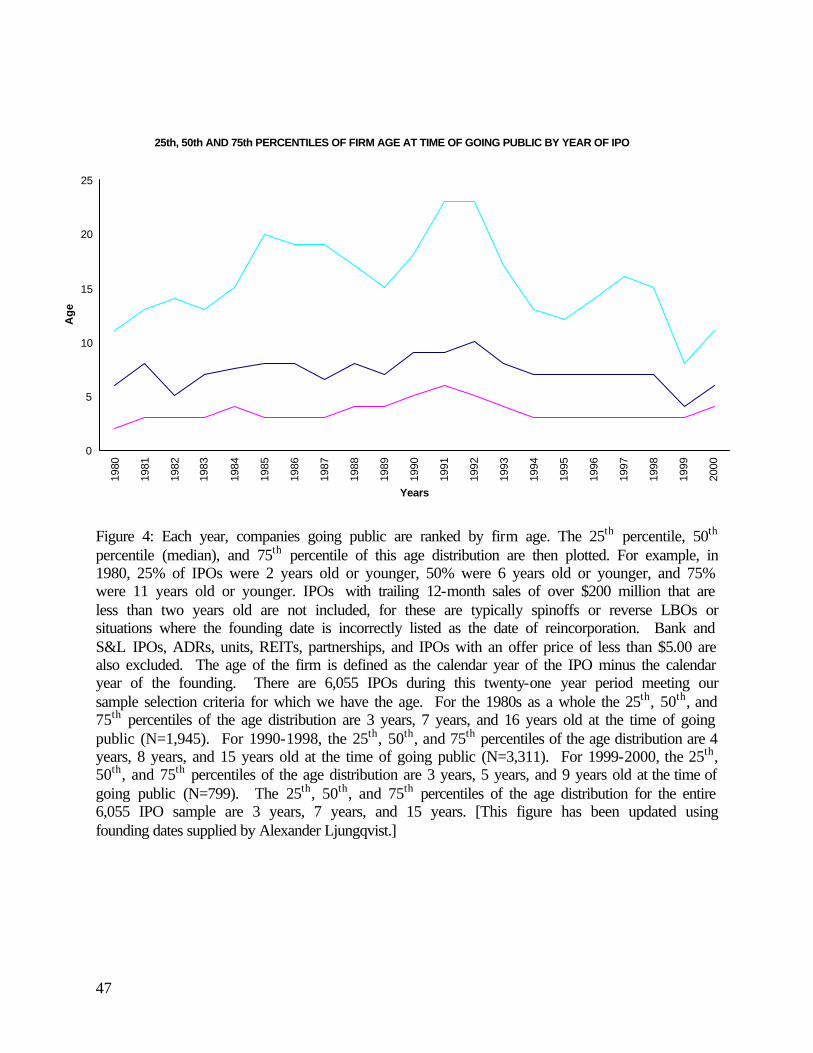
47
Figure 4: Each year, companies going public are ranked by firm age. The 25th percentile, 50th percentile (median), and 75th percentile of this age distribution are then plotted. For example, in 1980, 25% of IPOs were 2 years old or younger, 50% were 6 years old or younger, and 75% were 11 years old or younger. IPOs with trailing 12-month sales of over $200 million that are less than two years old are not included, for these are typically spinoffs or reverse LBOs or situations where the founding date is incorrectly listed as the date of reincorporation. Bank and S&L IPOs, ADRs, units, REITs, partnerships, and IPOs with an offer price of less than $5.00 are also excluded. The age of the firm is defined as the calendar year of the IPO minus the calendar year of the founding. There are 6,055 IPOs during this twenty-one year period meeting our sample selection criteria for which we have the age. For the 1980s as a whole the 25th, 50th, and 75th percentiles of the age distribution are 3 years, 7 years, and 16 years old at the time of going public (N=1,945). For 1990-1998, the 25th, 50th, and 75th percentiles of the age distribution are 4 years, 8 years, and 15 years old at the time of going public (N=3,311). For 1999-2000, the 25th, 50th, and 75th percentiles of the age distribution are 3 years, 5 years, and 9 years old at the time of going public (N=799). The 25th, 50th, and 75th percentiles of the age distribution for the entire 6,055 IPO sample are 3 years, 7 years, and 15 years. [This figure has been updated using founding dates supplied by Alexander Ljungqvist.]
25th, 50th AND 75th PERCENTILES OF FIRM AGE AT TIME OF GOING PUBLIC BY YEAR OF IPO
0
5
10
15
20
25
1980
1981
1982
1983
1984
1985
1986
1987
1988
1989
1990
1991
1992
1993
1994
1995
1996
1997
1998
1999
2000
Years
Ag
e