Embed Size (px)
Citation preview

WHY ESTIMATES NEVER SEEM TO ADD UP
Donald E. Shannon CPCM, Fellow, PMP

So There I Was in the Elevator – Just Me and the CEO
• The CEO (your boss’ boss) remembers your proposal for the XYZ project and asks you: “If we approve XYZ how much will it cost and when can it be ready?”
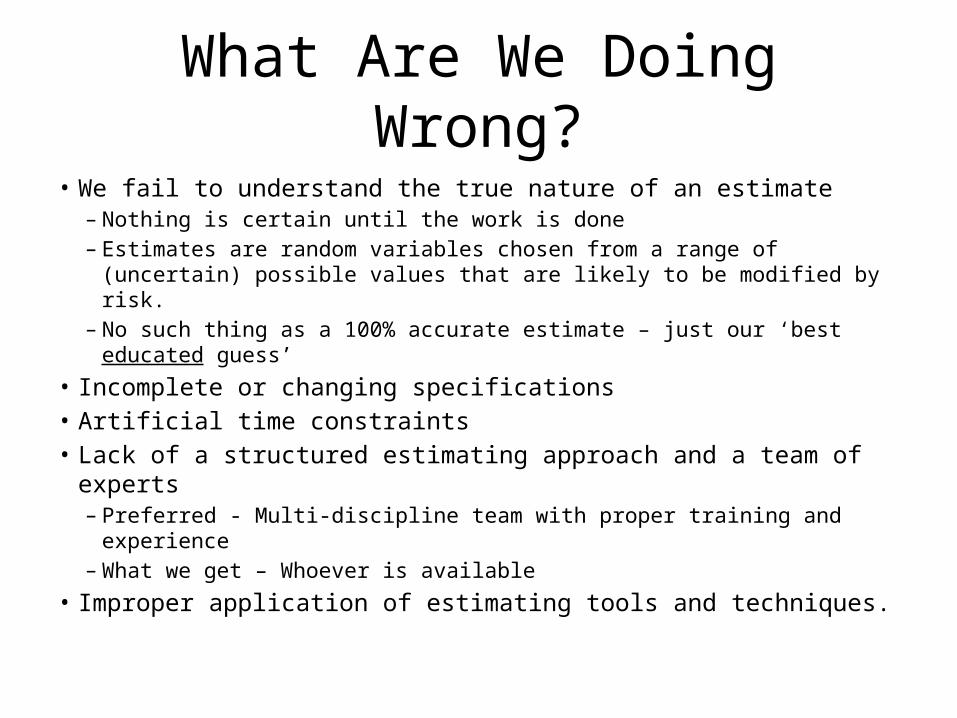
What Are We Doing Wrong?
• We fail to understand the true nature of an estimate– Nothing is certain until the work is done– Estimates are random variables chosen from a range of (uncertain)
possible values that are likely to be modified by risk.– No such thing as a 100% accurate estimate – just our ‘best educated
guess’• Incomplete or changing specifications • Artificial time constraints• Lack of a structured estimating approach and a team of experts
– Preferred - Multi-discipline team with proper training and experience– What we get – Whoever is available
• Improper application of estimating tools and techniques.

What could Go Wrong?
http://about.bgov.com/health-reforms-cost-73-billion-counting/?thx
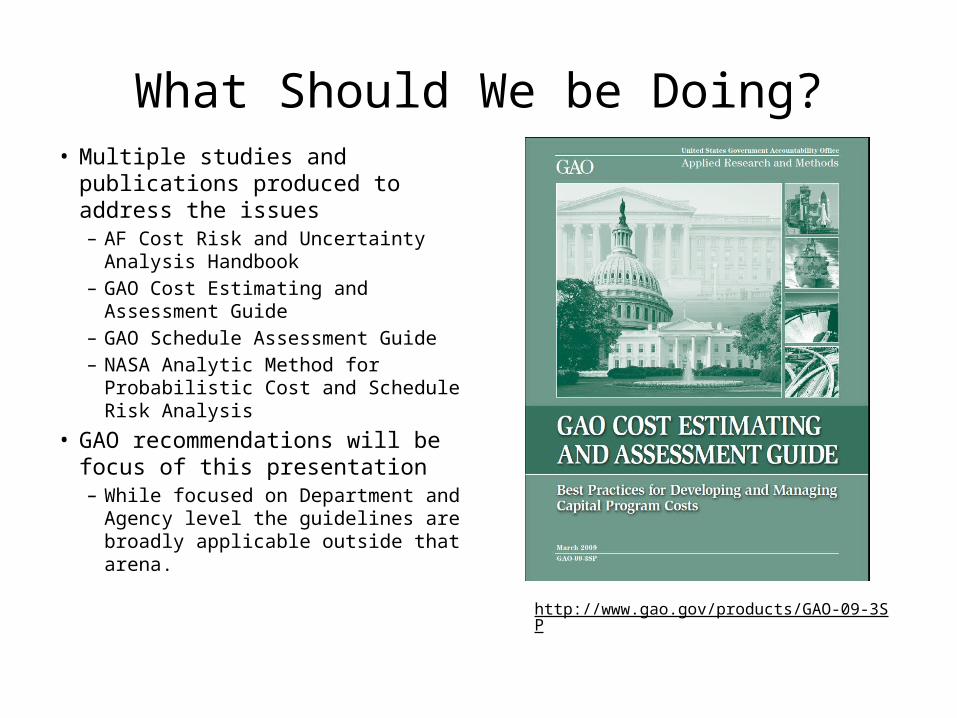
What Should We be Doing?• Multiple studies and publications
produced to address the issues– AF Cost Risk and Uncertainty Analysis
Handbook – GAO Cost Estimating and Assessment
Guide– GAO Schedule Assessment Guide– NASA Analytic Method for
Probabilistic Cost and Schedule Risk Analysis
• GAO recommendations will be focus of this presentation– While focused on Department and
Agency level the guidelines are broadly applicable outside that arena.
http://www.gao.gov/products/GAO-09-3SP

The Integrated Cost Estimating Model
• Best practices from GAO offer a holistic 12-step estimating approach– Integrates several, often discrete,
techniques into a unified whole• Traditional Cost Estimate• Technical Baseline
– Technology Roadmap– Work Breakdown Schedule
• Program Master Schedule• Risk and Uncertainty
– Resulting project model mathematically assessed using simulative or analytical tools
Risk Register
TechnologyRoadmap
Project Model
Traditional Cost Estimate
Master Schedule
WBS
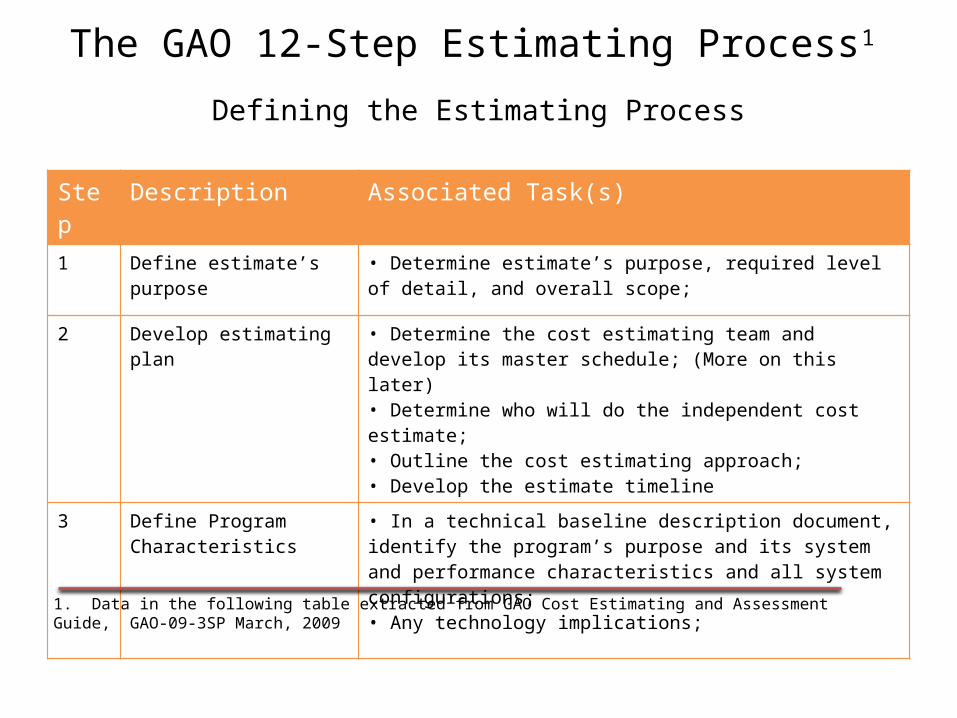
The GAO 12-Step Estimating Process1
Defining the Estimating Process
Step Description Associated Task(s)1 Define estimate’s purpose • Determine estimate’s purpose, required level of detail, and overall
scope;
2 Develop estimating plan • Determine the cost estimating team and develop its master schedule; (More on this later)• Determine who will do the independent cost estimate; • Outline the cost estimating approach;• Develop the estimate timeline
3 Define Program Characteristics
• In a technical baseline description document, identify the program’s purpose and its system and performance characteristics and all system configurations; • Any technology implications;
1. Data in the following table extracted from GAO Cost Estimating and Assessment Guide, GAO-09-3SP March, 2009

The GAO 12-Step Estimating ProcessStep Description Associated Task(s)3 Define program
characteristics• Its relationship to other existing systems, including predecessor or similar legacy systems;• Support (manpower, training, etc.) and security needs and risk items;• System quantities• Deployment and maintenance plans / concepts
4 Determine estimating structure
•Define a work breakdown structure (WBS) and describe each element in a WBS dictionary (a major automated information system may have only a cost element structure); • Choose the best estimating method for each WBS element; •Identify potential cross-checks for likely cost and schedule Drivers;• Develop a cost estimating checklist;

The GAO 12-Step Estimating ProcessStep Description Associated Task(s)5 Identify ground rules and
assumptions• Clearly define what the estimate includes and excludes;• Identify global and program-specific assumptions, such as the estimate’s base year, including time-phasing and life cycle; • Identify program schedule information by phase and program acquisition strategy;• Identify any schedule or budget constraints, inflation assumptions, and travel costs; • Specify GFE as well as the use of existing facilities or new modification or development; • Determine technology refresh cycles, technology assumptions, and new technology to be developed; • Define commonality with legacy systems and assumed heritage savings; • Describe effects of new ways of doing business
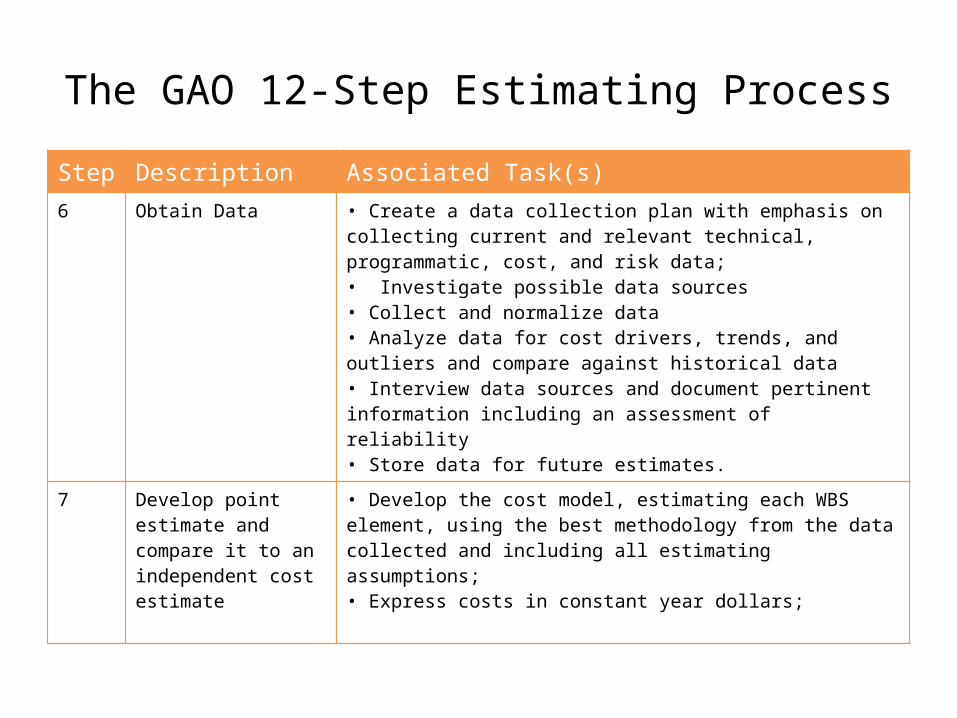
The GAO 12-Step Estimating ProcessStep Description Associated Task(s)6 Obtain Data • Create a data collection plan with emphasis on collecting current and
relevant technical, programmatic, cost, and risk data; • Investigate possible data sources• Collect and normalize data• Analyze data for cost drivers, trends, and outliers and compare against historical data• Interview data sources and document pertinent information including an assessment of reliability• Store data for future estimates.
7 Develop point estimate and compare it to an independent cost estimate
• Develop the cost model, estimating each WBS element, using the best methodology from the data collected and including all estimating assumptions;• Express costs in constant year dollars;

The GAO 12-Step Estimating Process
Step Description Associated Task(s)7 Develop point estimate
and compare it to an independent cost estimate
•Sum the WBS elements to develop the overall cost “point estimate”; • Validate the estimate by looking for errors such as double counting;• Compare point estimate vs. independent cost estimate and look for key differences;• Perform cross check on cost driver to see if results are similar;• Update model as new data becomes available
8 Conduct sensitivity analysis
• Test the sensitivity of cost elements to changes in estimating input values and key assumptions• Identify effects on the overall estimate of changing the program schedule or quantities;• Determine which assumptions are key cost drivers and which cost elements are affected most by changes
The GAO 12-Step Estimating Process
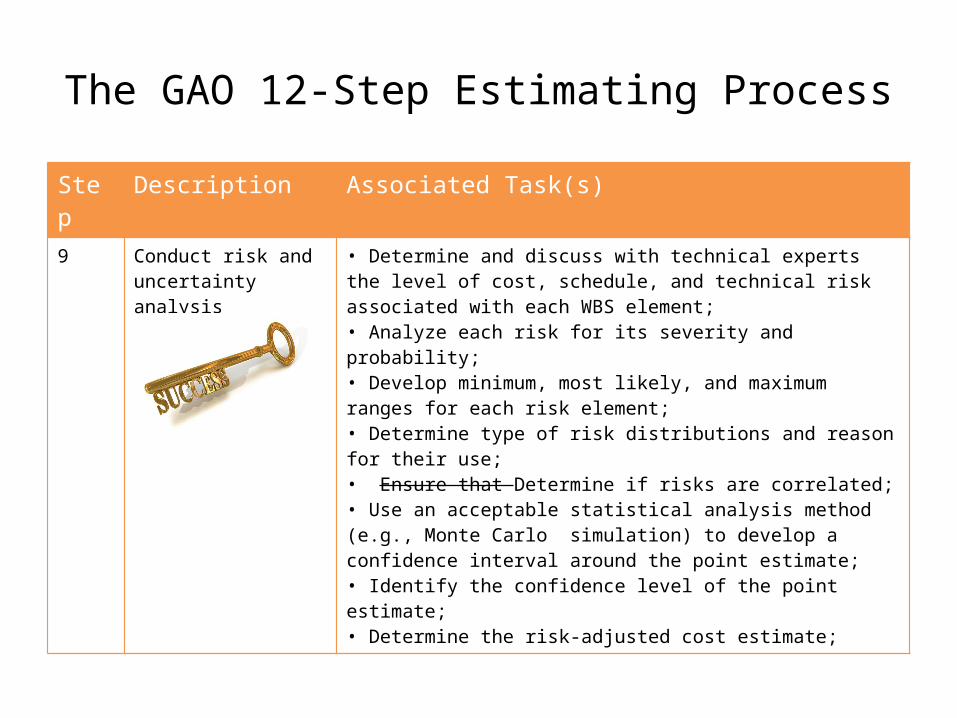
Step Description Associated Task(s)9 Conduct risk and
uncertainty analysis• Determine and discuss with technical experts the level of cost, schedule, and technical risk associated with each WBS element; • Analyze each risk for its severity and probability;• Develop minimum, most likely, and maximum ranges for each risk element; • Determine type of risk distributions and reason for their use; • Ensure that Determine if risks are correlated; • Use an acceptable statistical analysis method (e.g., Monte Carlo simulation) to develop a confidence interval around the point estimate;• Identify the confidence level of the point estimate;• Determine the risk-adjusted cost estimate;

The GAO 12-Step Estimating Process
Step Description Associated Task(s)
9 Conduct risk and uncertainty analysis
• Recommend that the project or program office develop a risk management plan to track and mitigate risks
10 Document the estimate • Documentation should be detailed enough that another analyst could reconstruct the estimate
11 Present the estimate to management for approval
12 Update the estimate to reflect actual costs and changes

Applying Theory to Practice
Implementing Best Practices
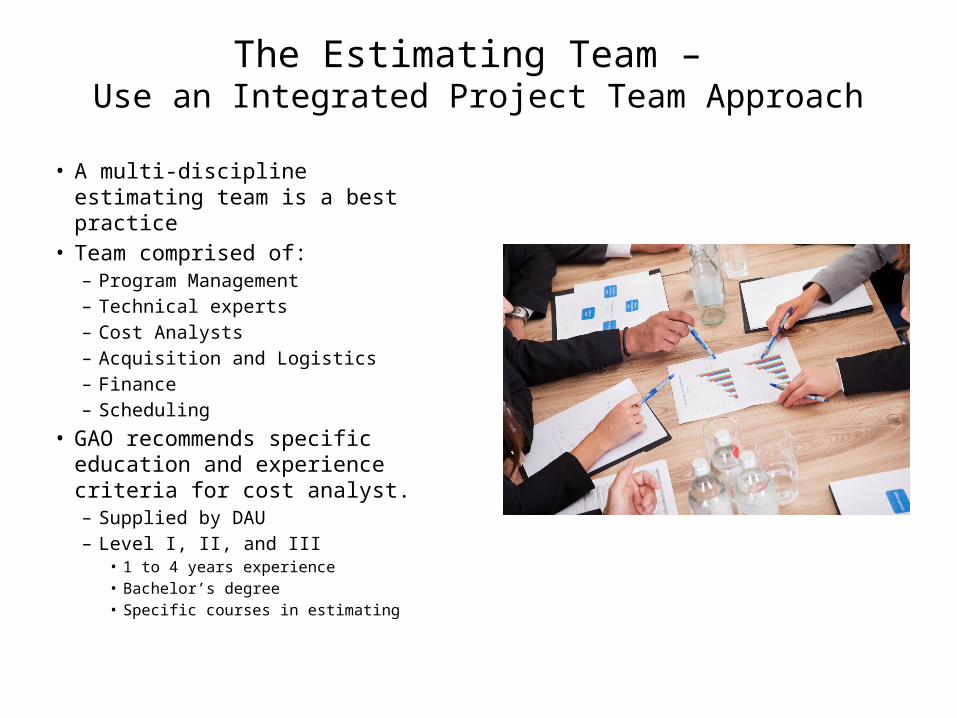
The Estimating Team – Use an Integrated Project Team Approach
• A multi-discipline estimating team is a best practice
• Team comprised of:– Program Management– Technical experts– Cost Analysts – Acquisition and Logistics– Finance– Scheduling
• GAO recommends specific education and experience criteria for cost analyst.– Supplied by DAU– Level I, II, and III
• 1 to 4 years experience• Bachelor’s degree• Specific courses in estimating

Validate Technology Assumptions
• When will technology be mature enough to insert into program?– Beware of optimistic estimates– Look at technical (im)maturity as a risk to be managed.
• What changes will be necessary to accommodate new or emerging technologies?– Materials– Manufacturing methods– Logistic support
Choose the Best Estimating Method for the Cost Element Being Estimated
• Previous Actual Costs – Can be most robust method – Assumes cost have (or will) remained constant– Adjust for learning curve or manufacturing efficiency
• Analogy (top-down)– Best applied to overall estimate as a sanity test– Useful when data is limited
• Bottom-up (engineering estimate)– Best used when design is mature (detailed specifications and engineering
available)– Can be used to build system estimate from individual sub-system or component
estimates following WBS structure
• Parametric estimate (Cost Estimating Relationship)• Expert Opinion

Parametric Cost Estimating Models• Typically derived from a (linear)
regression analysis using multiple variables.
• Requires detailed data sets obtained from historical data
• The ‘fit’ of the model to the data is determined by residual analysis (R2)
• Linearity is assumed. Minor non-linearity can be tolerated
• Data transformation may be required to address larger non-linearity issue
• Number of variables determined by best fit and residual analysis
• Result is a formula which summarizes the relationship among variables
Image credit: Wikiuniversity.org

Limitations on Parametric Models• Valid only for the domain / range of values for which they
were created.• Cost estimates are dependent on the technical estimates.
– How accurate are the technical requirements, technical estimates or parameters used in the CER?
– DAU notes: “A common form of optimism bias is optimistic technical estimates from technical experts. Unfortunately it has been shown that most experts are overly optimistic in providing their most likely and worst case estimate1”
1. Dorey, Sean P. Major, USAF, Oehmen, Josef and Valerdi, Ricardo , 2012. Enhancing Cost Realism through Risk-Driven Contracting: Designing Incentive Fees Based on Probabilistic Cost Estimates. Defense ARJ, 19 (2), p. 133-158

Cautions Concerning Expert Opinion
• Tendency towards Optimism Bias– Underestimate labor hours, cost, and/or duration– Predict early availability of technology – Most pronounced on estimates of known or frequently performed
tasks1
• Counter effects by requesting expert to render 3-point estimate with “most likely” estimate first2, then obtain best and worst case.
• Counter effects with Delphi technique
1. Roy, Michael M. and Christenfeld, Nicholas J. S., 2007. Bias in Memory Predicts Bias in Estimation of Future Task Duration Memory & Cognition, 35 (2), p. 557-564.
2. Alleman, G, 2010. Why 3 Point Estimates Create False Optimism (Part 1). [Webpage] PM Toolbox, March 17. Available From: http://pmtoolbox.com/project-management-news/why-3-point-estimates-create-false-optimism.html .
Cautions Concerning Expert Opinion
• Studies have shown that some experts view generating 3-point estimates as onerous, leading to frivolous estimates1
• Project Advocacy Experts tend to dismiss opinions or estimates that would endanger advancement (or continuation) of their program2
1. Trietsch, D, Mazmanyan, L, Gevorgyan, L and Baker, K, 2010. Modeling Activity Times by the Parkinson Distribution with a Lognormal Core: Theory and Validation. [Article] Dartmouth.edu. Available From: http://faculty.tuck.dartmouth.edu/images/uploads/faculty/principles-sequencing schedu-ing/ModelingActivityTimes.pdf
2. Christensen, David S. Ph.D., 1996. Project Advocacy and the Estimate at Completion Problem. Journal of Cost Analysis (Spring), p. 35-60.

Let’s Try A Sample Project Using the CER Technique
• Model estimates the first-unit cost of 600 lb. UHF satellite consisting of 10 elements (subsystems).
• Example extracted from “A Handbook of Cost Risk Analysis Methods”, Institute for Defense Analysis, Phillip Laurie Project Leader pg. 15
• Model’s CER was populated with technical estimates (size, weight, power, etc.) from appropriate technical experts.
• Experts also provided “Best” and “Worst” case values for each estimate
• Element cost modeled as triangular distributions.
• Correlation matrix supplied – however the underlying data was not available for independent analysis.
Image credit: NASA.gov

The Results ….• Data produced by the CER is shown in
the table– Separate calculation for each WBS
element.– WBS elements summed to derive total
• Total program cost (single point) estimated at $30,997,000
• Caveats– Model has some inherent inaccuracy
(best fit not perfect fit)– Estimates provided by SMEs may
contain uncertainties– Program outcome could be effected
by risk
Best Practice – Consider Uncertainty
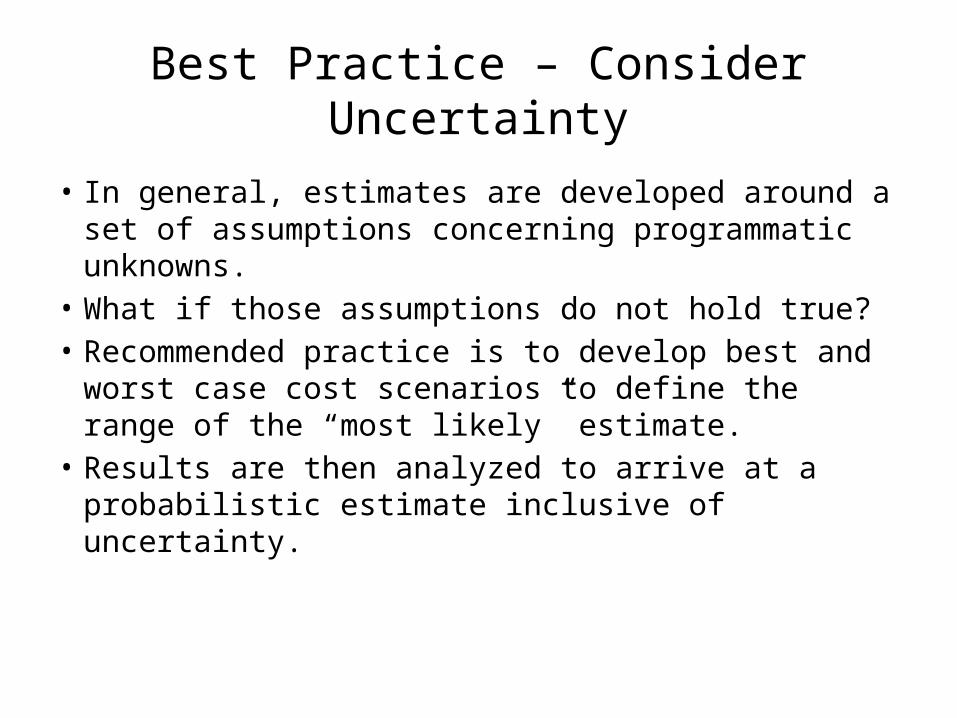
• In general, estimates are developed around a set of assumptions concerning programmatic unknowns.
• What if those assumptions do not hold true?• Recommended practice is to develop best and
worst case cost scenarios to define the range of the “most likely” estimate.
• Results are then analyzed to arrive at a probabilistic estimate inclusive of uncertainty.

Addressing Uncertainty• Expert opinion estimates are best
represented by range of values vice a single point estimate
• “Most Likely” value defines expected cost or duration based on rules and assumptions as stated.
• “Best Case” value represents expected cost or duration if all assumptions stack up on the favorable end of the spectrum
• “Worst Case” value represents expected cost or duration should all assumptions stack up on the pessimistic end of the spectrum
Best Case (a) Worst case (b)
Most Likely (m)
6
9
Note: Letters used to denote the various values (a, m, b or a,b,c ) vary among researchers so some care should be exercised when examining data to determine which letter is associated with which value.
15
Typically the “Most Likely” value has less than a 50% opportunity of being correct.The mean (μ) tends to be closer to 50%, consequently the mean is recommended.

Sum the (Uncertain) WBS Totals• Naïve estimate: Simple
addition of most likely values (m)– Ignores uncertainty– Ignores possible
interaction (correlation) between WBS elements
• Preferred technique is to statistically sum the average (μ) values
• Difference between the two sums is the uncertainty allowance.
Note: a= cost estimate using the most optimistic set of assumptions, b= cost estimate using the most pessimistic set of assumptions and m = the cost estimate using the most likely (baseline) assumptions. All estimates in 1,000 dollar increments.

Sum the (Uncertain) WBS Totals• Previous example used analytical
method to sum the means• Alternate technique is to sum the
data using a Monte Carlo simulation
• Results (shown here) are presented in a histogram showing relative likelihood of a specific value or range of values
• In summing the totals correlation between (or among) individual WBS elements must be considered as it can skew the results1.
Determine if WBS Costs are Correlated
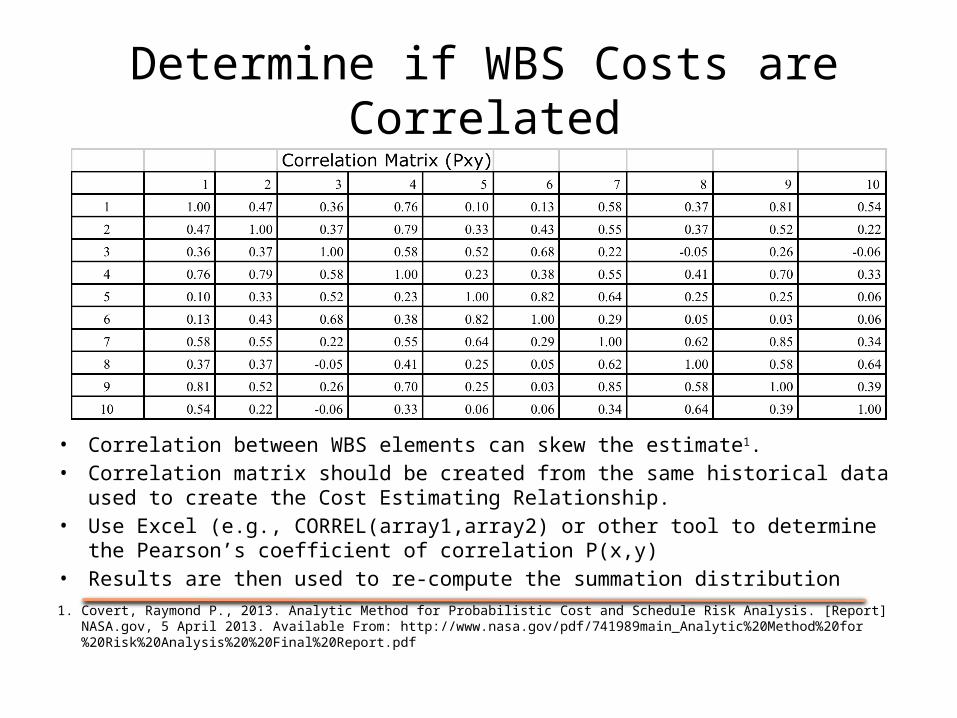
• Correlation between WBS elements can skew the estimate1.• Correlation matrix should be created from the same historical data used to create the Cost
Estimating Relationship. • Use Excel (e.g., CORREL(array1,array2) or other tool to determine the Pearson’s coefficient of
correlation P(x,y) • Results are then used to re-compute the summation distribution1. Covert, Raymond P., 2013. Analytic Method for Probabilistic Cost and Schedule Risk Analysis. [Report] NASA.gov, 5 April 2013. Available From:
http://www.nasa.gov/pdf/741989main_Analytic%20Method%20for%20Risk%20Analysis%20%20Final%20Report.pdf
Impact of Cost Correlation
$26,000
$26,500
$27,000
$27,500
$28,000
$28,500
$29,000
$29,500
$30,000
$30,500
$31,000
$31,500
$32,000
$32,500
$33,000
$33,500
$34,000
$34,500
$35,000
$35,500
$36,000
$36,500
$37,000
$37,500
$38,000
$38,500
$39,000
$39,500
$40,000
$40,500
$41,000
$41,500
$42,000
$42,5000.00000
0.01000
0.02000
0.03000
0.04000
0.05000
0.06000
0.07000
0.08000
0.09000
0.10000
Independent Cost Corelated Cost
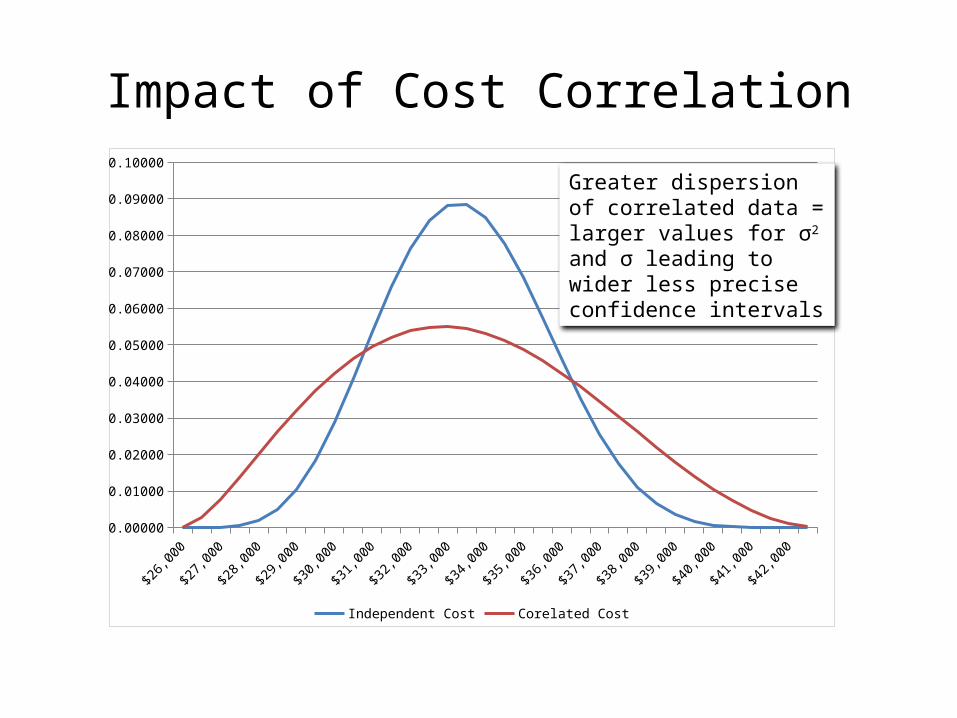
Greater dispersion of correlated data = larger values for σ2 and σ leading to wider less precise confidence intervals

Best Practice – Consider Risk
• Risk is the (contingency) impact to cost or schedule of specific events – the results of which are unknown at the present time.– 20% chance of failing the First Article Test– Likely impact would be a schedule delay of 4 to 7 weeks– Estimated costs of $200,000 plus $25,000 per week delayed
• The effects of known or foreseen risk events should be considered when constructing the cost model and if significant, disclosed.

Conduct Risk and Uncertainty Analysis
• Three-point estimates capture variability (uncertainty) in estimate but do little to address specific risk events.
• Best practice is to conduct Monte Carlo simulation of cost (and schedule) model including the impact(s) of risk events.
Image credit: Risky Project – Used by Permission

Combining Frequency Distributions
1. Grinstead, Charles and Snell, Laurie, 1997. Sums of Independent Random Variables. An Introduction to Probability. 2 ed. American Mathematical Society. pg 293
2. Lurie, Philip M., Goldberg, Mathew, and Robertson, Mitchell, A Handbook of Cost Risk Analysis Methods, IDA Paper P2734, Institute for Defense Analysis, April, 1993pp15
Risk ‘a’
Risk ‘b’
Risk ‘c’
Probabilistic Cost Estimate
The technique used to sum the various distributions can be analytic (e.g., Method of Moments or FRISK) or simulative

Identify the Confidence of the Point Estimates
• Summation of the “most likely” estimates may not result in a sufficiently robust overall estimate • – In this case the most likely estimates only provide a 30.5% confidence level• - The sum of the means provides about a 54% confidence level• - Higher confidence levels (60-65%) may be desirable

Now What?• The results of the estimate should be
presented as a range of values.• Single point estimates (if made) should be
accompanied by a confidence factor.• How the estimates are used then becomes a
business decision – however it will be:– one that is based on a repeatable process and– includes an allowance for uncertainty and risk.

Conclusions• The GAO 12-step method provides a useful process for
creating meaningful cost estimates• Estimates are still difficult to generate because
– We often lack of meaningful data– We face technical uncertainties– Project risks
• Best practice is to generate estimates inclusive of risk and uncertainty
• Best practice is to express estimates as statistical probabilities / confidence intervals

About the PresenterDonald (Don) Shannon retired from the USAF in 1990 and went on to complete a subsequent 23-year contract and program management career in industry. He presently operates a consulting practice (The Contract Coach www.contract-coach.com) where he conducts no-cost training for both the NCMA and the New Mexico Procurement Technical Assistance Program (PTAP). He is the Certifications Co-chair and Secretary for the Rio Grande Chapter of NCMA and is a frequent presenter at their educational events.
His education includes a BA in Business from St. Leo’s College and a MS in Logistics Management from AFIT. Mr. Shannon is a PMP, an NCMA Fellow, and a Lifetime CFCM and CPCM.
His research includes “In the Land of the Blind the One-Eyed Man is King” (CM July 2014) and a unpublished journal article entitled “An Integrated Approach to Assessing Cost, Schedule, and Risk”
He may be contacted at [email protected]

Commonly Used Tools• Project Management
– Microsoft Project (several versions – PC only)
– Primavera (several versions) PC Only
– ProjectLibre / Open Project (Free multi-platform)
– FastTrack Schedule (Mac and PC versions)
– Deltek Open Plan (Web Based)– OmniPlan (Mac)– Merlin (Mac)– Open Workbench (PC)– 2Plan (Mac, PC and Linux)– Excel (via templates and macros)
• Project Risk Management– RiskyProject (Stand-alone PC only
Includes Project software))– @Risk (Excel add-in PC Only)– Oracle Crystal Ball (Excel add-in
PC Only)– Oracle Risk Analysis (Enterprise
solution)– Risk Engine (Excel add-in MAC)– SimVoi (Excel add-in Mac and PC)– Deltek (Web based – Enterprise
level)
• Other Tools– WBS Chart Pro
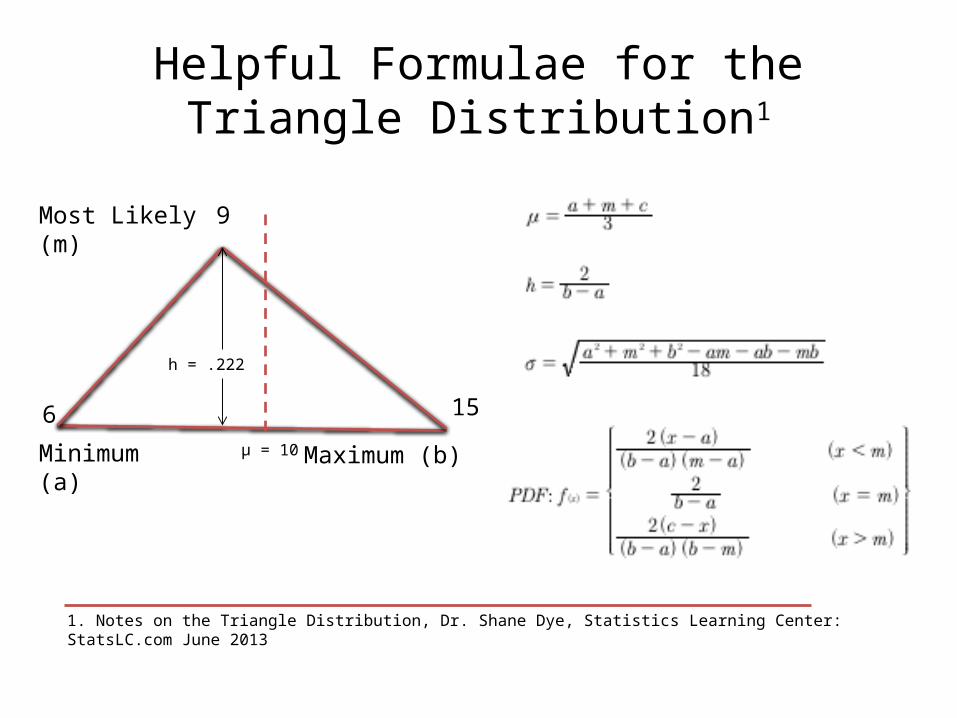
Helpful Formulae for the Triangle Distribution1
15
Minimum (a) Maximum (b)
Most Likely (m)
6
9
h = .222
μ = 10
1. Notes on the Triangle Distribution, Dr. Shane Dye, Statistics Learning Center: StatsLC.com June 2013


![Your Path to Certification [CFCM, CCCM, CPCM]: D1A](https://img.pdfslide.us/doc/110x75/56814adc550346895db7f2be/your-path-to-certification-cfcm-cccm-cpcm-d1a.jpg)