Embed Size (px)
Citation preview

1
For Institutional investors and Professional investors
Forecasts are based on assumptions, estimates, views and hypothetical analyses, which might prove inaccurate or incorrect. Note certain information in this presentation constitutes forward-looking statements. Due to various risks, uncertainties and assumptions made in our analysis, actual events or results or actual performance of the markets covered by this report may differ materially from those described. The information herein reflect our current views only, are subject to change, and are not intended to be promissory or relied upon by the reader. There can be no certainty that events will turn out as we have opined herein. Nov 2019: For Qualified Investors (Art. 10 Para. 3 of the Swiss Federal Collective Investment Schemes Act (CISA). For Professional Clients (MiFID Directive 2014/65/EU Annex II) only. For Institutional investors only. Further distribution of this material is strictly prohibited. Australia: For Professional Investors only.
November 2019 Responsible Investing
Why emerging markets are defined by ESG ESG forces are moving deeper into emerging markets from the network of central banks sharing best practice, stock exchanges mandating ESG disclosure requirements, regulators acting in the area of fiduciary duty and the launch of new EM-focused investment products
Emerging market countries are particularly exposed when it
comes to environmental, social and governance issues such
as population growth, income inequality, biodiversity loss,
water stress, extreme weather events, corruption and forced
labour. While many of these issues also exist across
developed markets, the macro stability risks for emerging
markets are more acute and the institutions available to
address them weaker.
For some emerging markets, their increased vulnerability
reflects the greater dependency on natural resources from an
export earnings and GDP perspective. For example, rising
global temperatures will threaten agricultural productivity
which will hit low lying EM agricultural-based economies
particularly hard.
Meanwhile technological change, government regulation and
changing consumer preferences have introduced new
hazards for fossil fuel exporting countries, many of whom are
based in EM countries. Since emerging markets constitute
60% of world GDP¹ and 80% of the world’s population², these
hazards pose significant risks to the global economy. On our
estimates, EM countries are forecast to contribute just over
75% of the 3.2% gain in world GDP growth this year.
It should therefore come as no surprise that when examining
the link between ESG and corporate financial performance
from a regional perspective, our research shows that
emerging markets display the strongest correlation of any
region³. Surveys also reveal that investors in emerging
market countries have the highest levels of concern when it
came to ESG issues such as the burning of fossil fuels, the
use of child labour, excessive CEO remuneration and
companies that make use of tax loopholes4. Consequently,
how a company manages such ESG issues provide
important insight into how the company is run.
Yet, the adoption of sustainability initiatives across the
investor, corporate, supervisory and regulatory universe in
these countries remains patchy and typically concentrated in
just a few emerging market countries.
To assess the penetration of sustainable finance activity
across emerging markets, we track membership of the
Network for Greening the Financial System (NGFS), the
Principles for Responsible Investment (PRI), the Principles
for Sustainable Insurance (PSI), the Sustainability Stock
Exchanges (SSE) Initiative, the number of TCFD supporters,
the corporate take-up of RE100, as well as the activities of
insurance and pensions’ regulators.
We find EM Asia is making the most strides. This is
reassuring since the region faces acute climate risks from a
financial perspective. Regulators are also stirring in South
America while efforts in Africa and the Middle East are
concentrated in a handful of countries, namely South Africa,
Kenya, Morocco, Nigeria and the UAE.
Michael Lewis
Head of ESG Thematic Research
Introduction

Why emerging markets are defined by ESG November 2019
2
Forecasts are based on assumptions, estimates, views and hypothetical models or analyses, which might prove inaccurate or incorrect
November 2019 — For Qualified Investors (Art. 10 Para. 3 of the Swiss Federal Collective Investment Schemes Act (CISA).For Professional Clients
(MiFID Directive 2014/65/EU Annex II) only. For Institutional investors only. Further distribution of this material is strictly prohibited.
Australia: For Professional Investors only
Population growth, urbanisation and
demographics
Emerging market country risk is closely tied to environmental,
social and governance factors. In the 20th century, the world’s
population increased from 1.5 billion to 6.1 billion, or by 4.6
billion. In this century, the UN estimates that the world’s
population will increase a further 4.8 billion to reach 10.9
billion with 75% of this increase occurring in the first half of
the century. Of the anticipated 2.1 billion growth in global
population between now and 2050, 58% is expected to occur
in Africa, with the next 33% of world population growth
occurring in Asia5.
This growth will also coincide with increasing levels of
urbanisation. In 1950, 30% of the world’s population, or 751
million people, lived in cities. Today this stands at 55% or 4.2
billion. By 2050, 68% of the world’s population is projected to
be urban. Just three countries – India, China and Nigeria, will
account for 35% of the growth in the world’s urban population
between 2018 and 20506.
In total, this means the migration of 1.4 billion people from
rural areas to cities with the effect of boosting productivity,
increasing consumption (urban dwellers typically consume
three times more energy than that their rural counterparts)
and added pollution risk to land, air and water. Urbanisation
will lead to an estimated 25 million kilometers of new paved
roads by 20506. Inevitably, urbanisation will require
investment in housing, transportation, energy systems and
other infrastructure as well as increasing demand for basic
services such as education and healthcare.
This infrastructure investment will need to be built with
climate change and specifically physical climate risk in mind.
This is why this year has seen the Coalition for Climate
Resilient Investment (CCRI) being established. It brings
together 34 companies and organizations, including DWS,
with US$5 trillion in assets to help develop solutions to
advance climate change resilience. Work by the New Climate
Economy estimates that US$90 trillion will be invested in
infrastructure between now and 20307.
An estimated 60% of this infrastructure demand will be in the
energy and transportation sector, with 70% of total
infrastructure demand coming from emerging markets and
low income countries7. The delivery of renewable energy to
these markets should help unlock significant growth potential
since approximately 1 billion people in the world currently live
without electricity, predominantly in India and Africa8.
However, off-grid solutions provide a strong chance that
energy access will arrive soon. Indeed investment products
in this area already exisit, for example in Sub-Saharan Africa.
Part of the work of the CCRI will be to eancourage sure
infrastructure investments flows and to ensure they are
climate-smart.
Urbanisation and the rise of megacities is increasing the risks
posed by pollution. 91% of the world’s population live in
areas with levels of air pollution that exceed WHO guidelines,
with South-East Asia and the Western Pacific regions the
most polluted. In fact, less-developed countries experience
PM2.5 levels of air pollution that are typically four or five
times higher than those of more developed countries. Indoor
and outdoor air pollution are together responsible for more
than one tenth of all premature deaths globally each year, or
7 million people according to the World Health Organization
(WHO)9. Even so, there exists a significant dispersion across
EM such that air pollution mortality rates in India are six times
that of Singapore, Figure 1.
FIGURE 1: AIR POLLUTION MORTALITY RATES BY
COUNTRY
Source: State of Global Air database (2018 data)
In terms of the incidence of pollution, populations in low-
income cities are the most impacted. For example, according
to the WHO 97% of cities in low- and middle-income
countries with more than 100,000 inhabitants do not meet
WHO air quality guidelines. However, in high-income
countries this percentage drops to 49%. Meanwhile, the
proportion of the urban population living in slums is
approximately 56% in Sub-Saharan Arica, 32% in Central
and Southern Asia, 21% in Latin America compared to 0.1%
in Europe and North America9.
0
20
40
60
80
100
120
140
Germ
an
y
Sin
gap
ore
So
uth
Kore
a
Co
lom
bia
Ch
ile
Bra
zil
Pe
ru
Arg
entin
a
Th
aila
nd
Ta
iwan
Ru
ssia
Mexic
o
Tu
rkey
Mala
ysia
So
uth
Afr
ica
Vie
tna
m
Indo
ne
sia
Ch
ina
Nig
eria
Ke
nya
Ph
ilipp
ines
Ba
ngla
desh
Pa
kis
tan
India
Increasing mortalitydue to air pollution
Death
s/1
00,0
00 a
ttri
btu
table
to a
ir p
ollu
tion

Why emerging markets are defined by ESG November 2019
3
Forecasts are based on assumptions, estimates, views and hypothetical models or analyses, which might prove inaccurate or incorrect
November 2019 — For Qualified Investors (Art. 10 Para. 3 of the Swiss Federal Collective Investment Schemes Act (CISA).For Professional Clients
(MiFID Directive 2014/65/EU Annex II) only. For Institutional investors only. Further distribution of this material is strictly prohibited.
Australia: For Professional Investors only
Steps to curb outdoor air pollution tend to be focused on
introducing clean technologies across industry, ensuring
access to affordable clean household energy for cooking,
heating and lighting, shifting to clean modes of power
generation and prioritising rapid urban transport systems and
low-emission vehicles. In addition, improving the energy
efficiency of buildings and introducing strategies for waste
reduction, recycling and reprocessing.
While emerging market countries are often lauded for their
strong growth outlooks reflecting favourable demographics,
between now and 2050, two-thirds of the increase in over 60
year olds will occur in Asia meaning that by 2050 nearly 8 in
10 of the world’s older persons will be living in the developing
world². In Asia, China, Korea, Taiwan, Singapore and Hong
Kong will be hit hardest as their workforces’ age rapidly. In
certain countries, favourable demographic trends do still
exist, but, in Asia are largely confined to Indonesia, Malaysia
and the Philippines.
Conversely populations in many other EM regions are still
young. In Africa, children under 15 account for 41% of the
population currently and 15 to 24 years old account for a
further 19%. Latin America/Caribbean and Asia have smaller
percentages of children under 15 (26% and 24%
respectively) but similar percentages of youth (17% and 16%
respectively). Meanwhile, Mexico has one of the youngest
populations in the world (median age 28) and its working age
population is projected to keep growing for the next 30 years.
Argentina will also enjoy favourable demographics, but, to a
lesser extent².
Biodiversity loss, water stress and food security
At a global level, it is estimated that nature provides services
worth at least USD125 trillion per annum10. However, after
armed violence and terrorism, biodiversity loss is one of the
greatest societal costs11 and since 1970, humanity has wiped
out 60% of mammals, birds, fish and reptiles with South and
Central America the worst affected regions10.
Calculations show that the planet has available 1.7 hectares
of biologically productive land per person to supply resources
and absorb waste yet the average person on Earth already
uses 2.3 hectares worth. These “ecological footprints” range
from 8.1 hectares claimed by the average American to 0.7
hectares used by the average Mozambican12.
Agriculture also causes around 70% of the projected loss of
terrestrial biodiversity13. In particular, the expansion of
cropland from grasslands, savannahs and forests contributes
to this loss. The commodities most linked to deforestation are
cattle, palm oil, soy, timber and cocoa with key producing
countries located in EM such as Brazil, Argentina, China,
India, Indonesia, Malaysia, Ivory Coast and Ghana14.
Land degradation is being caused by, among other things,
deforestation, overgrazing and urbanisation. It is also
undermining the well-being of 40% of the world’s population,
or 3.2 billion people, and raising the risks of migration and
conflict. The worst affected regions are the dry fringes of sub-
Saharan Africa, South-eastern Asia, southern Iraq and
Afghanistan. The World Wildlife Fund assessment also
reveals that only 25% of land on Earth is substantively free of
the impacts of human activities and this is projected to
decline to just 10% by 205010.
Urbanisation will inevitably put increasing pressure on natural
resources such as water as well as threaten a further loss in
biodiversity. While three-quarters of the Earth is covered with
water, only 2.5% is fresh water and less than 1% is available
to sustain all terrestrial life and ecosystems15. Currently, 1.7
billion people in 44 countries are chronically short of water.
By 2050, roughly half the world’s population, or 4.9 billion
people, will live in a country where the lack of fresh water will
be chronic or recurrent16. The World Resources Institute
show water stress is most acute in the Middle East and within
the invesitble EM universe, India, China, Mexico, Turkey and
Thailand are the most vulnerable, Figure 2.
FIGURE 2: WATER STRESS SCORES BY COUNTRY
Source: World Resources Institute (August 2019)
0
1
2
3
4
5 High-Extremely High
Wate
r str
ess s
core
(0
-5) Medium-High
Low
Low-Medium

Why emerging markets are defined by ESG November 2019
4
Forecasts are based on assumptions, estimates, views and hypothetical models or analyses, which might prove inaccurate or incorrect
November 2019 — For Qualified Investors (Art. 10 Para. 3 of the Swiss Federal Collective Investment Schemes Act (CISA).For Professional Clients
(MiFID Directive 2014/65/EU Annex II) only. For Institutional investors only. Further distribution of this material is strictly prohibited.
Australia: For Professional Investors only
Inevitably this will focus attention on companies and their
operations in water stressed regions and their license to
operate. In fact, 20% of today’s global GDP is already
produced in water-scarce regions and this could rise to 45%
by 205017. The sectors most likely to be exposed to
substantive water risks are consumer staples, utilities, energy
and mining. Water stress reflects not just climate change,
but, also the unsustainable extraction from rivers, lakes and
groundwater. Countries of particular concern are those that
are depleting non-replenishable aquifers to meet water
demand, most notably in China, India, Mexico, Spain, South
Korea and the US17.
Agriculture accounts for 70% of the world’s total freshwater
withdrawal mostly through irrigation, but some 60% of this is
wasted due to leaky irrigation systems and the cultivation of
crops that are too thirsty for the environment in which they
grow12. Solutions include deploying new or existing
technologies such as recycling waste water, rainwater
harvesting, drip irrigation technology, precision planting and
hybrid seeds, improved infrastructure and pipes as well as
introducing desalination facilities.
Since more than 75% of the world’s food comes from just 12
plants and five animal species, these risks expose the world
economy in the event of extreme crop failure or disease in
one or more of the major agricultural producer economies18.
When it comes to agricultural production, the superpowers
are the US and China followed by India, the EU and Brazil13.
For the third year in a row, there has been a rise in world
hunger such that the number of undernourished people has
increased to nearly 821 million in 2017 from around 804
million in 201619. The most concentrated areas of under-
nourishment occur in India, China, Pakistan, Ethiopia and
Indonesia. Climate change and population growth threaten to
increase the number of undernourished people worldwide by
40-170 million this century, according to the
Intergovernmental Panel on Climate Change (IPCC)20. While
higher average temperatures may lead to increases in crop
yields in higher latitudes, in lower latitudes, where most
agricultural-based emerging market countries are located,
the negative impacts on yields and hence production are
likely to become more evident.
Forced labour, migration and financial inclusion
An estimated 40.3 million people were victims of modern
slavery in 2016, through either forced labour or forced
marriage. Put another way, 1 in every 185 people are in a
situation of modern slavery and human trafficking. The
majority of these reside in Africa and Asia-Pacific with
women accounting for 71% of modern slavery victims. In
addition, almost one of every four victims of forced labour
were exploited outside their country of residence which
points to the high degree of risk associated with migration21.
FIGURE 3: PREVALENCE OF PERSONS IN MODERN
SLAVERY BY REGION
Source: United Nations University Centre for Policy Research (September 2019). Unlocking Potential: A Blueprint for Mobilizing Finance Against Slavery and Trafficking
The US Bureau of International Labor Affairs maintains a list
of goods and their source countries which it believes are
produced by forced labour or child labour. As of September
2018, the list of good produced by child labour or forced
labour comprised 148 goods from 76 countries of which
approximately 50% were in the agricultural sector such as
sugarcane, cotton and tobacco. However, forced labor is
pervasive across all sectors. Gold mining has the largest
amount of forced labour when measured by number of
countries while Brazil, India, Paraguay and Vietnam have the
largest number of goods linked to forced or child labour22.
Like countries in the developed world, emerging market
countries are also faced with the challenges of migration. The
total number of international migrants in 2017 was 257.7
million, an increase of 49% since 2000. The international
migrant stock as a percent of the total population stands at
3.4%, compared to 2.8% during the 1990s23.
7.6
6.1
3.9
3.3
1.9
0
1
2
3
4
5
6
7
8
Africa Asia-Pacific Europe-CentralAsia
Arab states Americas
Pre
vale
nce p
er
1,0
00

Why emerging markets are defined by ESG November 2019
5
Forecasts are based on assumptions, estimates, views and hypothetical models or analyses, which might prove inaccurate or incorrect
November 2019 — For Qualified Investors (Art. 10 Para. 3 of the Swiss Federal Collective Investment Schemes Act (CISA).For Professional Clients
(MiFID Directive 2014/65/EU Annex II) only. For Institutional investors only. Further distribution of this material is strictly prohibited.
Australia: For Professional Investors only
The number of migrants as a share of the population residing
in high-income countries has risen from 9.6% in 2000 to 14%
in 2017. The countries with at least 20% of their population’s
living abroad include Syria, Kazakhstan, Bosnia, Portugal,
Albania, Armenia and Jamaica. In absolute terms, India,
Mexico, Russia, China, Bangladesh, Pakistan and Ukraine
have the largest diaspora, ranging from 6 to 11 million23.
The findings of the Liechtenstein Institute’s financial sector
commission on modern slavery and human trafficking
report24, published in September 2019, was that not only was
migration a sign of the failure of labour markets to provide
decent employment opportunities, but, that the exclusion of
an estimated 1.7 billion adults from banking services25 was
pushing people and households into risky borrowing, labour
and migration practices. This reinforces why we promote the
microfinance sector and broader financial inclusion ambitions
across EM. Indeed without the work of microfinance financial
institutions, lending rates could be in excess 300% compared
to MFI lending rates of 25-30%26.
Customer and client protection has become an important
theme in the microfinance market over the past decade,
illustrated by the Smart Campaign and the establishment of
the Client Protection Principles27. In addition, the work of
MIMOSA and their assessment in the level of credit
saturation or over-lending in individual countries has been
helpful to limit or avoid a repeat of the over-indebtedness and
irresponsible lending practices of the past28.
Emerging markets and climate risks
Between 1998 and 2017, the ten most affected countries to
extreme weather events were in emerging markets and most
notably Asia, Central America and the Caribbean29, Figure 4.
As the index is backward looking, since it assesses the
vulnerability of countries to floods, droughts and storms that
have happened in the past, it makes no prediction of future
climate impacts. Even so, it does reveal how extreme
weather events have a disproportionate impact on emerging
market countries in terms of death toll and financial loss as a
share of GDP.
FIGURE 4: COUNTRIES EXPOSURE TO EXTREME WEATHER
EVENTS BETWEEN 1999 AND 2017
The Climate Risk Index assesses country exposure in terms of economic loss and fatalities to extreme weather events Source: Germanwatch Global Climate Risk Index 2019
Asia is particularly exposed in this regard. Not only is the
region urbanising rapidly, but, this urbanisation is
increasingly concentrated in low-lying coastal areas. It is
anticipated that between now and 2050 flood losses are likely
to be most extreme in Guangzhou, Mumbai, Kolkata,
Shenzhen, Tianjin, Ho Chi Minh City, Jakarta, Chennai,
Surat, Zhangjiang, Bangkok and Xiamen, which are home to
a combined population of roughly 130 million people30.
Governance, corruption and political risk
Low-income emerging market countries are also vulnerable
to weak democratic values and poor legal enforcement. To
assess the levels of corruption and the health or otherwise of
democracies around the world, Transparency International
publishes the Corruption Perceptions Index. It measures the
perceived levels of public sector corruption in 180 countries
around the world.
From a regional perspective, sub-Saharan Africa has the
highest levels of corruption followed by Eastern Europe and
Central Asia31, Figure 5. High levels of corruption pose
significant risks as they not only deter foreign direct
investment, but, they may also encourage a large black
market economy to develop, with the associated loss of tax
revenues for local and central governments.
172
110106
89 86 81 79 79 7461 58 57 53 49
37 35 30 2720 15 13
0
20
40
60
80
100
120
140
160
180
200
Increasing exposure toextreme weather events

Why emerging markets are defined by ESG November 2019
6
Forecasts are based on assumptions, estimates, views and hypothetical models or analyses, which might prove inaccurate or incorrect
November 2019 — For Qualified Investors (Art. 10 Para. 3 of the Swiss Federal Collective Investment Schemes Act (CISA).For Professional Clients
(MiFID Directive 2014/65/EU Annex II) only. For Institutional investors only. Further distribution of this material is strictly prohibited.
Australia: For Professional Investors only
FIGURE 5: CORRUPTION PERCEPTIONS SCORES BY
REGION
Scale: 100 (very clean) to 0 (highly corrupt) Source: Transparency International (February 2019)
From a corporate governance perspective, emerging market
countries can also be exposed to weak shareholder rights,
opaque ownership structures and poor disclosure. Work by
Harvard Law School and ISS Analytics reveals the significant
divergence across emerging markets when it comes to the
independence of company boards ranging from 60% in South
Africa to 17% in Indonesia32, Figure 6. The introduction of
corporate governance codes across certain emerging market
countries has helped to introduce better governance
practices, but, this remains work-in-progress for certain
markets.
FIGURE 6: PERCENTAGE OF INDEPENDENT DIRECTORS BY
COUNTRY IN 2018
Source: ISS Analytics, Harvard Law School (February 2019)
EM exchanges, regulators and supervisors are
responding
When it comes to disclosure and improving sustainability in
capital markets, the Sustainable Stock Exchanges (SSE)
Initiative encourages efforts to enhance corporate
transparency as it relates to ESG. Currently there are 90
SSE partner exchanges, of which two-thirds are in emerging
markets33. However, when it comes to ranking issuers
according to their ESG quality across emerging markets,
challenges exist from the low level of ESG disclosure.
In its 2018 progress report, the SSE analysed the ESG
disclosure practices of over 4,300 companies listed on 35
stock exchanges around the world34. While European
exchanges typically lead when it comes to overall disclosure
rates and timeliness of reporting, improvements are taking
place in certain emerging market exchanges. Their 2017
findings revealed that two emerging markets, South Africa
and Thailand, were ranked in the Top 10 for overall
disclosure rates. Similar results can be found by more recent
ESG disclosure scores published by Bloomberg earlier this
year with Taiwan and Brazil topping the league table among
the universe of EM countries, Figure 7.
However, problems persist in the haphazard nature of what is
being disclosed. Our research shows that currently ESG
disclosure has the weakest correlation to financial
performance35. This is why we are strong advocates of such
initiatives as the EU Sustainable Finance Action Plan and the
Task Force on Climate-related Financial Disclosures (TCFD),
both of which aim to improve and enhance the level of ESG
and specifically climate-related financial disclosures.
Still, we welcome the growing number of stock exchanges
that are publishing guidance on ESG issues and ESG
disclosure for listed companies, which has grown from 13 in
2015 to 47 today, or roughly half of all exchanges worldwide.
Of the 47, 31 are in emerging markets with adoption most
prevalent in EM Asia (12) followed by Africa & the Middle
East (9)36. Needless to say, the introduction of listing rules
and the role of regulators can play a critical role in raising
ESG awareness.
66
44 44
3935
32
0
10
20
30
40
50
60
70
WesternEurope
Asia Pacific Americas Middle East &Northern
Africa
EasternEurope &
Central Asia
Sub-SaharanAfrica
0%
10%
20%
30%
40%
50%
60%
70%
Why emerging markets are defined by ESG November 2019
7
Forecasts are based on assumptions, estimates, views and hypothetical models or analyses, which might prove inaccurate or incorrect
November 2019 — For Qualified Investors (Art. 10 Para. 3 of the Swiss Federal Collective Investment Schemes Act (CISA).For Professional Clients
(MiFID Directive 2014/65/EU Annex II) only. For Institutional investors only. Further distribution of this material is strictly prohibited.
Australia: For Professional Investors only
FIGURE 7: ESG DISCLOSURE SCORES IN 2019
Source: Bloomberg Finance (LP) June 2019
In larger EM countries pressure to disclose is building. For
example, the inclusion of the China A share index into EM
and global equity indices has meant Chinese companies are
coming under increasing scrutiny and pressure to disclose
ESG information such as how a company’s is managing its
emissions and waste. In addition, from next year, all listed
companies and bond issuers will be mandated to disclose
ESG risks. In addition, for unlisted Chinese entities will be
required to have three years of ESG disclosures before being
allowed to IPO on the Shanghai and Shenzhen exchange37.
The Chinese authorities are therefore very focused in this
area with intensive work underway by the China Securities
Regulatory Commission (CSRC), the China Institute of
Finance and Capital Markets (CIFCM) and domestic stock
exchanges.
Even so, regulatory ESG disclosure rules are still a relatively
new tool. Early adopters in EM have been South Africa,
Brazil followed by India and Thailand. Encouragingly, a
growing number of other EM regulators are requiring listed
companies to provide ESG disclosure information, for
example, in Hong Kong, Indonesia, Malaysia, the Philippines,
Singapore and Vietnam32.
When it comes to climate-related financial disclosure, all
eyes are on the TCFD, which was set up to address the
financial stability risk of climate change and the need for
consistent, comparable and reliable data of how companies
were approaching climate risk from a governance, strategy
and risk management perspective.
The numbers of organisations and governments that have
become supporters of the TCFD has grown to 867
organisations as of September 201938. However, the
majority of supporters are located in Europe, the US and
Japan with emerging markets trailing. In EM, Asia ex-Japan
leads (67), followed by Central & South America (31) and
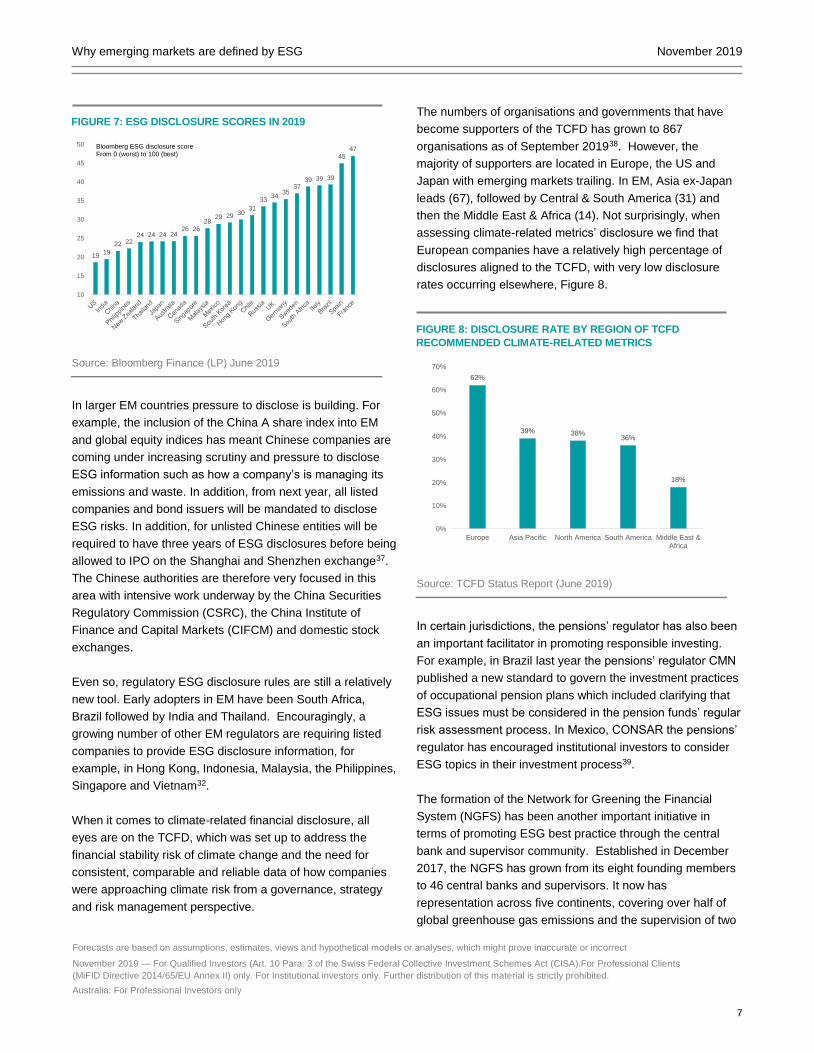
then the Middle East & Africa (14). Not surprisingly, when
assessing climate-related metrics’ disclosure we find that
European companies have a relatively high percentage of
disclosures aligned to the TCFD, with very low disclosure
rates occurring elsewhere, Figure 8.
FIGURE 8: DISCLOSURE RATE BY REGION OF TCFD
RECOMMENDED CLIMATE-RELATED METRICS
Source: TCFD Status Report (June 2019)
In certain jurisdictions, the pensions’ regulator has also been
an important facilitator in promoting responsible investing.
For example, in Brazil last year the pensions’ regulator CMN
published a new standard to govern the investment practices
of occupational pension plans which included clarifying that
ESG issues must be considered in the pension funds’ regular
risk assessment process. In Mexico, CONSAR the pensions’
regulator has encouraged institutional investors to consider
ESG topics in their investment process39.
The formation of the Network for Greening the Financial
System (NGFS) has been another important initiative in
terms of promoting ESG best practice through the central
bank and supervisor community. Established in December
2017, the NGFS has grown from its eight founding members
to 46 central banks and supervisors. It now has
representation across five continents, covering over half of
global greenhouse gas emissions and the supervision of two
1919
22 2224 24 24 24
26 2628
29 29 3031
3334
3537
39 39 39
4547
10
15
20
25
30
35
40
45
50 Bloomberg ESG disclosure scoreFrom 0 (worst) to 100 (best)
62%
39% 38%36%
18%
0%
10%
20%
30%
40%
50%
60%
70%
Europe Asia Pacific North America South America Middle East &Africa

Why emerging markets are defined by ESG November 2019
8
Forecasts are based on assumptions, estimates, views and hypothetical models or analyses, which might prove inaccurate or incorrect
November 2019 — For Qualified Investors (Art. 10 Para. 3 of the Swiss Federal Collective Investment Schemes Act (CISA).For Professional Clients
(MiFID Directive 2014/65/EU Annex II) only. For Institutional investors only. Further distribution of this material is strictly prohibited.
Australia: For Professional Investors only
thirds of the globally systemically important banks and
insurers40. Its aim is to share best practices and contribute to
the development of climate risk management in the financial
sector and to mobilise finance to support the transition
toward a sustainable economy.
While the current membership of NGFS is heavily
concentrated in developed markets, with 28 members in
Europe alone, membership among emerging market central
banks and supervisors is growing in number, with five in Asia
and four in the Middle East & Africa and Central & South
America respectively. The recent speech by the Governor of
Bank Negara Malaysia highlighting the development of a
local sustainable finance taxonomy and introducing the
prospect of climate risk assessment for financial institutions
from next year is likely a sign of things to come elsewhere41.
One therefore just needs to look down the list of EM central
banks who are part of the NGFS network to get a sense of
where this will likely happen next.
ESG in EM from an investor’s perspective
Since the early 1970s, around 2,250 academic studies have
been published on the link between ESG and corporate
financial performance. DWS and the University of Hamburg
reviewed this literature in a white paper published in
December 2015³. Among the many findings, we found that
from a regional perspective, studies showed that ESG is
particularly effective in emerging markets. Indeed where the
body of ESG-CFP research had a regional identifier,
emerging markets displayed the strongest correlation of any
other region, Figure 9.
FIGURE 9: EMERGING MARKETS POST THE STRONGEST
POSITIVE LINK BETWEEN ESG AND CORPORATE
FINANCIAL PERFORMANCE
Source: DWS-Global Research Institute white paper (December 2015). ESG and Corporate Financial Performance.
The more compelling results from an EM standpoint
corresponds well with survey evidence conducted by the PRI,
which found that retail investors in emerging markets such as
South Africa and Brazil appear to be more engaged on ESG
issues than their counterparts in the developed world.
The PRI survey polled pension fund holders in the US, UK,
France, Australia, South Africa and Brazil. It revealed that
respondents in emerging market countries had the highest
levels of concern when it came to the burning of fossil fuels,
the use of child labour, excessive CEO remuneration and
companies that made use of tax loopholes. When asked
whether they felt how a company manages ESG issues
provides insight into how the company is run, 67% of
respondents in Brazil and 58% of respondents in South Arica
sad that they strongly agreed with this statement. This
compared to less than 25% in the US, UK and France4.
The reach of responsible investing activity can also be
gleaned from the number of PRI signatories by country. The
obligations on PRI signatories include a commitment to
incorporate ESG issues into the investment process. We find
that among EM countries, South Africa and Brazil have the
largest number of asset owner and asset manager
signatories to the PRI42. This most likely reflects these
markets being early ESG adopters in terms of stewardship
codes and ESG disclosure requirements. Along with Hong
Kong, China, Singapore and Mexico, these six
countries/administrative areas account for almost three-
quarters of all PRI signatories in the EM universe.
Another way to assess the local adoption of ESG initiatives is
examining membership of the UNEP FI Principles for
Sustainable Insurance. This initiative serves as a global
framework for the insurance industry to address ESG risks
and opportunities. Over 130 organisations, split between
companies and institutions, are signatories and supporters of
the PSI with those adopting the four principles including
insurers representing more than 25% of world premium
volume and USD 14 trillion in assets under management43.
26.1%33.3%
38.0%42.7%
65.4%
8.0%14.3%
7.7% 7.1% 5.8%
0%
15%
30%
45%
60%
75%
DevelopedEurope
DevelopedAsia/AUS/NZ
Developed(total)
NorthAmerica
Emerging Markets
Positive Negative

Why emerging markets are defined by ESG November 2019
9
Forecasts are based on assumptions, estimates, views and hypothetical models or analyses, which might prove inaccurate or incorrect
November 2019 — For Qualified Investors (Art. 10 Para. 3 of the Swiss Federal Collective Investment Schemes Act (CISA).For Professional Clients
(MiFID Directive 2014/65/EU Annex II) only. For Institutional investors only. Further distribution of this material is strictly prohibited.
Australia: For Professional Investors only
While signatories to the PSI are heavily concentrated in
Europe, EM participation is on a par with North America and
OECD Asian countries such as Japan, Australia and New
Zealand. The typical approach adopted by European
insurers in pursuing a sustainable investment strategy has
been through divestment programmes most notably in fossil
fuels, specifically coal, and investing in sustainable energy
and impact investments.
FIGURE 10: NUMBER OF PRI ASSET OWNER AND ASSET
MANAGER SIGNATORIES ACROSS EMERGING MARKETS
Source: PRI signatory database (October 2019)
From a corporate perspective, the RE100 initiative brings
together global companies pledging to source 100% of their
energy needs via renewables in the shortest time span and
by 2050 at the latest. While corporate signatories to RE100
reached 204 in October 2019, the list is still dominated by
companies headquartered in developed markets, with EM
companies making up just 7% of RE100 membership44. This
is significantly below the share of EM participation rates in
other ESG initiatives, Figure 11 at the endof this report. Of
the companies signed up to RE100 in emerging markets, the
majority are centred in EM Asia and specifically India, China,
Taiwan and Singapore.
We pay close attention to the signatory list of RE100 since
research conducted by The Climate Group reveals that there
is a direct correlation between companies signed up for
RE100 and of those companies achieving above-average
financial performance as measured by net profit margin and
EBIT margin45. This out-performance is irrespective of the
sector in which the company operates and, in our view,
means RE100 companies are typically leaders in their
respective sectors.
0
10
20
30
40
50
60
Asset owners
Investment managers
FIGURE 11. REGIONAL REPRESENTATION OF KEY ESG INITIATIVES BY NUMBER OF ORGANISATIONS
Note: Government supporters of TCFD have been excluded
Source: PRI, PSI, NGFS, SSE, RE100, TCFD (all data as of October 2019)
Network for Greening the Principles for Principles for Sustainable Stock Task Force on Climate
Financial System (NGFS) Responsible Investment (PRI) Sustainable Insurance (PSI) Exchanges Initiative (SSE) related Financial Dsclosures (TCFD) RE100
Europe 54 1254 54 11 333 93
N. America 18 571 18 2 153 67
OECD Asia 14 234 13 3 258 31
C. & S. America 23 71 23 5 31 1
Middle East & Africa 16 74 16 9 14 0
EM Asia 12 102 12 12 67 11
E. Europe & C. Asia 1 18 1 5 4 1
Total membership 138 2324 137 47 860 204
EM share (%) 37.7 11.4 38.0 66.0 13.5 6.4

Why emerging markets are defined by ESG November 2019
10
Forecasts are based on assumptions, estimates, views and hypothetical models or analyses, which might prove inaccurate or incorrect
November 2019 — For Qualified Investors (Art. 10 Para. 3 of the Swiss Federal Collective Investment Schemes Act (CISA).For Professional Clients
(MiFID Directive 2014/65/EU Annex II) only. For Institutional investors only. Further distribution of this material is strictly prohibited.
Australia: For Professional Investors only
We expect the increasing competitiveness of renewables
compared to traditional power generating feedstocks will
accelerate the commitment of the corporate sector to this
initiative. In terms of clean energy investment, the APAC
region has accounted for approximately 50% of global
renewable energy investments every year since 2013 and
China represents on average two-thirds of this investment46.
We believe of all EM corporates, Asian ones are particularly
well placed to make even greater commitments to RE100.
Conclusion
ESG will be a defining trend for the 21st Century given the
increasing rates of urbanisation, biodiversity loss, extreme
weather events, food security and possibly even forced
labour and migration that lie in front of us.
The financial sector has a critical role to play in addressing
these challenges through the delivery of investment products,
for example, that facilitate energy access and financial
inclusion in emerging market countries. This will help to
address the fact that still around 1 billion people in the world
have no access to electricity8 and 1.7 billion adults have no
bank account7.
Our research shows that, more than any other region,
emerging markets display the strongest correlation between
ESG and corporate financial performance, yet when it comes
to the adoption of ESG initiatives, commitments are still
relatively patchy. But not for long. We are already seeing
central banks, supervisors and regulators across emerging
markets moving in the area of ESG and they are set to
become even more powerful agents of change in the months
and years ahead.

Why emerging markets are defined by ESG November 2019
11
Forecasts are based on assumptions, estimates, views and hypothetical models or analyses, which might prove inaccurate or incorrect
November 2019 — For Qualified Investors (Art. 10 Para. 3 of the Swiss Federal Collective Investment Schemes Act (CISA).For Professional Clients
(MiFID Directive 2014/65/EU Annex II) only. For Institutional investors only. Further distribution of this material is strictly prohibited.
Australia: For Professional Investors only
References
¹ IMF World Economic Outlook database (October 2019). EM GDP
measured in US dollar terms current prices, and in purchasing power
parity terms
² United National Department of Economic and Social Affairs,
Population Division World Population Prospects 2019
³ DWS Research Institute white paper (December 2015). ESG and
corporate financial performance
4 PRI YouGov Responsible Investment Survey (September 2015)
5 United Nations Population Division. World Population Prospects
2019
6 World Urbanization Prospects 2018; United Nations Economics and
Social Affairs Division
7 The New Climate Economy (December 2018). To protect our
future, new infrastructure must be low-carbon
8 International Energy Agency (October 2018). World Energy
Outlook 2018
9 World Health Organization (May 2018). Ambient air pollution – a
major threat to health and climate
10 World Wildlife Fund (October 2018) Living Planet Index 2018
11 Business and Sustainable Development Commission 2017 (April
2017). Better Business, Better World
12 Global Footprint Network (May 2019). Advancing the science of
sustainability database (2016 database)
13 The Economics of Ecosystems & Biodiversity, TEEB for
Agriculture & Food Interim Report (December 2015);
14 US Department of Agriculture production, supply and distribution
database
15 UN Chief warns of widespread ills from global water crisis (March
2018)
https://www.apnews.com/278d9a84cff74c3a996c88fa2d8d69f3
16 World Resources Institute (August 2019). 17 countries, home to
one quarter of the world’s population, face extremely high water
stress
17 World Water Development Report 2019 (March 2019).
18 Food and Agriculture Organization of the United Nations.
(November 2018). What is happening to agrobiodiversity?
19 Food and Agriculture Organization of the United Nations 2018 The
state of food security and nutrition in the world
20 Intergovernmental Panel on Climate Change (October 2018)
Global warming of 1.5˚C
21 United Nations University Centre for Policy Research (September
2019). Unlocking Potential: A Blueprint for Mobilizing Finance
Against Slavery and Trafficking
22 US Department of Labor (October 2018). 2018 list of goods
produced by child labor or forced labor
23 International Organization for Migration (February 2018). The
World Migration Report 2018
24 Liechtenstein Institute’s financial sector commission on modern
slavery and human trafficking report (September 2019)
25 World Bank Global Findex Database (April 2018). Financial
inclusion on the risk, but gaps remain
26 Symbiotics (September 2019). Microfinance market survey
27 The Smart Campaign (May 2016), Client Protection Certification
Standards
28 MIMOSA (2018) Microfinance index of market outreach and
saturation
29 Germanwatch Global Climate Risk Index 2019 (November 2019).
Who suffers most from extreme weather events?
30 Asian Development Bank (January 2017) A Region at risk: The
human dimensions of climate change in Asia and the Pacific
31 Transparency International (February 2019). Corruption
Perceptions Index report
32 Harvard Law School (February 2019). Corporate Governance in
Emerging Markets
33 Sustainable Stock Exchanges website
34 Sustainable Stock Exchanges (October 2018). 2018 Report on
progress
35 DWS Research Institute white paper (September 2018). ESG and
corporate financial performance: Digging deeper
36 SSE initiative (September 2019). 10 Years of Impact and Progress
37 Bloomberg Finance LP (June 2019) China Set to Lead ESG
Disclosure to Lure Foreign Investments
38 Task Force on Climate-related Financial Disclosures (June 2019).
2019 Status Report
39 Global Sustainable Investment Alliance (April 2019). 2018 Global
Sustainable Investment Review
40 Network for Greening the Financial System (September 2019).
NGFS welcomes four new members and the IMF as an observer
41 Bank Negara Malaysia (September 2019). Governor’s keynote
speech at the regional conference on climate change
42 PRI signatory database (October 2019).
43 PSI signatory and supporters database (October 2019)
44 RE100 database (October 2019)
45 The Climate Group (November 2018). Moving to truly global impact
46 Bloomberg NEF (January 2019). Clean Energy Investment 2018

Why emerging markets are defined by ESG November 2019
Important information – UK - FOR PROFESSIONAL CLIENTS ONLY Issued in the UK by DWS Investments UK Limited. DWS Investments UK Limited is authorised and regulated by the Financial Conduct Authority (Registration number 429806).
DWS is the brand name of DWS Group GmbH & Co. KGaA. The respective legal entities offering products or services under the DWS brand are specified in the respective contracts, sales materials and other product information documents. DWS, through DWS Group GmbH & Co. KGaA, its affiliated companies and its officers and employees (collectively “DWS”) are communicating this document in good faith and on the following basis.
This document is a financial promotion and is for general information purposes only and consequently may not be complete or accurate for your specific purposes. It is not intended to be an offer or solicitation, advice or recommendation, or the basis for any contract to purchase or sell any security, or other instrument, or for DWS to enter into or arrange any type of transaction as a consequence of any information contained herein. It has been prepared without consideration of the investment needs, objectives or financial circumstances of any investor.
This document does not identify all the risks (direct and indirect) or other considerations which might be material to you when entering into a transaction. Before making an investment decision, investors need to consider, with or without the assistance of an investment adviser, whether the investments and strategies described or provided by DWS, are suitability and appropriate, in light of their particular investment needs, objectives and financial circumstances. We assume no responsibility to advise the recipients of this document with regard to changes in our views.
We have gathered the information contained in this document from sources we believe to be reliable; but we do not guarantee the accuracy, completeness or fairness of such information and it should not be relied on as such. DWS has no obligation to update, modify or amend this document or to otherwise notify the recipient in the event that any matter stated herein, or any opinion, projection, forecast or estimate set forth herein, changes or subsequently becomes inaccurate.
DWS does not give taxation or legal advice. Prospective investors should seek advice from their own taxation agents and lawyers regarding the tax consequences on the purchase, ownership, disposal, redemption or transfer of the investments and strategies suggested by DWS. The relevant tax laws or regulations of the tax authorities may change at any time. DWS is not responsible for and has no obligation with respect to any tax implications on the investment suggested.
This document contains forward looking statements. Forward looking statements include, but are not limited to assumptions, estimates, projections, opinions, models and hypothetical performance analysis. The forward looking statements expressed constitute the author‘s judgment as of the date of this document. Forward looking statements involve significant elements of subjective judgments and analyses and changes thereto and/ or consideration of different or additional factors could have a material impact on the results indicated. Therefore, actual results may vary, perhaps materially, from the results contained herein. No representation or warranty is made by DWS as to the reasonableness or completeness of such forward looking statements or to any other financial information contained in this document.
PAST PERFORMANCE IS NO GUARANTEE OF FUTURE RESULTS.
© DWS 2019
Important information – EMEA This marketing communication is intended for professional clients only.
DWS is the brand name under which DWS Group GmbH & Co. KGaA and its subsidiaries operate their business activities. Clients will be provided DWS products or services by one or more legal entities that will be identified to clients pursuant to the contracts, agreements, offering materials or other documentation relevant to such products or services.
The information contained in this document does not constitute investment advice.
All statements of opinion reflect the current assessment of DWS International GmbH and are subject to change without notice.
Forecasts are not a reliable indicator of future performance. Forecasts are based on assumptions, estimates, opinions and hypothetical performance analysis, therefore actual results may vary, perhaps materially, from the results contained here.
Past performance, [actual or simulated], is not a reliable indication of future performance.
The information contained in this document does not constitute a financial analysis but qualifies as marketing communication. This marketing communication is neither subject to all legal provisions ensuring the impartiality of financial analysis nor to any prohibition on trading prior to the publication of financial analyses.
This document and the information contained herein may only be distributed and published in jurisdictions in which such distribution and publication is permissible in accordance with applicable law in those jurisdictions. Direct or indirect distribution of this document is prohibited in the USA as well as to or for the account of US persons and persons residing in the USA.
DWS International GmbH. As of: October 2019.

Why emerging markets are defined by ESG November 2019
Important Information – APAC
DWS is the brand name of DWS Group GmbH & Co. KGaA. The respective legal entities offering products or services under the DWS brand are specified in the respective contracts, sales materials and other product information documents. DWS Group GmbH & Co. KGaA, its affiliated companies and its officers and employees (collectively “DWS Group”) are communicating this document in good faith and on the following basis.
This document has been prepared without consideration of the investment needs, objectives or financial circumstances of any investor. Before making an investment decision, investors need to consider, with or without the assistance of an investment adviser, whether the investments and strategies described or provided by DWS Group, are appropriate, in light of their particular investment needs, objectives and financial circumstances. Furthermore, this document is for information/discussion purposes only and does not constitute an offer, recommendation or solicitation to conclude a transaction and should not be treated as giving investment advice.
DWS Group does not give tax or legal advice. Investors should seek advice from their own tax experts and lawyers, in considering investments and strategies suggested by DWS Group. Investments with DWS Group are not guaranteed, unless specified.
Investments are subject to various risks, including market fluctuations, regulatory change, possible delays in repayment and loss of income and principal invested. The value of investments can fall as well as rise and you might not get back the amount originally invested at any point in time. Furthermore, substantial fluctuations of the value of the investment are possible even over short periods of time. The terms of any investment will be exclusively subject to the detailed provisions, including risk considerations, contained in the offering documents. When making an investment decision, you should rely on the final documentation relating to the transaction and not the summary contained herein. Past performance is no guarantee of current or future performance. Nothing contained herein shall constitute any representation or warranty as to future performance.
Although the information herein has been obtained from sources believed to be reliable, DWS Group does not guarantee its accuracy, completeness or fairness. No liability for any error or omission is accepted by DWS Group. Opinions and estimates may be changed without notice and involve a number of assumptions which may not prove valid. All third party data (such as MSCI, S&P, Dow Jones, FTSE, Bank of America Merrill Lynch, Factset & Bloomberg) are copyrighted by and proprietary to the provider. DWS Group or persons associated with it may (i) maintain a long or short position in securities referred to herein, or in related futures or options, and (ii) purchase or sell, make a market in, or engage in any other transaction involving such securities, and earn brokerage or other compensation.
The document was not produced, reviewed or edited by any research department within DWS Group and is not investment research. Therefore, laws and regulations relating to investment research do not apply to it. Any opinions expressed herein may differ from the opinions expressed by other DWS Group departments including research departments. This document may contain forward looking statements. Forward looking statements include, but are not limited to assumptions, estimates, projections, opinions, models and hypothetical performance analysis. The forward looking statements expressed constitute the author’s judgment as of the date of this material. Forward looking statements involve significant elements of subjective judgments and analyses and changes thereto and/or consideration of different or additional factors could have a material impact on the results indicated. Therefore, actual results may vary, perhaps materially, from the results contained herein. No representation or warranty is made by DWS Group as to the reasonableness or completeness of such forward looking statements or to any other financial information contained herein.
This document may not be reproduced or circulated without DWS Group’s written authority. The manner of circulation and distribution of this document may be restricted by law or regulation in certain countries.
This document is not directed to, or intended for distribution to or use by, any person or entity who is a citizen or resident of or located in any locality, state, country or other jurisdiction, where such distribution, publication, availability or use would be contrary to law or regulation or which would subject DWS Group to any registration or licensing requirement within such jurisdiction not currently met within such jurisdiction. Persons into whose possession this document may come are required to inform themselves of, and to observe, such restrictions.
Unless notified to the contrary in a particular case, investment instruments are not insured by the Federal Deposit Insurance Corporation (”FDIC“) or any other governmental entity, and are not guaranteed by or obligations of DWS Group.
In Hong Kong, this document is issued by DWS Investments Hong Kong Limited and the content of this document has not
been reviewed by the Securities and Futures Commission. © 2019 DWS Investments Hong Kong Limited
In Singapore, this document is issued by DWS Investments Singapore Limited and the content of this document has not been
reviewed by the Monetary Authority of Singapore. © 2019 DWS Investments Singapore Limited
In Australia, this document is issued by DWS Investments Limited (ABN: 52 074 599 401) (AFSL 499640) and the content of
this document has not been reviewed by the Australian Securities Investment Commission. © 2019 DWS Investments Australia Limited
Compliance Code CRC: 071464

Why emerging markets are defined by ESG November 2019
Important information – U.S.
For institutional client and registered representative use only. Not for public viewing or distribution.
Emerging markets tend to be more volatile and less liquid than the markets of more mature economies, and generally have less diverse and less mature economic structures and less stable political systems than those of developed countries. Investing in foreign securities presents certain risks, such as currency fluctuations, political and economic changes, and market risks.
DWS does not render legal or tax advice, and the information contained in this communication should not be regarded as such. The comments, opinions and estimates contained herein are based on or derived from publicly available information from sources that we believe to be reliable. We do not guarantee their accuracy. This material is for informational purposes only and sets forth our views as of this date. The underlying assumptions and these views are subject to change without notice.
Past performance is not indicative of future returns.
Forecasts are based on assumptions, estimates, opinions and hypothetical models that may prove to be incorrect. Investments come with risk. The value of an investment can fall as well as rise and your capital may be at risk. You might not get back the amount originally invested at any point in time.
The brand DWS represents DWS Group GmbH & Co. KGaA and any of its subsidiaries, such as DWS Distributors, Inc., which offers investment products, or DWS Investment Management Americas, Inc. and RREEF America L.L.C., which offer advisory services.
For investors in Bermuda: This is not an offering of securities or interests in any product. Such securities may be offered or
sold in Bermuda only in compliance with the provisions of the Investment Business Act of 2003 of Bermuda which regulates the sale of securities in Bermuda. Additionally, non-Bermudian persons (including companies) may not carry on or engage in any trade or business in Bermuda unless such persons are permitted to do so under applicable Bermuda legislation.
For investors in Argentia / Chile / Peru: “Without limitation, this document does not constitute an offer, an invitation to offer
or a recommendation to enter into any transaction neither does it constitute the offer of securities or funds. The offer of any services and/or securities or funds will be subject to appropriate local legislation and regulation.”
Additional disclaimer for Chile: The information contained in this document is not intended to be an offer of securities. This
information is subject to General Rule No. 336 of the Superintendencia de Valores y Seguros de Chile (“SVS”). The units issued under this fund are not registered with the SVS. The issuer is not required to provide information in Chile on the units issued under the fund. The units may not be publicly offered unless they are properly registered with the SVS.
Additional disclaimer for Peru: The Products may not be offered or sold to the public in Peru. Accordingly, the Products
have not been nor will they be registered with the Peruvian Superintendence of Capital Markets – Public Registry of the Capital Markets- nor have they been submitted to the foregoing agency for approval. Documents relating to the Products, as well as the information contained therein, may not be supplied to the public in Peru.
For investors in Mexico: The funds have not been and will not be registered with the National Registry of Securities,
maintained by the Mexican National Banking Commission and, as a result, may not be offered or sold publicly in Mexico. The fund and any underwriter or purchaser may offer and sell the funds in Mexico, to institutional and Accredited Investors, on a private placement basis, pursuant to Article 8 of the Mexican Securities Market Law. Without limitation, this document does not constitute an offer, an invitation to offer or a recommendation to enter into any transaction neither does it constitute the offer of securities or funds. The offer of any services and/or securities or funds will be subject to appropriate local legislation and regulation.
© 2019 DWS Group GmbH & Co. KGaA. All rights reserved. R-071542_1