Embed Size (px)
Citation preview
medicaid
kaiser commiss ion o nI
S
S
U
E
P
A
P
E
R
a n d t h e uninsured
1 3 3 0 G S T R E E T N W , W A S H I N G T O N , D C 2 0 0 0 5P H O N E : 2 0 2 - 3 4 7 - 5 2 7 0 , F A X : 2 0 2 - 3 4 7 - 5 2 7 4W E B S I T E : W W W . K F F . O R G
Revised November 2012
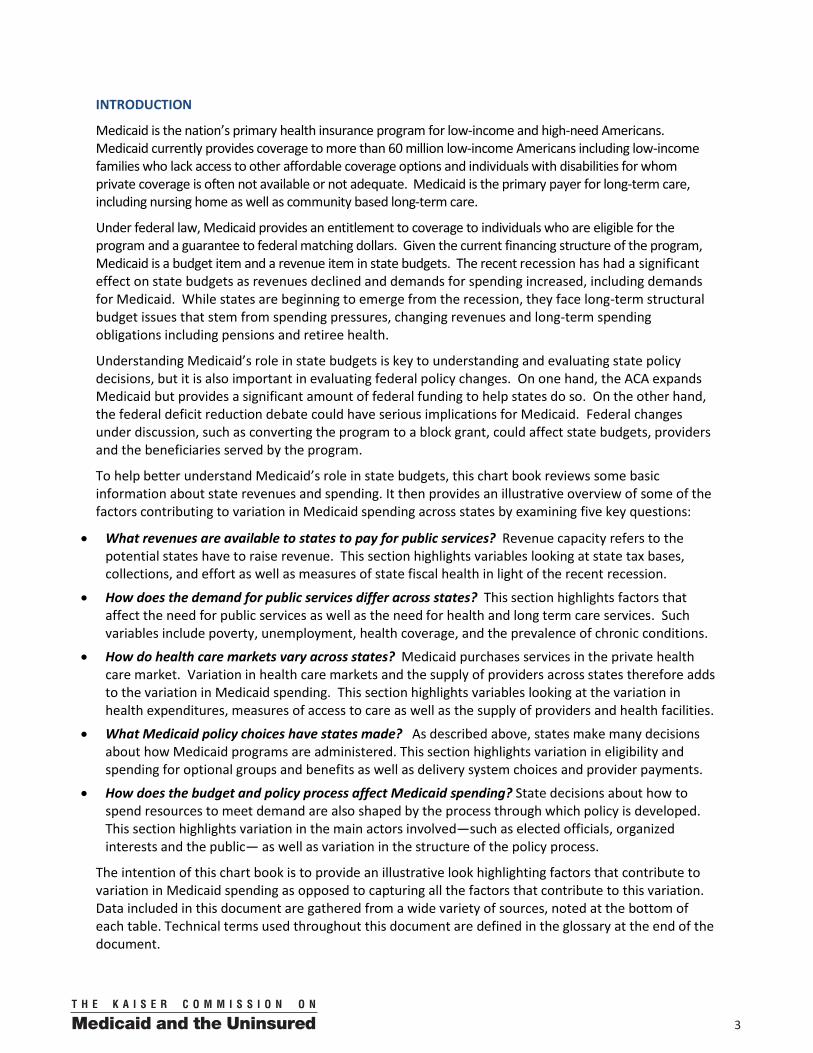
WHY DOES MEDICAID SPENDING VARY ACROSS STATES: A CHART BOOK OF FACTORS DRIVING STATE SPENDING
by Laura Snyder, Robin Rudowitz, Rachel Garfield, and Tracy Gordon1 SUMMARY Covering more than 60 million people, Medicaid provides health and long-term care coverage for low-income families who lack access to other affordable coverage options; for individuals with disabilities for whom private coverage is often not available or inadequate; and for Medicare beneficiaries who need assistance with cost-sharing or services not covered by Medicare. All states have elected to participate in Medicaid as a means of financing the costs of health care and long-term care services for their low-income residents.1
To participate in Medicaid, states are required to meet federal core requirements; however, states have significant flexibility to expand beyond program minimums for benefits and coverage, to determine how care is delivered, and to determine what and how providers are paid. As a result of this flexibility, there is significant variation in Medicaid programs across states. Beyond these policy choices, other factors such as a state’s ability to raise revenue, the need for public services, the health care markets in which Medicaid operates as well as the policy process all lead to variation in Medicaid programs and spending.
The recent recession has had a significant effect on state budgets as revenues declined and demands for spending increased. This increased pressure has elevated the discussion about underlying structural state budget issues and Medicaid’s role in state budgets. For example, a State Budget Crisis Task Force recently assembled by experts in state finance released a report examining threats to state fiscal sustainability, including increased volatility in state tax bases and Medicaid spending.2
Looking ahead to federal policy changes, the Affordable Care Act (ACA) expands Medicaid but provides a significant amount of federal funding to help states do so. However, as efforts to reduce the federal deficit intensify, changes to Medicaid are likely to be part of that debate. In the past few years, Medicaid proposals included in larger deficit reduction plans have varied significantly in scope and the magnitude of the cuts. Federal changes under discussion, such as converting the program to a block grant, could affect state budgets, providers and the beneficiaries served by the program.
To help better understand Medicaid’s role in state budgets and the potential implications of federal changes to the program, this chart book reviews information about state budgets and then provides an overview of factors contributing to variation in Medicaid spending across states by examining five key questions:
What is the revenue available to states to pay for public services? How does the demand for public services differ across states? What is the variation in health care markets across states? What Medicaid policy choices have states made? How does the budget and policy process affect Medicaid spending?
1 Laura Snyder, Robin Rudowitz, and Rachel Garfield are with the Kaiser Commission on Medicaid and the Uninsured. Tracy Gordon is a Fellow of Economic Studies at The Brookings Institution.

00 3
INTRODUCTION
Medicaid is the nation’s primary health insurance program for low-income and high-need Americans. Medicaid currently provides coverage to more than 60 million low-income Americans including low-income families who lack access to other affordable coverage options and individuals with disabilities for whom private coverage is often not available or not adequate. Medicaid is the primary payer for long-term care, including nursing home as well as community based long-term care.
Under federal law, Medicaid provides an entitlement to coverage to individuals who are eligible for the program and a guarantee to federal matching dollars. Given the current financing structure of the program, Medicaid is a budget item and a revenue item in state budgets. The recent recession has had a significant effect on state budgets as revenues declined and demands for spending increased, including demands for Medicaid. While states are beginning to emerge from the recession, they face long-term structural budget issues that stem from spending pressures, changing revenues and long-term spending obligations including pensions and retiree health.
Understanding Medicaid’s role in state budgets is key to understanding and evaluating state policy decisions, but it is also important in evaluating federal policy changes. On one hand, the ACA expands Medicaid but provides a significant amount of federal funding to help states do so. On the other hand, the federal deficit reduction debate could have serious implications for Medicaid. Federal changes under discussion, such as converting the program to a block grant, could affect state budgets, providers and the beneficiaries served by the program.
To help better understand Medicaid’s role in state budgets, this chart book reviews some basic information about state revenues and spending. It then provides an illustrative overview of some of the factors contributing to variation in Medicaid spending across states by examining five key questions:
What revenues are available to states to pay for public services? Revenue capacity refers to the potential states have to raise revenue. This section highlights variables looking at state tax bases, collections, and effort as well as measures of state fiscal health in light of the recent recession.
How does the demand for public services differ across states? This section highlights factors that affect the need for public services as well as the need for health and long term care services. Such variables include poverty, unemployment, health coverage, and the prevalence of chronic conditions.
How do health care markets vary across states? Medicaid purchases services in the private health care market. Variation in health care markets and the supply of providers across states therefore adds to the variation in Medicaid spending. This section highlights variables looking at the variation in health expenditures, measures of access to care as well as the supply of providers and health facilities.
What Medicaid policy choices have states made? As described above, states make many decisions about how Medicaid programs are administered. This section highlights variation in eligibility and spending for optional groups and benefits as well as delivery system choices and provider payments.
How does the budget and policy process affect Medicaid spending? State decisions about how to spend resources to meet demand are also shaped by the process through which policy is developed. This section highlights variation in the main actors involved—such as elected officials, organized interests and the public— as well as variation in the structure of the policy process.
The intention of this chart book is to provide an illustrative look highlighting factors that contribute to variation in Medicaid spending as opposed to capturing all the factors that contribute to this variation. Data included in this document are gathered from a wide variety of sources, noted at the bottom of each table. Technical terms used throughout this document are defined in the glossary at the end of the document.
004
OVERVIEW OF MEDICAID SPENDING VARIATION
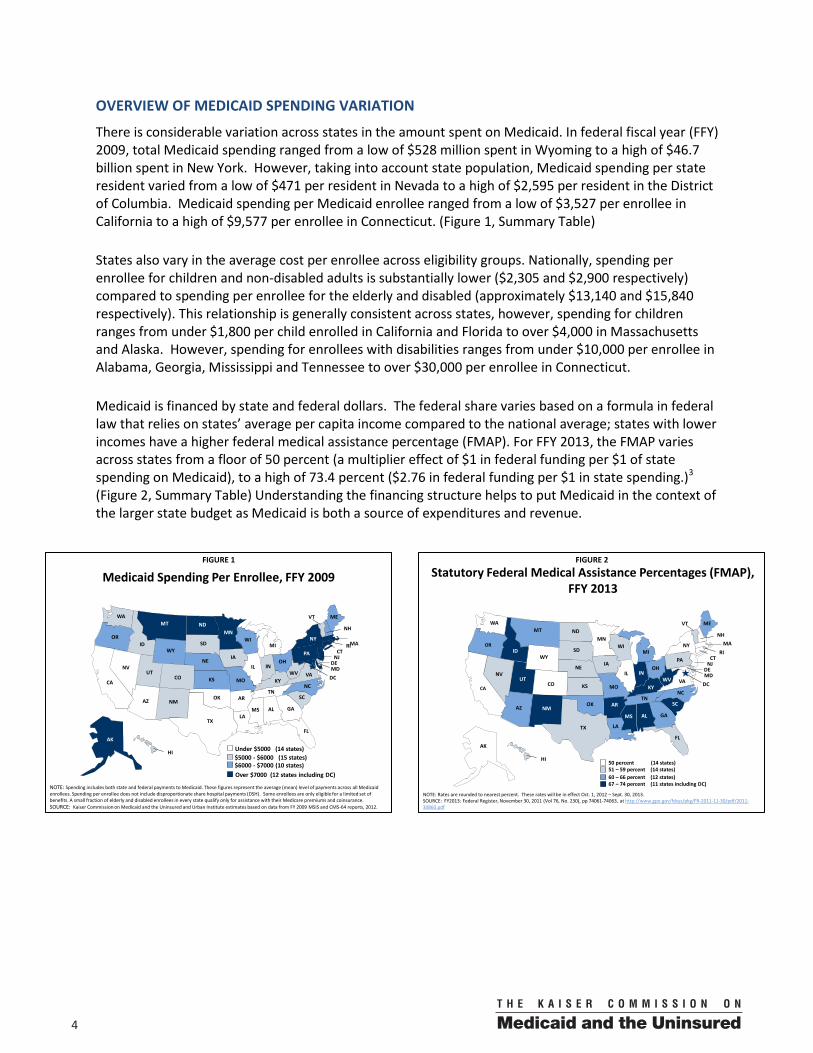
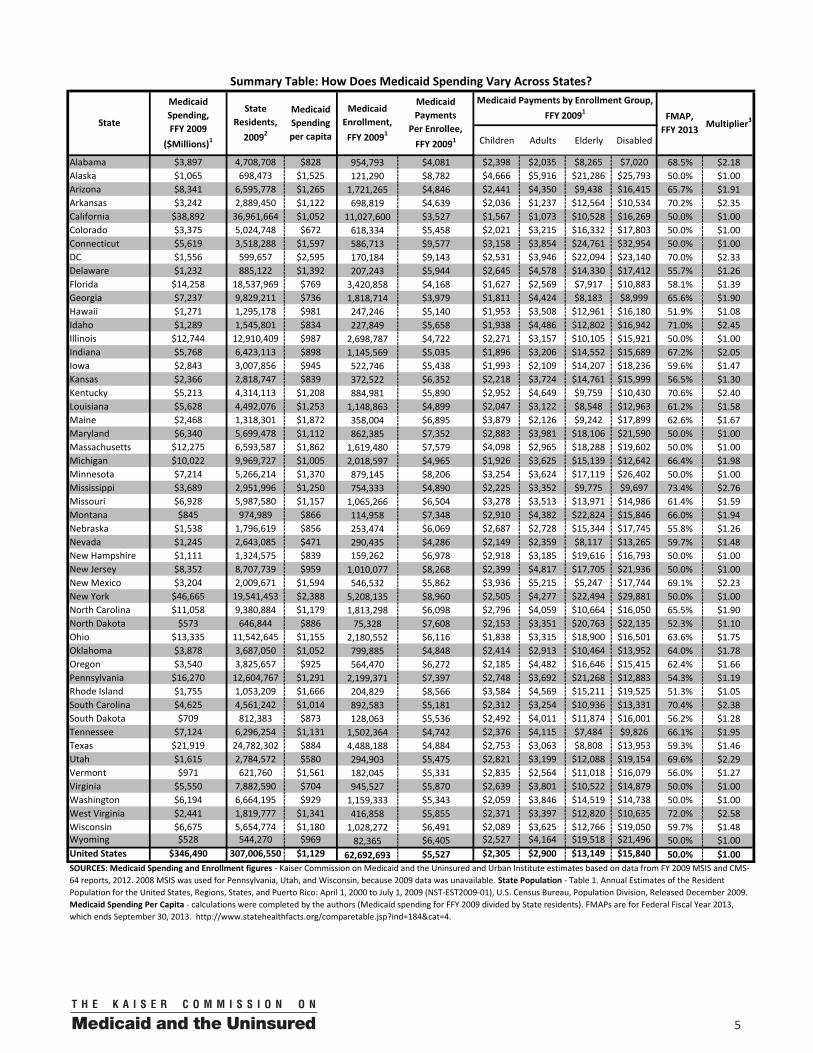
There is considerable variation across states in the amount spent on Medicaid. In federal fiscal year (FFY) 2009, total Medicaid spending ranged from a low of $528 million spent in Wyoming to a high of $46.7 billion spent in New York. However, taking into account state population, Medicaid spending per state resident varied from a low of $471 per resident in Nevada to a high of $2,595 per resident in the District of Columbia. Medicaid spending per Medicaid enrollee ranged from a low of $3,527 per enrollee in California to a high of $9,577 per enrollee in Connecticut. (Figure 1, Summary Table)
States also vary in the average cost per enrollee across eligibility groups. Nationally, spending per enrollee for children and non-disabled adults is substantially lower ($2,305 and $2,900 respectively) compared to spending per enrollee for the elderly and disabled (approximately $13,140 and $15,840 respectively). This relationship is generally consistent across states, however, spending for children ranges from under $1,800 per child enrolled in California and Florida to over $4,000 in Massachusetts and Alaska. However, spending for enrollees with disabilities ranges from under $10,000 per enrollee in Alabama, Georgia, Mississippi and Tennessee to over $30,000 per enrollee in Connecticut.
Medicaid is financed by state and federal dollars. The federal share varies based on a formula in federal law that relies on states’ average per capita income compared to the national average; states with lower incomes have a higher federal medical assistance percentage (FMAP). For FFY 2013, the FMAP varies across states from a floor of 50 percent (a multiplier effect of $1 in federal funding per $1 of state spending on Medicaid), to a high of 73.4 percent ($2.76 in federal funding per $1 in state spending.)3 (Figure 2, Summary Table) Understanding the financing structure helps to put Medicaid in the context of the larger state budget as Medicaid is both a source of expenditures and revenue.
FIGURE 1
WY
WI
WV
WA
VA
VT
UT
TX
TN
SD
SC
RIPA
OR
OK
OH
ND
NC
NY
NM
NJ
NH
NVNE
MT
MO
MS
MN
MI MA
MD
ME
LA
KYKS
IAINIL
ID
HI
GA
FL
DC
DE
CT
COCA
ARAZ
AK
AL
NOTE: Spending includes both state and federal payments to Medicaid. These figures represent the average (mean) level of payments across all Medicaid enrollees. Spending per enrollee does not include disproportionate share hospital payments (DSH). Some enrollees are only eligible for a limited set of benefits. A small fraction of elderly and disabled enrollees in every state qualify only for assistance with their Medicare premiums and coinsurance. SOURCE: Kaiser Commission on Medicaid and the Uninsured and Urban Institute estimates based on data from FY 2009 MSIS and CMS-64 reports, 2012.
Over $7000 (12 states including DC)$6000 - $7000 (10 states)$5000 - $6000 (15 states)Under $5000 (14 states)
Medicaid Spending Per Enrollee, FFY 2009FIGURE 2
WY
WI
WV
WA
VA
VT
UT
TX
TN
SD
SC
RIPA
OR
OK
OH
ND
NC
NY
NM
NJ
NH
NVNE
MT
MO
MS
MN
MIMA
MD
ME
LA
KYKS
IA
INIL
ID
HI
GA
FL
DC
DE
CT
COCA
ARAZ
AK
AL
NOTE: Rates are rounded to nearest percent. These rates will be in effect Oct. 1, 2012 – Sept. 30, 2013.SOURCE: FY2013: Federal Register, November 30, 2011 (Vol 76, No. 230), pp 74061-74063, at http://www.gpo.gov/fdsys/pkg/FR-2011-11-30/pdf/2011-30860.pdf
67 – 74 percent (11 states including DC)60 – 66 percent (12 states)51 – 59 percent (14 states)50 percent (14 states)
Statutory Federal Medical Assistance Percentages (FMAP), FFY 2013
00 5
Children Adults Elderly Disabled
Alabama $3,897 4,708,708 $828 954,793 $4,081 $2,398 $2,035 $8,265 $7,020 68.5% $2.18Alaska $1,065 698,473 $1,525 121,290 $8,782 $4,666 $5,916 $21,286 $25,793 50.0% $1.00Arizona $8,341 6,595,778 $1,265 1,721,265 $4,846 $2,441 $4,350 $9,438 $16,415 65.7% $1.91Arkansas $3,242 2,889,450 $1,122 698,819 $4,639 $2,036 $1,237 $12,564 $10,534 70.2% $2.35California $38,892 36,961,664 $1,052 11,027,600 $3,527 $1,567 $1,073 $10,528 $16,269 50.0% $1.00Colorado $3,375 5,024,748 $672 618,334 $5,458 $2,021 $3,215 $16,332 $17,803 50.0% $1.00Connecticut $5,619 3,518,288 $1,597 586,713 $9,577 $3,158 $3,854 $24,761 $32,954 50.0% $1.00DC $1,556 599,657 $2,595 170,184 $9,143 $2,531 $3,946 $22,094 $23,140 70.0% $2.33Delaware $1,232 885,122 $1,392 207,243 $5,944 $2,645 $4,578 $14,330 $17,412 55.7% $1.26Florida $14,258 18,537,969 $769 3,420,858 $4,168 $1,627 $2,569 $7,917 $10,883 58.1% $1.39Georgia $7,237 9,829,211 $736 1,818,714 $3,979 $1,811 $4,424 $8,183 $8,999 65.6% $1.90Hawaii $1,271 1,295,178 $981 247,246 $5,140 $1,953 $3,508 $12,961 $16,180 51.9% $1.08Idaho $1,289 1,545,801 $834 227,849 $5,658 $1,938 $4,486 $12,802 $16,942 71.0% $2.45Illinois $12,744 12,910,409 $987 2,698,787 $4,722 $2,271 $3,157 $10,105 $15,921 50.0% $1.00Indiana $5,768 6,423,113 $898 1,145,569 $5,035 $1,896 $3,206 $14,552 $15,689 67.2% $2.05Iowa $2,843 3,007,856 $945 522,746 $5,438 $1,993 $2,109 $14,207 $18,236 59.6% $1.47Kansas $2,366 2,818,747 $839 372,522 $6,352 $2,218 $3,724 $14,761 $15,999 56.5% $1.30Kentucky $5,213 4,314,113 $1,208 884,981 $5,890 $2,952 $4,649 $9,759 $10,430 70.6% $2.40Louisiana $5,628 4,492,076 $1,253 1,148,863 $4,899 $2,047 $3,122 $8,548 $12,963 61.2% $1.58Maine $2,468 1,318,301 $1,872 358,004 $6,895 $3,879 $2,126 $9,242 $17,899 62.6% $1.67Maryland $6,340 5,699,478 $1,112 862,385 $7,352 $2,883 $3,981 $18,106 $21,590 50.0% $1.00Massachusetts $12,275 6,593,587 $1,862 1,619,480 $7,579 $4,098 $2,965 $18,288 $19,602 50.0% $1.00Michigan $10,022 9,969,727 $1,005 2,018,597 $4,965 $1,926 $3,625 $15,139 $12,642 66.4% $1.98Minnesota $7,214 5,266,214 $1,370 879,145 $8,206 $3,254 $3,624 $17,119 $26,402 50.0% $1.00Mississippi $3,689 2,951,996 $1,250 754,333 $4,890 $2,225 $3,352 $9,775 $9,697 73.4% $2.76Missouri $6,928 5,987,580 $1,157 1,065,266 $6,504 $3,278 $3,513 $13,971 $14,986 61.4% $1.59Montana $845 974,989 $866 114,958 $7,348 $2,910 $4,382 $22,824 $15,846 66.0% $1.94Nebraska $1,538 1,796,619 $856 253,474 $6,069 $2,687 $2,728 $15,344 $17,745 55.8% $1.26Nevada $1,245 2,643,085 $471 290,435 $4,286 $2,149 $2,359 $8,117 $13,265 59.7% $1.48New Hampshire $1,111 1,324,575 $839 159,262 $6,978 $2,918 $3,185 $19,616 $16,793 50.0% $1.00New Jersey $8,352 8,707,739 $959 1,010,077 $8,268 $2,399 $4,817 $17,705 $21,936 50.0% $1.00New Mexico $3,204 2,009,671 $1,594 546,532 $5,862 $3,936 $5,215 $5,247 $17,744 69.1% $2.23New York $46,665 19,541,453 $2,388 5,208,135 $8,960 $2,505 $4,277 $22,494 $29,881 50.0% $1.00North Carolina $11,058 9,380,884 $1,179 1,813,298 $6,098 $2,796 $4,059 $10,664 $16,050 65.5% $1.90North Dakota $573 646,844 $886 75,328 $7,608 $2,153 $3,351 $20,763 $22,135 52.3% $1.10Ohio $13,335 11,542,645 $1,155 2,180,552 $6,116 $1,838 $3,315 $18,900 $16,501 63.6% $1.75Oklahoma $3,878 3,687,050 $1,052 799,885 $4,848 $2,414 $2,913 $10,464 $13,952 64.0% $1.78Oregon $3,540 3,825,657 $925 564,470 $6,272 $2,185 $4,482 $16,646 $15,415 62.4% $1.66Pennsylvania $16,270 12,604,767 $1,291 2,199,371 $7,397 $2,748 $3,692 $21,268 $12,883 54.3% $1.19Rhode Island $1,755 1,053,209 $1,666 204,829 $8,566 $3,584 $4,569 $15,211 $19,525 51.3% $1.05South Carolina $4,625 4,561,242 $1,014 892,583 $5,181 $2,312 $3,254 $10,936 $13,331 70.4% $2.38South Dakota $709 812,383 $873 128,063 $5,536 $2,492 $4,011 $11,874 $16,001 56.2% $1.28Tennessee $7,124 6,296,254 $1,131 1,502,364 $4,742 $2,376 $4,115 $7,484 $9,826 66.1% $1.95Texas $21,919 24,782,302 $884 4,488,188 $4,884 $2,753 $3,063 $8,808 $13,953 59.3% $1.46Utah $1,615 2,784,572 $580 294,903 $5,475 $2,821 $3,199 $12,088 $19,154 69.6% $2.29Vermont $971 621,760 $1,561 182,045 $5,331 $2,835 $2,564 $11,018 $16,079 56.0% $1.27Virginia $5,550 7,882,590 $704 945,527 $5,870 $2,639 $3,801 $10,522 $14,879 50.0% $1.00Washington $6,194 6,664,195 $929 1,159,333 $5,343 $2,059 $3,846 $14,519 $14,738 50.0% $1.00West Virginia $2,441 1,819,777 $1,341 416,858 $5,855 $2,371 $3,397 $12,820 $10,635 72.0% $2.58Wisconsin $6,675 5,654,774 $1,180 1,028,272 $6,491 $2,089 $3,625 $12,766 $19,050 59.7% $1.48Wyoming $528 544,270 $969 82,365 $6,405 $2,527 $4,164 $19,518 $21,496 50.0% $1.00United States $346,490 307,006,550 $1,129 62,692,693 $5,527 $2,305 $2,900 $13,149 $15,840 50.0% $1.00SOURCES: Medicaid Spending and Enrollment figures - Kaiser Commission on Medicaid and the Uninsured and Urban Institute estimates based on data from FY 2009 MSIS and CMS-64 reports, 2012. 2008 MSIS was used for Pennsylvania, Utah, and Wisconsin, because 2009 data was unavailable. State Population - Table 1. Annual Estimates of the Resident Population for the United States, Regions, States, and Puerto Rico: April 1, 2000 to July 1, 2009 (NST-EST2009-01), U.S. Census Bureau, Population Division, Released December 2009. Medicaid Spending Per Capita - calculations were completed by the authors (Medicaid spending for FFY 2009 divided by State residents). FMAPs are for Federal Fiscal Year 2013, which ends September 30, 2013. http://www.statehealthfacts.org/comparetable.jsp?ind=184&cat=4.
Summary Table: How Does Medicaid Spending Vary Across States?
State
Medicaid Spending, FFY 2009
($Millions)1
State Residents,
20092
Medicaid Spending per capita
Medicaid Enrollment, FFY 20091
Medicaid Payments
Per Enrollee, FFY 20091
Medicaid Payments by Enrollment Group, FFY 20091 FMAP,
FFY 2013 Multiplier3
006
OVERVIEW OF STATE BUDGETS
1. Where Does the Money Come From?
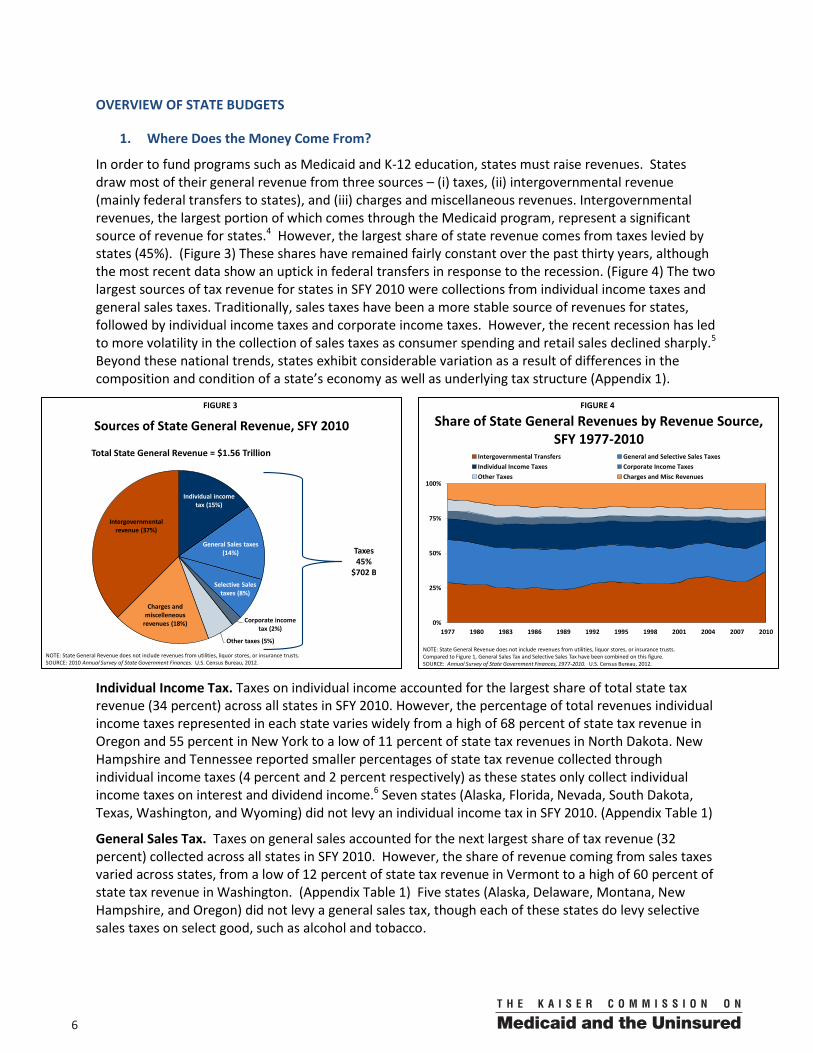
In order to fund programs such as Medicaid and K-12 education, states must raise revenues. States draw most of their general revenue from three sources – (i) taxes, (ii) intergovernmental revenue (mainly federal transfers to states), and (iii) charges and miscellaneous revenues. Intergovernmental revenues, the largest portion of which comes through the Medicaid program, represent a significant source of revenue for states.4 However, the largest share of state revenue comes from taxes levied by states (45%). (Figure 3) These shares have remained fairly constant over the past thirty years, although the most recent data show an uptick in federal transfers in response to the recession. (Figure 4) The two largest sources of tax revenue for states in SFY 2010 were collections from individual income taxes and general sales taxes. Traditionally, sales taxes have been a more stable source of revenues for states, followed by individual income taxes and corporate income taxes. However, the recent recession has led to more volatility in the collection of sales taxes as consumer spending and retail sales declined sharply.5 Beyond these national trends, states exhibit considerable variation as a result of differences in the composition and condition of a state’s economy as well as underlying tax structure (Appendix 1).
Individual Income Tax. Taxes on individual income accounted for the largest share of total state tax revenue (34 percent) across all states in SFY 2010. However, the percentage of total revenues individual income taxes represented in each state varies widely from a high of 68 percent of state tax revenue in Oregon and 55 percent in New York to a low of 11 percent of state tax revenues in North Dakota. New Hampshire and Tennessee reported smaller percentages of state tax revenue collected through individual income taxes (4 percent and 2 percent respectively) as these states only collect individual income taxes on interest and dividend income.6 Seven states (Alaska, Florida, Nevada, South Dakota, Texas, Washington, and Wyoming) did not levy an individual income tax in SFY 2010. (Appendix Table 1)
General Sales Tax. Taxes on general sales accounted for the next largest share of tax revenue (32 percent) collected across all states in SFY 2010. However, the share of revenue coming from sales taxes varied across states, from a low of 12 percent of state tax revenue in Vermont to a high of 60 percent of state tax revenue in Washington. (Appendix Table 1) Five states (Alaska, Delaware, Montana, New Hampshire, and Oregon) did not levy a general sales tax, though each of these states do levy selective sales taxes on select good, such as alcohol and tobacco.
FIGURE 3
Sources of State General Revenue, SFY 2010
NOTE: State General Revenue does not include revenues from utilities, liquor stores, or insurance trusts.SOURCE: 2010 Annual Survey of State Government Finances. U.S. Census Bureau, 2012.
Individual income tax (15%)
General Sales taxes (14%)
Selective Sales taxes (8%)
Corporate income tax (2%)
Other taxes (5%)
Charges and miscelleneous
revenues (18%)
Intergovernmental revenue (37%)
Total State General Revenue = $1.56 Trillion
Taxes45%
$702 B
FIGURE 4
Share of State General Revenues by Revenue Source, SFY 1977-2010
0%
25%
50%
75%
100%
1977 1980 1983 1986 1989 1992 1995 1998 2001 2004 2007 2010
Intergovernmental Transfers General and Selective Sales TaxesIndividual Income Taxes Corporate Income TaxesOther Taxes Charges and Misc Revenues
NOTE: State General Revenue does not include revenues from utilities, liquor stores, or insurance trusts. Compared to Figure 1, General Sales Tax and Selective Sales Tax have been combined on this figure.SOURCE: Annual Survey of State Government Finances, 1977-2010. U.S. Census Bureau, 2012.
00 7
2. Where Does the Money Go?
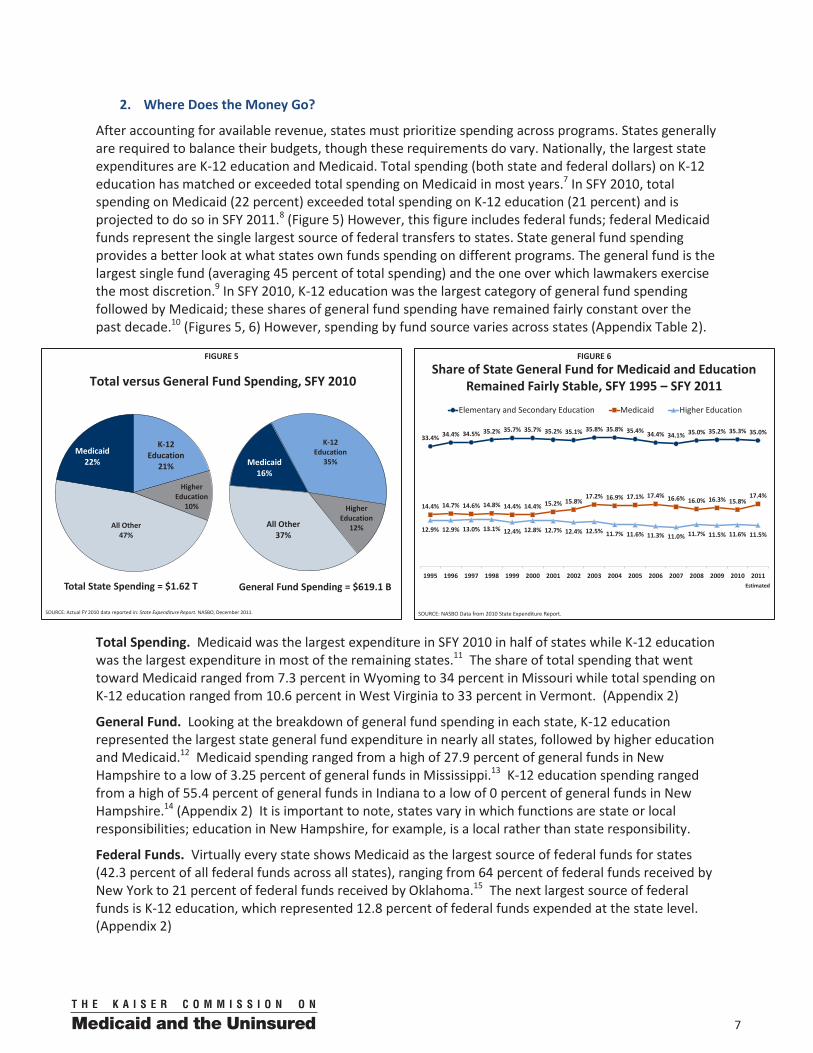
After accounting for available revenue, states must prioritize spending across programs. States generally are required to balance their budgets, though these requirements do vary. Nationally, the largest state expenditures are K-12 education and Medicaid. Total spending (both state and federal dollars) on K-12 education has matched or exceeded total spending on Medicaid in most years.7 In SFY 2010, total spending on Medicaid (22 percent) exceeded total spending on K-12 education (21 percent) and is projected to do so in SFY 2011.8 (Figure 5) However, this figure includes federal funds; federal Medicaid funds represent the single largest source of federal transfers to states. State general fund spending provides a better look at what states own funds spending on different programs. The general fund is the largest single fund (averaging 45 percent of total spending) and the one over which lawmakers exercise the most discretion.9 In SFY 2010, K-12 education was the largest category of general fund spending followed by Medicaid; these shares of general fund spending have remained fairly constant over the past decade.10 (Figures 5, 6) However, spending by fund source varies across states (Appendix Table 2).
Total Spending. Medicaid was the largest expenditure in SFY 2010 in half of states while K-12 education was the largest expenditure in most of the remaining states.11 The share of total spending that went toward Medicaid ranged from 7.3 percent in Wyoming to 34 percent in Missouri while total spending on K-12 education ranged from 10.6 percent in West Virginia to 33 percent in Vermont. (Appendix 2)
General Fund. Looking at the breakdown of general fund spending in each state, K-12 education represented the largest state general fund expenditure in nearly all states, followed by higher education and Medicaid.12 Medicaid spending ranged from a high of 27.9 percent of general funds in New Hampshire to a low of 3.25 percent of general funds in Mississippi.13 K-12 education spending ranged from a high of 55.4 percent of general funds in Indiana to a low of 0 percent of general funds in New Hampshire.14 (Appendix 2) It is important to note, states vary in which functions are state or local responsibilities; education in New Hampshire, for example, is a local rather than state responsibility.
Federal Funds. Virtually every state shows Medicaid as the largest source of federal funds for states (42.3 percent of all federal funds across all states), ranging from 64 percent of federal funds received by New York to 21 percent of federal funds received by Oklahoma.15 The next largest source of federal funds is K-12 education, which represented 12.8 percent of federal funds expended at the state level. (Appendix 2)
FIGURE 5
K-12 Education
21%
Higher Education
10%
All Other47%
Medicaid22%
Total State Spending = $1.62 T
Total versus General Fund Spending, SFY 2010
SOURCE: Actual FY 2010 data reported in: State Expenditure Report. NASBO, December 2011.
Medicaid16%
K-12 Education
35%
Higher Education
12%All Other37%
General Fund Spending = $619.1 B
FIGURE 6
Share of State General Fund for Medicaid and Education Remained Fairly Stable, SFY 1995 – SFY 2011
SOURCE: NASBO Data from 2010 State Expenditure Report.
33.4% 34.4% 34.5% 35.2% 35.7% 35.7% 35.2% 35.1% 35.8% 35.8% 35.4% 34.4% 34.1% 35.0% 35.2% 35.3% 35.0%
14.4% 14.7% 14.6% 14.8% 14.4% 14.4% 15.2% 15.8%17.2% 16.9% 17.1% 17.4% 16.6% 16.0% 16.3% 15.8%
17.4%
12.9% 12.9% 13.0% 13.1% 12.4% 12.8% 12.7% 12.4% 12.5% 11.7% 11.6% 11.3% 11.0% 11.7% 11.5% 11.6% 11.5%
1995 1996 1997 1998 1999 2000 2001 2002 2003 2004 2005 2006 2007 2008 2009 2010 2011
Elementary and Secondary Education Medicaid Higher Education
Estimated
008
FACTORS THAT CONTRIBUTE TO VARIATION IN MEDICAID SPENDING ACROSS STATES
1. What Revenues are Available to States to Pay for Public Services?
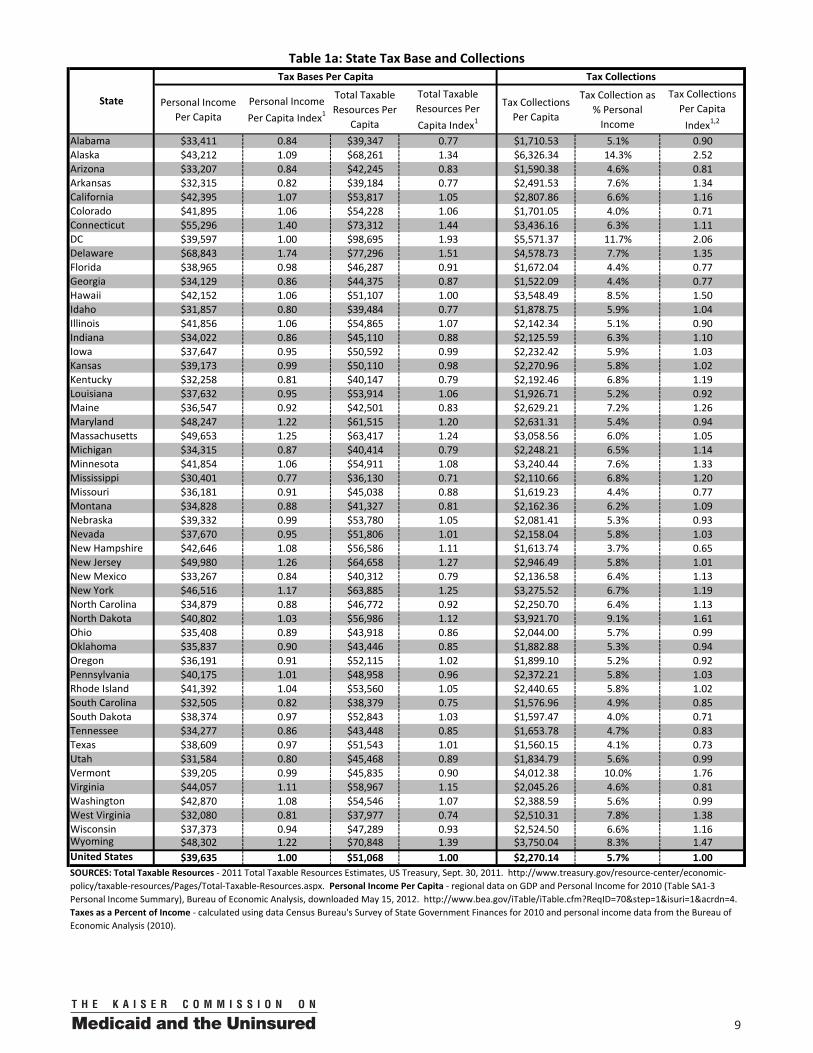
States vary in the amount of resources available within the state and in how they tap into those resources to pay for public services and programs. The recent recession also has affected state resources; however, the magnitude of the effect of the recession and current fiscal health varies across states. Table 1a presents measures of state tax bases and collections while table 1b presents measures of state fiscal health and the impact of the recent recession.
Tax Base. A states’ tax base provides a measure of resources that may be available to a state. Two measures of tax base include personal income and total taxable resources. These measures are the base from which more representative measures of a states’ tax capacity can be calculated. 16
Personal Income.17 Personal income measures the total personal income of a state's residents. This measure is currently used to determine the FMAP for Medicaid and other programs. Personal income per capita is commonly used as it is available consistently across states and updated annually. However, this measure does not include all potential taxable income sources in a state, such as 1) profits retained for investment purposes by corporations or other business entities and 2) business or commuter income earned in the state by out of state residents, which can be influential in areas with large commuter populations, i.e. New York and New Jersey.18 Personal income per capita in 2010 was $39,635 nationally, ranging from less than $31,000 in Mississippi to nearly $70,000 in Delaware. (Table 1a)
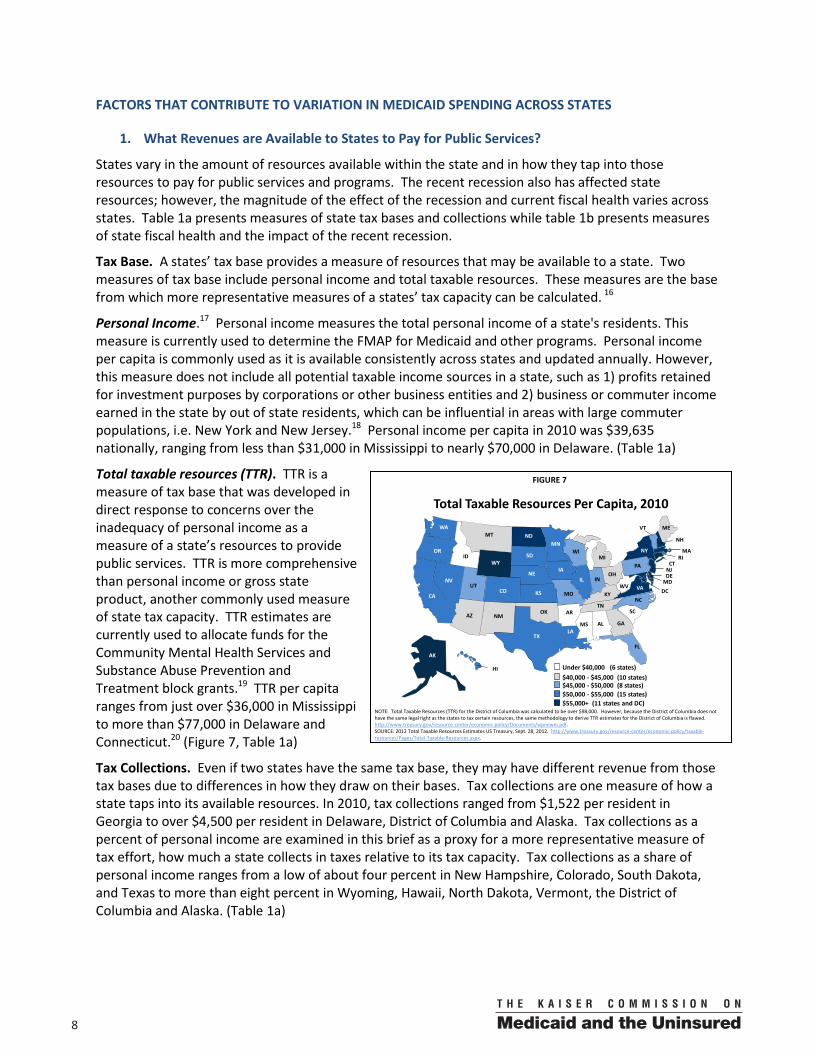
Total taxable resources (TTR). TTR is a measure of tax base that was developed in direct response to concerns over the inadequacy of personal income as a measure of a state’s resources to provide public services. TTR is more comprehensive than personal income or gross state product, another commonly used measure of state tax capacity. TTR estimates are currently used to allocate funds for the Community Mental Health Services and Substance Abuse Prevention and Treatment block grants.19 TTR per capita ranges from just over $36,000 in Mississippi to more than $77,000 in Delaware and Connecticut.20 (Figure 7, Table 1a)
Tax Collections. Even if two states have the same tax base, they may have different revenue from those tax bases due to differences in how they draw on their bases. Tax collections are one measure of how a state taps into its available resources. In 2010, tax collections ranged from $1,522 per resident in Georgia to over $4,500 per resident in Delaware, District of Columbia and Alaska. Tax collections as a percent of personal income are examined in this brief as a proxy for a more representative measure of tax effort, how much a state collects in taxes relative to its tax capacity. Tax collections as a share of personal income ranges from a low of about four percent in New Hampshire, Colorado, South Dakota, and Texas to more than eight percent in Wyoming, Hawaii, North Dakota, Vermont, the District of Columbia and Alaska. (Table 1a)
FIGURE 7
WY
WI
WV
WA
VA
VT
UT
TX
TN
SD
SC
RIPA
OR
OK
OH
ND
NC
NY
NM
NJ
NH
NVNE
MT
MO
MS
MN
MIMA
MD
ME
LA
KYKS
IA
INIL
ID
HI
GA
FL
DC
DE
CT
COCA
ARAZ
AK
AL
NOTE: Total Taxable Resources (TTR) for the District of Columbia was calculated to be over $98,000. However, because the District of Columbia does not have the same legal right as the states to tax certain resources, the same methodology to derive TTR estimates for the District of Columbia is flawed. http://www.treasury.gov/resource-center/economic-policy/Documents/wpnewm.pdf.SOURCE: 2012 Total Taxable Resources Estimates US Treasury, Sept. 28, 2012. http://www.treasury.gov/resource-center/economic-policy/taxable-resources/Pages/Total-Taxable-Resources.aspx.
Total Taxable Resources Per Capita, 2010
$50,000 - $55,000 (15 states)$45,000 - $50,000 (8 states)$40,000 - $45,000 (10 states)Under $40,000 (6 states)
$55,000+ (11 states and DC)
00 9
Personal Income Per Capita
Personal Income Per Capita Index1
Total Taxable Resources Per
Capita
Total Taxable Resources Per Capita Index1
Tax Collections Per Capita
Tax Collection as % Personal
Income
Tax Collections Per Capita
Index1,2
Alabama $33,411 0.84 $39,347 0.77 $1,710.53 5.1% 0.90Alaska $43,212 1.09 $68,261 1.34 $6,326.34 14.3% 2.52Arizona $33,207 0.84 $42,245 0.83 $1,590.38 4.6% 0.81Arkansas $32,315 0.82 $39,184 0.77 $2,491.53 7.6% 1.34California $42,395 1.07 $53,817 1.05 $2,807.86 6.6% 1.16Colorado $41,895 1.06 $54,228 1.06 $1,701.05 4.0% 0.71Connecticut $55,296 1.40 $73,312 1.44 $3,436.16 6.3% 1.11DC $39,597 1.00 $98,695 1.93 $5,571.37 11.7% 2.06Delaware $68,843 1.74 $77,296 1.51 $4,578.73 7.7% 1.35Florida $38,965 0.98 $46,287 0.91 $1,672.04 4.4% 0.77Georgia $34,129 0.86 $44,375 0.87 $1,522.09 4.4% 0.77Hawaii $42,152 1.06 $51,107 1.00 $3,548.49 8.5% 1.50Idaho $31,857 0.80 $39,484 0.77 $1,878.75 5.9% 1.04Illinois $41,856 1.06 $54,865 1.07 $2,142.34 5.1% 0.90Indiana $34,022 0.86 $45,110 0.88 $2,125.59 6.3% 1.10Iowa $37,647 0.95 $50,592 0.99 $2,232.42 5.9% 1.03Kansas $39,173 0.99 $50,110 0.98 $2,270.96 5.8% 1.02Kentucky $32,258 0.81 $40,147 0.79 $2,192.46 6.8% 1.19Louisiana $37,632 0.95 $53,914 1.06 $1,926.71 5.2% 0.92Maine $36,547 0.92 $42,501 0.83 $2,629.21 7.2% 1.26Maryland $48,247 1.22 $61,515 1.20 $2,631.31 5.4% 0.94Massachusetts $49,653 1.25 $63,417 1.24 $3,058.56 6.0% 1.05Michigan $34,315 0.87 $40,414 0.79 $2,248.21 6.5% 1.14Minnesota $41,854 1.06 $54,911 1.08 $3,240.44 7.6% 1.33Mississippi $30,401 0.77 $36,130 0.71 $2,110.66 6.8% 1.20Missouri $36,181 0.91 $45,038 0.88 $1,619.23 4.4% 0.77Montana $34,828 0.88 $41,327 0.81 $2,162.36 6.2% 1.09Nebraska $39,332 0.99 $53,780 1.05 $2,081.41 5.3% 0.93Nevada $37,670 0.95 $51,806 1.01 $2,158.04 5.8% 1.03New Hampshire $42,646 1.08 $56,586 1.11 $1,613.74 3.7% 0.65New Jersey $49,980 1.26 $64,658 1.27 $2,946.49 5.8% 1.01New Mexico $33,267 0.84 $40,312 0.79 $2,136.58 6.4% 1.13New York $46,516 1.17 $63,885 1.25 $3,275.52 6.7% 1.19North Carolina $34,879 0.88 $46,772 0.92 $2,250.70 6.4% 1.13North Dakota $40,802 1.03 $56,986 1.12 $3,921.70 9.1% 1.61Ohio $35,408 0.89 $43,918 0.86 $2,044.00 5.7% 0.99Oklahoma $35,837 0.90 $43,446 0.85 $1,882.88 5.3% 0.94Oregon $36,191 0.91 $52,115 1.02 $1,899.10 5.2% 0.92Pennsylvania $40,175 1.01 $48,958 0.96 $2,372.21 5.8% 1.03Rhode Island $41,392 1.04 $53,560 1.05 $2,440.65 5.8% 1.02South Carolina $32,505 0.82 $38,379 0.75 $1,576.96 4.9% 0.85South Dakota $38,374 0.97 $52,843 1.03 $1,597.47 4.0% 0.71Tennessee $34,277 0.86 $43,448 0.85 $1,653.78 4.7% 0.83Texas $38,609 0.97 $51,543 1.01 $1,560.15 4.1% 0.73Utah $31,584 0.80 $45,468 0.89 $1,834.79 5.6% 0.99Vermont $39,205 0.99 $45,835 0.90 $4,012.38 10.0% 1.76Virginia $44,057 1.11 $58,967 1.15 $2,045.26 4.6% 0.81Washington $42,870 1.08 $54,546 1.07 $2,388.59 5.6% 0.99West Virginia $32,080 0.81 $37,977 0.74 $2,510.31 7.8% 1.38Wisconsin $37,373 0.94 $47,289 0.93 $2,524.50 6.6% 1.16Wyoming $48,302 1.22 $70,848 1.39 $3,750.04 8.3% 1.47United States $39,635 1.00 $51,068 1.00 $2,270.14 5.7% 1.00
Table 1a: State Tax Base and Collections
State
Tax Bases Per Capita Tax Collections
SOURCES: Total Taxable Resources - 2011 Total Taxable Resources Estimates, US Treasury, Sept. 30, 2011. http://www.treasury.gov/resource-center/economic-policy/taxable-resources/Pages/Total-Taxable-Resources.aspx. Personal Income Per Capita - regional data on GDP and Personal Income for 2010 (Table SA1-3 Personal Income Summary), Bureau of Economic Analysis, downloaded May 15, 2012. http://www.bea.gov/iTable/iTable.cfm?ReqID=70&step=1&isuri=1&acrdn=4. Taxes as a Percent of Income - calculated using data Census Bureau's Survey of State Government Finances for 2010 and personal income data from the Bureau of Economic Analysis (2010).
0010
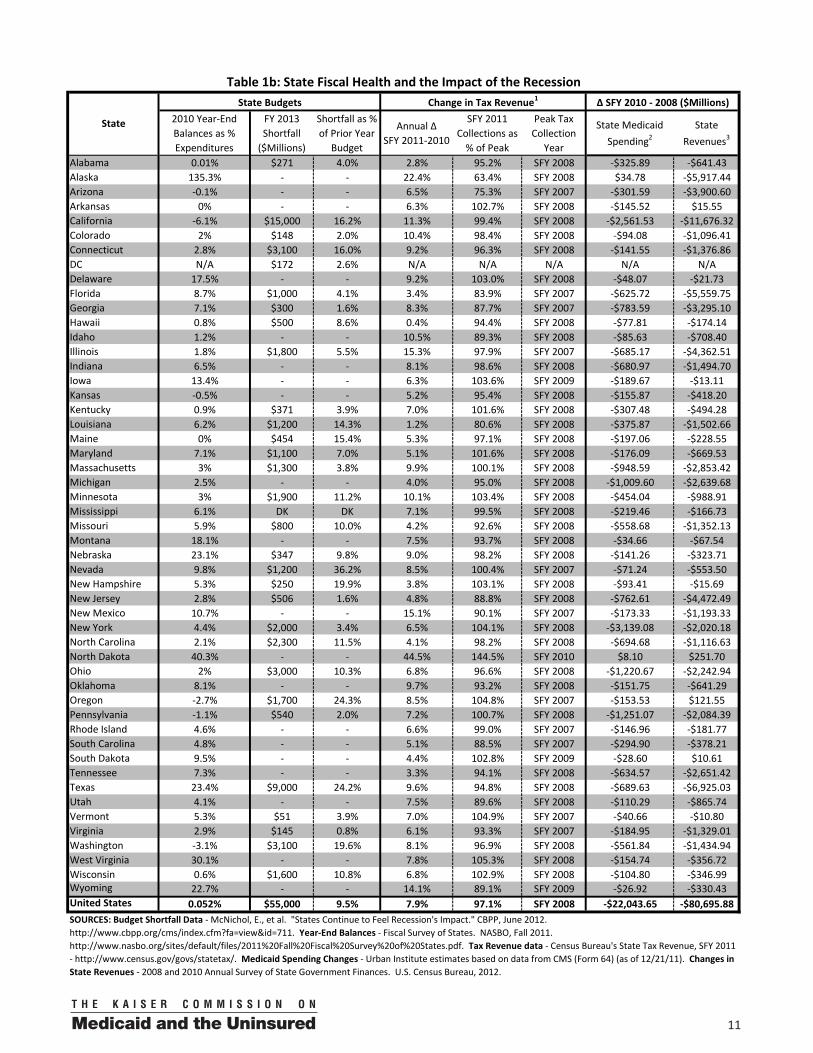
State Fiscal Health. Unlike the federal government, states are generally required to balance their budgets. However, the requirements to balance budgets differ across states, with many states requiring that budgets be balanced only at the beginning of the fiscal year. These requirements also generally apply to general funds only.21 When measuring state fiscal health, researchers examine state total year-end balances. Total year-end balances take into account both ending balances and states’ budget stabilization funds (i.e. rainy day funds).22 Looking at SFY 2010, six states (California, Washington, Oregon, Pennsylvania, Kansas, and Arizona) reported negative year-end balances. At the same time, year-end balances ranged from breaking even in Maine and Arkansas to surpluses of over 40 percent of expenditures in North Dakota and Alaska. (Table 1b)
The Impact of the Recession on State Revenues. The Great Recession, which technically lasted from December 2007 to June 2009, was the worst economic downturn the country has experienced since the Great Depression of the 1930s. As they continue to recover, states have faced collective shortfalls of more than $540 billion since the start of the recession through SFY 2012, with an additional $55 billion estimated for SFY 2013.23 In Texas, Oregon, and Nevada the estimated budget shortfall for SFY 2013 represented at least 20 percent of the total budget, 36.2 percent in Nevada. The recession caused the largest collapse in state tax revenues on record. Despite recent growth in quarterly tax collections, at the end of SFY 2011, 33 states still reported tax revenues below peak; 11 states (Alaska, Arizona, Louisiana, Florida, Georgia, South Carolina, New Jersey, Wyoming, Idaho, and Utah) reported collections at least 10 percent below peak. (Table 1b)
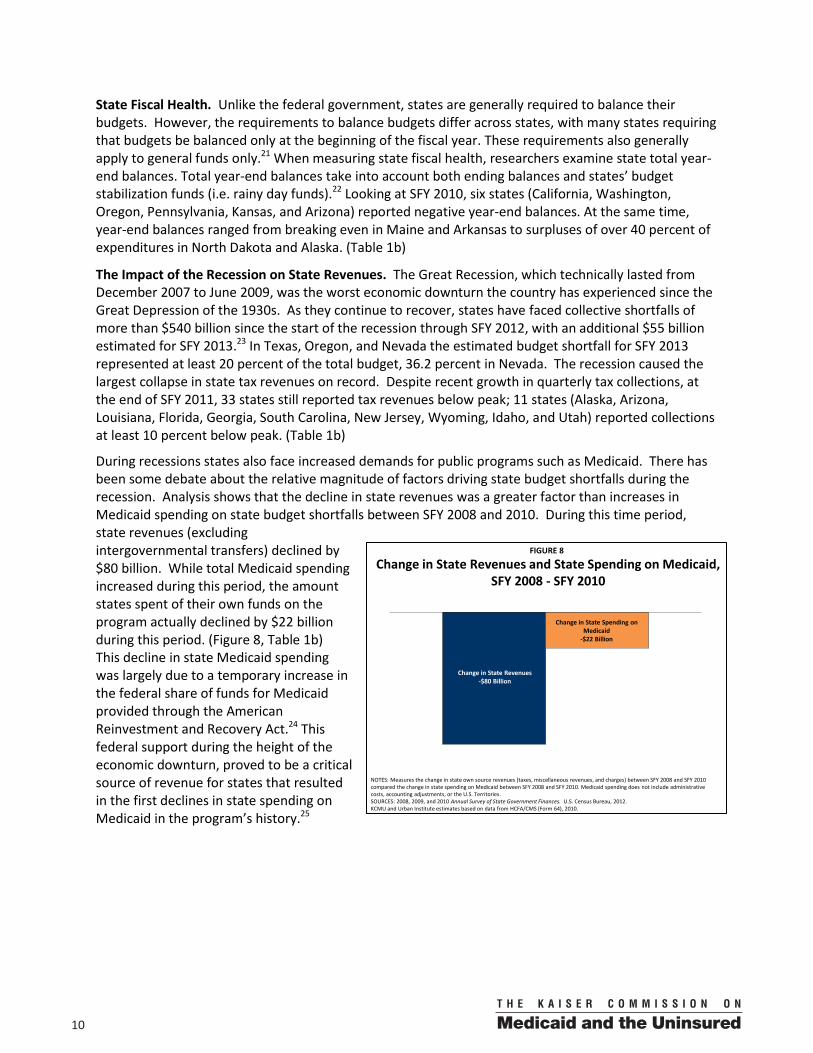
During recessions states also face increased demands for public programs such as Medicaid. There has been some debate about the relative magnitude of factors driving state budget shortfalls during the recession. Analysis shows that the decline in state revenues was a greater factor than increases in Medicaid spending on state budget shortfalls between SFY 2008 and 2010. During this time period, state revenues (excluding intergovernmental transfers) declined by $80 billion. While total Medicaid spending increased during this period, the amount states spent of their own funds on the program actually declined by $22 billion during this period. (Figure 8, Table 1b) This decline in state Medicaid spending was largely due to a temporary increase in the federal share of funds for Medicaid provided through the American Reinvestment and Recovery Act.24 This federal support during the height of the economic downturn, proved to be a critical source of revenue for states that resulted in the first declines in state spending on Medicaid in the program’s history.25
FIGURE 8
Change in State Revenues and State Spending on Medicaid, SFY 2008 - SFY 2010
NOTES: Measures the change in state own source revenues (taxes, miscellaneous revenues, and charges) between SFY 2008 and SFY 2010 compared the change in state spending on Medicaid between SFY 2008 and SFY 2010. Medicaid spending does not include administrative costs, accounting adjustments, or the U.S. Territories. SOURCES: 2008, 2009, and 2010 Annual Survey of State Government Finances. U.S. Census Bureau, 2012.KCMU and Urban Institute estimates based on data from HCFA/CMS (Form 64), 2010.
-$442.6 B
Change in State Revenues-$80 Billion
Change in State Spending on Medicaid
-$22 Billion
00 11
2010 Year-End Balances as % Expenditures
FY 2013 Shortfall
($Millions)
Shortfall as % of Prior Year
Budget
Annual Δ SFY 2011-2010
SFY 2011 Collections as
% of Peak
Peak Tax Collection
Year
State Medicaid Spending2
State Revenues3
Alabama 0.01% $271 4.0% 2.8% 95.2% SFY 2008 -$325.89 -$641.43Alaska 135.3% - - 22.4% 63.4% SFY 2008 $34.78 -$5,917.44Arizona -0.1% - - 6.5% 75.3% SFY 2007 -$301.59 -$3,900.60Arkansas 0% - - 6.3% 102.7% SFY 2008 -$145.52 $15.55California -6.1% $15,000 16.2% 11.3% 99.4% SFY 2008 -$2,561.53 -$11,676.32Colorado 2% $148 2.0% 10.4% 98.4% SFY 2008 -$94.08 -$1,096.41Connecticut 2.8% $3,100 16.0% 9.2% 96.3% SFY 2008 -$141.55 -$1,376.86DC N/A $172 2.6% N/A N/A N/A N/A N/ADelaware 17.5% - - 9.2% 103.0% SFY 2008 -$48.07 -$21.73Florida 8.7% $1,000 4.1% 3.4% 83.9% SFY 2007 -$625.72 -$5,559.75Georgia 7.1% $300 1.6% 8.3% 87.7% SFY 2007 -$783.59 -$3,295.10Hawaii 0.8% $500 8.6% 0.4% 94.4% SFY 2008 -$77.81 -$174.14Idaho 1.2% - - 10.5% 89.3% SFY 2008 -$85.63 -$708.40Illinois 1.8% $1,800 5.5% 15.3% 97.9% SFY 2007 -$685.17 -$4,362.51Indiana 6.5% - - 8.1% 98.6% SFY 2008 -$680.97 -$1,494.70Iowa 13.4% - - 6.3% 103.6% SFY 2009 -$189.67 -$13.11Kansas -0.5% - - 5.2% 95.4% SFY 2008 -$155.87 -$418.20Kentucky 0.9% $371 3.9% 7.0% 101.6% SFY 2008 -$307.48 -$494.28Louisiana 6.2% $1,200 14.3% 1.2% 80.6% SFY 2008 -$375.87 -$1,502.66Maine 0% $454 15.4% 5.3% 97.1% SFY 2008 -$197.06 -$228.55Maryland 7.1% $1,100 7.0% 5.1% 101.6% SFY 2008 -$176.09 -$669.53Massachusetts 3% $1,300 3.8% 9.9% 100.1% SFY 2008 -$948.59 -$2,853.42Michigan 2.5% - - 4.0% 95.0% SFY 2008 -$1,009.60 -$2,639.68Minnesota 3% $1,900 11.2% 10.1% 103.4% SFY 2008 -$454.04 -$988.91Mississippi 6.1% DK DK 7.1% 99.5% SFY 2008 -$219.46 -$166.73Missouri 5.9% $800 10.0% 4.2% 92.6% SFY 2008 -$558.68 -$1,352.13Montana 18.1% - - 7.5% 93.7% SFY 2008 -$34.66 -$67.54Nebraska 23.1% $347 9.8% 9.0% 98.2% SFY 2008 -$141.26 -$323.71Nevada 9.8% $1,200 36.2% 8.5% 100.4% SFY 2007 -$71.24 -$553.50New Hampshire 5.3% $250 19.9% 3.8% 103.1% SFY 2008 -$93.41 -$15.69New Jersey 2.8% $506 1.6% 4.8% 88.8% SFY 2008 -$762.61 -$4,472.49New Mexico 10.7% - - 15.1% 90.1% SFY 2007 -$173.33 -$1,193.33New York 4.4% $2,000 3.4% 6.5% 104.1% SFY 2008 -$3,139.08 -$2,020.18North Carolina 2.1% $2,300 11.5% 4.1% 98.2% SFY 2008 -$694.68 -$1,116.63North Dakota 40.3% - - 44.5% 144.5% SFY 2010 $8.10 $251.70Ohio 2% $3,000 10.3% 6.8% 96.6% SFY 2008 -$1,220.67 -$2,242.94Oklahoma 8.1% - - 9.7% 93.2% SFY 2008 -$151.75 -$641.29Oregon -2.7% $1,700 24.3% 8.5% 104.8% SFY 2007 -$153.53 $121.55Pennsylvania -1.1% $540 2.0% 7.2% 100.7% SFY 2008 -$1,251.07 -$2,084.39Rhode Island 4.6% - - 6.6% 99.0% SFY 2007 -$146.96 -$181.77South Carolina 4.8% - - 5.1% 88.5% SFY 2007 -$294.90 -$378.21South Dakota 9.5% - - 4.4% 102.8% SFY 2009 -$28.60 $10.61Tennessee 7.3% - - 3.3% 94.1% SFY 2008 -$634.57 -$2,651.42Texas 23.4% $9,000 24.2% 9.6% 94.8% SFY 2008 -$689.63 -$6,925.03Utah 4.1% - - 7.5% 89.6% SFY 2008 -$110.29 -$865.74Vermont 5.3% $51 3.9% 7.0% 104.9% SFY 2007 -$40.66 -$10.80Virginia 2.9% $145 0.8% 6.1% 93.3% SFY 2007 -$184.95 -$1,329.01Washington -3.1% $3,100 19.6% 8.1% 96.9% SFY 2008 -$561.84 -$1,434.94West Virginia 30.1% - - 7.8% 105.3% SFY 2008 -$154.74 -$356.72Wisconsin 0.6% $1,600 10.8% 6.8% 102.9% SFY 2008 -$104.80 -$346.99Wyoming 22.7% - - 14.1% 89.1% SFY 2009 -$26.92 -$330.43United States 0.052% $55,000 9.5% 7.9% 97.1% SFY 2008 -$22,043.65 -$80,695.88SOURCES: Budget Shortfall Data - McNichol, E., et al. "States Continue to Feel Recession's Impact." CBPP, June 2012. http://www.cbpp.org/cms/index.cfm?fa=view&id=711. Year-End Balances - Fiscal Survey of States. NASBO, Fall 2011. http://www.nasbo.org/sites/default/files/2011%20Fall%20Fiscal%20Survey%20of%20States.pdf. Tax Revenue data - Census Bureau's State Tax Revenue, SFY 2011 - http://www.census.gov/govs/statetax/. Medicaid Spending Changes - Urban Institute estimates based on data from CMS (Form 64) (as of 12/21/11). Changes in State Revenues - 2008 and 2010 Annual Survey of State Government Finances. U.S. Census Bureau, 2012.
Table 1b: State Fiscal Health and the Impact of the Recession
State
State Budgets Change in Tax Revenue1 Δ SFY 2010 - 2008 ($Millions)
0012
2. How Does the Demand for Public Services Differ Across States?
Several different factors go into determining the need for public services, such as poverty rates and unemployment. While these factors affect the demand for public services more broadly, the demand for Medicaid services is also affected by the number of uninsured as well as the demand for health services and long term services in a state. In addition to examining these broader determinants of the need for public services (poverty and unemployment), this section also examines indicators more specific to the demand for Medicaid, such as insurance coverage and indicators of the need for health and long-term care services such as the rate of disability, infant mortality, obesity rates, and the prevalence of select chronic conditions.
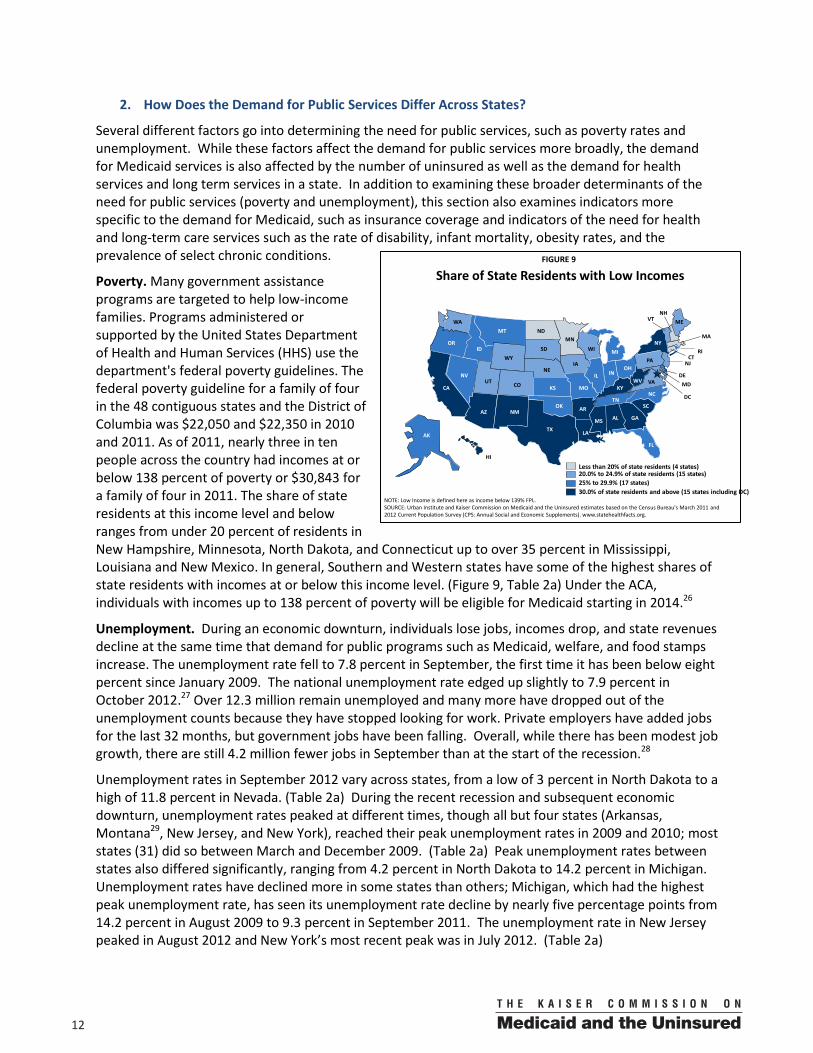
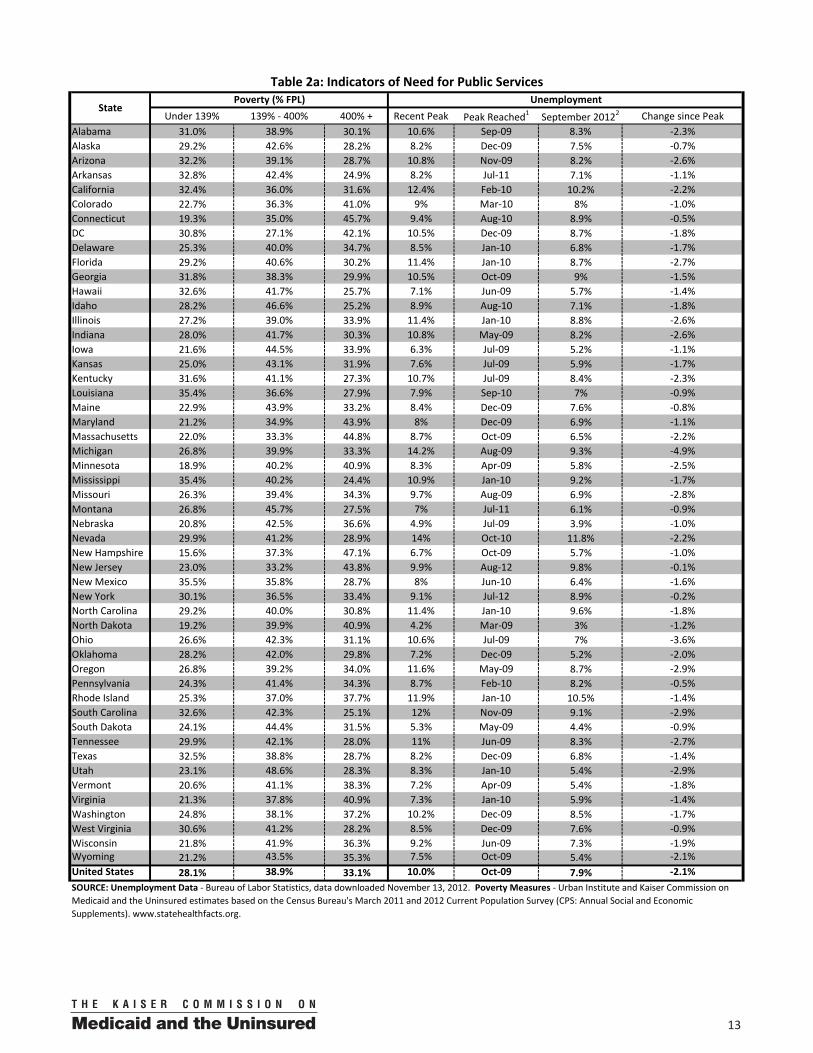
Poverty. Many government assistance programs are targeted to help low-income families. Programs administered or supported by the United States Department of Health and Human Services (HHS) use the department's federal poverty guidelines. The federal poverty guideline for a family of four in the 48 contiguous states and the District of Columbia was $22,050 and $22,350 in 2010 and 2011. As of 2011, nearly three in ten people across the country had incomes at or below 138 percent of poverty or $30,843 for a family of four in 2011. The share of state residents at this income level and below ranges from under 20 percent of residents in New Hampshire, Minnesota, North Dakota, and Connecticut up to over 35 percent in Mississippi, Louisiana and New Mexico. In general, Southern and Western states have some of the highest shares of state residents with incomes at or below this income level. (Figure 9, Table 2a) Under the ACA, individuals with incomes up to 138 percent of poverty will be eligible for Medicaid starting in 2014.26
Unemployment. During an economic downturn, individuals lose jobs, incomes drop, and state revenues decline at the same time that demand for public programs such as Medicaid, welfare, and food stamps increase. The unemployment rate fell to 7.8 percent in September, the first time it has been below eight percent since January 2009. The national unemployment rate edged up slightly to 7.9 percent in October 2012.27 Over 12.3 million remain unemployed and many more have dropped out of the unemployment counts because they have stopped looking for work. Private employers have added jobs for the last 32 months, but government jobs have been falling. Overall, while there has been modest job growth, there are still 4.2 million fewer jobs in September than at the start of the recession.28
Unemployment rates in September 2012 vary across states, from a low of 3 percent in North Dakota to a high of 11.8 percent in Nevada. (Table 2a) During the recent recession and subsequent economic downturn, unemployment rates peaked at different times, though all but four states (Arkansas, Montana29, New Jersey, and New York), reached their peak unemployment rates in 2009 and 2010; most states (31) did so between March and December 2009. (Table 2a) Peak unemployment rates between states also differed significantly, ranging from 4.2 percent in North Dakota to 14.2 percent in Michigan. Unemployment rates have declined more in some states than others; Michigan, which had the highest peak unemployment rate, has seen its unemployment rate decline by nearly five percentage points from 14.2 percent in August 2009 to 9.3 percent in September 2011. The unemployment rate in New Jersey peaked in August 2012 and New York’s most recent peak was in July 2012. (Table 2a)
FIGURE 9
Share of State Residents with Low Incomes
AZ AR
MS
LA
WA
MNND
WYID
UT CO
OR
NV
CA
MT
IA
WI MI
NE
SD
ME
MOKS
OHIN
NY
IL
KY
TNNC
NH
MA
VT
PA
VAWV
CTNJ
DEMD
RI
HI
DC
AK
SCNM
OK
GA
TX
IL
FL
AL
NOTE: Low Income is defined here as income below 139% FPL.SOURCE: Urban Institute and Kaiser Commission on Medicaid and the Uninsured estimates based on the Census Bureau's March 2011 and 2012 Current Population Survey (CPS: Annual Social and Economic Supplements). www.statehealthfacts.org.
20.0% to 24.9% of state residents (15 states)Less than 20% of state residents (4 states)
30.0% of state residents and above (15 states including DC)25% to 29.9% (17 states)
00 13
Under 139% 139% - 400% 400% + Recent Peak Peak Reached1 September 20122 Change since PeakAlabama 31.0% 38.9% 30.1% 10.6% Sep-09 8.3% -2.3%Alaska 29.2% 42.6% 28.2% 8.2% Dec-09 7.5% -0.7%Arizona 32.2% 39.1% 28.7% 10.8% Nov-09 8.2% -2.6%Arkansas 32.8% 42.4% 24.9% 8.2% Jul-11 7.1% -1.1%California 32.4% 36.0% 31.6% 12.4% Feb-10 10.2% -2.2%Colorado 22.7% 36.3% 41.0% 9% Mar-10 8% -1.0%Connecticut 19.3% 35.0% 45.7% 9.4% Aug-10 8.9% -0.5%DC 30.8% 27.1% 42.1% 10.5% Dec-09 8.7% -1.8%Delaware 25.3% 40.0% 34.7% 8.5% Jan-10 6.8% -1.7%Florida 29.2% 40.6% 30.2% 11.4% Jan-10 8.7% -2.7%Georgia 31.8% 38.3% 29.9% 10.5% Oct-09 9% -1.5%Hawaii 32.6% 41.7% 25.7% 7.1% Jun-09 5.7% -1.4%Idaho 28.2% 46.6% 25.2% 8.9% Aug-10 7.1% -1.8%Illinois 27.2% 39.0% 33.9% 11.4% Jan-10 8.8% -2.6%Indiana 28.0% 41.7% 30.3% 10.8% May-09 8.2% -2.6%Iowa 21.6% 44.5% 33.9% 6.3% Jul-09 5.2% -1.1%Kansas 25.0% 43.1% 31.9% 7.6% Jul-09 5.9% -1.7%Kentucky 31.6% 41.1% 27.3% 10.7% Jul-09 8.4% -2.3%Louisiana 35.4% 36.6% 27.9% 7.9% Sep-10 7% -0.9%Maine 22.9% 43.9% 33.2% 8.4% Dec-09 7.6% -0.8%Maryland 21.2% 34.9% 43.9% 8% Dec-09 6.9% -1.1%Massachusetts 22.0% 33.3% 44.8% 8.7% Oct-09 6.5% -2.2%Michigan 26.8% 39.9% 33.3% 14.2% Aug-09 9.3% -4.9%Minnesota 18.9% 40.2% 40.9% 8.3% Apr-09 5.8% -2.5%Mississippi 35.4% 40.2% 24.4% 10.9% Jan-10 9.2% -1.7%Missouri 26.3% 39.4% 34.3% 9.7% Aug-09 6.9% -2.8%Montana 26.8% 45.7% 27.5% 7% Jul-11 6.1% -0.9%Nebraska 20.8% 42.5% 36.6% 4.9% Jul-09 3.9% -1.0%Nevada 29.9% 41.2% 28.9% 14% Oct-10 11.8% -2.2%New Hampshire 15.6% 37.3% 47.1% 6.7% Oct-09 5.7% -1.0%New Jersey 23.0% 33.2% 43.8% 9.9% Aug-12 9.8% -0.1%New Mexico 35.5% 35.8% 28.7% 8% Jun-10 6.4% -1.6%New York 30.1% 36.5% 33.4% 9.1% Jul-12 8.9% -0.2%North Carolina 29.2% 40.0% 30.8% 11.4% Jan-10 9.6% -1.8%North Dakota 19.2% 39.9% 40.9% 4.2% Mar-09 3% -1.2%Ohio 26.6% 42.3% 31.1% 10.6% Jul-09 7% -3.6%Oklahoma 28.2% 42.0% 29.8% 7.2% Dec-09 5.2% -2.0%Oregon 26.8% 39.2% 34.0% 11.6% May-09 8.7% -2.9%Pennsylvania 24.3% 41.4% 34.3% 8.7% Feb-10 8.2% -0.5%Rhode Island 25.3% 37.0% 37.7% 11.9% Jan-10 10.5% -1.4%South Carolina 32.6% 42.3% 25.1% 12% Nov-09 9.1% -2.9%South Dakota 24.1% 44.4% 31.5% 5.3% May-09 4.4% -0.9%Tennessee 29.9% 42.1% 28.0% 11% Jun-09 8.3% -2.7%Texas 32.5% 38.8% 28.7% 8.2% Dec-09 6.8% -1.4%Utah 23.1% 48.6% 28.3% 8.3% Jan-10 5.4% -2.9%Vermont 20.6% 41.1% 38.3% 7.2% Apr-09 5.4% -1.8%Virginia 21.3% 37.8% 40.9% 7.3% Jan-10 5.9% -1.4%Washington 24.8% 38.1% 37.2% 10.2% Dec-09 8.5% -1.7%West Virginia 30.6% 41.2% 28.2% 8.5% Dec-09 7.6% -0.9%Wisconsin 21.8% 41.9% 36.3% 9.2% Jun-09 7.3% -1.9%Wyoming 21.2% 43.5% 35.3% 7.5% Oct-09 5.4% -2.1%United States 28.1% 38.9% 33.1% 10.0% Oct-09 7.9% -2.1%
Table 2a: Indicators of Need for Public Services
StatePoverty (% FPL) Unemployment
SOURCE: Unemployment Data - Bureau of Labor Statistics, data downloaded November 13, 2012. Poverty Measures - Urban Institute and Kaiser Commission on Medicaid and the Uninsured estimates based on the Census Bureau's March 2011 and 2012 Current Population Survey (CPS: Annual Social and Economic Supplements). www.statehealthfacts.org.
0014
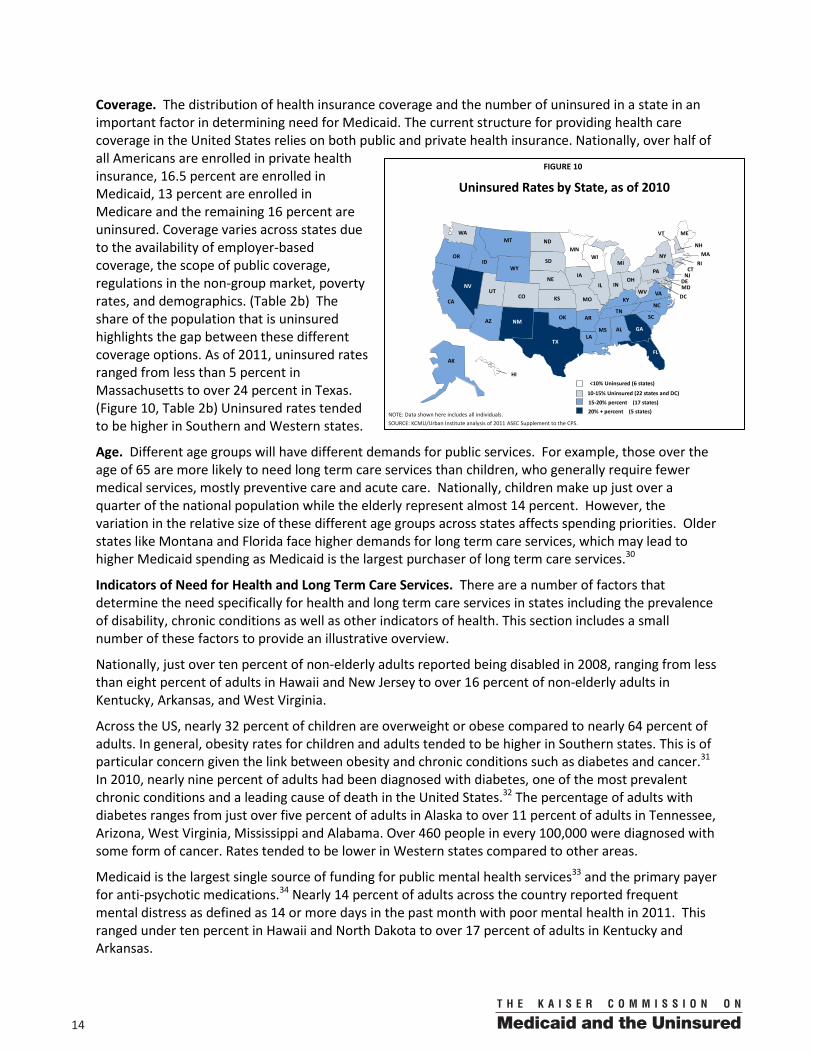
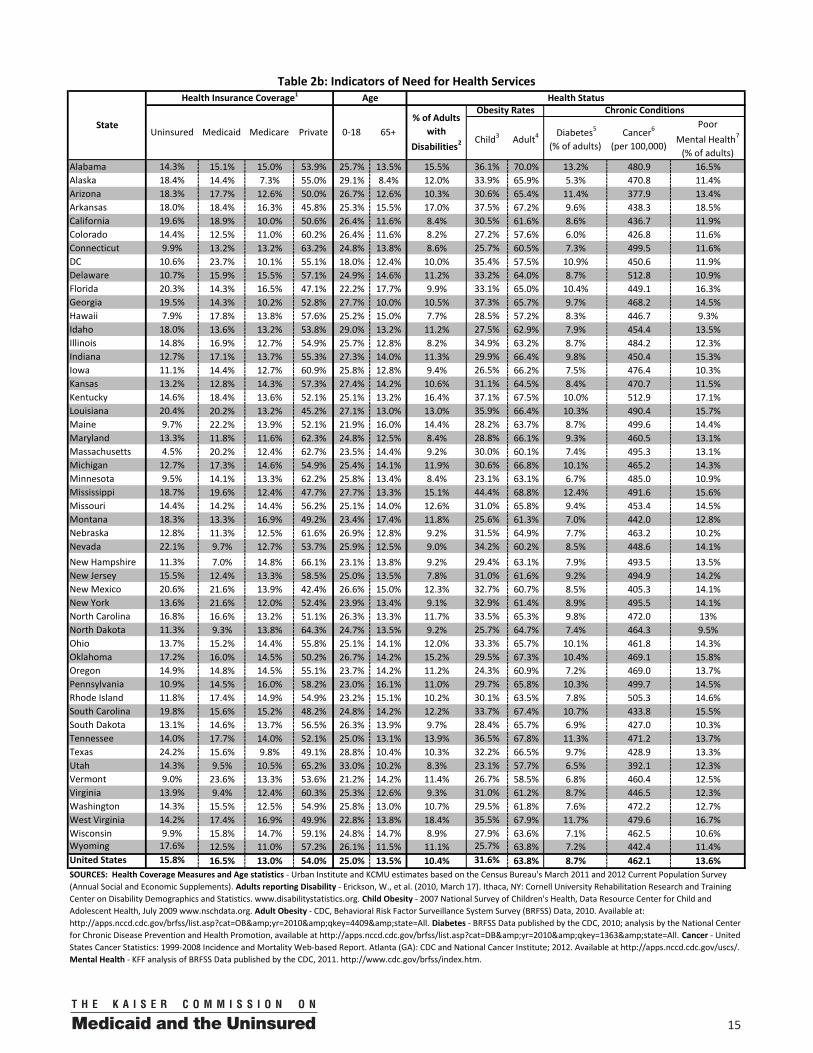
Coverage. The distribution of health insurance coverage and the number of uninsured in a state in an important factor in determining need for Medicaid. The current structure for providing health care coverage in the United States relies on both public and private health insurance. Nationally, over half of all Americans are enrolled in private health insurance, 16.5 percent are enrolled in Medicaid, 13 percent are enrolled in Medicare and the remaining 16 percent are uninsured. Coverage varies across states due to the availability of employer-based coverage, the scope of public coverage, regulations in the non-group market, poverty rates, and demographics. (Table 2b) The share of the population that is uninsured highlights the gap between these different coverage options. As of 2011, uninsured rates ranged from less than 5 percent in Massachusetts to over 24 percent in Texas. (Figure 10, Table 2b) Uninsured rates tended to be higher in Southern and Western states.
Age. Different age groups will have different demands for public services. For example, those over the age of 65 are more likely to need long term care services than children, who generally require fewer medical services, mostly preventive care and acute care. Nationally, children make up just over a quarter of the national population while the elderly represent almost 14 percent. However, the variation in the relative size of these different age groups across states affects spending priorities. Older states like Montana and Florida face higher demands for long term care services, which may lead to higher Medicaid spending as Medicaid is the largest purchaser of long term care services.30
Indicators of Need for Health and Long Term Care Services. There are a number of factors that determine the need specifically for health and long term care services in states including the prevalence of disability, chronic conditions as well as other indicators of health. This section includes a small number of these factors to provide an illustrative overview.
Nationally, just over ten percent of non-elderly adults reported being disabled in 2008, ranging from less than eight percent of adults in Hawaii and New Jersey to over 16 percent of non-elderly adults in Kentucky, Arkansas, and West Virginia.
Across the US, nearly 32 percent of children are overweight or obese compared to nearly 64 percent of adults. In general, obesity rates for children and adults tended to be higher in Southern states. This is of particular concern given the link between obesity and chronic conditions such as diabetes and cancer.31 In 2010, nearly nine percent of adults had been diagnosed with diabetes, one of the most prevalent chronic conditions and a leading cause of death in the United States.32 The percentage of adults with diabetes ranges from just over five percent of adults in Alaska to over 11 percent of adults in Tennessee, Arizona, West Virginia, Mississippi and Alabama. Over 460 people in every 100,000 were diagnosed with some form of cancer. Rates tended to be lower in Western states compared to other areas.
Medicaid is the largest single source of funding for public mental health services33 and the primary payer for anti-psychotic medications.34 Nearly 14 percent of adults across the country reported frequent mental distress as defined as 14 or more days in the past month with poor mental health in 2011. This ranged under ten percent in Hawaii and North Dakota to over 17 percent of adults in Kentucky and Arkansas.
FIGURE 10
WY
WI
WV
WA
VA
VT
UT
TX
TN
SD
SC
RIPA
OR
OK
OH
ND
NC
NY
NM
NJ
NH
NVNE
MT
MO
MS
MN
MIMA
MD
ME
LA
KYKS
IAINIL
ID
HI
GA
FL
DC
DE
CT
COCA
ARAZ
AK
AL
15-20% percent (17 states)10-15% Uninsured (22 states and DC)
<10% Uninsured (6 states)
Uninsured Rates by State, as of 2010
NOTE: Data shown here includes all individuals.SOURCE: KCMU/Urban Institute analysis of 2011 ASEC Supplement to the CPS.
20% + percent (5 states)
00 15
Child3 Adult4 Diabetes5
(% of adults) Cancer6
(per 100,000)
Poor Mental Health7
(% of adults)Alabama 14.3% 15.1% 15.0% 53.9% 25.7% 13.5% 15.5% 36.1% 70.0% 13.2% 480.9 16.5%Alaska 18.4% 14.4% 7.3% 55.0% 29.1% 8.4% 12.0% 33.9% 65.9% 5.3% 470.8 11.4%Arizona 18.3% 17.7% 12.6% 50.0% 26.7% 12.6% 10.3% 30.6% 65.4% 11.4% 377.9 13.4%Arkansas 18.0% 18.4% 16.3% 45.8% 25.3% 15.5% 17.0% 37.5% 67.2% 9.6% 438.3 18.5%California 19.6% 18.9% 10.0% 50.6% 26.4% 11.6% 8.4% 30.5% 61.6% 8.6% 436.7 11.9%Colorado 14.4% 12.5% 11.0% 60.2% 26.4% 11.6% 8.2% 27.2% 57.6% 6.0% 426.8 11.6%Connecticut 9.9% 13.2% 13.2% 63.2% 24.8% 13.8% 8.6% 25.7% 60.5% 7.3% 499.5 11.6%DC 10.6% 23.7% 10.1% 55.1% 18.0% 12.4% 10.0% 35.4% 57.5% 10.9% 450.6 11.9%Delaware 10.7% 15.9% 15.5% 57.1% 24.9% 14.6% 11.2% 33.2% 64.0% 8.7% 512.8 10.9%Florida 20.3% 14.3% 16.5% 47.1% 22.2% 17.7% 9.9% 33.1% 65.0% 10.4% 449.1 16.3%Georgia 19.5% 14.3% 10.2% 52.8% 27.7% 10.0% 10.5% 37.3% 65.7% 9.7% 468.2 14.5%Hawaii 7.9% 17.8% 13.8% 57.6% 25.2% 15.0% 7.7% 28.5% 57.2% 8.3% 446.7 9.3%Idaho 18.0% 13.6% 13.2% 53.8% 29.0% 13.2% 11.2% 27.5% 62.9% 7.9% 454.4 13.5%Illinois 14.8% 16.9% 12.7% 54.9% 25.7% 12.8% 8.2% 34.9% 63.2% 8.7% 484.2 12.3%Indiana 12.7% 17.1% 13.7% 55.3% 27.3% 14.0% 11.3% 29.9% 66.4% 9.8% 450.4 15.3%Iowa 11.1% 14.4% 12.7% 60.9% 25.8% 12.8% 9.4% 26.5% 66.2% 7.5% 476.4 10.3%Kansas 13.2% 12.8% 14.3% 57.3% 27.4% 14.2% 10.6% 31.1% 64.5% 8.4% 470.7 11.5%Kentucky 14.6% 18.4% 13.6% 52.1% 25.1% 13.2% 16.4% 37.1% 67.5% 10.0% 512.9 17.1%Louisiana 20.4% 20.2% 13.2% 45.2% 27.1% 13.0% 13.0% 35.9% 66.4% 10.3% 490.4 15.7%Maine 9.7% 22.2% 13.9% 52.1% 21.9% 16.0% 14.4% 28.2% 63.7% 8.7% 499.6 14.4%Maryland 13.3% 11.8% 11.6% 62.3% 24.8% 12.5% 8.4% 28.8% 66.1% 9.3% 460.5 13.1%Massachusetts 4.5% 20.2% 12.4% 62.7% 23.5% 14.4% 9.2% 30.0% 60.1% 7.4% 495.3 13.1%Michigan 12.7% 17.3% 14.6% 54.9% 25.4% 14.1% 11.9% 30.6% 66.8% 10.1% 465.2 14.3%Minnesota 9.5% 14.1% 13.3% 62.2% 25.8% 13.4% 8.4% 23.1% 63.1% 6.7% 485.0 10.9%Mississippi 18.7% 19.6% 12.4% 47.7% 27.7% 13.3% 15.1% 44.4% 68.8% 12.4% 491.6 15.6%Missouri 14.4% 14.2% 14.4% 56.2% 25.1% 14.0% 12.6% 31.0% 65.8% 9.4% 453.4 14.5%Montana 18.3% 13.3% 16.9% 49.2% 23.4% 17.4% 11.8% 25.6% 61.3% 7.0% 442.0 12.8%Nebraska 12.8% 11.3% 12.5% 61.6% 26.9% 12.8% 9.2% 31.5% 64.9% 7.7% 463.2 10.2%Nevada 22.1% 9.7% 12.7% 53.7% 25.9% 12.5% 9.0% 34.2% 60.2% 8.5% 448.6 14.1%New Hampshire 11.3% 7.0% 14.8% 66.1% 23.1% 13.8% 9.2% 29.4% 63.1% 7.9% 493.5 13.5%New Jersey 15.5% 12.4% 13.3% 58.5% 25.0% 13.5% 7.8% 31.0% 61.6% 9.2% 494.9 14.2%New Mexico 20.6% 21.6% 13.9% 42.4% 26.6% 15.0% 12.3% 32.7% 60.7% 8.5% 405.3 14.1%New York 13.6% 21.6% 12.0% 52.4% 23.9% 13.4% 9.1% 32.9% 61.4% 8.9% 495.5 14.1%North Carolina 16.8% 16.6% 13.2% 51.1% 26.3% 13.3% 11.7% 33.5% 65.3% 9.8% 472.0 13%North Dakota 11.3% 9.3% 13.8% 64.3% 24.7% 13.5% 9.2% 25.7% 64.7% 7.4% 464.3 9.5%Ohio 13.7% 15.2% 14.4% 55.8% 25.1% 14.1% 12.0% 33.3% 65.7% 10.1% 461.8 14.3%Oklahoma 17.2% 16.0% 14.5% 50.2% 26.7% 14.2% 15.2% 29.5% 67.3% 10.4% 469.1 15.8%Oregon 14.9% 14.8% 14.5% 55.1% 23.7% 14.2% 11.2% 24.3% 60.9% 7.2% 469.0 13.7%Pennsylvania 10.9% 14.5% 16.0% 58.2% 23.0% 16.1% 11.0% 29.7% 65.8% 10.3% 499.7 14.5%Rhode Island 11.8% 17.4% 14.9% 54.9% 23.2% 15.1% 10.2% 30.1% 63.5% 7.8% 505.3 14.6%South Carolina 19.8% 15.6% 15.2% 48.2% 24.8% 14.2% 12.2% 33.7% 67.4% 10.7% 433.8 15.5%South Dakota 13.1% 14.6% 13.7% 56.5% 26.3% 13.9% 9.7% 28.4% 65.7% 6.9% 427.0 10.3%Tennessee 14.0% 17.7% 14.0% 52.1% 25.0% 13.1% 13.9% 36.5% 67.8% 11.3% 471.2 13.7%Texas 24.2% 15.6% 9.8% 49.1% 28.8% 10.4% 10.3% 32.2% 66.5% 9.7% 428.9 13.3%Utah 14.3% 9.5% 10.5% 65.2% 33.0% 10.2% 8.3% 23.1% 57.7% 6.5% 392.1 12.3%Vermont 9.0% 23.6% 13.3% 53.6% 21.2% 14.2% 11.4% 26.7% 58.5% 6.8% 460.4 12.5%Virginia 13.9% 9.4% 12.4% 60.3% 25.3% 12.6% 9.3% 31.0% 61.2% 8.7% 446.5 12.3%Washington 14.3% 15.5% 12.5% 54.9% 25.8% 13.0% 10.7% 29.5% 61.8% 7.6% 472.2 12.7%West Virginia 14.2% 17.4% 16.9% 49.9% 22.8% 13.8% 18.4% 35.5% 67.9% 11.7% 479.6 16.7%Wisconsin 9.9% 15.8% 14.7% 59.1% 24.8% 14.7% 8.9% 27.9% 63.6% 7.1% 462.5 10.6%Wyoming 17.6% 12.5% 11.0% 57.2% 26.1% 11.5% 11.1% 25.7% 63.8% 7.2% 442.4 11.4%United States 15.8% 16.5% 13.0% 54.0% 25.0% 13.5% 10.4% 31.6% 63.8% 8.7% 462.1 13.6%SOURCES: Health Coverage Measures and Age statistics - Urban Institute and KCMU estimates based on the Census Bureau's March 2011 and 2012 Current Population Survey (Annual Social and Economic Supplements). Adults reporting Disability - Erickson, W., et al. (2010, March 17). Ithaca, NY: Cornell University Rehabilitation Research and Training Center on Disability Demographics and Statistics. www.disabilitystatistics.org. Child Obesity - 2007 National Survey of Children's Health, Data Resource Center for Child and Adolescent Health, July 2009 www.nschdata.org. Adult Obesity - CDC, Behavioral Risk Factor Surveillance System Survey (BRFSS) Data, 2010. Available at: http://apps.nccd.cdc.gov/brfss/list.asp?cat=OB&yr=2010&qkey=4409&state=All. Diabetes - BRFSS Data published by the CDC, 2010; analysis by the National Center for Chronic Disease Prevention and Health Promotion, available at http://apps.nccd.cdc.gov/brfss/list.asp?cat=DB&yr=2010&qkey=1363&state=All. Cancer - United States Cancer Statistics: 1999-2008 Incidence and Mortality Web-based Report. Atlanta (GA): CDC and National Cancer Institute; 2012. Available at http://apps.nccd.cdc.gov/uscs/. Mental Health - KFF analysis of BRFSS Data published by the CDC, 2011. http://www.cdc.gov/brfss/index.htm.
Table 2b: Indicators of Need for Health Services
State
Health Insurance Coverage1 Age Health Status
Uninsured Medicaid Medicare Private 0-18 65+% of Adults
with Disabilities2
Obesity Rates Chronic Conditions
0016
3. What is the Variation in Health Care Markets Across States?
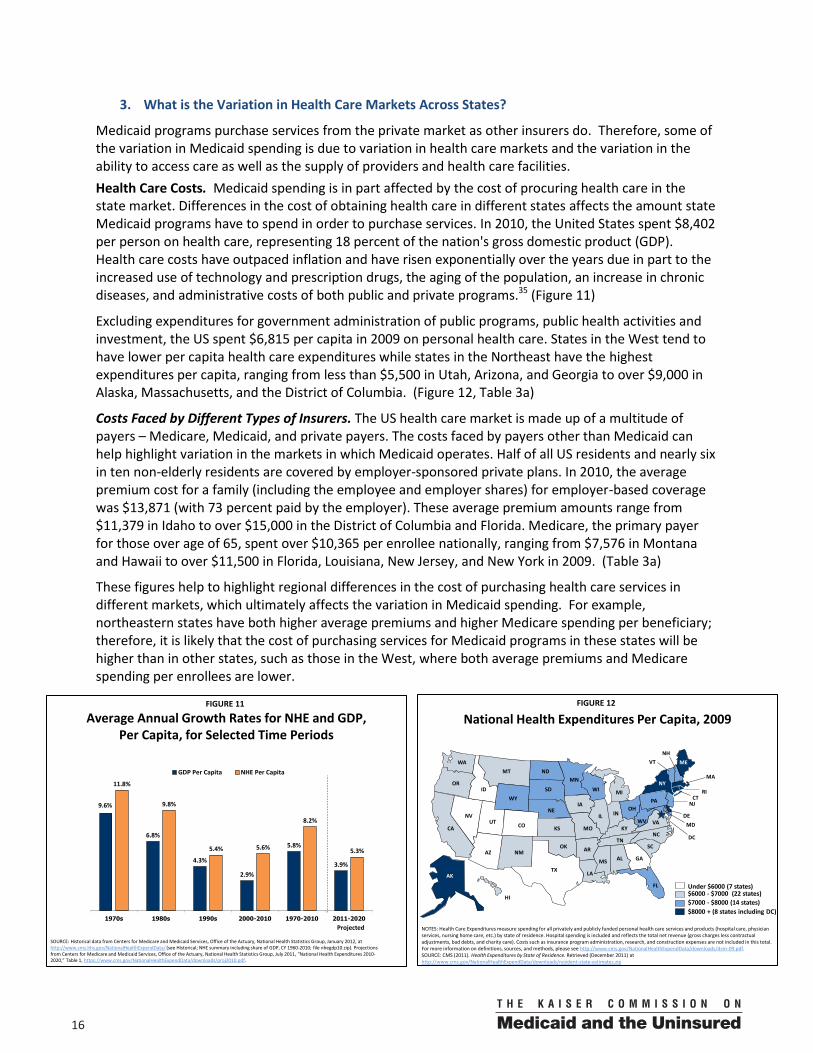
Medicaid programs purchase services from the private market as other insurers do. Therefore, some of the variation in Medicaid spending is due to variation in health care markets and the variation in the ability to access care as well as the supply of providers and health care facilities. Health Care Costs. Medicaid spending is in part affected by the cost of procuring health care in the state market. Differences in the cost of obtaining health care in different states affects the amount state Medicaid programs have to spend in order to purchase services. In 2010, the United States spent $8,402 per person on health care, representing 18 percent of the nation's gross domestic product (GDP). Health care costs have outpaced inflation and have risen exponentially over the years due in part to the increased use of technology and prescription drugs, the aging of the population, an increase in chronic diseases, and administrative costs of both public and private programs.35 (Figure 11)
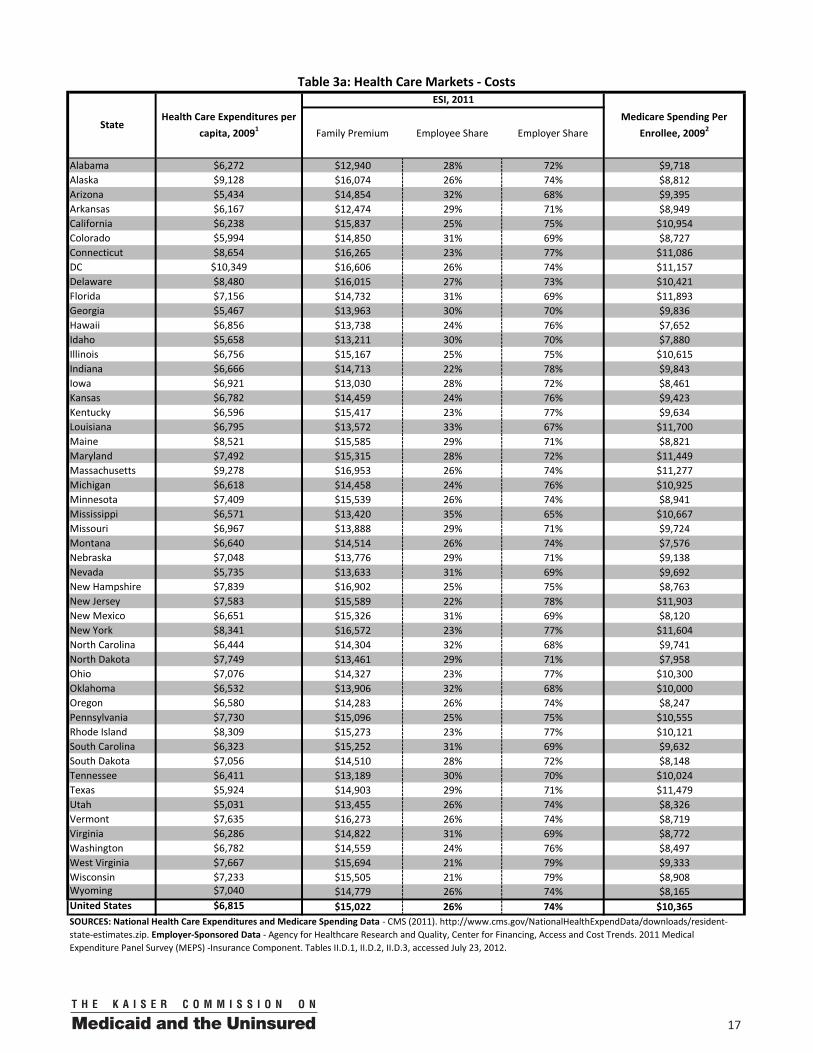
Excluding expenditures for government administration of public programs, public health activities and investment, the US spent $6,815 per capita in 2009 on personal health care. States in the West tend to have lower per capita health care expenditures while states in the Northeast have the highest expenditures per capita, ranging from less than $5,500 in Utah, Arizona, and Georgia to over $9,000 in Alaska, Massachusetts, and the District of Columbia. (Figure 12, Table 3a)
Costs Faced by Different Types of Insurers. The US health care market is made up of a multitude of payers – Medicare, Medicaid, and private payers. The costs faced by payers other than Medicaid can help highlight variation in the markets in which Medicaid operates. Half of all US residents and nearly six in ten non-elderly residents are covered by employer-sponsored private plans. In 2010, the average premium cost for a family (including the employee and employer shares) for employer-based coverage was $13,871 (with 73 percent paid by the employer). These average premium amounts range from $11,379 in Idaho to over $15,000 in the District of Columbia and Florida. Medicare, the primary payer for those over age of 65, spent over $10,365 per enrollee nationally, ranging from $7,576 in Montana and Hawaii to over $11,500 in Florida, Louisiana, New Jersey, and New York in 2009. (Table 3a)
These figures help to highlight regional differences in the cost of purchasing health care services in different markets, which ultimately affects the variation in Medicaid spending. For example, northeastern states have both higher average premiums and higher Medicare spending per beneficiary; therefore, it is likely that the cost of purchasing services for Medicaid programs in these states will be higher than in other states, such as those in the West, where both average premiums and Medicare spending per enrollees are lower.
FIGURE 12
National Health Expenditures Per Capita, 2009
AZ AR
MS
LA
WA
MNND
WYID
UT CO
OR
NV
CA
MT
IA
WI MI
NE
SD
ME
MOKS
OHIN
NY
IL
KY
TNNC
NH
MA
VT
PA
VAWV
CTNJ
DEMD
RI
HI
DC
AK
SCNM
OK
GA
TX
IL
FL
AL
NOTES: Health Care Expenditures measure spending for all privately and publicly funded personal health care services and products (hospital care, physician services, nursing home care, etc.) by state of residence. Hospital spending is included and reflects the total net revenue (gross charges less contractual adjustments, bad debts, and charity care). Costs such as insurance program administration, research, and construction expenses are not included in this total. For more information on definitions, sources, and methods, please see http://www.cms.gov/NationalHealthExpendData/downloads/dsm-09.pdf.SOURCE: CMS (2011). Health Expenditures by State of Residence. Retrieved (December 2011) at http://www.cms.gov/NationalHealthExpendData/downloads/resident-state-estimates.zip
$6000 - $7000 (22 states)Under $6000 (7 states)
$8000 + (8 states including DC)$7000 - $8000 (14 states)
FIGURE 11
Average Annual Growth Rates for NHE and GDP, Per Capita, for Selected Time Periods
9.6%
6.8%
4.3%
2.9%
5.8%
3.9%
11.8%
9.8%
5.4% 5.6%
8.2%
5.3%
1970s 1980s 1990s 2000-2010 1970-2010 2011-2020
GDP Per Capita NHE Per Capita
SOURCE: Historical data from Centers for Medicare and Medicaid Services, Office of the Actuary, National Health Statistics Group, January 2012, at http://www.cms.hhs.gov/NationalHealthExpendData/ (see Historical; NHE summary including share of GDP, CY 1960-2010; file nhegdp10.zip). Projections from Centers for Medicare and Medicaid Services, Office of the Actuary, National Health Statistics Group, July 2011, “National Health Expenditures 2010-2020,” Table 1, https://www.cms.gov/NationalHealthExpendData/downloads/proj2010.pdf.
Projected
00 17
Family Premium Employee Share Employer Share
Alabama $6,272 $12,940 28% 72% $9,718Alaska $9,128 $16,074 26% 74% $8,812Arizona $5,434 $14,854 32% 68% $9,395Arkansas $6,167 $12,474 29% 71% $8,949California $6,238 $15,837 25% 75% $10,954Colorado $5,994 $14,850 31% 69% $8,727Connecticut $8,654 $16,265 23% 77% $11,086DC $10,349 $16,606 26% 74% $11,157Delaware $8,480 $16,015 27% 73% $10,421Florida $7,156 $14,732 31% 69% $11,893Georgia $5,467 $13,963 30% 70% $9,836Hawaii $6,856 $13,738 24% 76% $7,652Idaho $5,658 $13,211 30% 70% $7,880Illinois $6,756 $15,167 25% 75% $10,615Indiana $6,666 $14,713 22% 78% $9,843Iowa $6,921 $13,030 28% 72% $8,461Kansas $6,782 $14,459 24% 76% $9,423Kentucky $6,596 $15,417 23% 77% $9,634Louisiana $6,795 $13,572 33% 67% $11,700Maine $8,521 $15,585 29% 71% $8,821Maryland $7,492 $15,315 28% 72% $11,449Massachusetts $9,278 $16,953 26% 74% $11,277Michigan $6,618 $14,458 24% 76% $10,925Minnesota $7,409 $15,539 26% 74% $8,941Mississippi $6,571 $13,420 35% 65% $10,667Missouri $6,967 $13,888 29% 71% $9,724Montana $6,640 $14,514 26% 74% $7,576Nebraska $7,048 $13,776 29% 71% $9,138Nevada $5,735 $13,633 31% 69% $9,692New Hampshire $7,839 $16,902 25% 75% $8,763New Jersey $7,583 $15,589 22% 78% $11,903New Mexico $6,651 $15,326 31% 69% $8,120New York $8,341 $16,572 23% 77% $11,604North Carolina $6,444 $14,304 32% 68% $9,741North Dakota $7,749 $13,461 29% 71% $7,958Ohio $7,076 $14,327 23% 77% $10,300Oklahoma $6,532 $13,906 32% 68% $10,000Oregon $6,580 $14,283 26% 74% $8,247Pennsylvania $7,730 $15,096 25% 75% $10,555Rhode Island $8,309 $15,273 23% 77% $10,121South Carolina $6,323 $15,252 31% 69% $9,632South Dakota $7,056 $14,510 28% 72% $8,148Tennessee $6,411 $13,189 30% 70% $10,024Texas $5,924 $14,903 29% 71% $11,479Utah $5,031 $13,455 26% 74% $8,326Vermont $7,635 $16,273 26% 74% $8,719Virginia $6,286 $14,822 31% 69% $8,772Washington $6,782 $14,559 24% 76% $8,497West Virginia $7,667 $15,694 21% 79% $9,333Wisconsin $7,233 $15,505 21% 79% $8,908Wyoming $7,040 $14,779 26% 74% $8,165United States $6,815 $15,022 26% 74% $10,365
Table 3a: Health Care Markets - Costs
SOURCES: National Health Care Expenditures and Medicare Spending Data - CMS (2011). http://www.cms.gov/NationalHealthExpendData/downloads/resident-state-estimates.zip. Employer-Sponsored Data - Agency for Healthcare Research and Quality, Center for Financing, Access and Cost Trends. 2011 Medical Expenditure Panel Survey (MEPS) -Insurance Component. Tables II.D.1, II.D.2, II.D.3, accessed July 23, 2012.
StateHealth Care Expenditures per
capita, 20091
ESI, 2011Medicare Spending Per
Enrollee, 20092
0018
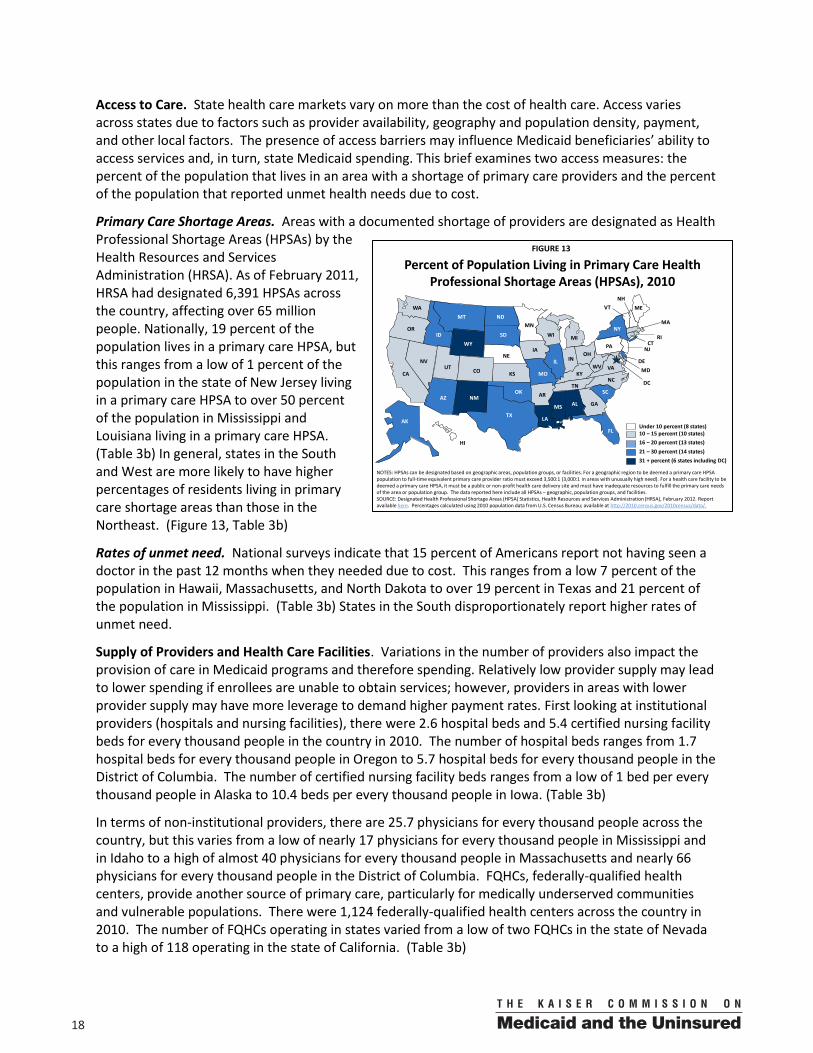
Access to Care. State health care markets vary on more than the cost of health care. Access varies across states due to factors such as provider availability, geography and population density, payment, and other local factors. The presence of access barriers may influence Medicaid beneficiaries’ ability to access services and, in turn, state Medicaid spending. This brief examines two access measures: the percent of the population that lives in an area with a shortage of primary care providers and the percent of the population that reported unmet health needs due to cost.
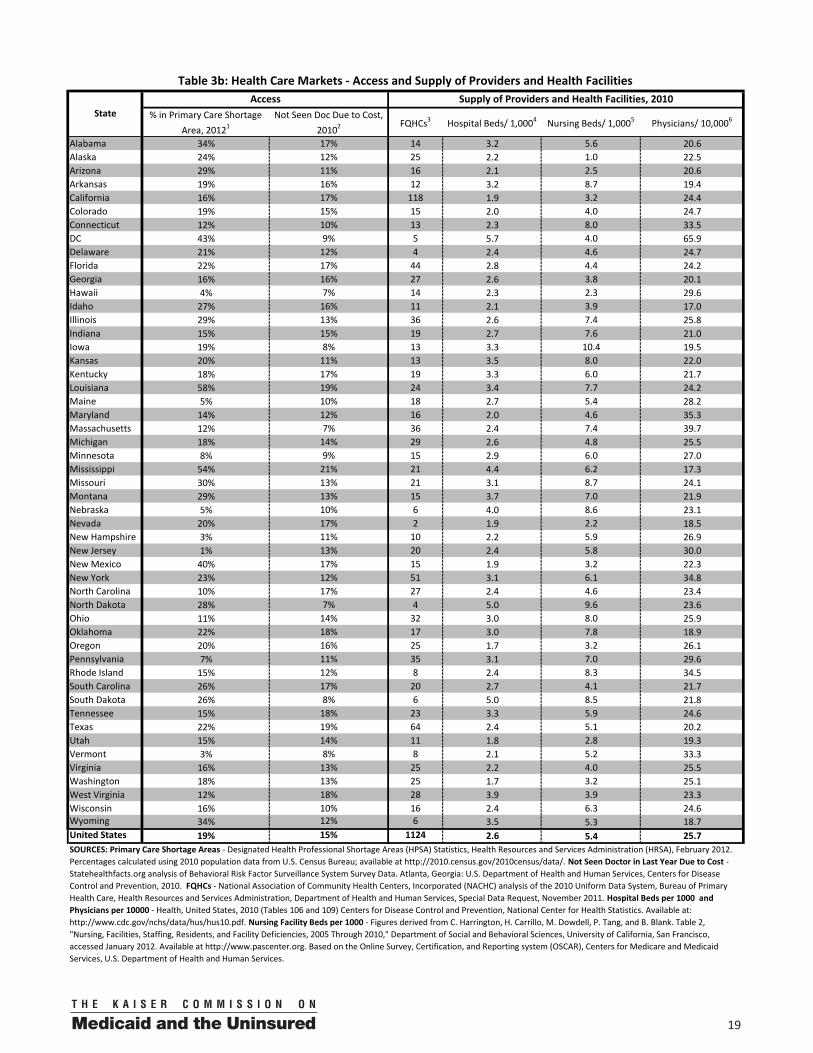
Primary Care Shortage Areas. Areas with a documented shortage of providers are designated as Health Professional Shortage Areas (HPSAs) by the Health Resources and Services Administration (HRSA). As of February 2011, HRSA had designated 6,391 HPSAs across the country, affecting over 65 million people. Nationally, 19 percent of the population lives in a primary care HPSA, but this ranges from a low of 1 percent of the population in the state of New Jersey living in a primary care HPSA to over 50 percent of the population in Mississippi and Louisiana living in a primary care HPSA. (Table 3b) In general, states in the South and West are more likely to have higher percentages of residents living in primary care shortage areas than those in the Northeast. (Figure 13, Table 3b)
Rates of unmet need. National surveys indicate that 15 percent of Americans report not having seen a doctor in the past 12 months when they needed due to cost. This ranges from a low 7 percent of the population in Hawaii, Massachusetts, and North Dakota to over 19 percent in Texas and 21 percent of the population in Mississippi. (Table 3b) States in the South disproportionately report higher rates of unmet need.
Supply of Providers and Health Care Facilities. Variations in the number of providers also impact the provision of care in Medicaid programs and therefore spending. Relatively low provider supply may lead to lower spending if enrollees are unable to obtain services; however, providers in areas with lower provider supply may have more leverage to demand higher payment rates. First looking at institutional providers (hospitals and nursing facilities), there were 2.6 hospital beds and 5.4 certified nursing facility beds for every thousand people in the country in 2010. The number of hospital beds ranges from 1.7 hospital beds for every thousand people in Oregon to 5.7 hospital beds for every thousand people in the District of Columbia. The number of certified nursing facility beds ranges from a low of 1 bed per every thousand people in Alaska to 10.4 beds per every thousand people in Iowa. (Table 3b)
In terms of non-institutional providers, there are 25.7 physicians for every thousand people across the country, but this varies from a low of nearly 17 physicians for every thousand people in Mississippi and in Idaho to a high of almost 40 physicians for every thousand people in Massachusetts and nearly 66 physicians for every thousand people in the District of Columbia. FQHCs, federally-qualified health centers, provide another source of primary care, particularly for medically underserved communities and vulnerable populations. There were 1,124 federally-qualified health centers across the country in 2010. The number of FQHCs operating in states varied from a low of two FQHCs in the state of Nevada to a high of 118 operating in the state of California. (Table 3b)
FIGURE 13
Percent of Population Living in Primary Care Health Professional Shortage Areas (HPSAs), 2010
AZ AR
MS
LA
WA
MNND
WYID
UT CO
OR
NV
CA
MT
IA
WI MI
NE
SD
ME
MOKS
OHIN
NY
IL
KY
TNNC
NH
MA
VT
PA
VAWV
CTNJ
DEMD
RI
HI
DC
AK
SCNM
OK
GA
TX
IL
FL
AL
10 – 15 percent (10 states)Under 10 percent (8 states)
21 – 30 percent (14 states)16 – 20 percent (13 states)
31 + percent (6 states including DC)
NOTES: HPSAs can be designated based on geographic areas, population groups, or facilities. For a geographic region to be deemed a primary care HPSA population to full-time equivalent primary care provider ratio must exceed 3,500:1 (3,000:1 in areas with unusually high need). For a health care facility to be deemed a primary care HPSA, it must be a public or non-profit health care delivery site and must have inadequate resources to fulfill the primary care needs of the area or population group. The data reported here include all HPSAs – geographic, population groups, and facilities.SOURCE: Designated Health Professional Shortage Areas (HPSA) Statistics, Health Resources and Services Administration (HRSA), February 2012. Report available here. Percentages calculated using 2010 population data from U.S. Census Bureau; available at http://2010.census.gov/2010census/data/.
00 19
% in Primary Care Shortage Area, 20121
Not Seen Doc Due to Cost, 20102 FQHCs3 Hospital Beds/ 1,0004 Nursing Beds/ 1,0005 Physicians/ 10,0006
Alabama 34% 17% 14 3.2 5.6 20.6Alaska 24% 12% 25 2.2 1.0 22.5Arizona 29% 11% 16 2.1 2.5 20.6Arkansas 19% 16% 12 3.2 8.7 19.4California 16% 17% 118 1.9 3.2 24.4Colorado 19% 15% 15 2.0 4.0 24.7Connecticut 12% 10% 13 2.3 8.0 33.5DC 43% 9% 5 5.7 4.0 65.9Delaware 21% 12% 4 2.4 4.6 24.7Florida 22% 17% 44 2.8 4.4 24.2Georgia 16% 16% 27 2.6 3.8 20.1Hawaii 4% 7% 14 2.3 2.3 29.6Idaho 27% 16% 11 2.1 3.9 17.0Illinois 29% 13% 36 2.6 7.4 25.8Indiana 15% 15% 19 2.7 7.6 21.0Iowa 19% 8% 13 3.3 10.4 19.5Kansas 20% 11% 13 3.5 8.0 22.0Kentucky 18% 17% 19 3.3 6.0 21.7Louisiana 58% 19% 24 3.4 7.7 24.2Maine 5% 10% 18 2.7 5.4 28.2Maryland 14% 12% 16 2.0 4.6 35.3Massachusetts 12% 7% 36 2.4 7.4 39.7Michigan 18% 14% 29 2.6 4.8 25.5Minnesota 8% 9% 15 2.9 6.0 27.0Mississippi 54% 21% 21 4.4 6.2 17.3Missouri 30% 13% 21 3.1 8.7 24.1Montana 29% 13% 15 3.7 7.0 21.9Nebraska 5% 10% 6 4.0 8.6 23.1Nevada 20% 17% 2 1.9 2.2 18.5New Hampshire 3% 11% 10 2.2 5.9 26.9New Jersey 1% 13% 20 2.4 5.8 30.0New Mexico 40% 17% 15 1.9 3.2 22.3New York 23% 12% 51 3.1 6.1 34.8North Carolina 10% 17% 27 2.4 4.6 23.4North Dakota 28% 7% 4 5.0 9.6 23.6Ohio 11% 14% 32 3.0 8.0 25.9Oklahoma 22% 18% 17 3.0 7.8 18.9Oregon 20% 16% 25 1.7 3.2 26.1Pennsylvania 7% 11% 35 3.1 7.0 29.6Rhode Island 15% 12% 8 2.4 8.3 34.5South Carolina 26% 17% 20 2.7 4.1 21.7South Dakota 26% 8% 6 5.0 8.5 21.8Tennessee 15% 18% 23 3.3 5.9 24.6Texas 22% 19% 64 2.4 5.1 20.2Utah 15% 14% 11 1.8 2.8 19.3Vermont 3% 8% 8 2.1 5.2 33.3Virginia 16% 13% 25 2.2 4.0 25.5Washington 18% 13% 25 1.7 3.2 25.1West Virginia 12% 18% 28 3.9 3.9 23.3Wisconsin 16% 10% 16 2.4 6.3 24.6Wyoming 34% 12% 6 3.5 5.3 18.7United States 19% 15% 1124 2.6 5.4 25.7
Table 3b: Health Care Markets - Access and Supply of Providers and Health FacilitiesSupply of Providers and Health Facilities, 2010Access
State
SOURCES: Primary Care Shortage Areas - Designated Health Professional Shortage Areas (HPSA) Statistics, Health Resources and Services Administration (HRSA), February 2012. Percentages calculated using 2010 population data from U.S. Census Bureau; available at http://2010.census.gov/2010census/data/. Not Seen Doctor in Last Year Due to Cost - Statehealthfacts.org analysis of Behavioral Risk Factor Surveillance System Survey Data. Atlanta, Georgia: U.S. Department of Health and Human Services, Centers for Disease Control and Prevention, 2010. FQHCs - National Association of Community Health Centers, Incorporated (NACHC) analysis of the 2010 Uniform Data System, Bureau of Primary Health Care, Health Resources and Services Administration, Department of Health and Human Services, Special Data Request, November 2011. Hospital Beds per 1000 and Physicians per 10000 - Health, United States, 2010 (Tables 106 and 109) Centers for Disease Control and Prevention, National Center for Health Statistics. Available at: http://www.cdc.gov/nchs/data/hus/hus10.pdf. Nursing Facility Beds per 1000 - Figures derived from C. Harrington, H. Carrillo, M. Dowdell, P. Tang, and B. Blank. Table 2, "Nursing, Facilities, Staffing, Residents, and Facility Deficiencies, 2005 Through 2010," Department of Social and Behavioral Sciences, University of California, San Francisco, accessed January 2012. Available at http://www.pascenter.org. Based on the Online Survey, Certification, and Reporting system (OSCAR), Centers for Medicare and Medicaid Services, U.S. Department of Health and Human Services.
0020
4. What Medicaid Policy Choices Have States Made?
States administer Medicaid within broad federal rules, and the program is jointly financed by the federal government and the states. The federal government sets core requirements, but states have flexibility to determine eligibility levels, benefits, provider payments, and delivery systems. There is a great deal of variation across states in Medicaid programs and therefore spending on the program due to policy choices made by states.
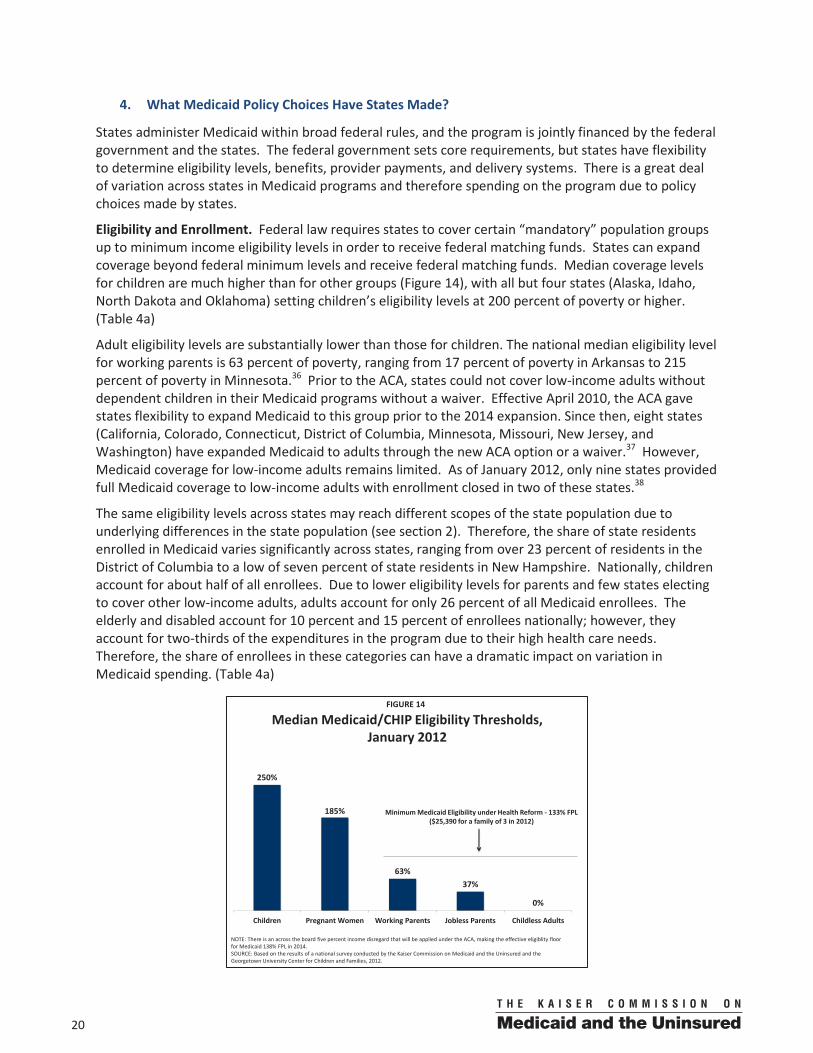
Eligibility and Enrollment. Federal law requires states to cover certain “mandatory” population groups up to minimum income eligibility levels in order to receive federal matching funds. States can expand coverage beyond federal minimum levels and receive federal matching funds. Median coverage levels for children are much higher than for other groups (Figure 14), with all but four states (Alaska, Idaho, North Dakota and Oklahoma) setting children’s eligibility levels at 200 percent of poverty or higher. (Table 4a)
Adult eligibility levels are substantially lower than those for children. The national median eligibility level for working parents is 63 percent of poverty, ranging from 17 percent of poverty in Arkansas to 215 percent of poverty in Minnesota.36 Prior to the ACA, states could not cover low-income adults without dependent children in their Medicaid programs without a waiver. Effective April 2010, the ACA gave states flexibility to expand Medicaid to this group prior to the 2014 expansion. Since then, eight states (California, Colorado, Connecticut, District of Columbia, Minnesota, Missouri, New Jersey, and Washington) have expanded Medicaid to adults through the new ACA option or a waiver.37 However, Medicaid coverage for low-income adults remains limited. As of January 2012, only nine states provided full Medicaid coverage to low-income adults with enrollment closed in two of these states.38
The same eligibility levels across states may reach different scopes of the state population due to underlying differences in the state population (see section 2). Therefore, the share of state residents enrolled in Medicaid varies significantly across states, ranging from over 23 percent of residents in the District of Columbia to a low of seven percent of state residents in New Hampshire. Nationally, children account for about half of all enrollees. Due to lower eligibility levels for parents and few states electing to cover other low-income adults, adults account for only 26 percent of all Medicaid enrollees. The elderly and disabled account for 10 percent and 15 percent of enrollees nationally; however, they account for two-thirds of the expenditures in the program due to their high health care needs. Therefore, the share of enrollees in these categories can have a dramatic impact on variation in Medicaid spending. (Table 4a)
FIGURE 14
Median Medicaid/CHIP Eligibility Thresholds, January 2012
250%
185%
63%37%
0%
Children Pregnant Women Working Parents Jobless Parents Childless Adults
Minimum Medicaid Eligibility under Health Reform - 133% FPL ($25,390 for a family of 3 in 2012)
NOTE: There is an across the board five percent income disregard that will be applied under the ACA, making the effective eligiblity floor for Medicaid 138% FPL in 2014. SOURCE: Based on the results of a national survey conducted by the Kaiser Commission on Medicaid and the Uninsured and the Georgetown University Center for Children and Families, 2012.
00 21
Benefits. States participating in Medicaid must provide coverage for a core set of benefits, but states can also receive federal matching funds for coverage of “optional benefits.” All states cover some optional benefits, but the scope of state benefit packages varies widely across states. States also have flexibility in determining the amount, duration and scope of the benefits they offer. For example, states can implement reasonable limits on the number of prescriptions a beneficiary can have refilled in a month before more stringent review is applied or set reasonable limits on the number of physician visits in a year. Within federal guidelines, states may also decide whether to charge nominal cost sharing to beneficiaries. Forty-five states had elected to implement cost-sharing on at least one Medicaid service in 2010. However, federal Medicaid rules limit the amount of cost-sharing that can be charged to Medicaid beneficiaries, with particularly strong restrictions on the application of cost-sharing for pregnant women, children and adults with income below the poverty level.
The number of options states have in setting eligibility levels and selecting the benefits covered alone has led to significant variation in Medicaid program design and therefore spending. In fact, the amount spent for covering these optional populations and benefits in Medicaid varies quite significantly across states. In 2007, four in ten dollars were spent on federally‐required services provided to federal core enrollees and the remaining 60 percent of spending was for state expansion enrollees and/or optional services. (Figure 15) Spending for expansion enrollees and optional services ranges from less than half of total Medicaid spending in Arizona, Georgia, Texas, Tennessee, Nevada and Colorado to more than 75 percent in North Dakota, New Hampshire, Connecticut and Vermont.39 (Table 4a)
FIGURE 15
Mandatory Services for
State Expansion Enrollees
27%
Optional Services for
State Expansion Enrollees
14%
Optional Services for Federal Core
Enrollees19%
Mandatory Services for Federal Core
Enrollees40%
Mandatory vs. Optional Medicaid Spending, FFY 2007
2007 Total = $311 billionNOTE: Total expenditures do not include disproportionate share hospital (DSH) payments, drug rebates, administrative costs, or accounting adjustments. SOURCE: Urban Institute estimates based on FFY data from the 2007 MSIS and CMS 64.
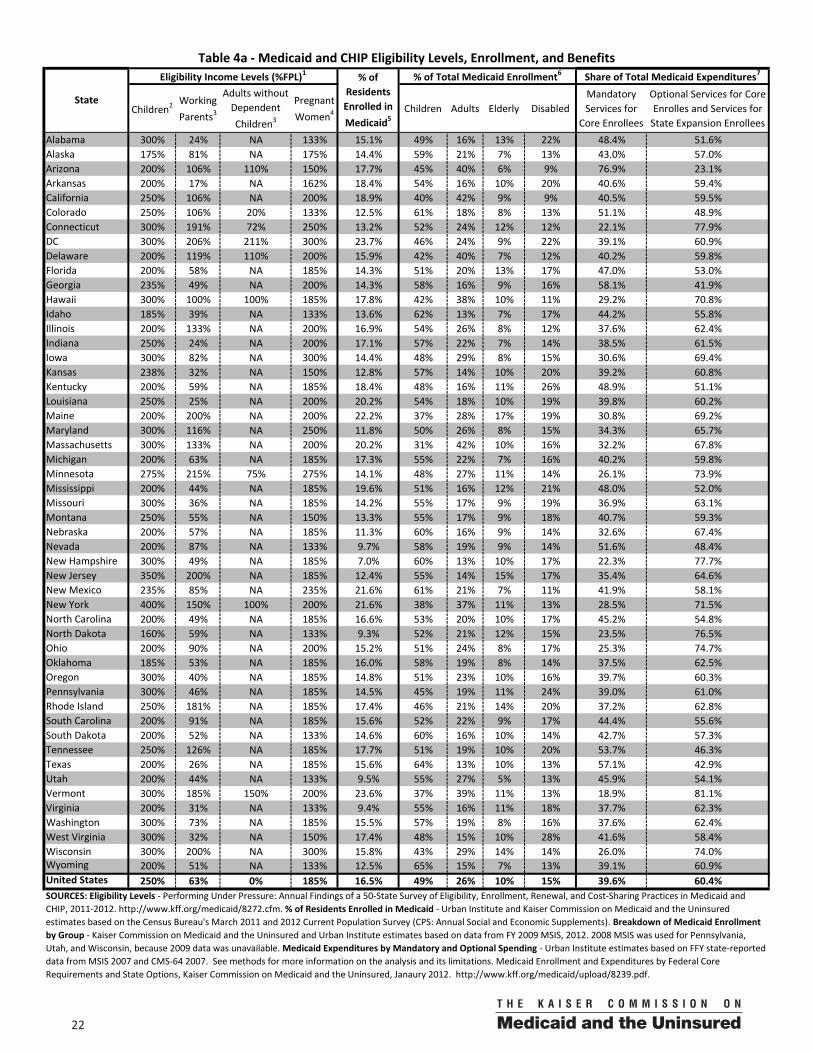
0022
Children2 Working Parents3
Adults without Dependent Children3
Pregnant Women4 Children Adults Elderly Disabled
Mandatory Services for
Core Enrollees
Optional Services for Core Enrolles and Services for
State Expansion EnrolleesAlabama 300% 24% NA 133% 15.1% 49% 16% 13% 22% 48.4% 51.6%Alaska 175% 81% NA 175% 14.4% 59% 21% 7% 13% 43.0% 57.0%Arizona 200% 106% 110% 150% 17.7% 45% 40% 6% 9% 76.9% 23.1%Arkansas 200% 17% NA 162% 18.4% 54% 16% 10% 20% 40.6% 59.4%California 250% 106% NA 200% 18.9% 40% 42% 9% 9% 40.5% 59.5%Colorado 250% 106% 20% 133% 12.5% 61% 18% 8% 13% 51.1% 48.9%Connecticut 300% 191% 72% 250% 13.2% 52% 24% 12% 12% 22.1% 77.9%DC 300% 206% 211% 300% 23.7% 46% 24% 9% 22% 39.1% 60.9%Delaware 200% 119% 110% 200% 15.9% 42% 40% 7% 12% 40.2% 59.8%Florida 200% 58% NA 185% 14.3% 51% 20% 13% 17% 47.0% 53.0%Georgia 235% 49% NA 200% 14.3% 58% 16% 9% 16% 58.1% 41.9%Hawaii 300% 100% 100% 185% 17.8% 42% 38% 10% 11% 29.2% 70.8%Idaho 185% 39% NA 133% 13.6% 62% 13% 7% 17% 44.2% 55.8%Illinois 200% 133% NA 200% 16.9% 54% 26% 8% 12% 37.6% 62.4%Indiana 250% 24% NA 200% 17.1% 57% 22% 7% 14% 38.5% 61.5%Iowa 300% 82% NA 300% 14.4% 48% 29% 8% 15% 30.6% 69.4%Kansas 238% 32% NA 150% 12.8% 57% 14% 10% 20% 39.2% 60.8%Kentucky 200% 59% NA 185% 18.4% 48% 16% 11% 26% 48.9% 51.1%Louisiana 250% 25% NA 200% 20.2% 54% 18% 10% 19% 39.8% 60.2%Maine 200% 200% NA 200% 22.2% 37% 28% 17% 19% 30.8% 69.2%Maryland 300% 116% NA 250% 11.8% 50% 26% 8% 15% 34.3% 65.7%Massachusetts 300% 133% NA 200% 20.2% 31% 42% 10% 16% 32.2% 67.8%Michigan 200% 63% NA 185% 17.3% 55% 22% 7% 16% 40.2% 59.8%Minnesota 275% 215% 75% 275% 14.1% 48% 27% 11% 14% 26.1% 73.9%Mississippi 200% 44% NA 185% 19.6% 51% 16% 12% 21% 48.0% 52.0%Missouri 300% 36% NA 185% 14.2% 55% 17% 9% 19% 36.9% 63.1%Montana 250% 55% NA 150% 13.3% 55% 17% 9% 18% 40.7% 59.3%Nebraska 200% 57% NA 185% 11.3% 60% 16% 9% 14% 32.6% 67.4%Nevada 200% 87% NA 133% 9.7% 58% 19% 9% 14% 51.6% 48.4%New Hampshire 300% 49% NA 185% 7.0% 60% 13% 10% 17% 22.3% 77.7%New Jersey 350% 200% NA 185% 12.4% 55% 14% 15% 17% 35.4% 64.6%New Mexico 235% 85% NA 235% 21.6% 61% 21% 7% 11% 41.9% 58.1%New York 400% 150% 100% 200% 21.6% 38% 37% 11% 13% 28.5% 71.5%North Carolina 200% 49% NA 185% 16.6% 53% 20% 10% 17% 45.2% 54.8%North Dakota 160% 59% NA 133% 9.3% 52% 21% 12% 15% 23.5% 76.5%Ohio 200% 90% NA 200% 15.2% 51% 24% 8% 17% 25.3% 74.7%Oklahoma 185% 53% NA 185% 16.0% 58% 19% 8% 14% 37.5% 62.5%Oregon 300% 40% NA 185% 14.8% 51% 23% 10% 16% 39.7% 60.3%Pennsylvania 300% 46% NA 185% 14.5% 45% 19% 11% 24% 39.0% 61.0%Rhode Island 250% 181% NA 185% 17.4% 46% 21% 14% 20% 37.2% 62.8%South Carolina 200% 91% NA 185% 15.6% 52% 22% 9% 17% 44.4% 55.6%South Dakota 200% 52% NA 133% 14.6% 60% 16% 10% 14% 42.7% 57.3%Tennessee 250% 126% NA 185% 17.7% 51% 19% 10% 20% 53.7% 46.3%Texas 200% 26% NA 185% 15.6% 64% 13% 10% 13% 57.1% 42.9%Utah 200% 44% NA 133% 9.5% 55% 27% 5% 13% 45.9% 54.1%Vermont 300% 185% 150% 200% 23.6% 37% 39% 11% 13% 18.9% 81.1%Virginia 200% 31% NA 133% 9.4% 55% 16% 11% 18% 37.7% 62.3%Washington 300% 73% NA 185% 15.5% 57% 19% 8% 16% 37.6% 62.4%West Virginia 300% 32% NA 150% 17.4% 48% 15% 10% 28% 41.6% 58.4%Wisconsin 300% 200% NA 300% 15.8% 43% 29% 14% 14% 26.0% 74.0%Wyoming 200% 51% NA 133% 12.5% 65% 15% 7% 13% 39.1% 60.9%United States 250% 63% 0% 185% 16.5% 49% 26% 10% 15% 39.6% 60.4%SOURCES: Eligibility Levels - Performing Under Pressure: Annual Findings of a 50-State Survey of Eligibility, Enrollment, Renewal, and Cost-Sharing Practices in Medicaid and CHIP, 2011-2012. http://www.kff.org/medicaid/8272.cfm. % of Residents Enrolled in Medicaid - Urban Institute and Kaiser Commission on Medicaid and the Uninsured estimates based on the Census Bureau's March 2011 and 2012 Current Population Survey (CPS: Annual Social and Economic Supplements). Breakdown of Medicaid Enrollment by Group - Kaiser Commission on Medicaid and the Uninsured and Urban Institute estimates based on data from FY 2009 MSIS, 2012. 2008 MSIS was used for Pennsylvania, Utah, and Wisconsin, because 2009 data was unavailable. Medicaid Expenditures by Mandatory and Optional Spending - Urban Institute estimates based on FFY state-reported data from MSIS 2007 and CMS-64 2007. See methods for more information on the analysis and its limitations. Medicaid Enrollment and Expenditures by Federal Core Requirements and State Options, Kaiser Commission on Medicaid and the Uninsured, Janaury 2012. http://www.kff.org/medicaid/upload/8239.pdf.
Table 4a - Medicaid and CHIP Eligibility Levels, Enrollment, and Benefits
State
Eligibility Income Levels (%FPL)1 % of Residents Enrolled in Medicaid5
% of Total Medicaid Enrollment6 Share of Total Medicaid Expenditures7
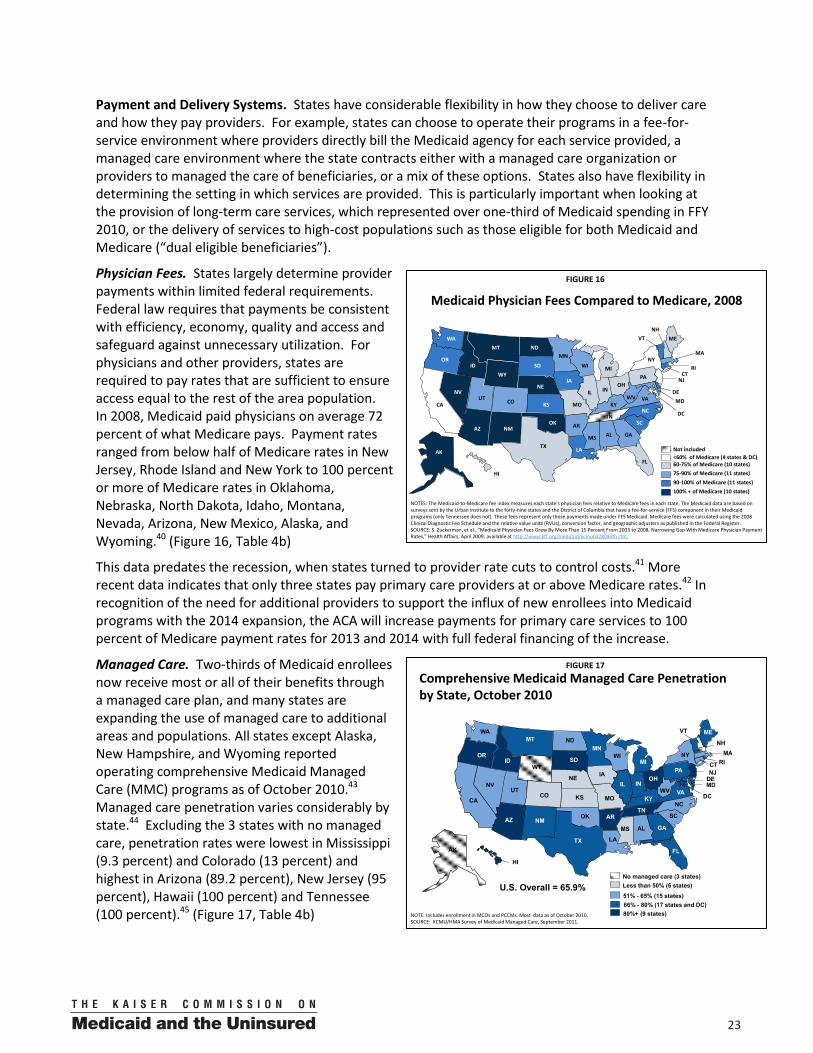
00 23
Payment and Delivery Systems. States have considerable flexibility in how they choose to deliver care and how they pay providers. For example, states can choose to operate their programs in a fee-for-service environment where providers directly bill the Medicaid agency for each service provided, a managed care environment where the state contracts either with a managed care organization or providers to managed the care of beneficiaries, or a mix of these options. States also have flexibility in determining the setting in which services are provided. This is particularly important when looking at the provision of long-term care services, which represented over one-third of Medicaid spending in FFY 2010, or the delivery of services to high-cost populations such as those eligible for both Medicaid and Medicare (“dual eligible beneficiaries”).
Physician Fees. States largely determine provider payments within limited federal requirements. Federal law requires that payments be consistent with efficiency, economy, quality and access and safeguard against unnecessary utilization. For physicians and other providers, states are required to pay rates that are sufficient to ensure access equal to the rest of the area population. In 2008, Medicaid paid physicians on average 72 percent of what Medicare pays. Payment rates ranged from below half of Medicare rates in New Jersey, Rhode Island and New York to 100 percent or more of Medicare rates in Oklahoma, Nebraska, North Dakota, Idaho, Montana, Nevada, Arizona, New Mexico, Alaska, and Wyoming.40 (Figure 16, Table 4b)
This data predates the recession, when states turned to provider rate cuts to control costs.41 More recent data indicates that only three states pay primary care providers at or above Medicare rates.42 In recognition of the need for additional providers to support the influx of new enrollees into Medicaid programs with the 2014 expansion, the ACA will increase payments for primary care services to 100 percent of Medicare payment rates for 2013 and 2014 with full federal financing of the increase.
Managed Care. Two-thirds of Medicaid enrollees now receive most or all of their benefits through a managed care plan, and many states are expanding the use of managed care to additional areas and populations. All states except Alaska, New Hampshire, and Wyoming reported operating comprehensive Medicaid Managed Care (MMC) programs as of October 2010.43 Managed care penetration varies considerably by state.44 Excluding the 3 states with no managed care, penetration rates were lowest in Mississippi (9.3 percent) and Colorado (13 percent) and highest in Arizona (89.2 percent), New Jersey (95 percent), Hawaii (100 percent) and Tennessee (100 percent).45 (Figure 17, Table 4b)
FIGURE 17
Comprehensive Medicaid Managed Care Penetrationby State, October 2010
NOTE: Includes enrollment in MCOs and PCCMs. Most data as of October 2010. SOURCE: KCMU/HMA Survey of Medicaid Managed Care, September 2011.
WY
WI
WV
WA
VA
VT
UT
TX
TN
SD
SC
RIPA
OR
OK
OH
ND
NC
NY
NM
NJ
NH
NVNE
MT
MO
MS
MN
MIMA
MD
ME
LA
KYKS
IAINIL
ID
HI
GA
FL
DC
DE
CT
COCA
ARAZ
AK
AL
51% - 65% (15 states)Less than 50% (6 states)
80%+ (9 states)66% - 80% (17 states and DC)
U.S. Overall = 65.9%No managed care (3 states)
FIGURE 16
Medicaid Physician Fees Compared to Medicare, 2008
AZ AR
MS
LA
WA
MNND
WYID
UT CO
OR
NV
CA
MT
IA
WI MI
NE
SD
ME
MOKS
OHIN
NY
IL
KY
TNNC
NH
MA
VT
PA
VAWV
CTNJ
DEMD
RI
HI
DC
AK
SCNM
OK
GA
TX
IL
FL
AL
NOTES: The Medicaid-to-Medicare fee index measures each state's physician fees relative to Medicare fees in each state. The Medicaid data are based on surveys sent by the Urban Institute to the forty-nine states and the District of Columbia that have a fee-for-service (FFS) component in their Medicaid programs (only Tennessee does not). These fees represent only those payments made under FFS Medicaid. Medicare fees were calculated using the 2008 Clinical Diagnostic Fee Schedule and the relative value units (RVUs), conversion factor, and geographic adjusters as published in the Federal Register. SOURCE: S. Zuckerman, et al., "Medicaid Physician Fees Grew By More Than 15 Percent From 2003 to 2008, Narrowing Gap With Medicare Physician Payment Rates," Health Affairs, April 2009; available at http://www.kff.org/medicaid/kcmu042809oth.cfm.
60-75% of Medicare (10 states)<60% of Medicare (4 states & DC)
90-100% of Medicare (11 states)75-90% of Medicare (11 states)
100% + of Medicare (10 states)
Not included
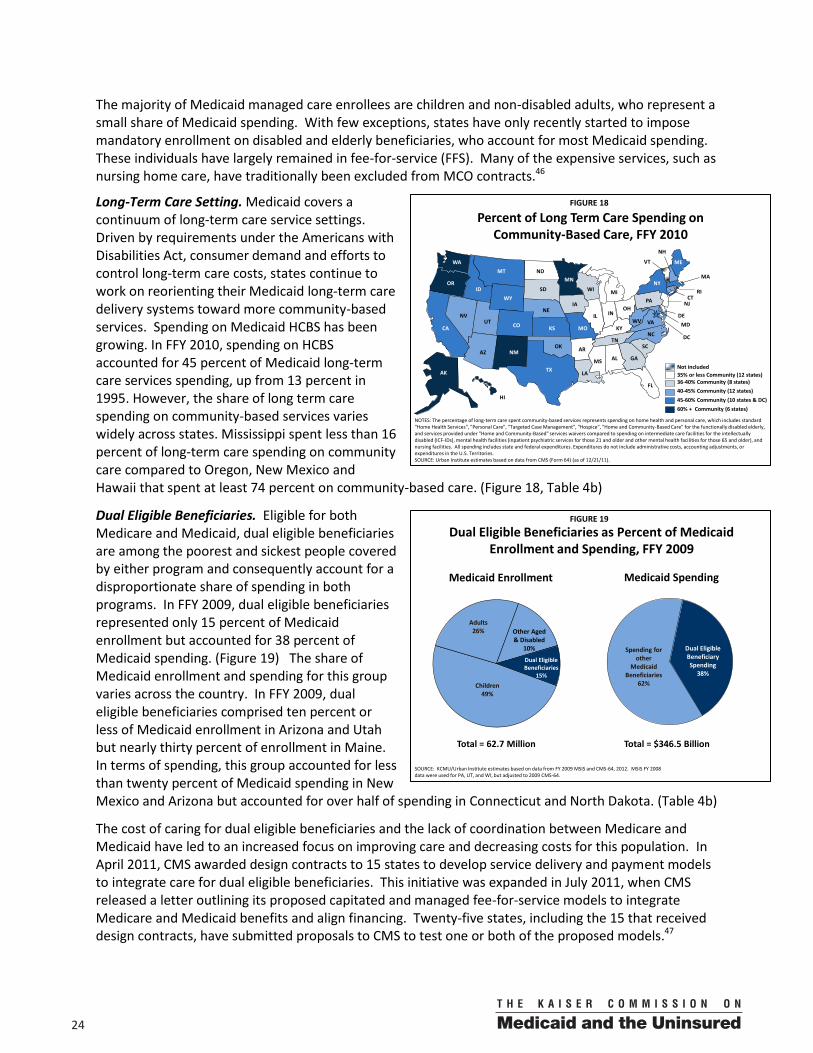
0024
The majority of Medicaid managed care enrollees are children and non-disabled adults, who represent a small share of Medicaid spending. With few exceptions, states have only recently started to impose mandatory enrollment on disabled and elderly beneficiaries, who account for most Medicaid spending. These individuals have largely remained in fee-for-service (FFS). Many of the expensive services, such as nursing home care, have traditionally been excluded from MCO contracts.46
Long-Term Care Setting. Medicaid covers a continuum of long-term care service settings. Driven by requirements under the Americans with Disabilities Act, consumer demand and efforts to control long-term care costs, states continue to work on reorienting their Medicaid long-term care delivery systems toward more community-based services. Spending on Medicaid HCBS has been growing. In FFY 2010, spending on HCBS accounted for 45 percent of Medicaid long-term care services spending, up from 13 percent in 1995. However, the share of long term care spending on community-based services varies widely across states. Mississippi spent less than 16 percent of long-term care spending on community care compared to Oregon, New Mexico and Hawaii that spent at least 74 percent on community-based care. (Figure 18, Table 4b)
Dual Eligible Beneficiaries. Eligible for both Medicare and Medicaid, dual eligible beneficiaries are among the poorest and sickest people covered by either program and consequently account for a disproportionate share of spending in both programs. In FFY 2009, dual eligible beneficiaries represented only 15 percent of Medicaid enrollment but accounted for 38 percent of Medicaid spending. (Figure 19) The share of Medicaid enrollment and spending for this group varies across the country. In FFY 2009, dual eligible beneficiaries comprised ten percent or less of Medicaid enrollment in Arizona and Utah but nearly thirty percent of enrollment in Maine. In terms of spending, this group accounted for less than twenty percent of Medicaid spending in New Mexico and Arizona but accounted for over half of spending in Connecticut and North Dakota. (Table 4b)
The cost of caring for dual eligible beneficiaries and the lack of coordination between Medicare and Medicaid have led to an increased focus on improving care and decreasing costs for this population. In April 2011, CMS awarded design contracts to 15 states to develop service delivery and payment models to integrate care for dual eligible beneficiaries. This initiative was expanded in July 2011, when CMS released a letter outlining its proposed capitated and managed fee-for-service models to integrate Medicare and Medicaid benefits and align financing. Twenty-five states, including the 15 that received design contracts, have submitted proposals to CMS to test one or both of the proposed models.47
FIGURE 18
Percent of Long Term Care Spending on Community-Based Care, FFY 2010
AZ AR
MS
LA
WA
MNND
WYID
UT CO
OR
NV
CA
MT
IA
WI MI
NE
SD
ME
MOKS
OHIN
NY
IL
KY
TNNC
NH
MA
VT
PA
VAWV
CTNJ
DEMD
RI
HI
DC
AK
SCNM
OK
GA
TX
IL
FL
AL
NOTES: The percentage of long-term care spent community-based services represents spending on home health and personal care, which includes standard "Home Health Services", "Personal Care", "Targeted Case Management", "Hospice", "Home and Community-Based Care" for the functionally disabled elderly, and services provided under "Home and Community-Based" services waivers compared to spending on intermediate care facilities for the intellectually disabled (ICF-IDs), mental health facilities (inpatient psychiatric services for those 21 and older and other mental health facilities for those 65 and older), and nursing facilities. All spending includes state and federal expenditures. Expenditures do not include administrative costs, accounting adjustments, or expenditures in the U.S. Territories. SOURCE: Urban Institute estimates based on data from CMS (Form 64) (as of 12/21/11).
36-40% Community (8 states)35% or less Community (12 states)
45-60% Community (10 states & DC)40-45% Community (12 states)
60% + Community (6 states)
Not included
FIGURE 19
Dual Eligible Beneficiaries as Percent of Medicaid Enrollment and Spending, FFY 2009
SOURCE: KCMU/Urban Institute estimates based on data from FY 2009 MSIS and CMS-64, 2012. MSIS FY 2008 data were used for PA, UT, and WI, but adjusted to 2009 CMS-64.
Total = 62.7 Million
Medicaid Enrollment Medicaid Spending
Total = $346.5 Billion
Dual Eligible Beneficiaries
15%Children
49%
Other Aged & Disabled
10%
Adults 26%
Spending for other
Medicaid Beneficiaries
62%
Dual Eligible Beneficiary Spending
38%
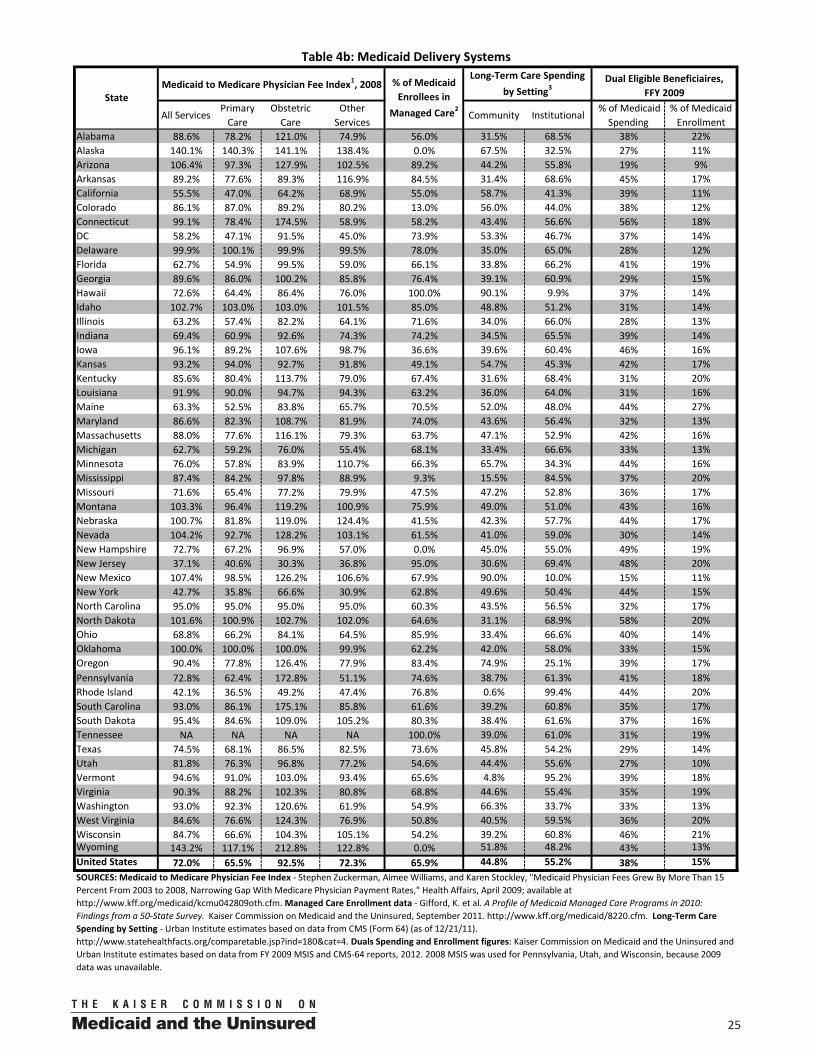
00 25
All ServicesPrimary
CareObstetric
CareOther
ServicesCommunity Institutional
% of Medicaid Spending
% of Medicaid Enrollment
Alabama 88.6% 78.2% 121.0% 74.9% 56.0% 31.5% 68.5% 38% 22%Alaska 140.1% 140.3% 141.1% 138.4% 0.0% 67.5% 32.5% 27% 11%Arizona 106.4% 97.3% 127.9% 102.5% 89.2% 44.2% 55.8% 19% 9%Arkansas 89.2% 77.6% 89.3% 116.9% 84.5% 31.4% 68.6% 45% 17%California 55.5% 47.0% 64.2% 68.9% 55.0% 58.7% 41.3% 39% 11%Colorado 86.1% 87.0% 89.2% 80.2% 13.0% 56.0% 44.0% 38% 12%Connecticut 99.1% 78.4% 174.5% 58.9% 58.2% 43.4% 56.6% 56% 18%DC 58.2% 47.1% 91.5% 45.0% 73.9% 53.3% 46.7% 37% 14%Delaware 99.9% 100.1% 99.9% 99.5% 78.0% 35.0% 65.0% 28% 12%Florida 62.7% 54.9% 99.5% 59.0% 66.1% 33.8% 66.2% 41% 19%Georgia 89.6% 86.0% 100.2% 85.8% 76.4% 39.1% 60.9% 29% 15%Hawaii 72.6% 64.4% 86.4% 76.0% 100.0% 90.1% 9.9% 37% 14%Idaho 102.7% 103.0% 103.0% 101.5% 85.0% 48.8% 51.2% 31% 14%Illinois 63.2% 57.4% 82.2% 64.1% 71.6% 34.0% 66.0% 28% 13%Indiana 69.4% 60.9% 92.6% 74.3% 74.2% 34.5% 65.5% 39% 14%Iowa 96.1% 89.2% 107.6% 98.7% 36.6% 39.6% 60.4% 46% 16%Kansas 93.2% 94.0% 92.7% 91.8% 49.1% 54.7% 45.3% 42% 17%Kentucky 85.6% 80.4% 113.7% 79.0% 67.4% 31.6% 68.4% 31% 20%Louisiana 91.9% 90.0% 94.7% 94.3% 63.2% 36.0% 64.0% 31% 16%Maine 63.3% 52.5% 83.8% 65.7% 70.5% 52.0% 48.0% 44% 27%Maryland 86.6% 82.3% 108.7% 81.9% 74.0% 43.6% 56.4% 32% 13%Massachusetts 88.0% 77.6% 116.1% 79.3% 63.7% 47.1% 52.9% 42% 16%Michigan 62.7% 59.2% 76.0% 55.4% 68.1% 33.4% 66.6% 33% 13%Minnesota 76.0% 57.8% 83.9% 110.7% 66.3% 65.7% 34.3% 44% 16%Mississippi 87.4% 84.2% 97.8% 88.9% 9.3% 15.5% 84.5% 37% 20%Missouri 71.6% 65.4% 77.2% 79.9% 47.5% 47.2% 52.8% 36% 17%Montana 103.3% 96.4% 119.2% 100.9% 75.9% 49.0% 51.0% 43% 16%Nebraska 100.7% 81.8% 119.0% 124.4% 41.5% 42.3% 57.7% 44% 17%Nevada 104.2% 92.7% 128.2% 103.1% 61.5% 41.0% 59.0% 30% 14%New Hampshire 72.7% 67.2% 96.9% 57.0% 0.0% 45.0% 55.0% 49% 19%New Jersey 37.1% 40.6% 30.3% 36.8% 95.0% 30.6% 69.4% 48% 20%New Mexico 107.4% 98.5% 126.2% 106.6% 67.9% 90.0% 10.0% 15% 11%New York 42.7% 35.8% 66.6% 30.9% 62.8% 49.6% 50.4% 44% 15%North Carolina 95.0% 95.0% 95.0% 95.0% 60.3% 43.5% 56.5% 32% 17%North Dakota 101.6% 100.9% 102.7% 102.0% 64.6% 31.1% 68.9% 58% 20%Ohio 68.8% 66.2% 84.1% 64.5% 85.9% 33.4% 66.6% 40% 14%Oklahoma 100.0% 100.0% 100.0% 99.9% 62.2% 42.0% 58.0% 33% 15%Oregon 90.4% 77.8% 126.4% 77.9% 83.4% 74.9% 25.1% 39% 17%Pennsylvania 72.8% 62.4% 172.8% 51.1% 74.6% 38.7% 61.3% 41% 18%Rhode Island 42.1% 36.5% 49.2% 47.4% 76.8% 0.6% 99.4% 44% 20%South Carolina 93.0% 86.1% 175.1% 85.8% 61.6% 39.2% 60.8% 35% 17%South Dakota 95.4% 84.6% 109.0% 105.2% 80.3% 38.4% 61.6% 37% 16%Tennessee NA NA NA NA 100.0% 39.0% 61.0% 31% 19%Texas 74.5% 68.1% 86.5% 82.5% 73.6% 45.8% 54.2% 29% 14%Utah 81.8% 76.3% 96.8% 77.2% 54.6% 44.4% 55.6% 27% 10%Vermont 94.6% 91.0% 103.0% 93.4% 65.6% 4.8% 95.2% 39% 18%Virginia 90.3% 88.2% 102.3% 80.8% 68.8% 44.6% 55.4% 35% 19%Washington 93.0% 92.3% 120.6% 61.9% 54.9% 66.3% 33.7% 33% 13%West Virginia 84.6% 76.6% 124.3% 76.9% 50.8% 40.5% 59.5% 36% 20%Wisconsin 84.7% 66.6% 104.3% 105.1% 54.2% 39.2% 60.8% 46% 21%Wyoming 143.2% 117.1% 212.8% 122.8% 0.0% 51.8% 48.2% 43% 13%United States 72.0% 65.5% 92.5% 72.3% 65.9% 44.8% 55.2% 38% 15%SOURCES: Medicaid to Medicare Physician Fee Index - Stephen Zuckerman, Aimee Williams, and Karen Stockley, "Medicaid Physician Fees Grew By More Than 15 Percent From 2003 to 2008, Narrowing Gap With Medicare Physician Payment Rates," Health Affairs, April 2009; available at http://www.kff.org/medicaid/kcmu042809oth.cfm. Managed Care Enrollment data - Gifford, K. et al. A Profile of Medicaid Managed Care Programs in 2010: Findings from a 50-State Survey. Kaiser Commission on Medicaid and the Uninsured, September 2011. http://www.kff.org/medicaid/8220.cfm. Long-Term Care Spending by Setting - Urban Institute estimates based on data from CMS (Form 64) (as of 12/21/11). http://www.statehealthfacts.org/comparetable.jsp?ind=180&cat=4. Duals Spending and Enrollment figures: Kaiser Commission on Medicaid and the Uninsured and Urban Institute estimates based on data from FY 2009 MSIS and CMS-64 reports, 2012. 2008 MSIS was used for Pennsylvania, Utah, and Wisconsin, because 2009 data was unavailable.
Table 4b: Medicaid Delivery Systems
StateMedicaid to Medicare Physician Fee Index1, 2008 % of Medicaid
Enrollees in Managed Care2
Long-Term Care Spending by Setting3
Dual Eligible Beneficiaires, FFY 2009
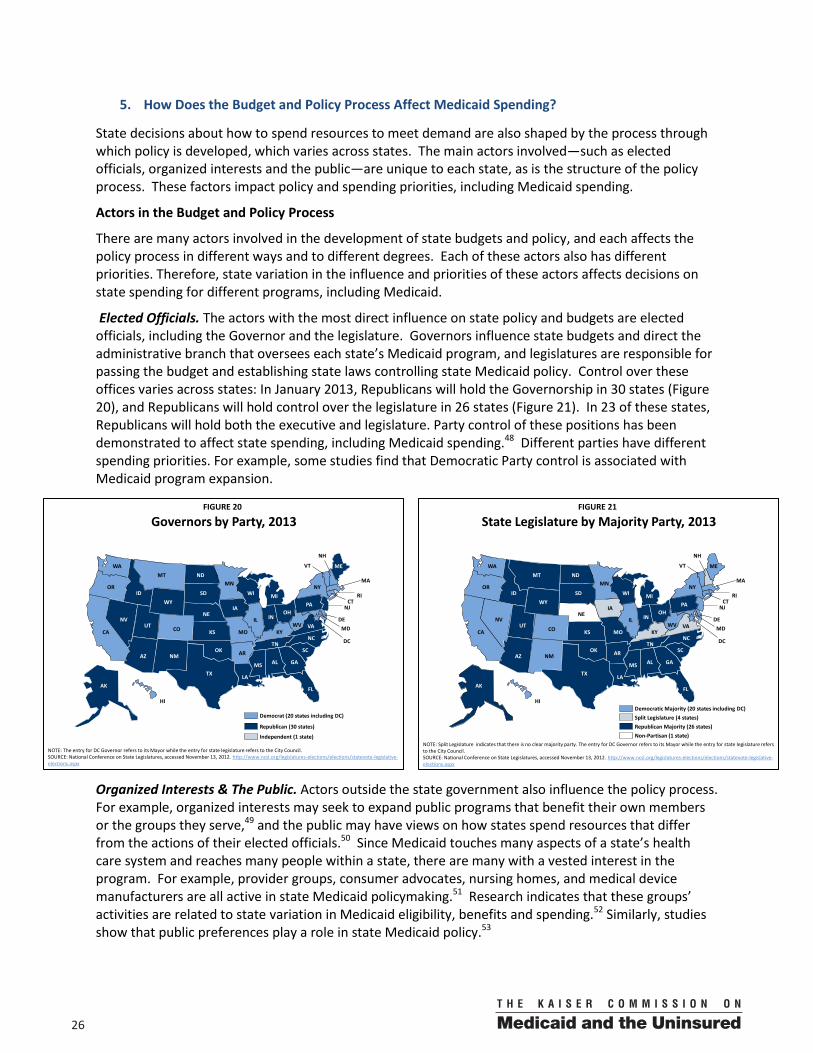
0026
5. How Does the Budget and Policy Process Affect Medicaid Spending?
State decisions about how to spend resources to meet demand are also shaped by the process through which policy is developed, which varies across states. The main actors involved—such as elected officials, organized interests and the public—are unique to each state, as is the structure of the policy process. These factors impact policy and spending priorities, including Medicaid spending.
Actors in the Budget and Policy Process
There are many actors involved in the development of state budgets and policy, and each affects the policy process in different ways and to different degrees. Each of these actors also has different priorities. Therefore, state variation in the influence and priorities of these actors affects decisions on state spending for different programs, including Medicaid.
Elected Officials. The actors with the most direct influence on state policy and budgets are elected officials, including the Governor and the legislature. Governors influence state budgets and direct the administrative branch that oversees each state’s Medicaid program, and legislatures are responsible for passing the budget and establishing state laws controlling state Medicaid policy. Control over these offices varies across states: In January 2013, Republicans will hold the Governorship in 30 states (Figure 20), and Republicans will hold control over the legislature in 26 states (Figure 21). In 23 of these states, Republicans will hold both the executive and legislature. Party control of these positions has been demonstrated to affect state spending, including Medicaid spending.48 Different parties have different spending priorities. For example, some studies find that Democratic Party control is associated with Medicaid program expansion.
Organized Interests & The Public. Actors outside the state government also influence the policy process. For example, organized interests may seek to expand public programs that benefit their own members or the groups they serve,49 and the public may have views on how states spend resources that differ from the actions of their elected officials.50 Since Medicaid touches many aspects of a state’s health care system and reaches many people within a state, there are many with a vested interest in the program. For example, provider groups, consumer advocates, nursing homes, and medical device manufacturers are all active in state Medicaid policymaking.51 Research indicates that these groups’ activities are related to state variation in Medicaid eligibility, benefits and spending.52 Similarly, studies show that public preferences play a role in state Medicaid policy.53
FIGURE 20
Governors by Party, 2013
AZ AR
MS
LA
WA
MNND
WYID
UT CO
OR
NV
CA
MT
IA
WI MI
NE
SD
ME
MOKS
OHIN
NY
IL
KY
TNNC
NH
MA
VT
PA
VAWV
CTNJ
DEMD
RI
HI
DC
AK
SCNM
OK
GA
TX
IL
FL
AL
NOTE: The entry for DC Governor refers to its Mayor while the entry for state legislature refers to the City Council.SOURCE: National Conference on State Legislatures, accessed November 13, 2012. http://www.ncsl.org/legislatures-elections/elections/statevote-legislative-elections.aspx
Democrat (20 states including DC)
Republican (30 states)
Independent (1 state)
FIGURE 21
State Legislature by Majority Party, 2013
AZ AR
MS
LA
WA
MNND
WYID
UT CO
OR
NV
CA
MT
IA
WI MI
NE
SD
ME
MOKS
OHIN
NY
IL
KY
TNNC
NH
MA
VT
PA
VAWV
CTNJ
DEMD
RI
HI
DC
AK
SCNM
OK
GA
TX
IL
FL
AL
NOTE: Split Legislature indicates that there is no clear majority party. The entry for DC Governor refers to its Mayor while the entry for state legislature refers to the City Council.SOURCE: National Conference on State Legislatures, accessed November 13, 2012. http://www.ncsl.org/legislatures-elections/elections/statevote-legislative-elections.aspx
Split Legislature (4 states)Democratic Majority (20 states including DC)
Republican Majority (26 states)Non-Partisan (1 state)
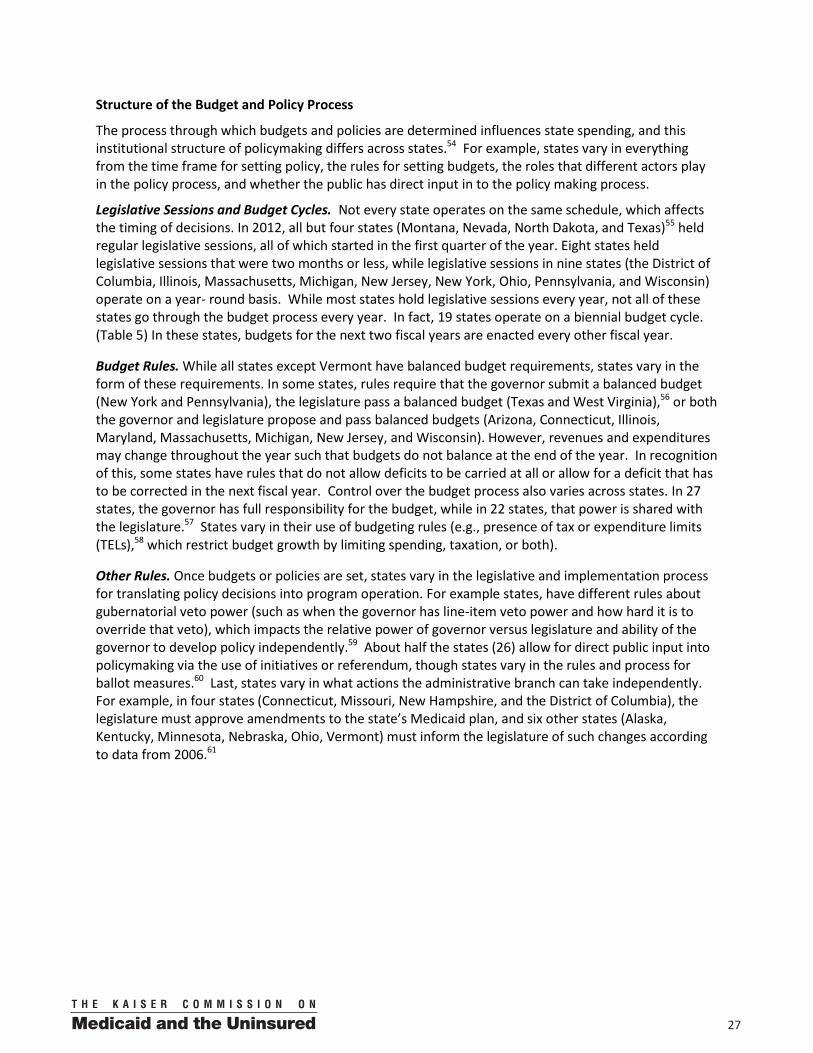
00 27
Structure of the Budget and Policy Process
The process through which budgets and policies are determined influences state spending, and this institutional structure of policymaking differs across states.54 For example, states vary in everything from the time frame for setting policy, the rules for setting budgets, the roles that different actors play in the policy process, and whether the public has direct input in to the policy making process.
Legislative Sessions and Budget Cycles. Not every state operates on the same schedule, which affects the timing of decisions. In 2012, all but four states (Montana, Nevada, North Dakota, and Texas)55 held regular legislative sessions, all of which started in the first quarter of the year. Eight states held legislative sessions that were two months or less, while legislative sessions in nine states (the District of Columbia, Illinois, Massachusetts, Michigan, New Jersey, New York, Ohio, Pennsylvania, and Wisconsin) operate on a year- round basis. While most states hold legislative sessions every year, not all of these states go through the budget process every year. In fact, 19 states operate on a biennial budget cycle. (Table 5) In these states, budgets for the next two fiscal years are enacted every other fiscal year.
Budget Rules. While all states except Vermont have balanced budget requirements, states vary in the form of these requirements. In some states, rules require that the governor submit a balanced budget (New York and Pennsylvania), the legislature pass a balanced budget (Texas and West Virginia),56 or both the governor and legislature propose and pass balanced budgets (Arizona, Connecticut, Illinois, Maryland, Massachusetts, Michigan, New Jersey, and Wisconsin). However, revenues and expenditures may change throughout the year such that budgets do not balance at the end of the year. In recognition of this, some states have rules that do not allow deficits to be carried at all or allow for a deficit that has to be corrected in the next fiscal year. Control over the budget process also varies across states. In 27 states, the governor has full responsibility for the budget, while in 22 states, that power is shared with the legislature.57 States vary in their use of budgeting rules (e.g., presence of tax or expenditure limits (TELs),58 which restrict budget growth by limiting spending, taxation, or both).
Other Rules. Once budgets or policies are set, states vary in the legislative and implementation process for translating policy decisions into program operation. For example states, have different rules about gubernatorial veto power (such as when the governor has line-item veto power and how hard it is to override that veto), which impacts the relative power of governor versus legislature and ability of the governor to develop policy independently.59 About half the states (26) allow for direct public input into policymaking via the use of initiatives or referendum, though states vary in the rules and process for ballot measures.60 Last, states vary in what actions the administrative branch can take independently. For example, in four states (Connecticut, Missouri, New Hampshire, and the District of Columbia), the legislature must approve amendments to the state’s Medicaid plan, and six other states (Alaska, Kentucky, Minnesota, Nebraska, Ohio, Vermont) must inform the legislature of such changes according to data from 2006.61
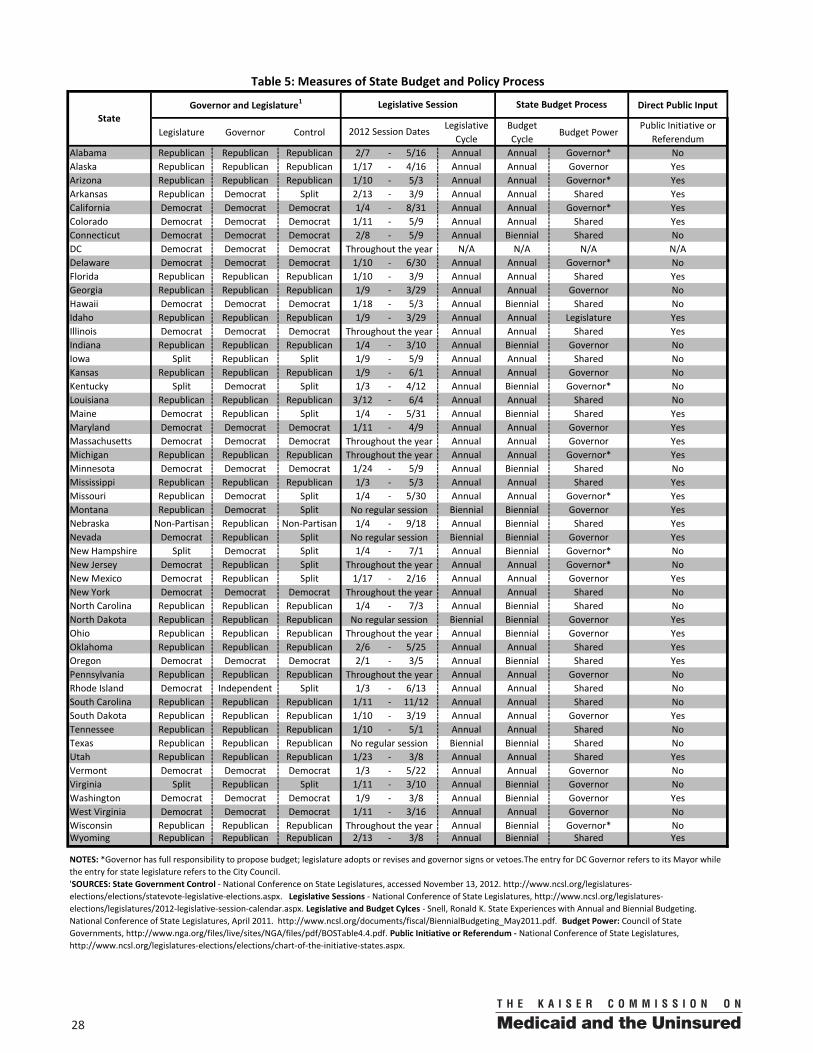
0028
Direct Public Input
Legislature Governor ControlLegislative
CycleBudget Cycle
Budget PowerPublic Initiative or
ReferendumAlabama Republican Republican Republican 2/7 - 5/16 Annual Annual Governor* NoAlaska Republican Republican Republican 1/17 - 4/16 Annual Annual Governor YesArizona Republican Republican Republican 1/10 - 5/3 Annual Annual Governor* YesArkansas Republican Democrat Split 2/13 - 3/9 Annual Annual Shared YesCalifornia Democrat Democrat Democrat 1/4 - 8/31 Annual Annual Governor* YesColorado Democrat Democrat Democrat 1/11 - 5/9 Annual Annual Shared YesConnecticut Democrat Democrat Democrat 2/8 - 5/9 Annual Biennial Shared NoDC Democrat Democrat Democrat N/A N/A N/A N/ADelaware Democrat Democrat Democrat 1/10 - 6/30 Annual Annual Governor* NoFlorida Republican Republican Republican 1/10 - 3/9 Annual Annual Shared YesGeorgia Republican Republican Republican 1/9 - 3/29 Annual Annual Governor NoHawaii Democrat Democrat Democrat 1/18 - 5/3 Annual Biennial Shared NoIdaho Republican Republican Republican 1/9 - 3/29 Annual Annual Legislature YesIllinois Democrat Democrat Democrat Annual Annual Shared YesIndiana Republican Republican Republican 1/4 - 3/10 Annual Biennial Governor NoIowa Split Republican Split 1/9 - 5/9 Annual Annual Shared NoKansas Republican Republican Republican 1/9 - 6/1 Annual Annual Governor NoKentucky Split Democrat Split 1/3 - 4/12 Annual Biennial Governor* NoLouisiana Republican Republican Republican 3/12 - 6/4 Annual Annual Shared NoMaine Democrat Republican Split 1/4 - 5/31 Annual Biennial Shared YesMaryland Democrat Democrat Democrat 1/11 - 4/9 Annual Annual Governor YesMassachusetts Democrat Democrat Democrat Annual Annual Governor YesMichigan Republican Republican Republican Annual Annual Governor* YesMinnesota Democrat Democrat Democrat 1/24 - 5/9 Annual Biennial Shared NoMississippi Republican Republican Republican 1/3 - 5/3 Annual Annual Shared YesMissouri Republican Democrat Split 1/4 - 5/30 Annual Annual Governor* YesMontana Republican Democrat Split Biennial Biennial Governor YesNebraska Non-Partisan Republican Non-Partisan 1/4 - 9/18 Annual Biennial Shared YesNevada Democrat Republican Split Biennial Biennial Governor YesNew Hampshire Split Democrat Split 1/4 - 7/1 Annual Biennial Governor* NoNew Jersey Democrat Republican Split Annual Annual Governor* NoNew Mexico Democrat Republican Split 1/17 - 2/16 Annual Annual Governor YesNew York Democrat Democrat Democrat Annual Annual Shared NoNorth Carolina Republican Republican Republican 1/4 - 7/3 Annual Biennial Shared NoNorth Dakota Republican Republican Republican Biennial Biennial Governor YesOhio Republican Republican Republican Annual Biennial Governor YesOklahoma Republican Republican Republican 2/6 - 5/25 Annual Annual Shared YesOregon Democrat Democrat Democrat 2/1 - 3/5 Annual Biennial Shared YesPennsylvania Republican Republican Republican Annual Annual Governor NoRhode Island Democrat Independent Split 1/3 - 6/13 Annual Annual Shared NoSouth Carolina Republican Republican Republican 1/11 - 11/12 Annual Annual Shared NoSouth Dakota Republican Republican Republican 1/10 - 3/19 Annual Annual Governor YesTennessee Republican Republican Republican 1/10 - 5/1 Annual Annual Shared NoTexas Republican Republican Republican Biennial Biennial Shared NoUtah Republican Republican Republican 1/23 - 3/8 Annual Annual Shared YesVermont Democrat Democrat Democrat 1/3 - 5/22 Annual Annual Governor NoVirginia Split Republican Split 1/11 - 3/10 Annual Biennial Governor NoWashington Democrat Democrat Democrat 1/9 - 3/8 Annual Biennial Governor YesWest Virginia Democrat Democrat Democrat 1/11 - 3/16 Annual Annual Governor NoWisconsin Republican Republican Republican Annual Biennial Governor* NoWyoming Republican Republican Republican 2/13 - 3/8 Annual Biennial Shared Yes
Table 5: Measures of State Budget and Policy Process
StateGovernor and Legislature1 Legislative Session
2012 Session Dates
State Budget Process
NOTES: *Governor has full responsibility to propose budget; legislature adopts or revises and governor signs or vetoes.The entry for DC Governor refers to its Mayor while the entry for state legislature refers to the City Council.'SOURCES: State Government Control - National Conference on State Legislatures, accessed November 13, 2012. http://www.ncsl.org/legislatures-elections/elections/statevote-legislative-elections.aspx. Legislative Sessions - National Conference of State Legislatures, http://www.ncsl.org/legislatures-elections/legislatures/2012-legislative-session-calendar.aspx. Legislative and Budget Cylces - Snell, Ronald K. State Experiences with Annual and Biennial Budgeting. National Conference of State Legislatures, April 2011. http://www.ncsl.org/documents/fiscal/BiennialBudgeting_May2011.pdf. Budget Power: Council of State Governments, http://www.nga.org/files/live/sites/NGA/files/pdf/BOSTable4.4.pdf. Public Initiative or Referendum - National Conference of State Legislatures, http://www.ncsl.org/legislatures-elections/elections/chart-of-the-initiative-states.aspx.
Throughout the year
Throughout the year
Throughout the yearThroughout the year
No regular session
No regular session
Throughout the year
No regular session
Throughout the year
Throughout the year
No regular session
Throughout the year
Throughout the year
00 29
Discussion / Conclusions
Medicaid was designed as a state and federal partnership. The program is largely administered by states within broad federal rules. States have flexibility to make policy choices related to eligibility, benefits and how care is delivered and paid for. Financing for Medicaid is shared by states and the federal government and states have a guarantee to federal matching dollars with no set limit. States use Medicaid to help fill in the gaps of private insurance (by providing coverage to those left out of the private market) and Medicare (by helping beneficiaries to pay for Medicare cost sharing and providing access long-term care services). The answer to why Medicaid spending varies across states is not simple. A complex array of factors that involve an understanding of states’ abilities to raise revenue and collect revenue, residents’ needs for public services as well as health and long term care, Medicaid policy choices, and the underlying health care market in a state all affect Medicaid spending. In addition, the different actors and structure of the policy process also play a role in setting taxing and spending priorities in states. States can adjust policy levers for some Medicaid spending, such as decisions to expand benefits beyond the core federal requirements. Other factors that determine the need Medicaid services—such as poverty levels—are harder to adjust. Medicaid fits into a complicated budget puzzle. Budgets manifest an endless number of policy choices and trade-offs. Revenue and spending patterns are also largely affected by previous decisions because new budgets largely build on current budgets. Decisions about Medicaid spending are complex because Medicaid is a budget item and a revenue item in state budgets. Looking ahead, there are four key issues that will have significant implications for state budgets and Medicaid. Economic Downturns and Recovery. The fiscal outlook for states has started to improve. Through the second quarter of CY 2012, total state tax collections (nationwide) had grown for ten consecutive quarters. However, revenues remain below nominal levels four years earlier.62 While still high, the national unemployment rate fell to below 8 percent (7.8 percent) in September for the first time since January 2009 and remained below 8.0 percent in October (7.9 percent). For SFY 2013, 31 states have collectively addressed or have projected shortfalls of $55 billion, lower than FY 2012 but still high by historic standards.63 Structural Budget Issues. As states continue to recover from the most recent recession, they face a number of other pressures. For example, state pension and retiree benefit liabilities (including retiree health care) continue to grow as states are contributing less and less. A recent study conducted by the Pew Center for States found that states had a funding shortfall for long-term pension obligations of at least $1.26 trillion.64 Federal Deficit Reduction Efforts. There has been intense focus on federal deficit reduction. These debates are likely to intensify this fall as part of the election and as it gets closer to the implementation of automatic budget cuts in January 2013 that are tied to the Budget Control Act passed in August of 2011. Medicaid is likely to be part of any federal deficit reduction discussions. Implementation of the ACA. Under the Supreme Court ruling, states will decide whether or not to implement the Medicaid expansion. State policy makers will weigh the ideological, political, fiscal and health consequences of their decisions related to Medicaid. The federal government will pay the vast majority of the costs of the ACA Medicaid expansion, so states that do not implement the expansion will forgo significant amounts for federal funds. Looking ahead, the results of elections in November, the trajectory of the economy, the outcome of the federal deficit reduction debate, and state decisions about the ACA Medicaid expansion will have important consequences for the Medicaid program, as well as the people the program serves, providers and state budgets.
0030
Notes for Tables Summary Table – How Does Medicaid Spending Vary Across States?
1. Medicaid spending and enrollment figures - Spending figures include both state and federal payments to Medicaid. Per enrollee figures represent the average (mean) level of payments across all Medicaid enrollees and do not include disproportionate share hospital payments (DSH). Some enrollees are only eligible for a limited set of benefits. A small fraction of elderly and disabled enrollees in every state qualify only for assistance with their Medicare premiums and coinsurance.
2. State Residents - Population estimates are as of July 1, 2009.
3. Multiplier refers to the amount in federal dollars a state received for every $1 of state spending on Medicaid.
Table 1a – State Tax Bases and Collections
1. Indices for Personal Income Per Capita and TTR Per Capita are calculated where the US figures = 1.00.
2. Tax Collections Index uses the total tax collections across states divided by US population as the base (i.e. =1.00)
Table 1b – State Fiscal Health and the Impact of the Recession
1. Change in Tax Revenues - This data source, the Census Bureau’s Survey of State Tax Revenue, does not include DC; therefore, DC is reported as N/A.
2. Change in Medicaid spending - Figures do not include administrative costs, accounting adjustments, or the U.S. Territories and does not include federal spending on the program.
3. Change in State Revenues - measures the change in general revenues; it excludes intergovernmental revenues. This data source, the Census Bureau’s Survey of State Government Finances, does not include DC. DC instead is included in the Census Bureau’s Survey of State and Local Government Finances, the most current update is SFY2009; therefore, DC is reported as N/A.
Table 2a – Indicators of Need for Public Services
1. Recent Peak unemployment rate refers to highest monthly unemployment rates since the start of the recession in December 2007.
2. The national unemployment rate reported for the US is for October 2012; state unemployment rates are for September 2012 (the most current data available on a state by state basis at the time of publication).
Table 2b – Indicators of Need for Health Services
1. Health Coverage percentages do not include "Other Public Coverage," which includes those covered through the military or VA in federally-funded programs (i.e. TRICARE) as well as some non-elderly Medicare enrollees. Private includes both ESI and individual coverage.
2. Adults reporting disability - Data based on analysis of the American Community Survey (ACS) by Cornell University Rehabilitation Research and Training Center on Disability Demographics and Statistics (StatsRRTC). Data apply to non-institutionalized men and women, aged 21 to 64 years. The ACS definition of disability is based on six questions related to Hearing Disability, Visual Disability, Cognitive Disability, Ambulatory Disability, Self-care Disability, and Independent Living Disability.
3. Obesity for children - Overweight or Obese: BMI at or above the 85th percentile of the CDC growth charts for age and gender.
4. Adult Obesity - U.S. total includes territories. Data represent adults who reported having a body mass index (BMI) greater than or equal to 25.0 kg/meters squared.
5. U.S. totals include territories. Data represent adults who report ever being told by a doctor that they have diabetes. Percentages are weighted to reflect population characteristics.
00 31
6. Cancer - These figures are age-adjusted to the 2000 U.S. standard population. Data are from selected statewide and metropolitan area cancer registries that meet the data quality criteria for all invasive cancer sites combined. Excludes basal and squamous cell carcinomas of the skin except when these occur on the skin of the genital organs, and in situ cancers except urinary bladder.
7. Poor Mental Health is defined here as the percent of adults with frequent mental distress (FMD). The BRFSS interviews include the following general mental health question: "Now thinking about your mental health, which includes stress, depression and problems with emotions, for how many days during the past 30 days was your mental health not good?" Persons who reported that their mental health was not good for greater than or equal to 14 of the preceding 30 days were defined as having FMD. This 14-day minimum period was selected because a similar period is often used by clinicians and clinical researchers as a marker for clinical depression and anxiety disorders. “Self-reported frequent mental distress among adults---United States, 1993--1996.” CDC. MMWR 1998; 47:326--31. http://www.cdc.gov/mmwr/preview/mmwrhtml/00052469.htm. Percentages are weighted to reflect population characteristics.
Table 3a – Health Care Markets: Costs
1. Health Care Expenditures measure spending for all privately and publicly funded personal health care services and products (hospital care, physician services, nursing home care, prescription drugs, etc.) by state of residence. Hospital spending is included and reflects the total net revenue (gross charges less contractual adjustments, bad debts, and charity care). Costs such as insurance program administration, research, and construction expenses are not included in this total. For more information on definitions, sources, and methods, please see http://www.cms.gov/NationalHealthExpendData/downloads/dsm-09.pdf.
2. Data reflect Medicare spending on personal health care services and products (hospital care, physician services, nursing home care, prescription drugs, etc.) by state of residence. State of residence estimates account for the flow of individuals between states in order to consume health care services and present health spending based on where individuals reside rather than where they receive care. For more information on definitions, sources, and methods, please see http://www.cms.gov/NationalHealthExpendData/downloads/dsm-09.pdf.
Table 3b – Health Care Markets: Access and Supply of Providers and Health Facilities
1. % in Primary Care HPSA - % of population residing in primary care shortage area. HPSAs can be designated based on geographic areas, population groups, or facilities. For a geographic region to be deemed a primary care HPSA population to full-time equivalent primary care provider ratio must exceed 3,500:1 (3,000:1 in areas with unusually high need). For a population group to be deemed a primary care HPSA there must exist barriers to accessing care, that may be socioeconomic, cultural or linguistic, or that may result from a dearth of local providers who are willing to accept patients from such backgrounds or who refuse to accept Medicaid reimbursement. Native American Indian tribes are universally recognized as population group HPSAs. For a health care facility to be deemed a primary care HPSA, it must be a public or non-profit health care delivery site and must have inadequate resources to fulfill the primary care needs of the area or population group. The percentages reflected here reflect resident living in HPSAs under any of these definitions (geographic region, population group, or health care facility.)
2. U.S. total includes territories. Data represent adults who reported that there was a time in the past 12 months when they needed to see a doctor but could not because of cost. Figures are weighted to reflect population characteristics.
3. Data are for calendar year 2010. The federally-funded Federally-Qualified Health Centers (FQHCs) meet federal health center grant requirements and are required to report administrative, clinical and other information to the federal Bureau of Primary Health Care. Other health centers known as "FQHC Look-Alikes" are not included here because they do not receive federal health center grants and do not report to the Bureau of Primary Health Care. The data provided here consequently underreport the services provided by FQHCs. There are approximately 100 FQHC Look-Alikes across the United States. US total includes territories.
0032
4. Data include staffed beds for community hospitals, which represent 85% of all hospitals. Federal hospitals, long term care hospitals, psychiatric hospitals, institutions for the mentally retarded, and alcoholism and other chemical dependency hospitals are not included.
5. Data are for calendar years. The data show the number of certified nursing facility beds in nursing facilities that were surveyed during the calendar year and exclude uncertified beds. There were 1,663,445 nursing facility beds surveyed in 2010. Authors of this brief then applied population figures for each state to determine the number per 1000 residents.
6. Includes active doctors of medicine (MDs) and active doctors of osteopathy (DOs). Federal and nonfederal physicians are included. Figures exclude physicians in medical teaching, administration, research, and other non-patient care activities; figures do include residents.
Table 4a - Medicaid and CHIP Eligibility Levels, Enrollment, and Benefits
1. The United States figures for Eligibility Levels are the median eligibility levels.
2. Data as of January 1, 2012, unless noted otherwise. States can use their Title XXI (CHIP) funds to expand Medicaid (Medicaid Expansion), cover children through a separate program (Separate CHIP), or combine the two approaches (Combination). The income eligibility levels noted may refer to gross or net income depending on the state and reflect the highest income eligibility level in the state using Medicaid/CHIP funds. Additionally:
Arizona instituted an enrollment freeze in its CHIP program, KidsCare, on December 21, 2009. The program is closed to new applicants.
Arkansas, Minnesota, Oklahoma, and Rhode Island have separate CHIP programs solely for their coverage of pregnant women using the unborn child option.
In California and North Dakota, Title XXI funding was used to eliminate the asset test. Connecticut, Florida, Maine, Minnesota, New Hampshire, New Jersey, New York, North Carolina, Oregon,
Pennsylvania, Tennessee, and Wisconsin allow families with incomes above the levels shown buy into Medicaid/CHIP. Illinois and Ohio eliminated their buy-in programs in 2011. For details, see Table 2 in the data source.
Illinois is awaiting approval for federal funding of its state-funded coverage between 200% and 300% of the FPL.
Kansas covers children in a separate CHIP program at 238% FPL in 2011, approximately 250% of the 2008 FPL.
In Massachusetts, children at any income are eligible for more limited state-subsidized coverage under the state's Children's Medical Security Plan; premiums are charged on a sliding scale based on income.
In Michigan, coverage for children ages 16 to 18, between 100% and 150% of the FPL is funded through Title XXI.
Minnesota covers infants in Medicaid with family income up to 280% of the FPL. Oregon covers children through 300% of the FPL. In Tennessee, Title XXI funds are used for two programs, TennCare Standard and CoverKids (a separate
CHIP program). TennCare Standard provides Medicaid coverage to uninsured children who lose eligibility under TennCare (Medicaid), have no access to insurance, and have family income below 200% of the FPL or are medically eligible.
West Virginia increased eligibility from 250% to 300% of the FPL as of July 1, 2011.
3. The levels reported here take earning disregards, when applicable, into account when determining income thresholds. For parents, computations are based on a family of three with one earner; for other adults, computations are based on an individual. In some cases, earnings disregards may be time limited and only applied for the first few months of coverage; in these cases, eligibility limits for most enrollees would be lower than the levels that appear in this table. States may use additional disregards (such as child care expenses) in determining eligibility that are not accounted for here. In some states, the income eligibility guidelines vary by region; in this situation, the income guideline in the most populous region is used. Additionally:
00 33
In Arkansas, adults up to 200% FPL are eligible for more limited subsidized coverage under the ARHealthNetworks waiver program; individuals must have income below the eligibility threshold and work for a qualifying, participating employer. In 2011, the state opened up the program to those who are also self-employed.
In California, more limited coverage for parents and childless adults was provided under an expansion that was implemented following enactment of the Affordable Care Act.
California covers adults through two waiver programs: the Medicaid Coverage Expansion (MCE) up to 133% FPL and the Health Care Coverage Initiative (HCCI) between 133% and 200% FPL. While both coverage options offer more limited benefits than full Medicaid, the MCE benefit package is more comprehensive. Ten counties began program operations for their coverage programs on July 1, 2011, and subsequent counties are being added on a phased in basis.
Connecticut also has a fully state-funded program called Charter Oak. Hawaii covers adults up to 100% FPL under its QUEST Medicaid managed care waiver program.
Enrollment remains open for individuals receiving 1931 Medicaid coverage or General Assistance or those below old AFDC standards. Enrollment is closed for other adults. Eligibility for other more limited waiver coverage was reduced to 133% FPL effective July 2012.
Idaho provides premium assistance to adults up to 185% FPL under a waiver; individuals must have income below the eligibility threshold and work for a qualified small employer.
Illinois reduced parent eligibility to 133% FPL effective July 2012. In Indiana, adults up to 200% FPL are eligible for more limited coverage under the Healthy Indiana waiver
program. Enrollment is closed for childless adults. During 2011, the state opened enrollment to add members up to the cap.
In Iowa, adults up to 250% FPL are eligible for more limited coverage under the IowaCare waiver program. In Maine, childless adults up to 100% FPL are eligible for more limited coverage under the MaineCare
waiver program; enrollment is closed. Adults up to 300% FPL also are eligible for more limited subsidized coverage under the fully state-funded DirigoChoice program.
In Maryland, childless adults are eligible for primary care services under the Primary Adult Care waiver program.
In Massachusetts, childless adults who are long-term unemployed or a client of the Department of Mental Health with income below 100% FPL can receive more limited benefits under the MassHealth waiver program through MassHealth Basic or Essential. Additionally, adults up to 300% FPL are eligible for more limited subsidized coverage under the Commonwealth Care waiver program.
In Michigan, childless adults are eligible for more limited coverage under the Adult Benefit Waiver program; enrollment is closed.
In March of 2011, Minnesota adopted the ACA option for adults up to 75% FPL and expanded more limited MinnesotaCare waiver coverage to childless adults above 75% and up to 250% FPL effective August 1, 2011. Childless adults were previously covered in a fully state-funded program, which the state has continued. Parents up to 275% FPL are eligible for coverage under the MinnesotaCare waiver program; parents above 215% FPL receive more limited coverage.
In Missouri, only adults living in the St. Louis area are eligible for the more limited waiver coverage. Nevada eliminated its premium assistance program (Check Up Plus) when its waiver expired in November
2011. In New Jersey, parents up to 200% FPL are covered under the FamilyCare waiver program. Waiver
enrollment closed in 2010 for parents above 133% FPL. In April 2011, New Jersey obtained a waiver to expand more limited coverage to childless adults who had previously been covered through the state’s general assistance program.
In New Mexico, adults up to 200% FPL are eligible for more limited subsidized coverage under the State Coverage Insurance waiver program. Individuals must have income below the eligibility threshold and work for a participating employer; if they do not work for a participating employer, they can obtain coverage by paying both the employer and employee share of premium costs. Enrollment is closed.
0034
In New York, childless adults up to 78% FPL are eligible for the Medicaid (Home Relief) waiver program and parents up to 150% FPL and childless adults up to 100% FPL are eligible for the Family Health Plus waiver program.
In Oklahoma, adults up to 200% FPL are eligible for more limited subsidized coverage under the Insure Oklahoma waiver program. Individuals must have income below eligibility threshold and also work for a small employer, be self-employed, be unemployed and seeking work, be working disabled, be a full-time college student, or be the spouse of a qualified worker.
In Oregon, adults up to 100% FPL are eligible for more limited coverage under the OHP Standard waiver program; enrollment in OHP Standard is closed. The state provides premium assistance to adults up to 201% FPL under its Family Health Insurance Assistance Program waiver program. FHIAP is open for both individual and employer sponsored insurance, however, the state is only enrolling individuals from the reservation list.
In Rhode Island, parents up to 175% FPL are covered under the RIteCare and RIteShare waiver programs. In Utah, adults up to 150% FPL are eligible for coverage of primary care services under the Primary Care
Network waiver program; enrollment is closed. The state also provides premium assistance for employer-sponsored coverage to working adults up to 150% FPL under the Utah Premium Partnership Health Insurance waiver program.
In Vermont, 1931 coverage is available for parents up to 77% FPL in urban areas and 73% FPL in rural areas; parents up to 185% FPL and childless adults up to 150% FPL are eligible for the Vermont Health Access Plan waiver program. Additionally, the state offers more limited subsidized coverage to adults up to 300% FPL under its Catamount Health waiver program.
Washington converted its state-funded program (Basic Health) to waiver coverage. The state-funded Basic Health program covered adults up to 200% FPL; coverage under the section 1115 waiver covers adults up to 133% FPL.
In Wisconsin, parents up to 200% FPL are eligible for the BadgerCare Plus waiver program. Childless adults up to 200% FPL are eligible for more limited coverage under the BadgerCare Plus Core Plan waiver program. Enrollment for childless adults is closed.
4. Data as of January 1, 2012, unless noted otherwise. The following states received approval through a State Plan Amendment to adopt the option to cover immigrant pregnant women who have been lawfully residing in the U.S. for less than five years, otherwise known as the ICHIA option: CA, CO, CT, DE, DC, HI, ME, MD, MA, MN, NE, NJ, NM, NY, NC, VT, WA, WI. Vermont received CMS approval of its SPA to provide coverage to lawfully-residing pregnant women without the five-year wait and Pennsylvania has submitted a state plan amendment, but is awaiting CMS approval. The following states have the unborn child option, which permits states to consider the fetus a "targeted low-income child" for CHIP coverage: AR, CA, IL, LA, MA, MI, MN, OK, OR, RI, TN, TX, WA, WI. Income eligibility levels listed are either for “regular” Medicaid (Title XIX) where states receive “regular” Medicaid matching payments. Additionally:
In Colorado, lawfully-residing immigrant pregnant women are covered in Medicaid only. DC, New Jersey, and New York cover all immigrant pregnant women regardless of immigration status. In Hawaii, pregnant women whose income exceeds 185% FPL can enroll in Quest-ACE by paying
premiums. Coverage goes up to 200% of the FPL, but provides limited benefits. Nevada's waiver covering pregnant women to 185% FPL expired November 30, 2011. The state chose not
to renew the waiver and stopped taking applications as of June 1, 2011. Nevada continued coverage for any woman enrolled in the program through the 60-day post-partum period.
In New York, women with income between 100% and 200% FPL receive less comprehensive benefits.
5. % of Residents enrolled in Medicaid refers to the percentage of the state's population enrolled in Medicaid. For all topics based on the CPS on statehealthfacts.org, the grouping used for analysis is the health insurance unit (HIU), which groups individuals according to their insurance eligibility, rather than by relatedness or household. For more details, see "Notes to Topics Based on the Current Population Survey (CPS)" at http://www.statehealthfacts.kff.org/methodology. For current Medicaid and Medicare enrollment figures, please refer to the Medicaid & CHIP and "Medicare" sections, respectively, which report enrollment data from the
00 35
Centers for Medicare and Medicaid Services (CMS). CHIP and individuals eligible for both Medicare and Medicaid (dual eligibles) are included in Medicaid.
6. Enrollees are presumed to be unduplicated (each person is only counted once). The enrollment estimates differ slightly from similar estimates posted by CMS because adjustments to the data have been made for several states where some individuals appeared to be categorized incorrectly. Our most common adjustment was to shift people age 65 and older to the aged category who were previously categorized as disabled, and our second most common adjustment was to shift individuals under age 65 out of the aged category and into the disabled category. Some enrollees are only eligible for a limited set of benefits. A small fraction of elderly and disabled enrollees in every state qualify only for assistance with their Medicare premiums and coinsurance.
7. See methods for more information on the analysis and its limitations. http://www.kff.org/medicaid/upload/8239.pdf.
Table 4b - Medicaid Delivery Systems
1. The Medicaid-to-Medicare fee index measures each state's physician fees relative to Medicare fees in each state. The Medicaid data are based on surveys sent by the Urban Institute to the forty-nine states and the District of Columbia that have a fee-for-service (FFS) component in their Medicaid programs (only Tennessee does not). These fees represent only those payments made under FFS Medicaid. Medicare fees were calculated by the Urban Institute using the 2008 Clinical Diagnostic Fee Schedule and the relative value units (RVUs), conversion factor, and geographic adjusters as published in the Federal Register. The Medicaid-to-Medicare fee index is a weighted sum of the ratios of each state's Medicaid fee for a given service to the Medicare fee, using 2000 expenditure weights.
2. Figures reported here include both MCO and PCCM enrollees as a percent of total Medicaid enrollment.
Comprehensive Medicaid Managed Care Plan: Defined in federal regulations as inpatient hospital services and any of the following services, or any three of the following services: (1) outpatient hospital services; (2) rural health clinic services; (3) FQHC services; (4) other laboratory and x-ray services; (5) nursing facility services; (6) early and periodic screening, diagnostic, and treatment (EPSDT) services; (7) family planning services; (8) physicians services, and (9) home health services. MCO: Managed Care Organization. States contract with MCOs to provide a comprehensive package of benefits to enrolled Medicaid beneficiaries, primarily on a capitation basis. Data are for both Medicaid-only MCOs and MCOs that include commercially insured members. PCCM: Primary Care Case Management. States contract with primary care providers who agree to provide case management services to Medicaid enrollees assigned to them.
Additional notes include:
Connecticut - Reflects February 2011 data. Delaware maintains a small "enhanced FFS" managed care program that was created to maintain client
choice when the state had only one MCO. Per approval of CMS, enrollment may be limited. PCCM enrollment reflects enrollment in this program but the state is not otherwise counted as having a PCCM program for purposes of this report.
Georgia - Reflects June 2010 data. Indiana - Reflects December 2010 data and includes Medicaid, CHIP and the Healthy Indiana Plan (1115
expansion). Maine - Reflects August 2010 data. Michigan - Total MCO enrollment includes PACE. PCCM counts reflect enrollment in the state's
Beneficiary Monitoring Program. The state does not have a formal PCCM program. Mississippi - Reflects January 2011 data. New Mexico - Reflects July 2010 data. Oregon - Enrollment includes OHP Plus and OHP Standard programs. Rhode Island - Totals include clients who are eligible for RIte Care but are enrolled in the state's employer-
sponsored insurance product, RIte Share. Texas - Reflects November 2010 data.
0036
Washington - PCCM enrollment accessed at http://hrsa.dshs.wa.gov/HealthyOptions/NewHO/Provider/HOEnrollmentdata.htm.
3. Long-Term Care Spending by Setting - Institutional Settings include ICF-IDs (formerly ICF-MRs), mental health facilities and nursing facilities. Community includes standard "Home Health Services", "Personal Care", "Targeted Case Management", "Hospice", "Home and Community-Based Care" for the functionally disabled elderly, and services provided under "Home and Community-Based" services waivers.
Table5b – Measures of State Budget and Policy Process
1. Nebraska is a non-partisan, unicameral legislature. Due to this fact, the state is classified as non-partisan in terms of party control rather than split. The source for this data – the National Council of State Legislatures – still had the race for Governor in Washington as undecided; however, news reports indicate that Rob McKenna conceded the election on November 9, 2012.
1 A Historical Review of How States Have Responded to the Availability of Federal Funds for Health Coverage. Kaiser Commission on Medicaid and the Uninsured, August 2012. http://www.kff.org/medicaid/8349.cfm. 2 Report of the State Budget Crisis Task Force. State Budget Crisis Task Force, July 2012. http://www.statebudgetcrisis.org/wpcms/wp-content/images/Report-of-the-State-Budget-Crisis-Task-Force-Full.pdf. 3 Medicaid Financing: An Overview of the Federal Medicaid Matching Rate (FMAP). Kaiser Commission on Medicaid and the Uninsured, September 2012. http://www.kff.org/medicaid/8352.cfm. 4 The data used in this section from the Census Bureau does not differentiate intergovernmental revenues by program. However, according to data from the National Association of State Budget Officers, over 40% of federal funds come through the Medicaid program. State Expenditure Report: Examining Fiscal 2009-2011 State Spending. National Association of State Budget Officers, December 2011. http://www.nasbo.org/sites/default/files/2010%20State%20Expenditure%20Report.pdf 5 States’ Revenue Estimating, Cracks in the Crystal Ball. The Nelson A Rockefeller Institute of Government and the Pew Center on the States, March 2011. http://www.rockinst.org/pdf/government_finance/2011-03-01-States_Revenue_Estimating_Report.pdf. 6 New Hampshire and Tennessee have individual income taxes on interest and dividend income only (5% and 6% respectively). “Individual State Income Tax Rates, 2000-2011.” Tax Policy Center, Urban Institute and Brookings Institution, March 28, 2011. Accessed June 26, 2012. http://taxpolicycenter.org/taxfacts/displayafact.cfm?Docid=406. 7 State Expenditure Report: Examining Fiscal 2009-2011 State Spending. National Association of State Budget Officers, December 2011. http://www.nasbo.org/sites/default/files/2010%20State%20Expenditure%20Report.pdf. 8 State Expenditure Report: Examining Fiscal 2009-2011 State Spending. National Association of State Budget Officers, December 2011. http://www.nasbo.org/sites/default/files/2010%20State%20Expenditure%20Report.pdf. 9 Gordon, Tracy. Update: State Budgets in Recession and Recovery. Kaiser Commission on Medicaid and the Uninsured, October 2011. 10 There have been some fluctuations in recent years due to the funding provided to states as part of the American Recovery and Reinvestment Act of 2009. The largest portion of this financial assistance to states came in the form of an enhanced Medicaid matching rate, which was enacted originally from October 2008 through December 2010. The enhanced matching rate was subsequently extended at a stepped down rate through the end of June 2011. Miller, V. et al. Impact of the Medicaid Fiscal Relief Provisions in the American Recovery and Reinvestment Act (ARRA). Kaiser Commission on Medicaid and the Uninsured, October 2011. http://www.kff.org/medicaid/8252.cfm. 11 Of the remaining 25 states, K-12 education spending was the largest expenditure. Higher education was the largest expenditure reported in five states (Iowa, Kentucky, Nebraska, North Dakota, and Oklahoma). Transportation was the largest expenditure reported in three states (Alaska, Utah, and Wyoming). 12 42 states report K-12 education as the largest general fund expenditure. Five states (Connecticut, Massachusetts, New Hampshire, Ohio, and Vermont) report Medicaid as the largest general fund expenditure –
00 37
two of these states, Connecticut and Massachusetts, report no federal funding for Medicaid. Footnotes indicate that Connecticut includes federal funds in the general fund figures; it appears Massachusetts does as well. Oklahoma reported higher education as the largest general fund expenditure; Michigan reported corrections as the largest general fund expenditure; and Wyoming reported transportation as the largest general fund expenditure. Higher education was reported as the second largest general fund expenditure in 23 states while Medicaid was reported as the second largest expenditure in 20 states. State Expenditure Report: Examining Fiscal 2009-2011 State Spending. National Association of State Budget Officers, December 2011. http://www.nasbo.org/sites/default/files/2010%20State%20Expenditure%20Report.pdf 13 Three states reported a higher share of general fund spending on Medicaid than New Hampshire’s 27.9% - Massachusetts (34.3%), Ohio (33.89%), and Connecticut (32.35%). Connecticut, however, noted for this report that federal funds for Medicaid are included in the state’s general fund spending for this program; therefore, the 32.25% reflects federal funds as well as general fund spending on the program. Given that Massachusetts also reports no federal fund expenditures for Medicaid and the general fund expenditures for Medicaid in this state match the total expenditures for Medicaid reported in this state, it is suspected that the general fund spending reported for Massachusetts also includes federal funds. The state of Ohio is the only other state to report higher general fund spending than federal fund spending for Medicaid in this report for SFY 2010; given that the minimum match for Medicaid spending is 50 percent, it is likely that this figure is also misreported and possibly transposed with the figures reported by the state for federal fund spending on the program. State Expenditure Report: Examining Fiscal 2009-2011 State Spending. National Association of State Budget Officers, December 2011. http://www.nasbo.org/sites/default/files/2010%20State%20Expenditure%20Report.pdf 14 States differ in the funds from which they pay for different programs. The report used as the data source for this section also contains a category of spending entitled “Other State Funds”, which is a significant source of funding for K-12 education in New Hampshire. Therefore, states reported here as spending 0% of general fund dollars on select programs should not be interpreted as spending no state funds on these programs. State Expenditure Report: Examining Fiscal 2009-2011 State Spending. National Association of State Budget Officers, December 2011. http://www.nasbo.org/sites/default/files/2010%20State%20Expenditure%20Report.pdf 15 Two states, Massachusetts and Connecticut, report no federal funding for Medicaid. Footnotes indicate that in Connecticut, federal funds for the Medicaid program are included in the general fund figures; the same is suspected for Massachusetts. The state of Ohio is the only other state to report higher general fund spending than federal fund spending for Medicaid in this report for SFY 2010; given that the minimum match for Medicaid spending is 50 percent, it is likely that this figure is also misreported and possibly transposed with the figures reported by the state for federal fund spending on the program. 16 Tax capacity is a measure of a state’s potential to raise tax revenue by determining what the state could collect in revenues if nationally representative rates were applied to its tax base. However, due to the difficulty of developing representative tax analyses, this brief highlights measures of a state’s tax base. Reports that examine fiscal disparities across states include: Yilmaz, Yesim et al. Measuring Fiscal Disparities Across the U.S. States: A Representative Revenue System/ Representative Expenditure System Approach Fiscal Year 2002. Occasional Paper Number 74, Urban Institute, 2006. http://www.urban.org//UploadedPDF/311384_fiscal_disparities.pdf. Spending on Social Welfare Programs in Rich and Poor States. Report prepared by The Lewin Group and the Nelson A. Rockefeller Institute of Government for the Department of Health and Human Services, Assistant Secretary for Planning and Evaluation, July 2004. Other potential measures of tax capacity include the Representative Tax System (RTS) or Representative Revenue System (RRS) which was produced by the Advisory Commission on Intergovernmental Relations (ACIR) from 1962 to 1991, continued by Robert Tannenwald through SFY 1999, and then reproduced by the Urban Institute in their report Yesim, Y. et al. Measuring Fiscal Disparities across the U.S. States, A Representative Revenue System / Representative Expenditure System Approach Fiscal Year 2002, Urban Institute Program to Assess Change Social Policies, November 2006. http://www.urban.org/publications/311384.html. 17 Personal income is the income that is received by persons from all sources. It is calculated as the sum of wage and salary disbursements, supplements to wages and salaries, proprietors' income with inventory valuation and capital consumption adjustments, rental income of persons with capital consumption adjustment, personal dividend income, personal interest income, and personal current transfer receipts, less contributions for
0038
government social insurance. This measure of income is calculated as the personal income of the residents of a given area divided by the resident population of the area. BEA uses the Census Bureau's annual midyear population estimates. http://www.bea.gov/regional/definitions/nextpage.cfm?key=Per%20capita%20personal%20income%20%28dollars%29. 18 Compson, Michael and John Navratil, “An Improved Method for Estimating The Total Taxable Resources Of the States.” Research Paper No. 9702, 1997. http://www.treasury.gov/resource-center/economic-policy/Documents/wpnewm.pdf 19 Total Taxable Resources. U.S. Department of the Treasury, visited August 2012. http://www.treasury.gov/resource-center/economic-policy/taxable-resources/Pages/Total-Taxable-Resources.aspx 20 Total Taxable Resources (TTR) for the District of Columbia was calculated to be $96,000. However, because the District of Columbia does not have the same legal right as the states to tax certain resources, the same methodology to derive TTR estimates for the District of Columbia is flawed. http://www.treasury.gov/resource-center/economic-policy/Documents/wpnewm.pdf. 21 Gordon, Tracy. What States Can, and Can’t, Teach the Federal Government about Budgets. Brookings Institution, March 2012. http://www.brookings.edu/~/media/research/files/papers/2012/3/states%20budgets%20gordon/03_states_budgets_gordon 22 Fiscal Survey of States. National Association of State Budget Officers, Fall 2011. http://www.nasbo.org/sites/default/files/2011%20Fall%20Fiscal%20Survey%20of%20States.pdf. 23 Elizabeth McNichol, Phil Oliff and Nicholas Johnson. “States Continue to Feel Recession’s Impact.” Center for Budget and Policy Prioritites. June 27, 2012. Available at: http://www.cbpp.org/cms/index.cfm?fa=view&id=711 24 There have been some fluctuations in recent years due to the funding provided to states as part of the American Recovery and Reinvestment Act of 2009. The largest portion of this financial assistance to states came in the form of an enhanced Medicaid matching rate, which was enacted originally from October 2008 through December 2010. The enhanced matching rate was subsequently extended at a stepped down rate through the end of June 2011. Miller, V. et al. Impact of the Medicaid Fiscal Relief Provisions in the American Recovery and Reinvestment Act (ARRA). Kaiser Commission on Medicaid and the Uninsured, October 2011. http://www.kff.org/medicaid/8252.cfm. 25 Smith, Vern, et al. Moving Ahead Amid Fiscal Challenges: A Look at Medicaid Spending, Coverage, and Policy Trends. Kaiser Commission on Medicaid and the Uninsured, October 2011. http://www.kff.org/medicaid/upload/8248.pdf. 26 The Supreme Court ruling limited the Secretary of Health and Human Services ability to enforce the requirement to expand Medicaid coverage under the Affordable Care Act. See “A Guide to the Supreme Court’s Decision on the ACA’s Medicaid Expansion.” Kaiser Commission on Medicaid and the Uninsured, August 2012. http://www.kff.org/healthreform/8347.cfm 27 “Statement by Chad Stone On October Employment Report.” Center on Budget and Policy Priorities, November 2, 2012. http://www.cbpp.org/cms/index.cfm?fa=view&id=3857. 28 Ibid. 29 The Bureau of Labor Statistics has recently released corrected data for the state of Montana going back through January 2007 that shows Montana’s unemployment rate first reached 7.0 percent in October 2010 and dropped to 6.8 percent in March and April 2011 before returning to 7.0 percent in July and August 2011. For the purposes of this report, the later dates (July and August 2011) were considered the latest peak. 30 “Medicaid and Long Term Care Services and Supports.” Kaiser Commission on Medicaid and the Uninsured, June 2012. http://www.kff.org/medicaid/2186.cfm. 31 Obesity: Halting the Epidemic by Making Health Easier. Centers for Disease Control and Prevention, 2011. http://www.cdc.gov/chronicdisease/resources/publications/AAG/obesity.htm 32 Garfield, Rachel and Anthony Damico. “Medicaid Expansion Under Health Reform May Increase Service Use and Improve Access for Low-Income Adults with Diabetes.” Health Affairs, January 2012. http://content.healthaffairs.org/content/31/1/159.full?ijkey=hmTzYHTrP.v2.&keytype=ref&siteid=healthaff.
00 39
33 Frank, R., Conti, R and Goldman, H., Mental Health Policy and Psychotropic Drugs. The Milbank Quarterly, Vol. 83, No. 2, 2005 (pp. 271-298). 34 Centers for Medicare and Medicaid Services, Overview of Mental Health Services, http://www.cms.hhs.gov/MHS/ 35 Health Care Costs: A Primer. Kaiser Family Foundation, May 2012. http://www.kff.org/insurance/7670.cfm. 36 Heberlein, Martha et al. Performing Under Pressure: Annual Findings of a 50-State Survey of Eligibility, Enrollment, Renewal, and Cost-Sharing Policies in Medicaid and CHIP, 2011-2012. Kaiser Commission on Medicaid and the Uninsured, January 2012. http://www.kff.org/medicaid/upload/8272.pdf. 37 “Where are States Today? Medicaid and CHIP Eligibility Levels for Children and Non-Disabled Adults.” Kaiser Commission on Medicaid and the Uninsured, July 2012. http://www.kff.org/medicaid/upload/7993-02.pdf. Another waiver to allow for the expansion of Medicaid coverage to nonelderly adults residing in Cook County, IL has been submitted to CMS and is currently pending. For more information on this waiver proposal, see: http://www.medicaid.gov/Medicaid-CHIP-Program-Information/By-Topics/Waivers/1115/downloads/il/il-new-demo-request-pa.pdf. 38 Heberlein, Martha et al. Performing Under Pressure: Annual Findings of a 50-State Survey of Eligibility, Enrollment, Renewal, and Cost-Sharing Policies in Medicaid and CHIP, 2011-2012. Kaiser Commission on Medicaid and the Uninsured, January 2012. http://www.kff.org/medicaid/upload/8272.pdf. 39 Courtot, Brigette and Emily Lawton, The Urban Institute, and Samantha Artiga, KCMU. “Medicaid Enrollment and Expenditures by Federal Core Requirements and State Options.” Kaiser Commission on Medicaid and the Uninsured, January 2012. Available at: http://www.kff.org/medicaid/8239.cfm 40 Zuckerman, S., et al., "Medicaid Physician Fees Grew By More Than 15 Percent From 2003 to 2008, Narrowing Gap With Medicare Physician Payment Rates," Health Affairs, April 2009; available at http://www.kff.org/medicaid/kcmu042809oth.cfm. 41 Smith, Vern, et al. Moving Ahead Amid Fiscal Challenges: A Look at Medicaid Spending, Coverage, and Policy Trends in Medicaid Results from a 50-State Medicaid Budget Survey. Kaiser Commission on Medicaid and the Uninsured, October 2011. http://www.kff.org/medicaid/upload/8248.pdf. 42 Smith, Vern, et al. Medicaid Today; Preparing for Tomorrow: A Look at State Spending, Enrollment and Policy Trends in Medicaid Results from a 50-State Medicaid Program Survey for State Fiscal Years 2012 and 2013, October 2012. http://www.kff.org/medicaid/upload/8248.pdf. 43 Smith, V. et al. A Profile of Medicaid Managed Care Programs in 2010: Findings from a 50-State Survey. Kaiser Commission on Medicaid and the Uninsured, September 2011. http://www.kff.org/medicaid/8220.cfm. 44 Medicaid Managed Care: Key Data, Trends, and Issues. Kaiser Commission on Medicaid and the Uninsured, February 2012. Available at: http://www.kff.org/medicaid/8046.cfm New Hampshire has since indicated that they plan to implement managed care in FY 2013. Smith, Vern, et al. Medicaid Today; Preparing for Tomorrow: A Look at State Spending, Enrollment and Policy Trends in Medicaid Results from a 50-State Medicaid Program Survey for State Fiscal Years 2012 and 2013, October 2012. http://www.kff.org/medicaid/upload/8248.pdf. 45 Smith, V. et al. A Profile of Medicaid Managed Care Programs in 2010: Findings from a 50-State Survey. Kaiser Commission on Medicaid and the Uninsured, September 2011. http://www.kff.org/medicaid/8220.cfm. 46 Medicaid Managed Care: Key Data, Trends, and Issues. Kaiser Commission on Medicaid and the Uninsured, February 2012. Available at: http://www.kff.org/medicaid/8046.cfm 47 Musumeci, MaryBeth. State Demonstrations to Test Financial Alignment Models for Dual Eligible Beneficiaries: A Review of the 26 Proposals Submitted to CMS. Kaiser Commission on Medicaid and the Uninsured, October 2012. http://www.kff.org/Medicaid/8369.cfm. New Mexico originally has also submitted a proposal but has since withdrawn that proposal. 48 Kousser, T. 2002. "The Politics of Discretionary Medicaid Spending, 1980-1993." Journal of Health Politics, Policy and Law 27 (4): 639-71; Grogan, C. 1994. "Political-Economic Factors Influencing State Medicaid Policy." Political Research Quarterly 47 (3): 589-622 49 Gray V and D. Lowery. “Interest Group Politics and Economic Growth in the U.S. States.” American Political Science Review. 1988, 82(1):109-31; Plotnick, Robert D. and Richard F. Winters. “A Politico-Economic Theory of Income Redistribution.” The American Political Science Review. 1985, 79: 458-73; Jacoby, William G. and Saundra
0040
K. Schneider. “Variability in State Policy Priorities: An Empirical Analysis.” The Journal of Politics. 2001, 63(2): 544-68. 50 Jacoby, William G. “Public Attitudes toward Government Spending.” American Journal of Political Science. 1994, 38(2): 336-61; Bergstrom, T. and R. Goodman. 1973. "Private Demand for Public Goods." The American Economic Review, vol. 63, no. 2, pp. 286-96; Plotnick, Robert D. and Richard F. Winters. “A Politico-Economic Theory of Income Redistribution.” The American Political Science Review. 1985, 79: 458-73. 51 Kronebusch K. “Medicaid and the Politics of Groups: Recipients, Providers, and Policy Making.” Journal of Health Politics Policy and Law. 1997, 22(3): 839-78. 52 Comobreco, J. 1996. “Medicaid and Collective Action.” Social Science Quarterly 77(4): 860-76; Hanson, R.L. 1984. "Medicaid and the Politics of Redistribution." American Journal of Political Science 28 (2): 313-39; Grogan, C. 1994. "Political-Economic Factors Influencing State Medicaid Policy." Political Research Quarterly 47 (3): 589-622; Buchanan, Robert J., Joseph C. Cappelleri, and Robert L. Ohsfeldt. “The Social Environment and Medicaid Expenditures: Factors Influencing the Level of State Medicaid Spending.” Public Administration Review. 1991, 51(1): 67-73. 53 Hanson, R.L. 1984. "Medicaid and the Politics of Redistribution." American Journal of Political Science 28 (2): 313-39; Barrilleaux, C.J. and M.E. Miller. 1988. "The Political Economy of State Medicaid Policy." American Political Science Review 82 (4): 1089-107; Grogan, C. 1994. "Political-Economic Factors Influencing State Medicaid Policy." Political Research Quarterly 47 (3): 589-622. 54 Alt, J.E. & R.C. Lowry. (1994). Divided Government, Fiscal Institutions, and Budget Deficits: Evidence from the States. American Political Science Review, 88(4), 811-28; Bohn, H. & R.P. Inman. (1996). Balanced Budget Rules and Public Deficits: Evidence from the U.S. States (NBER Working Paper 5533). Cambridge, MA: National Bureau of Economic Research; Craig, S.G. & R.P. Inman. (1986). Education, Welfare, and the 'New' Federalism: State Budgeting in a Federalist Public Economy. In H.S. Rosen (Ed.), State and Local Public Finance (p193). Chicago: University of Chicago Press; Crain, W.M. (2003). Volatile States: Institutions, Policy, and the Performance of American State Economies. Ann Arbor: The University of Michigan Press; Poterba, J.M. (1994). State Responses to Fiscal Crises: The Effects of Budgetary Institutions and Politics. The Journal of Political Economy, 102(4), 799-821. 55 These four states operate on a biennial schedule, where legislators meet every other year. 56 It is possible that states have changes these requirements since the collection of this data. NCSL Fiscal Brief: State Balanced Budget Provisions. National Conference of State Legislatures, October 2010. http://www.ncsl.org/documents/fiscal/StateBalancedBudgetProvisions2010.pdf. 57 “Full responsibility” includes 10 states in which the governor has full responsibility to propose the budget, while the legislature adopts and revises the budget for the governor to subsequently sign or veto. 58 http://www.ncsl.org/issues-research/budget/state-tax-and-expenditure-limits-2008.aspx. 59 The Book of the States 2012. National Governor’s Association. http://www.nga.org/files/live/sites/NGA/files/pdf/BOSTable4.4.pdf 60 National Conference of State Legislatures. http://www.ncsl.org/legislatures-elections/elections/chart-of-the-initiative-states.aspx. 61 National Health Law Program and National Association of Community Health Centers. Role of State Law in Limiting Medicaid Changes. Available at: - http://www.nachc.com/client/NHELP-NACHC-St-by-St-Chart-Final.pdf. 62 Quarterly Tax Revenue data published by the Census Bureau, updated for the second quarter of CY 2012 on September 25, 2012. www.census.gov/govs. 63 Elizabeth McNichol, Phil Oliff and Nicholas Johnson. “States Continue to Feel Recession’s Impact.” Center for Budget and Policy Prioritites. June 27, 2012. Available at: http://www.cbpp.org/cms/index.cfm?fa=view&id=711 64 The Widening Gap: The Great Recession’s Impact on State Pension and Retiree Health Care Costs. The Pew Center on the States, April 2011. http://www.pewcenteronthestates.org.

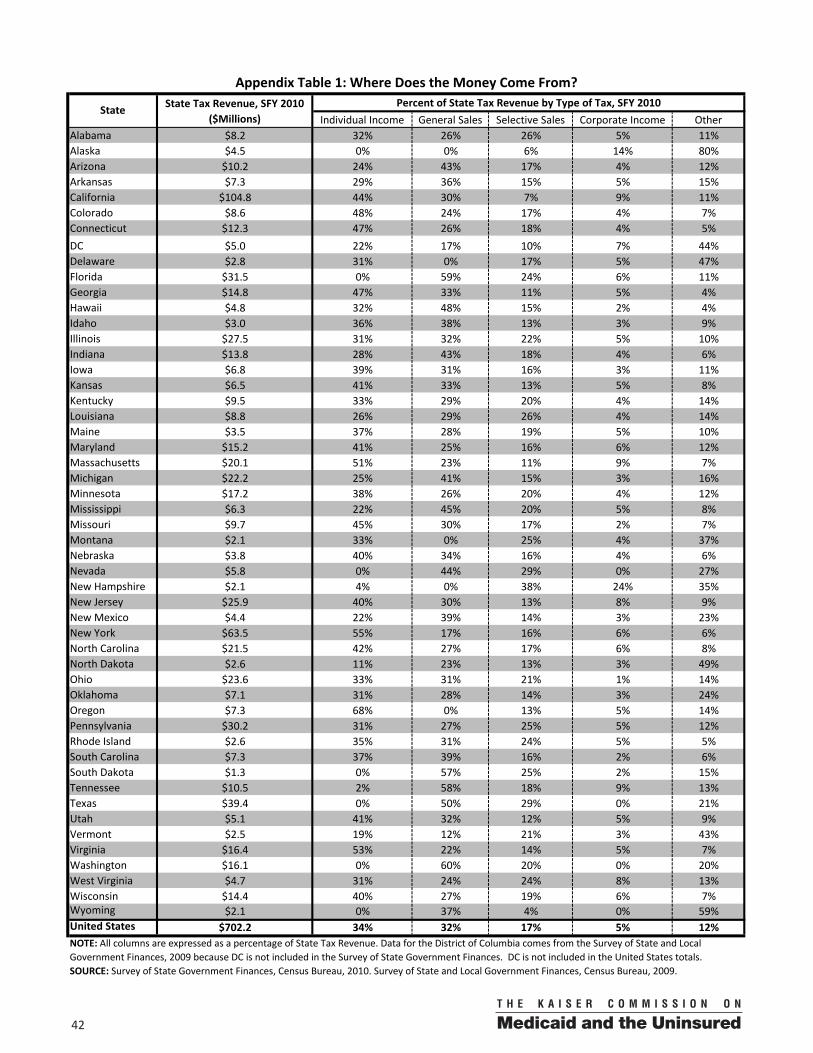
0042
Individual Income General Sales Selective Sales Corporate Income Other Alabama $8.2 32% 26% 26% 5% 11%Alaska $4.5 0% 0% 6% 14% 80%Arizona $10.2 24% 43% 17% 4% 12%Arkansas $7.3 29% 36% 15% 5% 15%California $104.8 44% 30% 7% 9% 11%Colorado $8.6 48% 24% 17% 4% 7%Connecticut $12.3 47% 26% 18% 4% 5%DC $5.0 22% 17% 10% 7% 44%Delaware $2.8 31% 0% 17% 5% 47%Florida $31.5 0% 59% 24% 6% 11%Georgia $14.8 47% 33% 11% 5% 4%Hawaii $4.8 32% 48% 15% 2% 4%Idaho $3.0 36% 38% 13% 3% 9%Illinois $27.5 31% 32% 22% 5% 10%Indiana $13.8 28% 43% 18% 4% 6%Iowa $6.8 39% 31% 16% 3% 11%Kansas $6.5 41% 33% 13% 5% 8%Kentucky $9.5 33% 29% 20% 4% 14%Louisiana $8.8 26% 29% 26% 4% 14%Maine $3.5 37% 28% 19% 5% 10%Maryland $15.2 41% 25% 16% 6% 12%Massachusetts $20.1 51% 23% 11% 9% 7%Michigan $22.2 25% 41% 15% 3% 16%Minnesota $17.2 38% 26% 20% 4% 12%Mississippi $6.3 22% 45% 20% 5% 8%Missouri $9.7 45% 30% 17% 2% 7%Montana $2.1 33% 0% 25% 4% 37%Nebraska $3.8 40% 34% 16% 4% 6%Nevada $5.8 0% 44% 29% 0% 27%New Hampshire $2.1 4% 0% 38% 24% 35%New Jersey $25.9 40% 30% 13% 8% 9%New Mexico $4.4 22% 39% 14% 3% 23%New York $63.5 55% 17% 16% 6% 6%North Carolina $21.5 42% 27% 17% 6% 8%North Dakota $2.6 11% 23% 13% 3% 49%Ohio $23.6 33% 31% 21% 1% 14%Oklahoma $7.1 31% 28% 14% 3% 24%Oregon $7.3 68% 0% 13% 5% 14%Pennsylvania $30.2 31% 27% 25% 5% 12%Rhode Island $2.6 35% 31% 24% 5% 5%South Carolina $7.3 37% 39% 16% 2% 6%South Dakota $1.3 0% 57% 25% 2% 15%Tennessee $10.5 2% 58% 18% 9% 13%Texas $39.4 0% 50% 29% 0% 21%Utah $5.1 41% 32% 12% 5% 9%Vermont $2.5 19% 12% 21% 3% 43%Virginia $16.4 53% 22% 14% 5% 7%Washington $16.1 0% 60% 20% 0% 20%West Virginia $4.7 31% 24% 24% 8% 13%Wisconsin $14.4 40% 27% 19% 6% 7%Wyoming $2.1 0% 37% 4% 0% 59%United States $702.2 34% 32% 17% 5% 12%
Appendix Table 1: Where Does the Money Come From?
State State Tax Revenue, SFY 2010 ($Millions)
Percent of State Tax Revenue by Type of Tax, SFY 2010
NOTE: All columns are expressed as a percentage of State Tax Revenue. Data for the District of Columbia comes from the Survey of State and Local Government Finances, 2009 because DC is not included in the Survey of State Government Finances. DC is not included in the United States totals.SOURCE: Survey of State Government Finances, Census Bureau, 2010. Survey of State and Local Government Finances, Census Bureau, 2009.
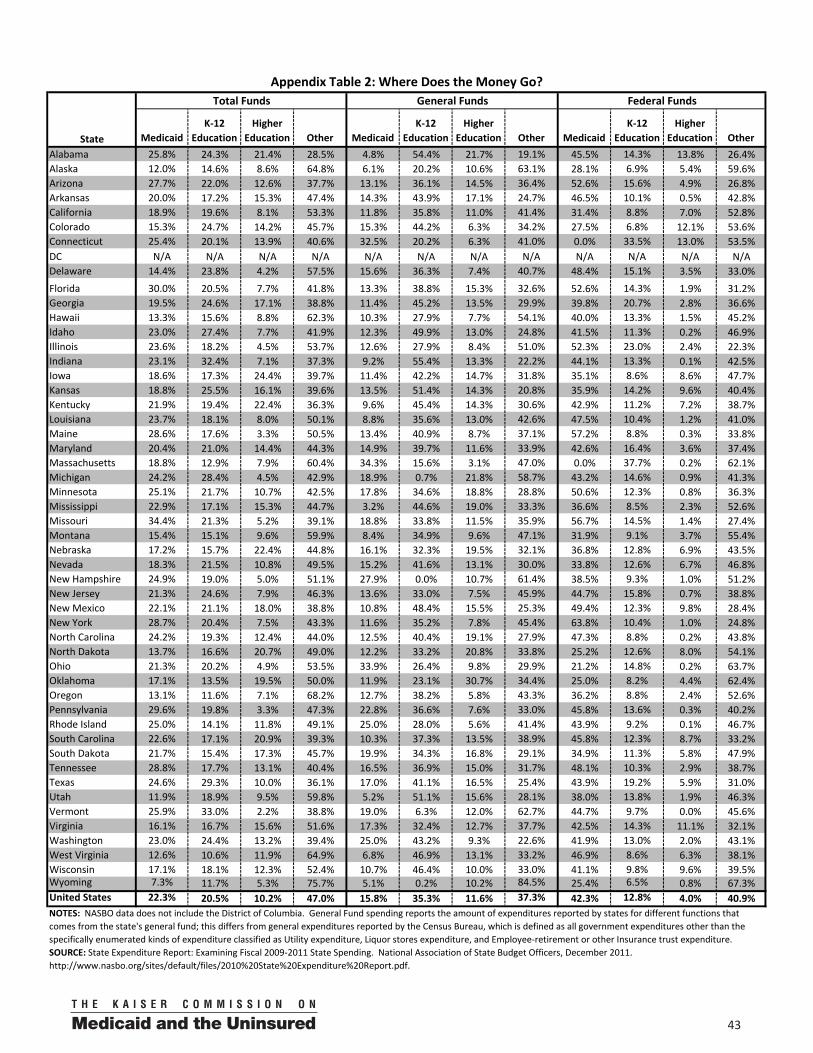
00 43
MedicaidK-12
EducationHigher
Education Other MedicaidK-12
EducationHigher
Education Other MedicaidK-12
EducationHigher
Education OtherAlabama 25.8% 24.3% 21.4% 28.5% 4.8% 54.4% 21.7% 19.1% 45.5% 14.3% 13.8% 26.4%Alaska 12.0% 14.6% 8.6% 64.8% 6.1% 20.2% 10.6% 63.1% 28.1% 6.9% 5.4% 59.6%Arizona 27.7% 22.0% 12.6% 37.7% 13.1% 36.1% 14.5% 36.4% 52.6% 15.6% 4.9% 26.8%Arkansas 20.0% 17.2% 15.3% 47.4% 14.3% 43.9% 17.1% 24.7% 46.5% 10.1% 0.5% 42.8%California 18.9% 19.6% 8.1% 53.3% 11.8% 35.8% 11.0% 41.4% 31.4% 8.8% 7.0% 52.8%Colorado 15.3% 24.7% 14.2% 45.7% 15.3% 44.2% 6.3% 34.2% 27.5% 6.8% 12.1% 53.6%Connecticut 25.4% 20.1% 13.9% 40.6% 32.5% 20.2% 6.3% 41.0% 0.0% 33.5% 13.0% 53.5%DC N/A N/A N/A N/A N/A N/A N/A N/A N/A N/A N/A N/ADelaware 14.4% 23.8% 4.2% 57.5% 15.6% 36.3% 7.4% 40.7% 48.4% 15.1% 3.5% 33.0%Florida 30.0% 20.5% 7.7% 41.8% 13.3% 38.8% 15.3% 32.6% 52.6% 14.3% 1.9% 31.2%Georgia 19.5% 24.6% 17.1% 38.8% 11.4% 45.2% 13.5% 29.9% 39.8% 20.7% 2.8% 36.6%Hawaii 13.3% 15.6% 8.8% 62.3% 10.3% 27.9% 7.7% 54.1% 40.0% 13.3% 1.5% 45.2%Idaho 23.0% 27.4% 7.7% 41.9% 12.3% 49.9% 13.0% 24.8% 41.5% 11.3% 0.2% 46.9%Illinois 23.6% 18.2% 4.5% 53.7% 12.6% 27.9% 8.4% 51.0% 52.3% 23.0% 2.4% 22.3%Indiana 23.1% 32.4% 7.1% 37.3% 9.2% 55.4% 13.3% 22.2% 44.1% 13.3% 0.1% 42.5%Iowa 18.6% 17.3% 24.4% 39.7% 11.4% 42.2% 14.7% 31.8% 35.1% 8.6% 8.6% 47.7%Kansas 18.8% 25.5% 16.1% 39.6% 13.5% 51.4% 14.3% 20.8% 35.9% 14.2% 9.6% 40.4%Kentucky 21.9% 19.4% 22.4% 36.3% 9.6% 45.4% 14.3% 30.6% 42.9% 11.2% 7.2% 38.7%Louisiana 23.7% 18.1% 8.0% 50.1% 8.8% 35.6% 13.0% 42.6% 47.5% 10.4% 1.2% 41.0%Maine 28.6% 17.6% 3.3% 50.5% 13.4% 40.9% 8.7% 37.1% 57.2% 8.8% 0.3% 33.8%Maryland 20.4% 21.0% 14.4% 44.3% 14.9% 39.7% 11.6% 33.9% 42.6% 16.4% 3.6% 37.4%Massachusetts 18.8% 12.9% 7.9% 60.4% 34.3% 15.6% 3.1% 47.0% 0.0% 37.7% 0.2% 62.1%Michigan 24.2% 28.4% 4.5% 42.9% 18.9% 0.7% 21.8% 58.7% 43.2% 14.6% 0.9% 41.3%Minnesota 25.1% 21.7% 10.7% 42.5% 17.8% 34.6% 18.8% 28.8% 50.6% 12.3% 0.8% 36.3%Mississippi 22.9% 17.1% 15.3% 44.7% 3.2% 44.6% 19.0% 33.3% 36.6% 8.5% 2.3% 52.6%Missouri 34.4% 21.3% 5.2% 39.1% 18.8% 33.8% 11.5% 35.9% 56.7% 14.5% 1.4% 27.4%Montana 15.4% 15.1% 9.6% 59.9% 8.4% 34.9% 9.6% 47.1% 31.9% 9.1% 3.7% 55.4%Nebraska 17.2% 15.7% 22.4% 44.8% 16.1% 32.3% 19.5% 32.1% 36.8% 12.8% 6.9% 43.5%Nevada 18.3% 21.5% 10.8% 49.5% 15.2% 41.6% 13.1% 30.0% 33.8% 12.6% 6.7% 46.8%New Hampshire 24.9% 19.0% 5.0% 51.1% 27.9% 0.0% 10.7% 61.4% 38.5% 9.3% 1.0% 51.2%New Jersey 21.3% 24.6% 7.9% 46.3% 13.6% 33.0% 7.5% 45.9% 44.7% 15.8% 0.7% 38.8%New Mexico 22.1% 21.1% 18.0% 38.8% 10.8% 48.4% 15.5% 25.3% 49.4% 12.3% 9.8% 28.4%New York 28.7% 20.4% 7.5% 43.3% 11.6% 35.2% 7.8% 45.4% 63.8% 10.4% 1.0% 24.8%North Carolina 24.2% 19.3% 12.4% 44.0% 12.5% 40.4% 19.1% 27.9% 47.3% 8.8% 0.2% 43.8%North Dakota 13.7% 16.6% 20.7% 49.0% 12.2% 33.2% 20.8% 33.8% 25.2% 12.6% 8.0% 54.1%Ohio 21.3% 20.2% 4.9% 53.5% 33.9% 26.4% 9.8% 29.9% 21.2% 14.8% 0.2% 63.7%Oklahoma 17.1% 13.5% 19.5% 50.0% 11.9% 23.1% 30.7% 34.4% 25.0% 8.2% 4.4% 62.4%Oregon 13.1% 11.6% 7.1% 68.2% 12.7% 38.2% 5.8% 43.3% 36.2% 8.8% 2.4% 52.6%Pennsylvania 29.6% 19.8% 3.3% 47.3% 22.8% 36.6% 7.6% 33.0% 45.8% 13.6% 0.3% 40.2%Rhode Island 25.0% 14.1% 11.8% 49.1% 25.0% 28.0% 5.6% 41.4% 43.9% 9.2% 0.1% 46.7%South Carolina 22.6% 17.1% 20.9% 39.3% 10.3% 37.3% 13.5% 38.9% 45.8% 12.3% 8.7% 33.2%South Dakota 21.7% 15.4% 17.3% 45.7% 19.9% 34.3% 16.8% 29.1% 34.9% 11.3% 5.8% 47.9%Tennessee 28.8% 17.7% 13.1% 40.4% 16.5% 36.9% 15.0% 31.7% 48.1% 10.3% 2.9% 38.7%Texas 24.6% 29.3% 10.0% 36.1% 17.0% 41.1% 16.5% 25.4% 43.9% 19.2% 5.9% 31.0%Utah 11.9% 18.9% 9.5% 59.8% 5.2% 51.1% 15.6% 28.1% 38.0% 13.8% 1.9% 46.3%Vermont 25.9% 33.0% 2.2% 38.8% 19.0% 6.3% 12.0% 62.7% 44.7% 9.7% 0.0% 45.6%Virginia 16.1% 16.7% 15.6% 51.6% 17.3% 32.4% 12.7% 37.7% 42.5% 14.3% 11.1% 32.1%Washington 23.0% 24.4% 13.2% 39.4% 25.0% 43.2% 9.3% 22.6% 41.9% 13.0% 2.0% 43.1%West Virginia 12.6% 10.6% 11.9% 64.9% 6.8% 46.9% 13.1% 33.2% 46.9% 8.6% 6.3% 38.1%Wisconsin 17.1% 18.1% 12.3% 52.4% 10.7% 46.4% 10.0% 33.0% 41.1% 9.8% 9.6% 39.5%Wyoming 7.3% 11.7% 5.3% 75.7% 5.1% 0.2% 10.2% 84.5% 25.4% 6.5% 0.8% 67.3%United States 22.3% 20.5% 10.2% 47.0% 15.8% 35.3% 11.6% 37.3% 42.3% 12.8% 4.0% 40.9%
Appendix Table 2: Where Does the Money Go?
NOTES: NASBO data does not include the District of Columbia. General Fund spending reports the amount of expenditures reported by states for different functions that comes from the state's general fund; this differs from general expenditures reported by the Census Bureau, which is defined as all government expenditures other than the specifically enumerated kinds of expenditure classified as Utility expenditure, Liquor stores expenditure, and Employee-retirement or other Insurance trust expenditure.SOURCE: State Expenditure Report: Examining Fiscal 2009-2011 State Spending. National Association of State Budget Officers, December 2011. http://www.nasbo.org/sites/default/files/2010%20State%20Expenditure%20Report.pdf.
State
Total Funds General Funds Federal Funds
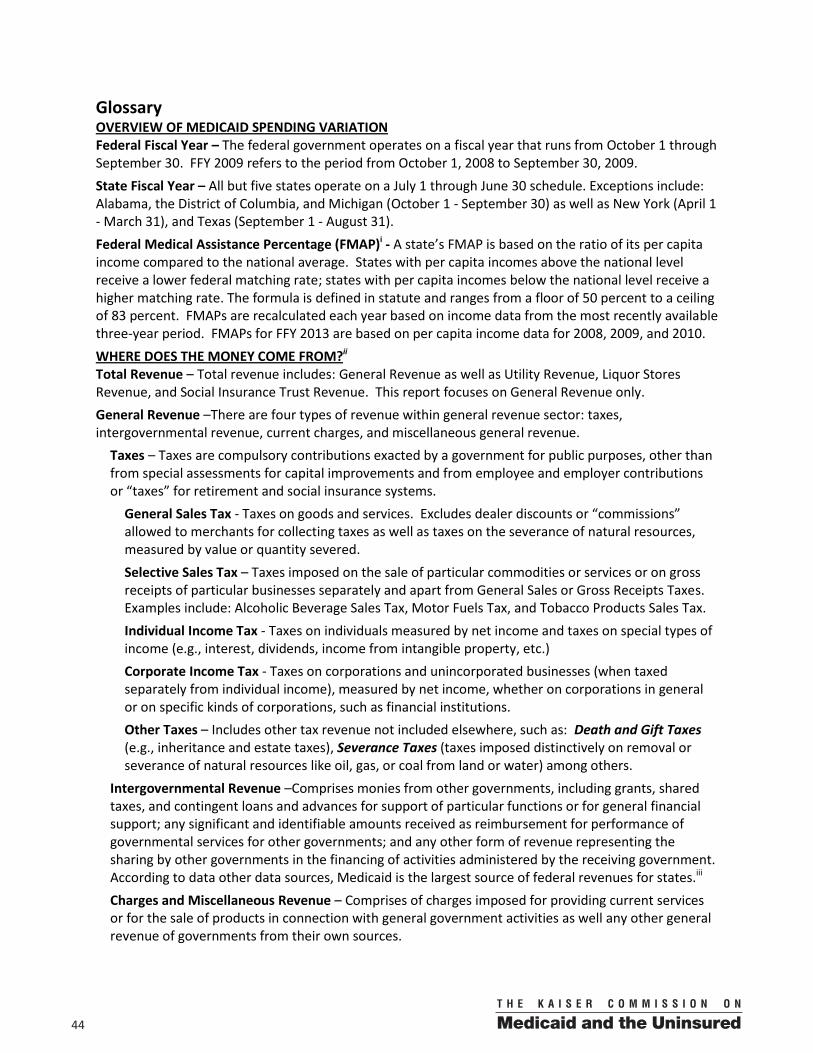
0044
Glossary OVERVIEW OF MEDICAID SPENDING VARIATION Federal Fiscal Year – The federal government operates on a fiscal year that runs from October 1 through September 30. FFY 2009 refers to the period from October 1, 2008 to September 30, 2009.
State Fiscal Year – All but five states operate on a July 1 through June 30 schedule. Exceptions include: Alabama, the District of Columbia, and Michigan (October 1 - September 30) as well as New York (April 1 - March 31), and Texas (September 1 - August 31).
Federal Medical Assistance Percentage (FMAP)i - A state’s FMAP is based on the ratio of its per capita income compared to the national average. States with per capita incomes above the national level receive a lower federal matching rate; states with per capita incomes below the national level receive a higher matching rate. The formula is defined in statute and ranges from a floor of 50 percent to a ceiling of 83 percent. FMAPs are recalculated each year based on income data from the most recently available three-year period. FMAPs for FFY 2013 are based on per capita income data for 2008, 2009, and 2010.
WHERE DOES THE MONEY COME FROM?ii Total Revenue – Total revenue includes: General Revenue as well as Utility Revenue, Liquor Stores Revenue, and Social Insurance Trust Revenue. This report focuses on General Revenue only.
General Revenue –There are four types of revenue within general revenue sector: taxes, intergovernmental revenue, current charges, and miscellaneous general revenue.
Taxes – Taxes are compulsory contributions exacted by a government for public purposes, other than from special assessments for capital improvements and from employee and employer contributions or “taxes” for retirement and social insurance systems.
General Sales Tax - Taxes on goods and services. Excludes dealer discounts or “commissions” allowed to merchants for collecting taxes as well as taxes on the severance of natural resources, measured by value or quantity severed.
Selective Sales Tax – Taxes imposed on the sale of particular commodities or services or on gross receipts of particular businesses separately and apart from General Sales or Gross Receipts Taxes. Examples include: Alcoholic Beverage Sales Tax, Motor Fuels Tax, and Tobacco Products Sales Tax.
Individual Income Tax - Taxes on individuals measured by net income and taxes on special types of income (e.g., interest, dividends, income from intangible property, etc.)
Corporate Income Tax - Taxes on corporations and unincorporated businesses (when taxed separately from individual income), measured by net income, whether on corporations in general or on specific kinds of corporations, such as financial institutions.
Other Taxes – Includes other tax revenue not included elsewhere, such as: Death and Gift Taxes (e.g., inheritance and estate taxes), Severance Taxes (taxes imposed distinctively on removal or severance of natural resources like oil, gas, or coal from land or water) among others.
Intergovernmental Revenue –Comprises monies from other governments, including grants, shared taxes, and contingent loans and advances for support of particular functions or for general financial support; any significant and identifiable amounts received as reimbursement for performance of governmental services for other governments; and any other form of revenue representing the sharing by other governments in the financing of activities administered by the receiving government. According to data other data sources, Medicaid is the largest source of federal revenues for states.iii
Charges and Miscellaneous Revenue – Comprises of charges imposed for providing current services or for the sale of products in connection with general government activities as well any other general revenue of governments from their own sources.
00 45
WHERE DOES THE MONEY GOiv Total Funds – Includes all funding sources described below (General Fund, Federal Funds, Other State Funds, and Bonds where applicable).
General Funds - The predominant fund for financing a state’s operations. Revenues are received from broad-based state taxes. However, there are differences in how specific functions are financed from state to state.
Federal Funds - Funds received directly from the federal government.
Other State Funds - Expenditures from revenue sources that are restricted by law for particular governmental functions or activities. For Medicaid, other state funds include provider taxes, fees, donations, assessments, and local funds. This report focuses on General and Federal Funds.
Bonds - Expenditures from the sale of bonds, generally for capital projects. This report focuses on General and Federal Funds.
WHAT IS THE REVENUE AVAILABLE TO STATES TO PAY FOR PUBLIC SERVICES? Tax Capacityv – Tax capacity is a theoretical construct that applies average or nationally representative tax rates to each state’s individual tax base to determine its potential to raise revenues. This concept does not take into account decisions made by the state in terms of tax rates or policies.
Tax Effortvi – Tax efforts examines what a state actually raised in revenue compared to its potential to raise revenues (i.e. tax capacity).
Tax Basevii – The sources of income and wealth a governing body (in this case, a state government) can tax. Measures of this concept include per capita personal income, gross state product (GSP), and total taxable resources (TRR).
Personal Incomeviii - Personal income is the income that is received by persons from all sources. It is calculated as the sum of wage and salary disbursements, supplements to wages and salaries, proprietors' income with inventory valuation and capital consumption adjustments, rental income of persons with capital consumption adjustment, personal dividend income, personal interest income, and personal current transfer receipts, less contributions for government social insurance. This measure of income is calculated as the personal income of the residents of a given area (i.e. a state) divided by the resident population of the area. BEA uses the Census Bureau's annual midyear population estimates.
Total Taxable Resources (TTR)ix - TTR is defined as the unduplicated sum of the income flows produced within a state (GSP) and the income flows received by its residents (SPI) which a state can potentially tax. It addresses the deficiencies of personal income and gross state product by capturing the cross-border income flows that are not accounted for in gross state product. It is defined as the unduplicated sum of the income flows produced within a state and the income flows received by its residents which a state can potentially tax.
Year-End Balancesx – Ending balances for state budgets which also accounts for the amounts in budget stabilization “rainy day” funds.
HOW DOES THE DEMAND FOR PUBLIC SERVICES DIFFER ACROSS STATES? Federal Poverty Levelxi – This report uses the Federal Poverty Level (FPL) as measured by the U.S. Department of Health and Human Services' (HHS) poverty guidelines. The federal poverty guideline for a family of four in the 48 contiguous states and D.C. was $22,050 in 2009 and 2010. The U.S. Census Bureau produces simplified - but very similar - versions of federal poverty guidelines called "poverty thresholds."
0046
WHAT IS THE VARIATION IN HEALTH CARE MARKETS ACROSS STATES Federally- Qualified Health Centers (FQHC)xii – The federally-funded Federally-Qualified Health Centers (FQHCs) meet federal health center grant requirements and are required to report administrative, clinical and other information to the federal Bureau of Primary Health Care. Other health centers known as "FQHC Look-Alikes" are not included here because they do not receive federal health center grants and do not report to the Bureau of Primary Health Care. The data provided here consequently underreport the services provided by FQHCs. There are approximately 100 FQHC Look-Alikes across the United States. Health Professional Shortage Area (HPSA) xiii – HPSAs can be designated based on geographic areas, population groups, or facilities. For a geographic region to be deemed a primary care HPSA population to full-time equivalent primary care provider ratio must exceed 3,500:1 (3,000:1 in areas with unusually high need). For a population group to be deemed a primary care HPSA there must exist barriers to accessing care, that may be socioeconomic, cultural or linguistic, or that may result from a dearth of local providers who are willing to accept patients from such backgrounds or who refuse to accept Medicaid reimbursement. Native American Indian tribes are universally recognized as population group HPSAs. For a health care facility to be deemed a primary care HPSA, it must be a public or non-profit health care delivery site and must have inadequate resources to fulfill the primary care needs of the area or population group. Data included here focuses on primary care HPSAs. The percent of the state’s population living in a primary care HPSA includes each of the three types of primary care HPSAs described above (geographic, population, and health care facility). i Medicaid Financing: An Overview of the Federal Medicaid Matching Rate (FMAP). Kaiser Commission on Medicaid and the Uninsured, September 2012. http://www.kff.org/medicaid/upload/8352.pdf. ii Definitions are based on descriptions provided by the Census Bureau for the 2010 Annual Survey of State Government Finances - http://www.census.gov/govs/state/. iii State Expenditure Report: Examining Fiscal 2009-2011 State Spending. National Association of State Budget Officers, December 2011. http://www.nasbo.org/sites/default/files/2010%20State%20Expenditure%20Report.pdf iv State Expenditure Report: Examining Fiscal 2009-2011 State Spending. National Association of State Budget Officers, December 2011. http://www.nasbo.org/sites/default/files/2010%20State%20Expenditure%20Report.pdf. v Yilmaz, Yesim et al. Measuring Fiscal Disparities Across the U.S. States: A Representative Revenue System/ Representative Expenditure System Approach Fiscal Year 2002. Occasional Paper Number 74, the Urban Institute, 2006. http://www.urban.org//UploadedPDF/311384_fiscal_disparities.pdf. Spending on Social Welfare Programs in Rich and Poor States. Report prepared by The Lewin Group and the Nelson A. Rockefeller Institute of Government for the Department of Health and Human Services, Assistant Secretary for Planning and Evaluation, July 2004. vi Ibid. vii Ibid. viii Per Capita Personal Income definition, Bureau of Economic Analysis. Definition updated May 3, 2011. http://www.bea.gov/regional/definitions/nextpage.cfm?key=Per%20capita%20personal%20income%20%28dollars%29. ix TREASURY METHODOLOGY FOR ESTIMATING TOTAL TAXABLE RESOURCES (TTR). Office of Economic Policy, U.S. Department of Treasury, Revised December 2002. http://www.treasury.gov/resource-center/economic-policy/Documents/nmpubsum.pdf. x Fiscal Survey of States. National Association of State Budget Officers, Fall 2011. http://www.nasbo.org/sites/default/files/2011%20Fall%20Fiscal%20Survey%20of%20States.pdf. xi For more information on measures of poverty, please see the detailed description provided by HHS available at http://aspe.hhs.gov/poverty/faq.shtml. xii National Association of Community Health Centers, Incorporated (NACHC) analysis of the 2010 Uniform Data System, Bureau of Primary Health Care, Health Resources and Services Administration, Department of Health and Human Services, Special Data Request, November 2011. Available at Kaiser Family Foundation’s State Health Facts site - http://www.statehealthfacts.org/comparemaptable.jsp?ind=424&cat=8. xiii For further details on primary medical care HPSA designation criteria, see the following – Hoffman, Catherine, Anthony Damico, and Rachel Garfield, Research Brief: Insurance Coverage and Access to Care in Primary Care Shortage Areas. Kaiser Family Foundation, February 2011. http://www.kff.org/insurance/upload/8161.pdf.

1 3 3 0 G S T R E E T N W , W A S H I N G T O N , D C 2 0 0 0 5
P H O N E : ( 2 0 2 ) 3 4 7 - 5 2 7 0 , F A X : ( 2 0 2 ) 3 4 7 - 5 2 7 4
W E B S I T E : W W W . K F F . O R G / K C M U
A d d i t i o n a l c o p i e s o f t h i s r e p o r t ( # 0 0 0 0 ) a r e a v a i l a b l e o n t h e K a i s e r F a m i l y F o u n d a t i o n ’ s w e b s i t e a t w w w . k f f . o r g .
The Kaiser Commission on Medicaid and the Uninsured provides information and analysis on health care coverage and access for the low-
income population, with a special focus on Medicaid’s role and coverage of the uninsured. Begun in 1991 and based in the Kaiser Family
Foundation's Washington, DC office, the Commission is the largest operating program of the Foundation. The Commission's work is
conducted by Foundation staff under the guidance of a bi-partisan group of national leaders and experts in health care and public policy.
This publication (#8378) is available on the Kaiser Family Foundation’s website at www.kff.org.