Embed Size (px)
Citation preview

Why do we want the VOS-Clim information?The main purpose of the VoluntaryObserving Ship (VOS) Climate Projectis to provide a high-quality set of marinemeteorological observations - anddetailed information on how the datawere obtained. Such observations, areof great value to operational marineforecasting. Furthermore, climatestudies rely on the increased accuracy ofgood observations. Improved climatemodels, better ground truth for checkingsatellite observations, and a moreaccurate high-quality marine data set -all will be possible with the cooperationof international ship participants.
For the VOS-Clim project we are asking PMO's to collect extra information about theselected Voluntary Observing Ships. ....Why do we want that information? What will it beused for? Here are answers to some of the questions you may have...
Q As a ship’s officer how will it change the way I take observations?”
A Hardly at all. If you use an electronic logbook or coding system (e.g. “Turbowin”) youwill be issued with an upgraded version, if you fill in logbooks you will be asked to reportthe relative wind speed and direction and ship’s speed and head at the time of theobservation. In return you will benefit by enhanced support from the Port MeteorologicalOfficers and you will be able to learn more about the various ways in which yourobservations are used.
Q What do you mean when yousay the ships observations will be
used to study the climate?”
A This is a map of the transfer ofheat between the ocean and
atmosphere for an average January.
In the northern hemisphere it iswinter and the blues colours show
that the ocean is loosing largeamounts of heat to the atmosphere -especially over the Gulf Stream and
the Kuroshio.
This map is for July. Now thenorthern hemisphere oceans are
being warmed and the cooling isoccurring in the southern oceanswhere the sea ice has spread out
from Antarctica.
-330 -270 -210 -150 -90 -30 30Longitude
-90
-75
-60
-45
-30
-15
0
15
30
45
60
75
90
-350.00-300.00-250.00-200.00-150.00-100.00-50.000.0050.00100.00150.00200.00
-330 -270 -210 -150 -90 -30 30Longitude
-90
-75
-60
-45
-30
-15
0
15
30
45
60
75
90
-200.00-150.00-100.00-50.000.0050.00100.00150.00200.00
We could only draw these maps because of the millions of observations which have beentaken by merchant ships in the past
Nowadays we obtain information from satellites and computer models - but the ship data is asimportant as ever. In fact we need really good ship observations to check the models andcalibrate the satellites - that’s what the VOS-Clim project is aimed toward. Betterobservations really will make a difference!
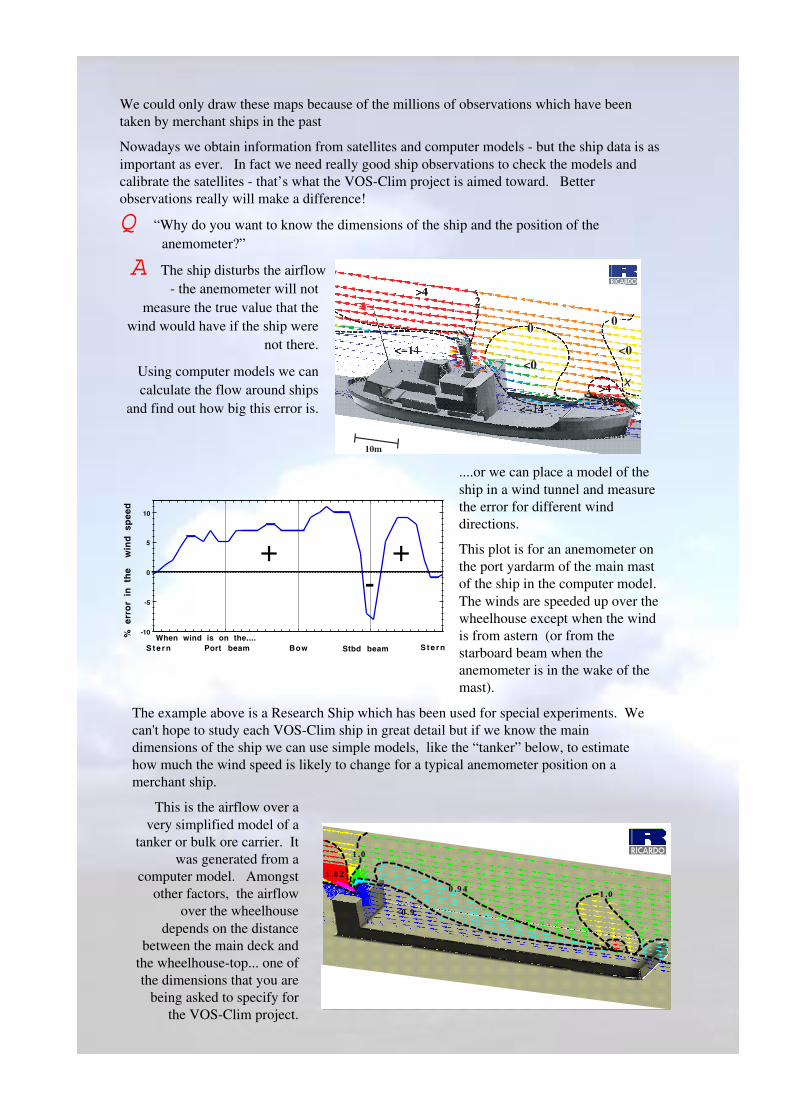
Q “Why do you want to know the dimensions of the ship and the position of theanemometer?”
A The ship disturbs the airflow- the anemometer will not
measure the true value that thewind would have if the ship were
not there.
Using computer models we cancalculate the flow around ships
and find out how big this error is.
<0<0
10m
2
00
3 6 02 7 01 8 09 00-10
-5
0
5
10
% e
rro
r in
th
e w
ind
sp
eed
When wind is on the....Bow Stbd beamPort beam S t e r nS t e r n
+ +-
....or we can place a model of theship in a wind tunnel and measurethe error for different winddirections.
This plot is for an anemometer onthe port yardarm of the main mastof the ship in the computer model.The winds are speeded up over thewheelhouse except when the windis from astern (or from thestarboard beam when theanemometer is in the wake of themast).
The example above is a Research Ship which has been used for special experiments. Wecan't hope to study each VOS-Clim ship in great detail but if we know the maindimensions of the ship we can use simple models, like the “tanker” below, to estimatehow much the wind speed is likely to change for a typical anemometer position on amerchant ship.
This is the airflow over avery simplified model of a
tanker or bulk ore carrier. Itwas generated from a
computer model. Amongstother factors, the airflow
over the wheelhousedepends on the distance
between the main deck andthe wheelhouse-top... one ofthe dimensions that you are
being asked to specify forthe VOS-Clim project.
0.94
1.0
1.02
<0.9
1.0

Q “Why do you want to know the type of instrument used for air temperaturemeasurement and where it is situated?”
A For example...
This graph shows the average error in airtemperature measurement for thermometer
screens on different ships....the different lines show how well the
screen was situated...green = good, blue =moderate, red = bad
At night the badly exposed screens were,on average half to one degree too warm.
The other screens gave good readings.Now look what happened during the day...
10005000
-1.5
-0.5
0.5
1.5
2.5
3.5
Sunshine
Err
or
in
the
a
ir
tem
pe
ratu
re
(d
eg
ree
s
C)
D u l l V. Sunny
0
1
2
3
4
Day...
-100-900
-1.5
-0.5
0.5
1.5
2.5
3.5
Total Cloud Cover (oktas)
Err
or
in
the
a
ir
tem
pe
ratu
re
(d
eg
ree
s
C)
0 1 2 3 4 5 6 7 8
0
1
2
3
4
Night...
...in sunny conditions all the screens tend toread too warm - but for screens with good ormoderate exposure the over-heating isreasonably uniform - we can devise acorrection.
...the screens with bad exposure read muchtoo high - several degrees - and there are bigdifferences between different screens - wecan't correct these errors but it’s importantthat we know about them.
Q “Why is it important to know the method of sea surface temperature determination?”
A The value of the sea surface temperature(“SST”) depends to some extent on how it ismeasured. An increasing number of shipsare being fitted with thermometers that arefastened to the inside skin of the hull (“hullcontact sensors”). Provided that they arekept in calibration, we believe that theseinstruments give the most accurate SSTvalues. The plot shows the averagedifference between SST values from EngineRoom Intake (“ERI”) thermometers andthose from hull contact sensors (dottedline).
For both day and night the ERI values arewarmer by about 0.3 to 0.4˚C. Bucket readings are close to or slightly colder than the hullcontact readings at night. However in the daytime the bucket readings tend to becomewarmer if the sun is shining.
1 3 5 7 0
20
0
40
0
60
0
80
0
10
00-0.4
-0.2
0.0
0.2
0.4
0.6
0.8
1.0
Total Cloud cover/ Heating from the sun (oktas) (W/m2)
SS
T
dif
fere
nc
e
(C)
Night... Day...

Q “But what about satellites -nowadays don't they tell you
everything you need to know?
A NO!
..for example, for about 20 yearssatellite data have been used to
determine the SST over the globe...but when the Mount Pinatubo volcano
erupted in June 1991 large quantitiesof ash were thrown high into the
atmosphere...
.
..this ash cloud circled the tropics andcaused the satellite sensors to reportthat the tropical SST was suddenlyabout 1˚C colder than usual but theships and buoys showed that really theSST was about 0.5˚C warmer thanusual! The graph below shows that ittook a whole year for the satellitereadings to return to the correct value.So satellite data is always checkedagainst ship & drifting buoy data andcorrected as necessary before it isused.
.
There are other problems withsatellite data - satellites may not
measure storm force windscorrectly, some instruments cannot see through clouds or do not
provide values close to the seasurface.
Despite all the advances in spacetechnology we still need good
data from merchant ships!
Jun
91
Ju
l
Au
g
Se
p
Oc
t
No
v
De
c
Jan
92
Fe
b
Ma
r
Ap
r
Ma
y
Ju
n-1.0
-0.5
0.0
0.5
1.0
SS
T
dif
ere
nc
e
fro
m
no
rma
l (C
)
Ship and buoy datashow real SST
Uncorrected satellite datareads too lowdue to ash cloud
Corrected satellite data after checking against ships
Mount PinatuboVolcano erupts!
Effect of ash cloud
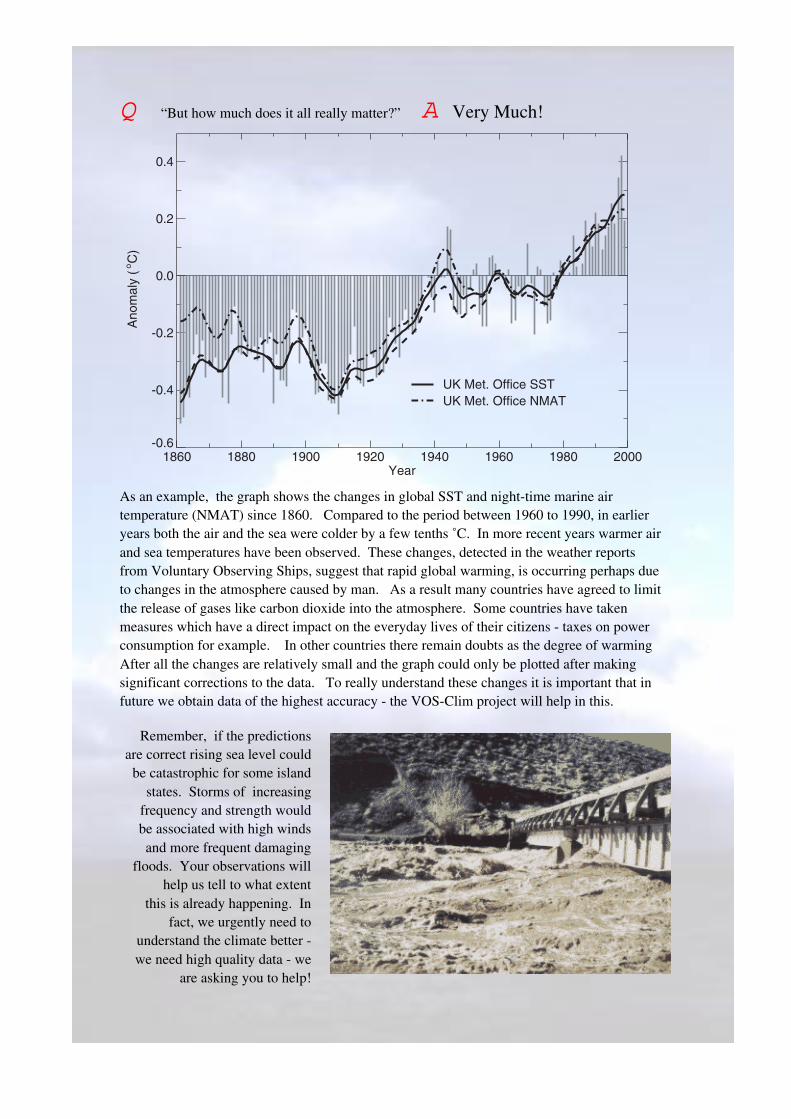
Q “But how much does it all really matter?” A Very Much!
1860 1880 1900 1920 1940 1960 1980 2000
Year
-0.6
-0.4
-0.2
0.0
0.2
0.4
Ano
mal
y (o
C)
UK Met. Office SSTUK Met. Office NMAT
As an example, the graph shows the changes in global SST and night-time marine airtemperature (NMAT) since 1860. Compared to the period between 1960 to 1990, in earlieryears both the air and the sea were colder by a few tenths ˚C. In more recent years warmer airand sea temperatures have been observed. These changes, detected in the weather reportsfrom Voluntary Observing Ships, suggest that rapid global warming, is occurring perhaps dueto changes in the atmosphere caused by man. As a result many countries have agreed to limitthe release of gases like carbon dioxide into the atmosphere. Some countries have takenmeasures which have a direct impact on the everyday lives of their citizens - taxes on powerconsumption for example. In other countries there remain doubts as the degree of warmingAfter all the changes are relatively small and the graph could only be plotted after makingsignificant corrections to the data. To really understand these changes it is important that infuture we obtain data of the highest accuracy - the VOS-Clim project will help in this.
Remember, if the predictionsare correct rising sea level could
be catastrophic for some islandstates. Storms of increasing
frequency and strength wouldbe associated with high windsand more frequent damaging
floods. Your observations willhelp us tell to what extent
this is already happening. Infact, we urgently need to
understand the climate better -we need high quality data - we
are asking you to help!
Q “I've been making marine weather observations for many years... so why are theyparticularly important now?”
A We have described how the marine weather observations from the past are providingvital information on the world's climate, and have highlighted the present increases in globaltemperatures. With improving understanding of the weather, more data from satellites, andimproved computer models to help in weather forecasting, there is now an emphasis onobtaining ever higher quality measurements over the ocean. The ships in the VOS-Climproject have been chosen as the ships which we believe can provide the high quality reportswhich we need.
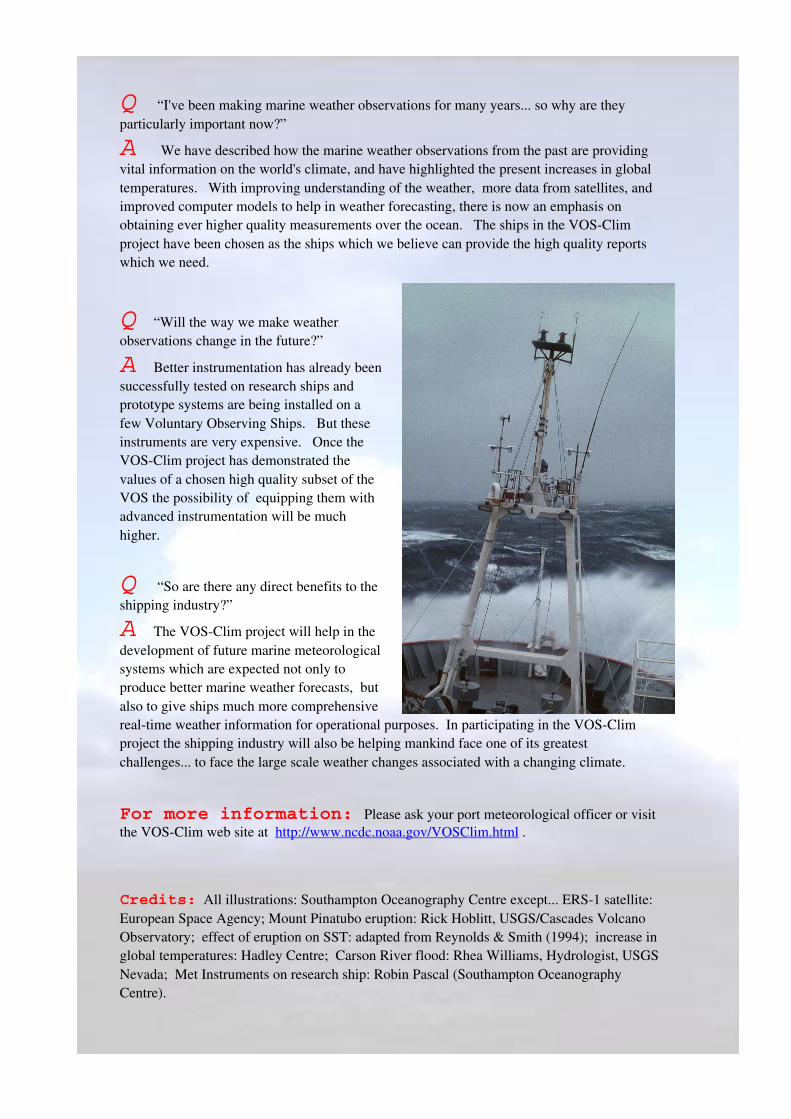
Q “Will the way we make weatherobservations change in the future?”
A Better instrumentation has already beensuccessfully tested on research ships andprototype systems are being installed on afew Voluntary Observing Ships. But theseinstruments are very expensive. Once theVOS-Clim project has demonstrated thevalues of a chosen high quality subset of theVOS the possibility of equipping them withadvanced instrumentation will be muchhigher.
Q “So are there any direct benefits to theshipping industry?”
A The VOS-Clim project will help in thedevelopment of future marine meteorologicalsystems which are expected not only toproduce better marine weather forecasts, butalso to give ships much more comprehensivereal-time weather information for operational purposes. In participating in the VOS-Climproject the shipping industry will also be helping mankind face one of its greatestchallenges... to face the large scale weather changes associated with a changing climate.
For more information: Please ask your port meteorological officer or visitthe VOS-Clim web site at http://www.ncdc.noaa.gov/VOSClim.html .
Credits: All illustrations: Southampton Oceanography Centre except... ERS-1 satellite:European Space Agency; Mount Pinatubo eruption: Rick Hoblitt, USGS/Cascades VolcanoObservatory; effect of eruption on SST: adapted from Reynolds & Smith (1994); increase inglobal temperatures: Hadley Centre; Carson River flood: Rhea Williams, Hydrologist, USGSNevada; Met Instruments on research ship: Robin Pascal (Southampton OceanographyCentre).