Embed Size (px)
Citation preview
2014 research in the UK retail and FMCG sectors
Alastair Campbell willwechange.com
What role do feelings, logic and managers’ behaviour play in making individuals change
their behaviour at work?
Why do we change?
© Alastair Campbell 2014 unless otherwise stated. All rights reserved
Summary
Development OpportunityIdea ResearchResearch quantified
the ‘tipping points’ for each indicator in success
There were some significant surprises
A simple 12 question survey tool can predict success or failure and highlight what to do
about it
Massively improve success rates in change by
repeating diagnostic to continually target investment
Easy and cheap to use, easy to act on and repeat to refine
results
Applicable in any sector
Cancer survival rates are being transformed by
using big data and open research to develop cheap and simple
diagnostics to spot cancer early and target treatment early. Why can’t we use similar
techniques to transform success rates in
organisational change?
Research on beliefs and feelings experienced in
successful change carried out by Jon Dean at Celebrate the Corners
and Alastair Campbell over 20 years
We tested these indicators quantitatively in 2014 with a large sample of UK participants from leading retail and FMCG
businesses
2

© Alastair Campbell 2014 unless otherwise stated. All rights reserved
Over 85 percent of all pancreatic cancers are diagnosed late, when someone has less than two percent chance of survival. How could this be? Jack Andraka developed a promising early detection test for pancreatic cancer that’s super cheap, effective and non-invasive — before his16th birthday. Making the test 100 times cheaper and simple makes early diagnosis possible, so survival radically improves…
From www.ted.com all rights reserved 3
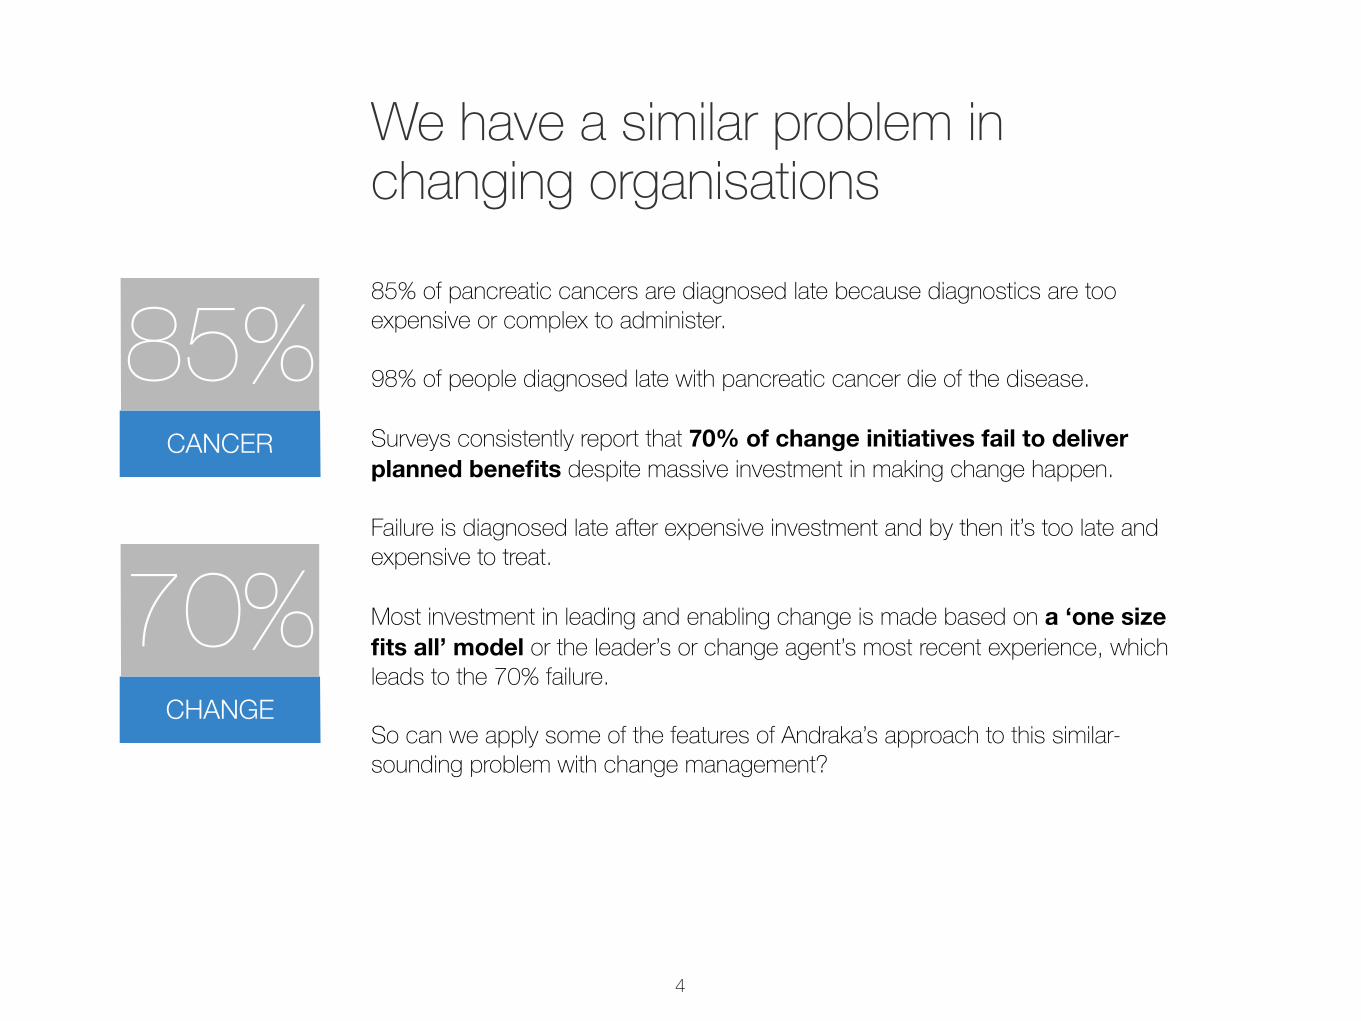
We have a similar problem in changing organisations
85% of pancreatic cancers are diagnosed late because diagnostics are too expensive or complex to administer. 98% of people diagnosed late with pancreatic cancer die of the disease.Surveys consistently report that 70% of change initiatives fail to deliver planned benefits despite massive investment in making change happen.Failure is diagnosed late after expensive investment and by then it’s too late and expensive to treat.Most investment in leading and enabling change is made based on a ‘one size fits all’ model or the leader’s or change agent’s most recent experience, which leads to the 70% failure. So can we apply some of the features of Andraka’s approach to this similar-sounding problem with change management?
CANCER
85%
CHANGE
70%
4
© Alastair Campbell 2014 unless otherwise stated. All rights reserved
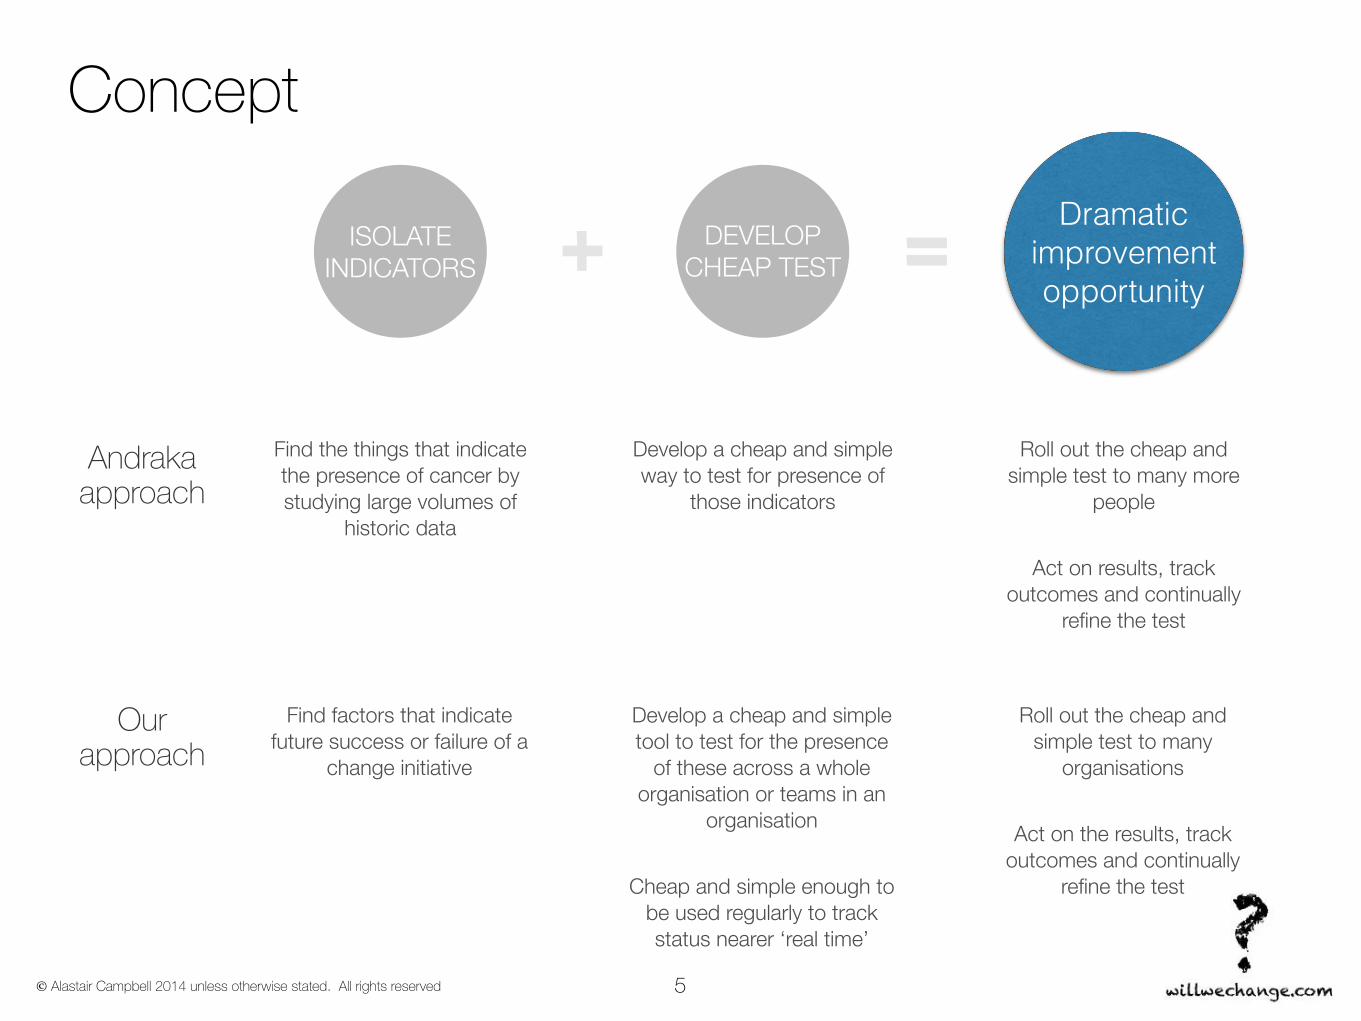
ISOLATE INDICATORS
DEVELOP CHEAP TEST
Dramatic improvement opportunity
Develop a cheap and simple way to test for presence of
those indicators
Andraka approach
Find the things that indicate the presence of cancer by studying large volumes of
historic data
Roll out the cheap and simple test to many more
people
Act on results, track outcomes and continually
refine the test
Develop a cheap and simple tool to test for the presence
of these across a whole organisation or teams in an
organisation
Cheap and simple enough to be used regularly to track status nearer ‘real time’
Our approach
Find factors that indicate future success or failure of a
change initiative
Roll out the cheap and simple test to many
organisations
Act on the results, track outcomes and continually
refine the test
Concept
5
© Alastair Campbell 2014 unless otherwise stated. All rights reserved
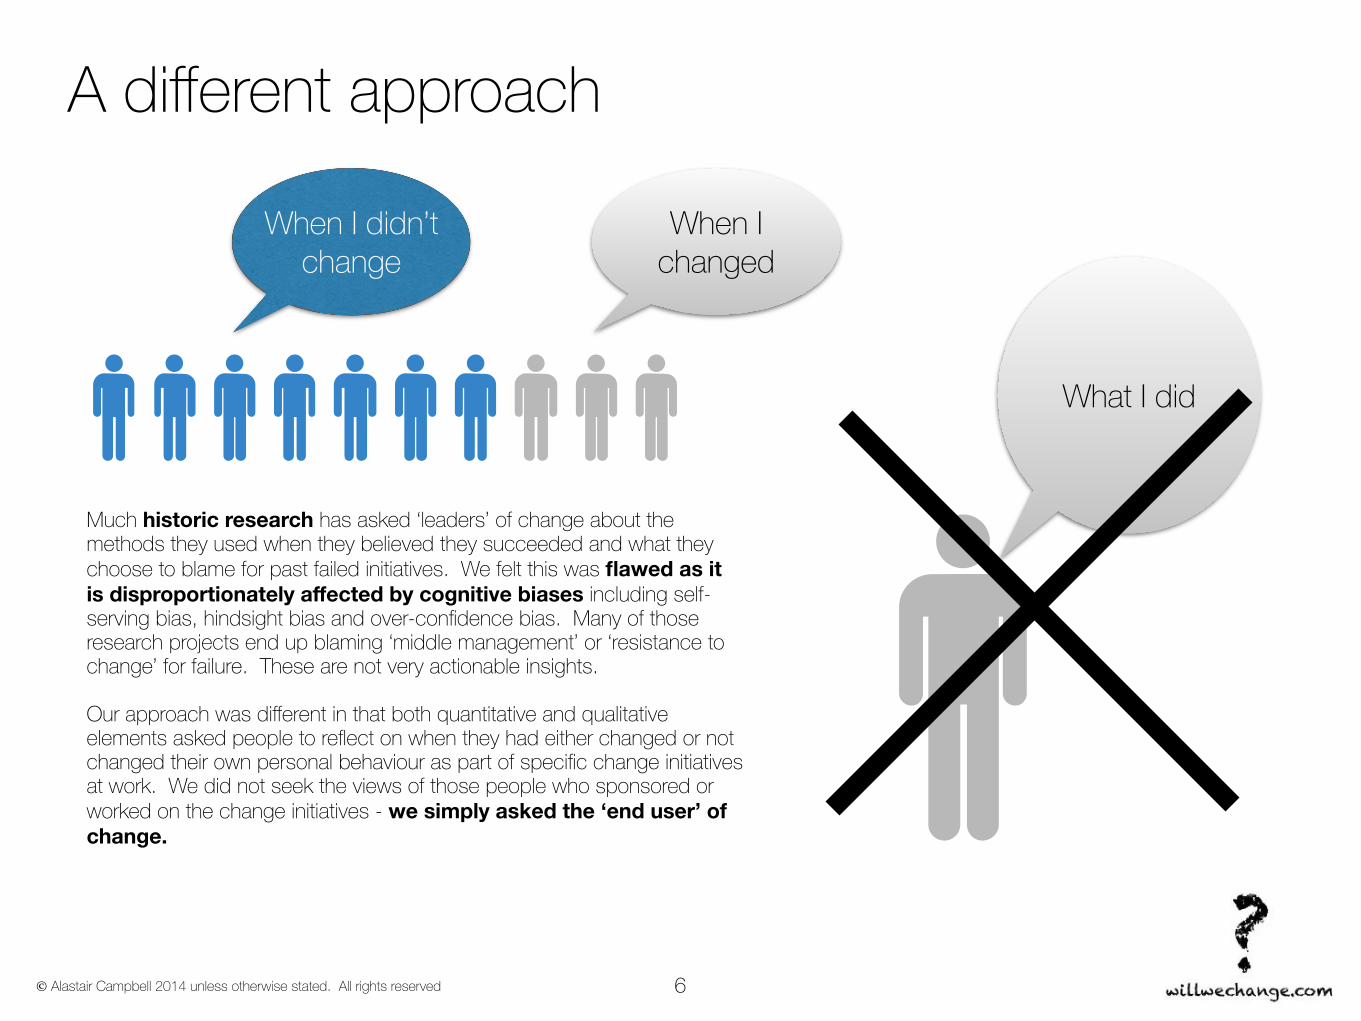
A different approach
6
When I didn’t change
When I changed
What I did
Much historic research has asked ‘leaders’ of change about the methods they used when they believed they succeeded and what they choose to blame for past failed initiatives. We felt this was flawed as it is disproportionately affected by cognitive biases including self-serving bias, hindsight bias and over-confidence bias. Many of those research projects end up blaming ‘middle management’ or ‘resistance to change’ for failure. These are not very actionable insights.
Our approach was different in that both quantitative and qualitative elements asked people to reflect on when they had either changed or not changed their own personal behaviour as part of specific change initiatives at work. We did not seek the views of those people who sponsored or worked on the change initiatives - we simply asked the ‘end user’ of change.
© Alastair Campbell 2014 unless otherwise stated. All rights reserved 7
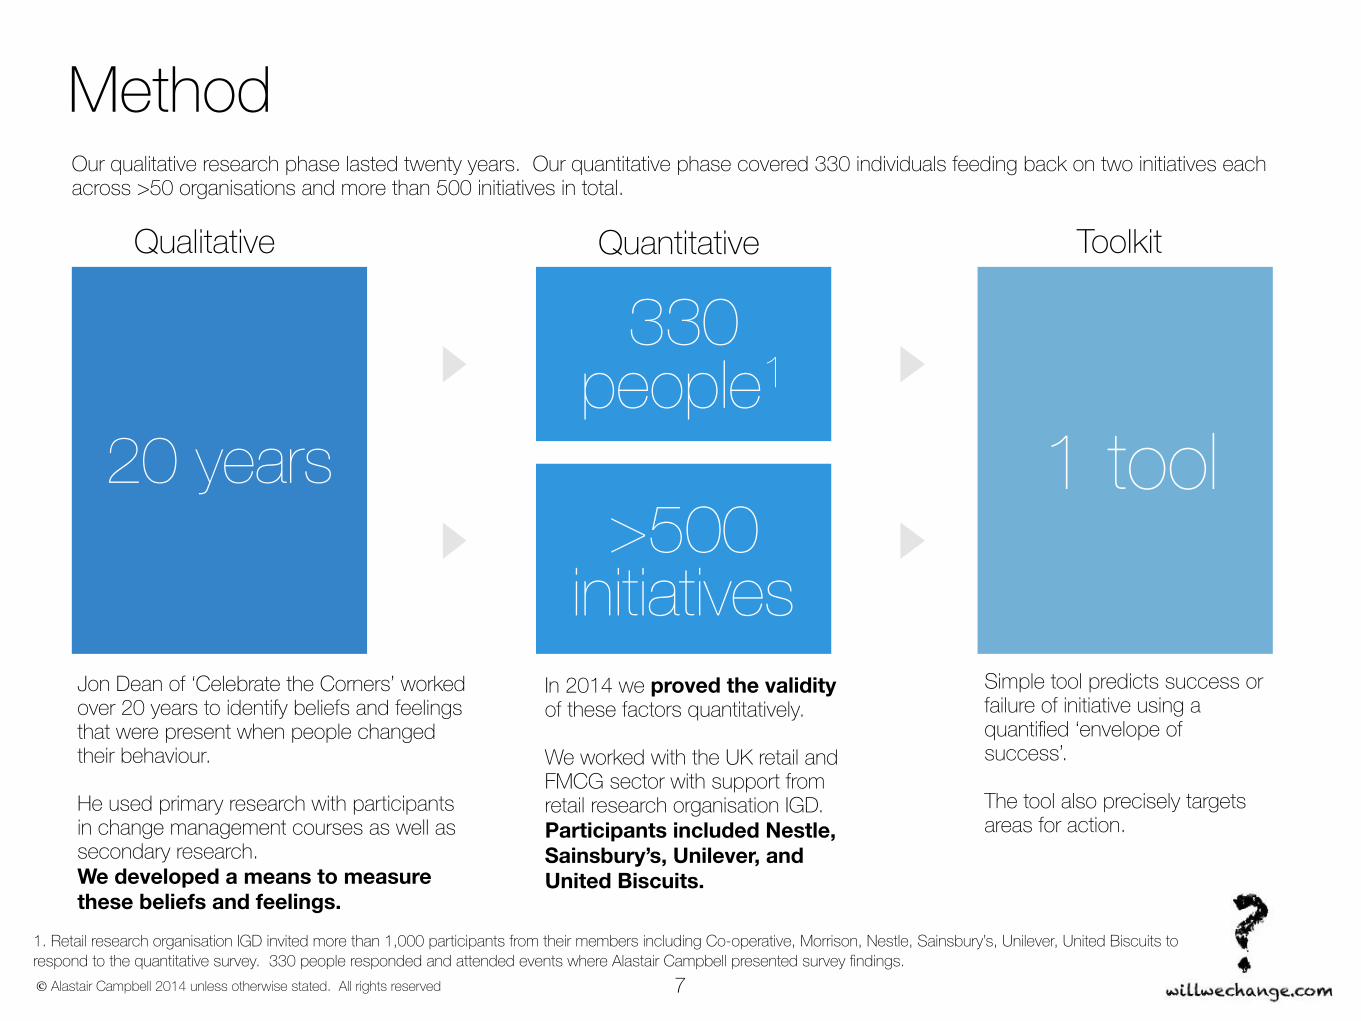
Qualitative
330 people1
1 tool20 years
Quantitative Toolkit
MethodOur qualitative research phase lasted twenty years. Our quantitative phase covered 330 individuals feeding back on two initiatives each across >50 organisations and more than 500 initiatives in total.
1. Retail research organisation IGD invited more than 1,000 participants from their members including Co-operative, Morrison, Nestle, Sainsbury’s, Unilever, United Biscuits to respond to the quantitative survey. 330 people responded and attended events where Alastair Campbell presented survey findings.
Jon Dean of ‘Celebrate the Corners’ worked over 20 years to identify beliefs and feelings that were present when people changed their behaviour.
He used primary research with participants in change management courses as well as secondary research. We developed a means to measure these beliefs and feelings.
In 2014 we proved the validity of these factors quantitatively.
We worked with the UK retail and FMCG sector with support from retail research organisation IGD. Participants included Nestle, Sainsbury’s, Unilever, and United Biscuits.
>500 initiatives
Simple tool predicts success or failure of initiative using a quantified ‘envelope of success’.
The tool also precisely targets areas for action.
© Alastair Campbell 2014 unless otherwise stated. All rights reserved
We found two kinds of factors predict success
8
What people see and believe about the change. This includes the factors
typically included in change methodologies
‘Hard’ beliefs FeelingsThe way people feel about their
involvement in the change. This was new.
© Alastair Campbell 2014 unless otherwise stated. All rights reserved
‘Hard’ beliefs
9
0%
20%
40%
60%
80%
100%
There is a clear need for the change
The right solution is being used to deliver
the change
The change was good and provided a fair
future for those impacted
The transition process was feasible
Leaders in the organisation
demonstrated their commitment to the
change through their own actions
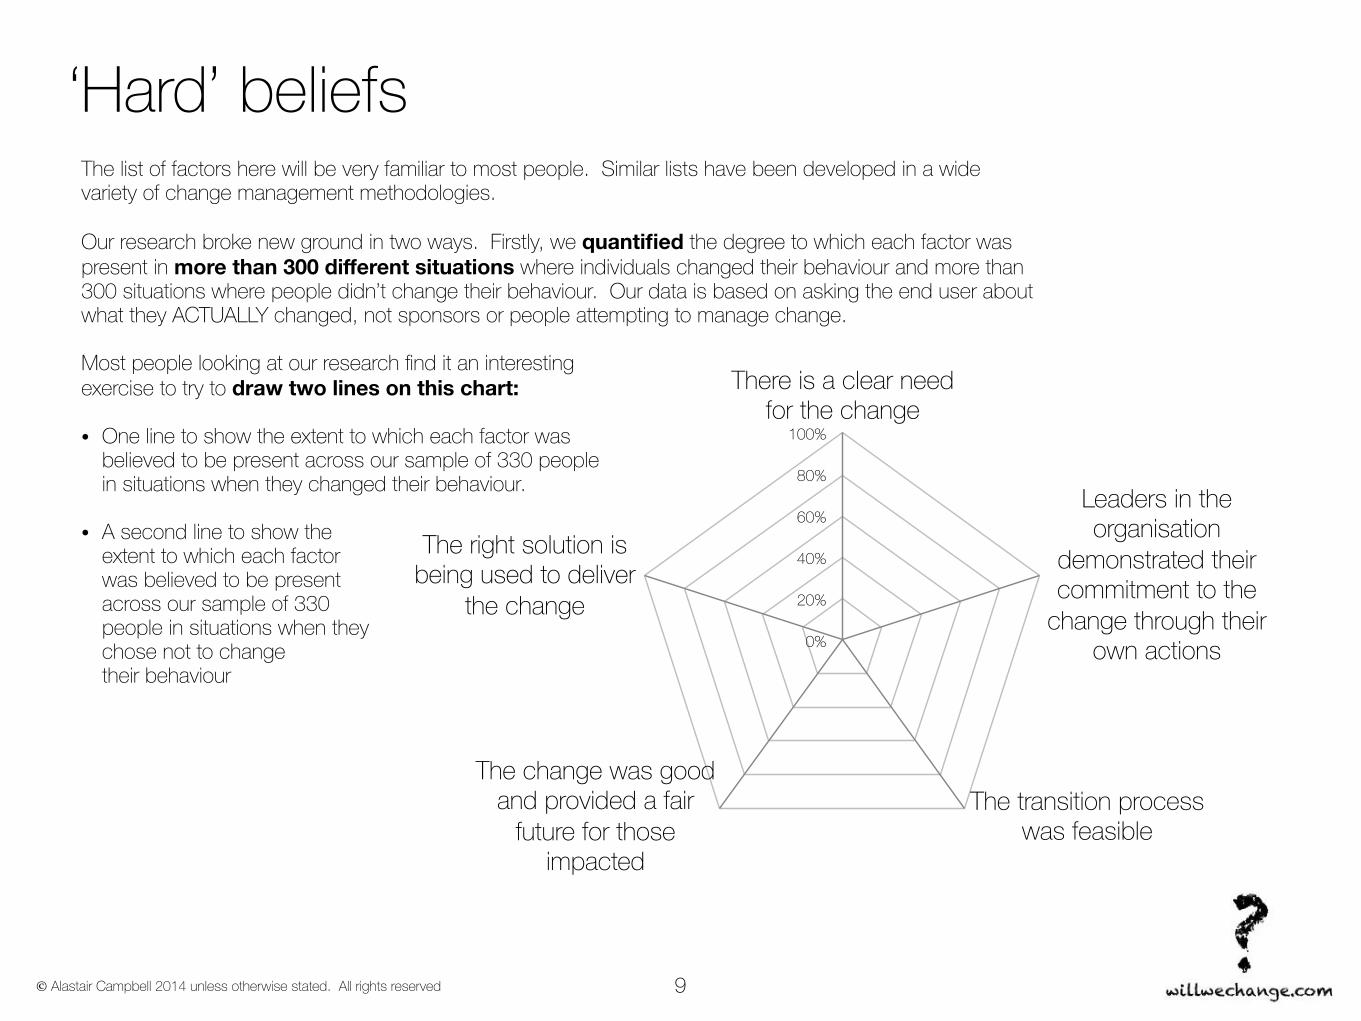
The list of factors here will be very familiar to most people. Similar lists have been developed in a wide variety of change management methodologies.
Our research broke new ground in two ways. Firstly, we quantified the degree to which each factor was present in more than 300 different situations where individuals changed their behaviour and more than 300 situations where people didn’t change their behaviour. Our data is based on asking the end user about what they ACTUALLY changed, not sponsors or people attempting to manage change.
Most people looking at our research find it an interesting exercise to try to draw two lines on this chart:
• One line to show the extent to which each factor was believed to be present across our sample of 330 people in situations when they changed their behaviour.
• A second line to show the extent to which each factor was believed to be present across our sample of 330 people in situations when theychose not to change their behaviour
© Alastair Campbell 2014 unless otherwise stated. All rights reserved
‘Hard’ beliefs quantified
10
0%
20%
40%
60%
80%
100%
There was a clear need for the change
The right solution was used to deliver
the change
The change was good and provided a fair future for those
impacted
Other
The transition process was
feasible
Leaders in the organisation
demonstrated their commitment to the
change through their own actions
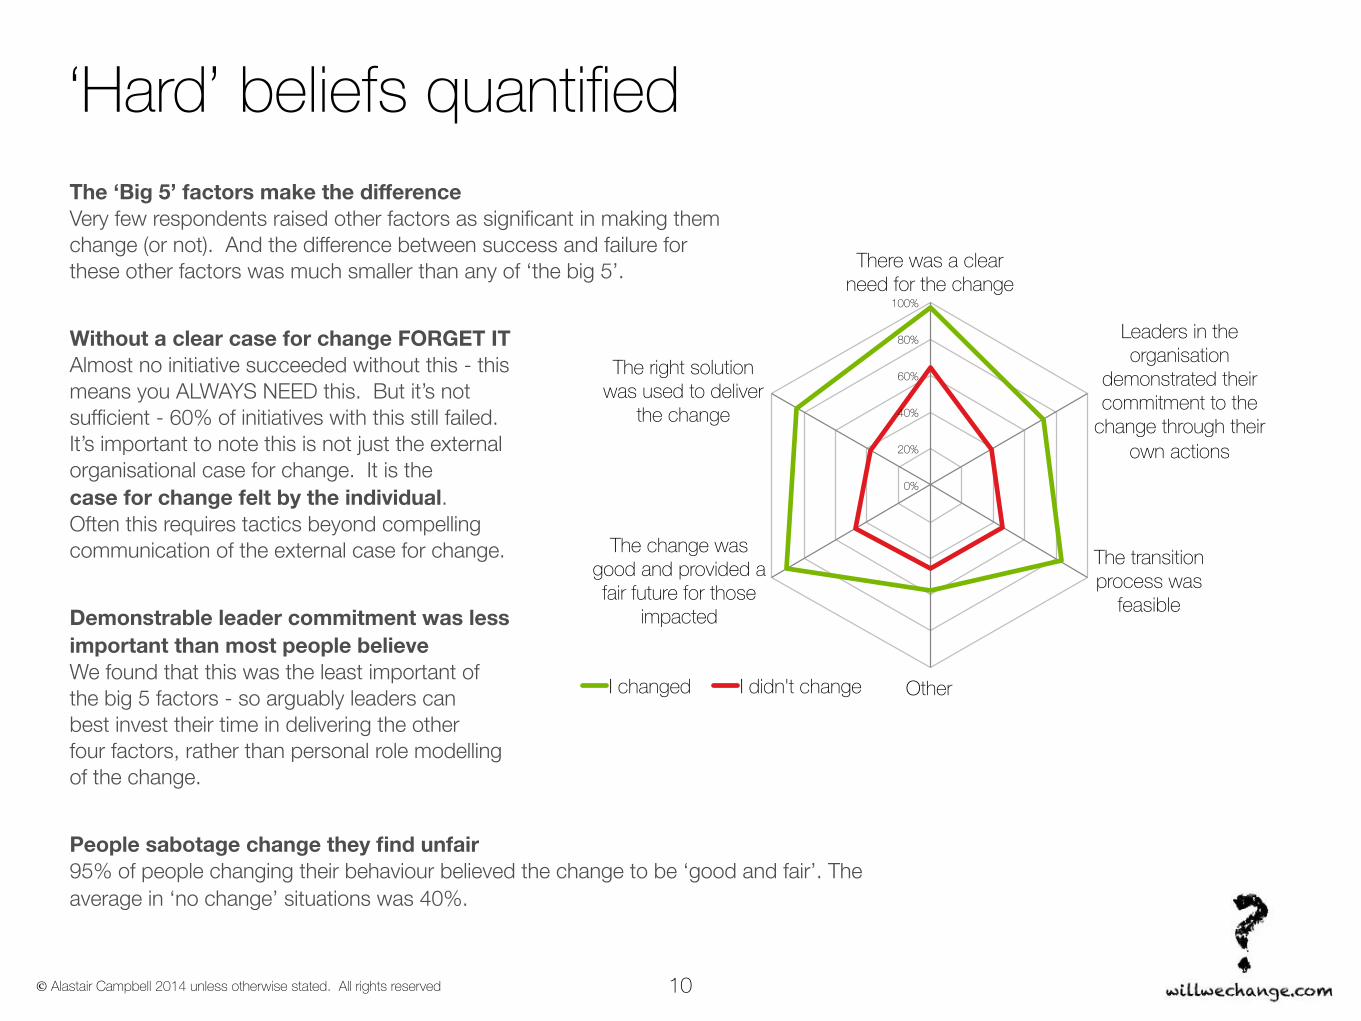
I changed I didn't change
The ‘Big 5’ factors make the difference Very few respondents raised other factors as significant in making them change (or not). And the difference between success and failure for these other factors was much smaller than any of ‘the big 5’.
Without a clear case for change FORGET ITAlmost no initiative succeeded without this - this means you ALWAYS NEED this. But it’s not sufficient - 60% of initiatives with this still failed. It’s important to note this is not just the external organisational case for change. It is the case for change felt by the individual. Often this requires tactics beyond compelling communication of the external case for change.
Demonstrable leader commitment was less important than most people believeWe found that this was the least important of the big 5 factors - so arguably leaders can best invest their time in delivering the other four factors, rather than personal role modelling of the change.
People sabotage change they find unfair95% of people changing their behaviour believed the change to be ‘good and fair’. The average in ‘no change’ situations was 40%.
© Alastair Campbell 2014 unless otherwise stated. All rights reserved
Feelings
11
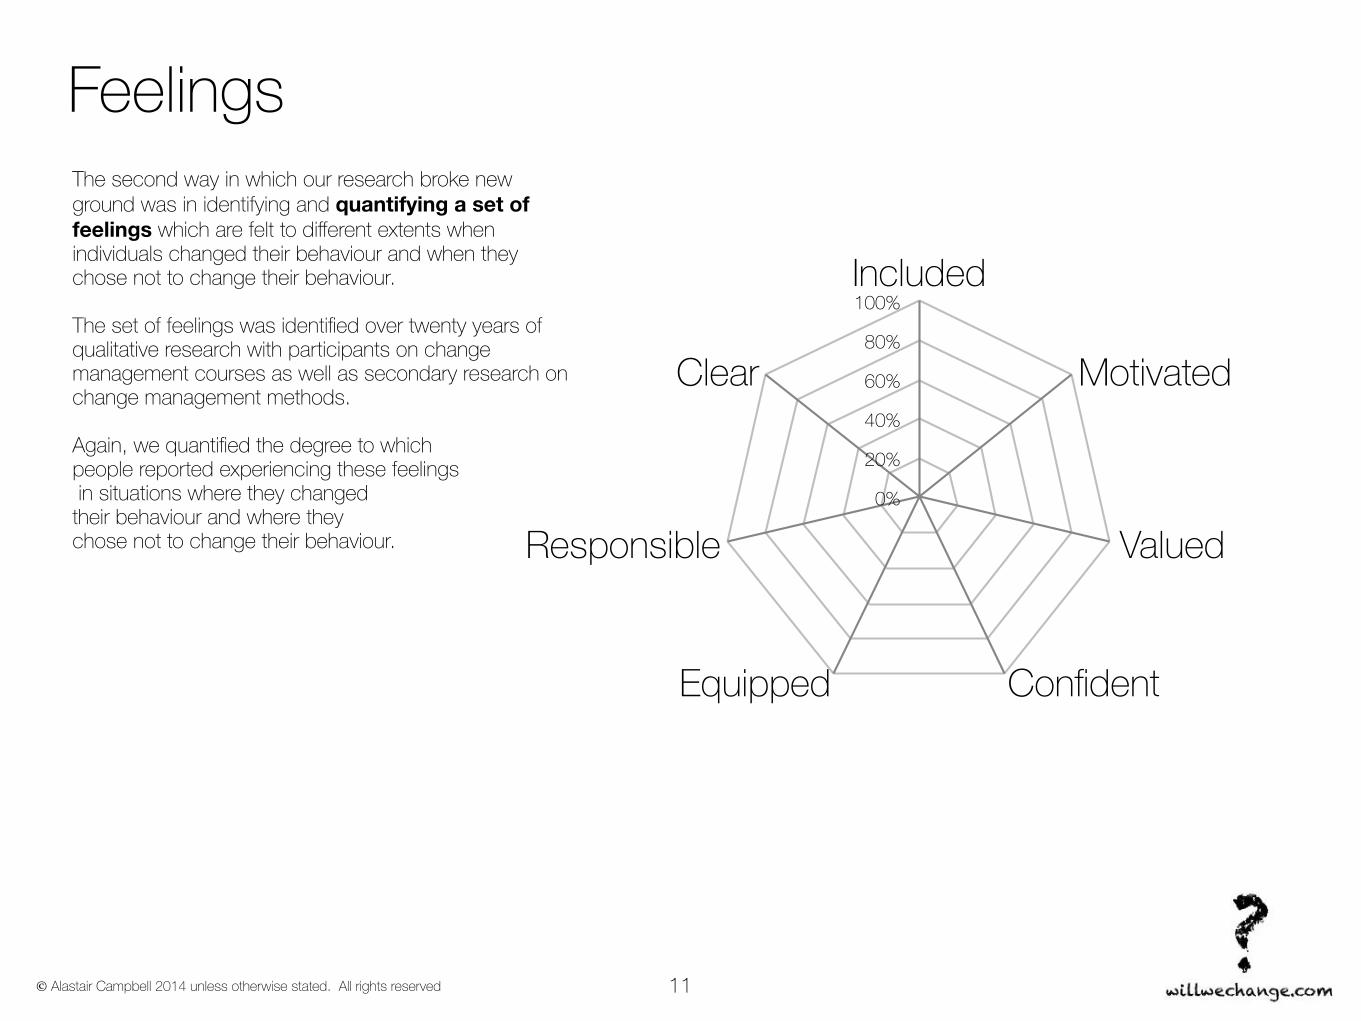
The second way in which our research broke new ground was in identifying and quantifying a set of feelings which are felt to different extents when individuals changed their behaviour and when they chose not to change their behaviour.
The set of feelings was identified over twenty years of qualitative research with participants on change management courses as well as secondary research on change management methods.
Again, we quantified the degree to which people reported experiencing these feelings in situations where they changed their behaviour and where they chose not to change their behaviour.
0%
20%
40%
60%
80%
100%Included
Clear
Responsible
Equipped Confident
Valued
Motivated
© Alastair Campbell 2014 unless otherwise stated. All rights reserved
Feelings quantified
12
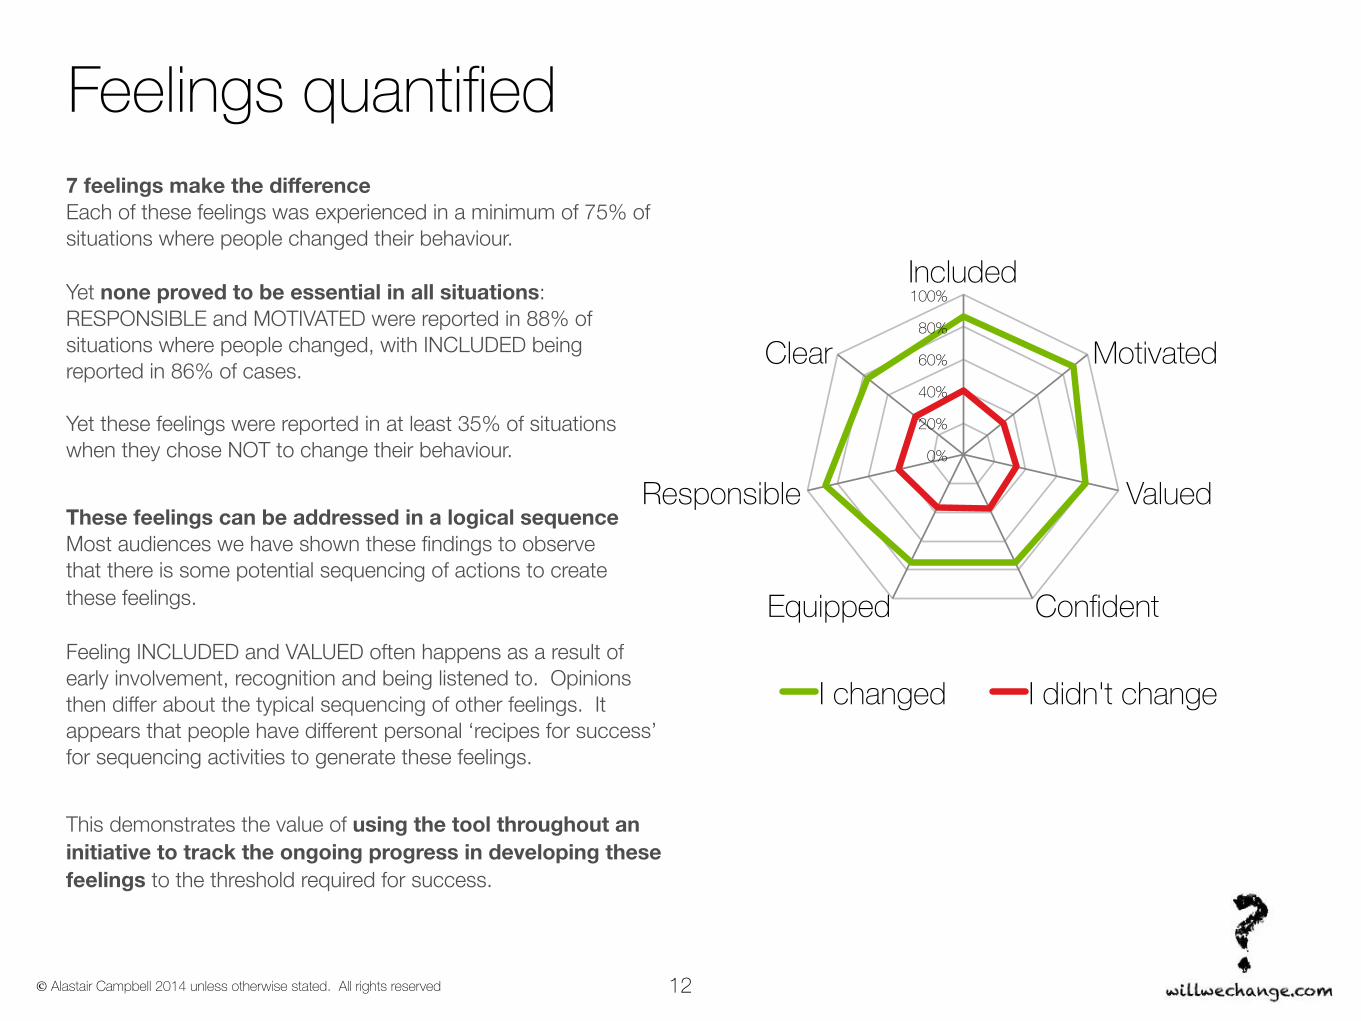
7 feelings make the differenceEach of these feelings was experienced in a minimum of 75% of situations where people changed their behaviour. Yet none proved to be essential in all situations: RESPONSIBLE and MOTIVATED were reported in 88% of situations where people changed, with INCLUDED being reported in 86% of cases. Yet these feelings were reported in at least 35% of situations when they chose NOT to change their behaviour.
These feelings can be addressed in a logical sequenceMost audiences we have shown these findings to observe that there is some potential sequencing of actions to create these feelings.Feeling INCLUDED and VALUED often happens as a result of early involvement, recognition and being listened to. Opinions then differ about the typical sequencing of other feelings. It appears that people have different personal ‘recipes for success’ for sequencing activities to generate these feelings.
This demonstrates the value of using the tool throughout an initiative to track the ongoing progress in developing these feelings to the threshold required for success.
0%
20%
40%
60%
80%
100%Included
Clear
Responsible
Equipped Confident
Valued
Motivated
I changed I didn't change
© Alastair Campbell 2014 unless otherwise stated. All rights reserved
A sample diagnostic: ‘Hard’ beliefs
13
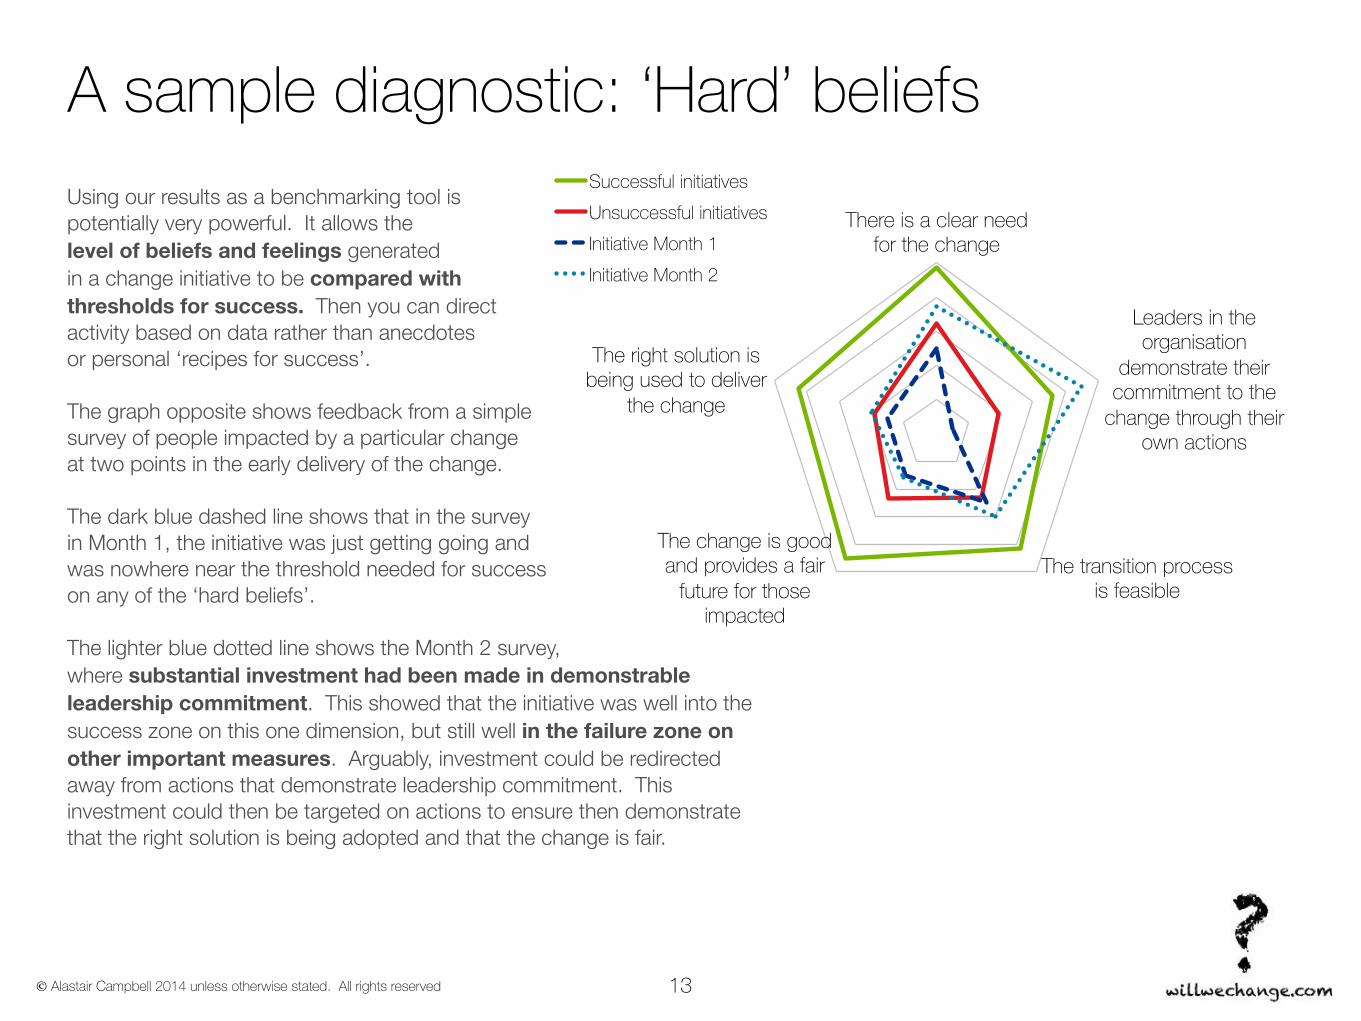
Using our results as a benchmarking tool is potentially very powerful. It allows the level of beliefs and feelings generated in a change initiative to be compared with thresholds for success. Then you can direct activity based on data rather than anecdotes or personal ‘recipes for success’. The graph opposite shows feedback from a simplesurvey of people impacted by a particular change at two points in the early delivery of the change. The dark blue dashed line shows that in the survey in Month 1, the initiative was just getting going and was nowhere near the threshold needed for success on any of the ‘hard beliefs’.The lighter blue dotted line shows the Month 2 survey, where substantial investment had been made in demonstrable leadership commitment. This showed that the initiative was well into the success zone on this one dimension, but still well in the failure zone on other important measures. Arguably, investment could be redirected away from actions that demonstrate leadership commitment. This investment could then be targeted on actions to ensure then demonstrate that the right solution is being adopted and that the change is fair.
There is a clear need for the change
The right solution is being used to deliver
the change
The change is good and provides a fair
future for those impacted
The transition process is feasible
Leaders in the organisation
demonstrate their commitment to the
change through their own actions
Successful initiativesUnsuccessful initiativesInitiative Month 1Initiative Month 2
© Alastair Campbell 2014 unless otherwise stated. All rights reserved
A sample diagnostic: Feelings
14
Included
Clear
Responsible
Equipped Confident
Valued
Motivated
Successful initiatives
Unsuccessful initiatives
Initiative 1
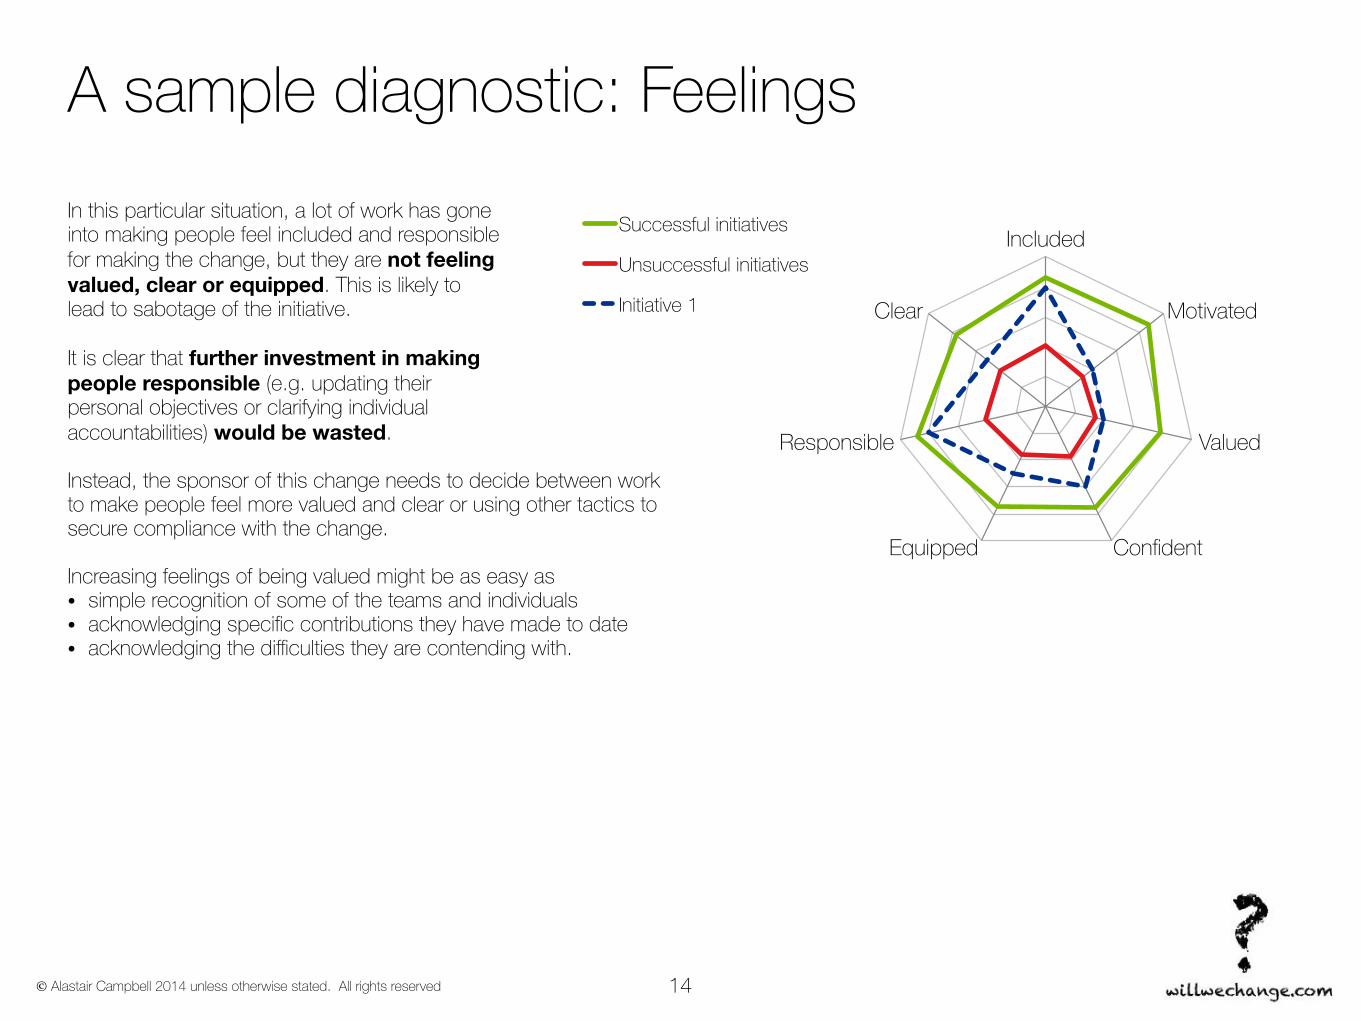
In this particular situation, a lot of work has gone into making people feel included and responsible for making the change, but they are not feeling valued, clear or equipped. This is likely to lead to sabotage of the initiative. It is clear that further investment in making people responsible (e.g. updating their personal objectives or clarifying individual accountabilities) would be wasted. Instead, the sponsor of this change needs to decide between work to make people feel more valued and clear or using other tactics to secure compliance with the change.
Increasing feelings of being valued might be as easy as • simple recognition of some of the teams and individuals • acknowledging specific contributions they have made to date • acknowledging the difficulties they are contending with.
© Alastair Campbell 2014 unless otherwise stated. All rights reserved
Simple traffic light ‘envelope of success’
15
0%
20%
40%
60%
80%
100%
There was a clear need for the change
The right solution was used to deliver
the change
The change was good and provided a fair future for those
impacted
Other
The transition process was
feasible
Leaders in the organisation
demonstrated their commitment to the
change through their own actions
I changed I didn't change
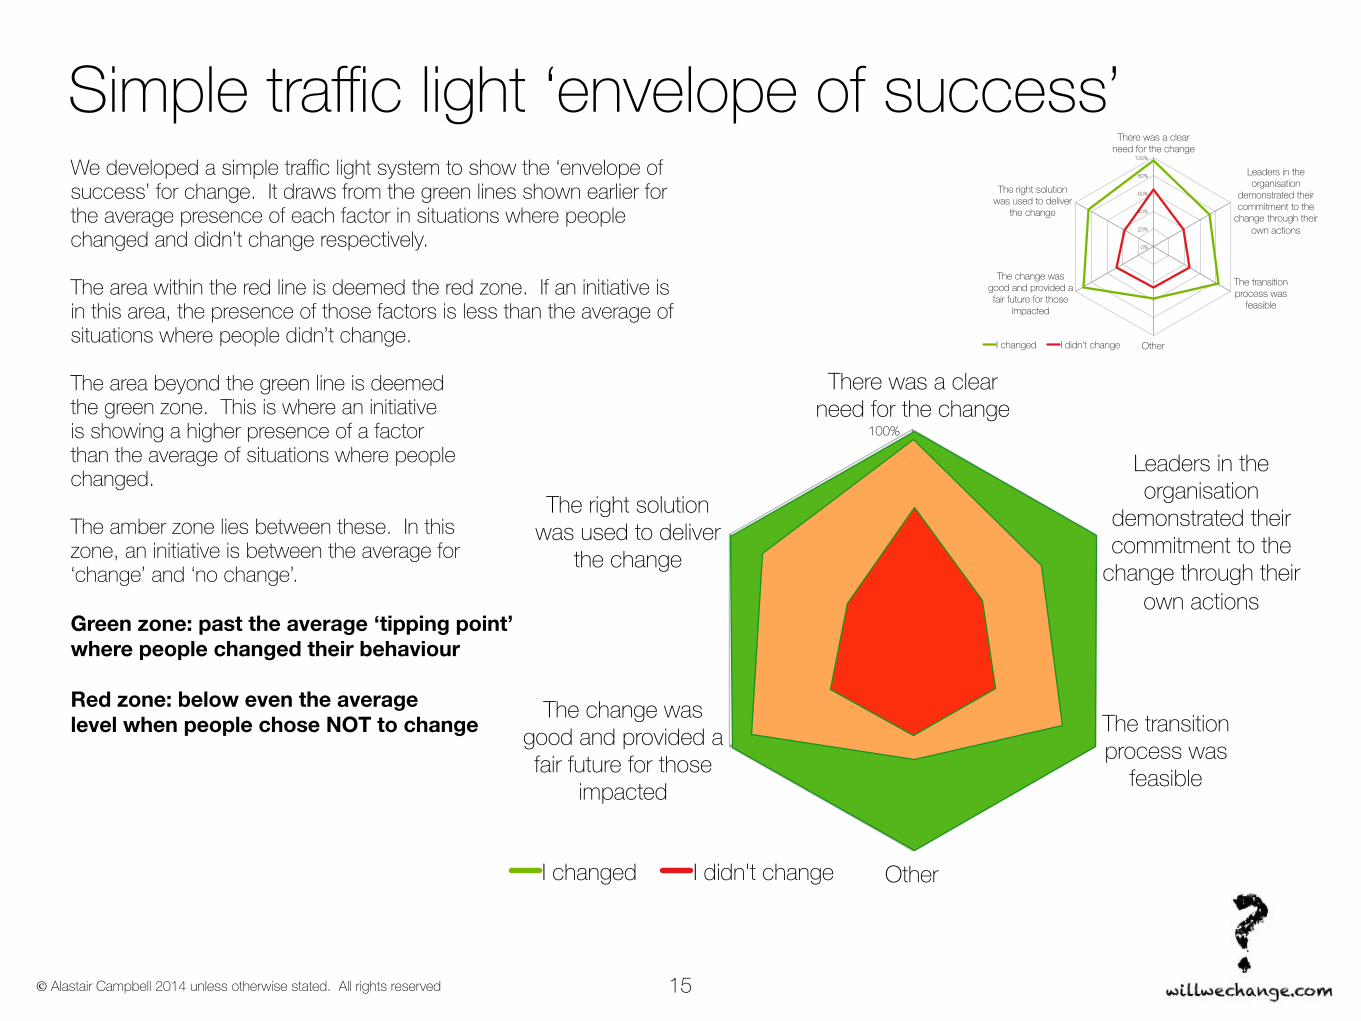
We developed a simple traffic light system to show the ‘envelope of success’ for change. It draws from the green lines shown earlier for the average presence of each factor in situations where people changed and didn’t change respectively.The area within the red line is deemed the red zone. If an initiative is in this area, the presence of those factors is less than the average of situations where people didn’t change.
The area beyond the green line is deemed the green zone. This is where an initiative is showing a higher presence of a factor than the average of situations where people changed.
The amber zone lies between these. In this zone, an initiative is between the average for ‘change’ and ‘no change’.
Green zone: past the average ‘tipping point’ where people changed their behaviour
Red zone: below even the average level when people chose NOT to change
0%
20%
40%
60%
80%
100%
There was a clear need for the change
The right solution was used to deliver
the change
The change was good and provided a fair future for those
impacted
Other
The transition process was
feasible
Leaders in the organisation
demonstrated their commitment to the
change through their own actions
I changed I didn't change
© Alastair Campbell 2014 unless otherwise stated. All rights reserved
A sample dashboard
16
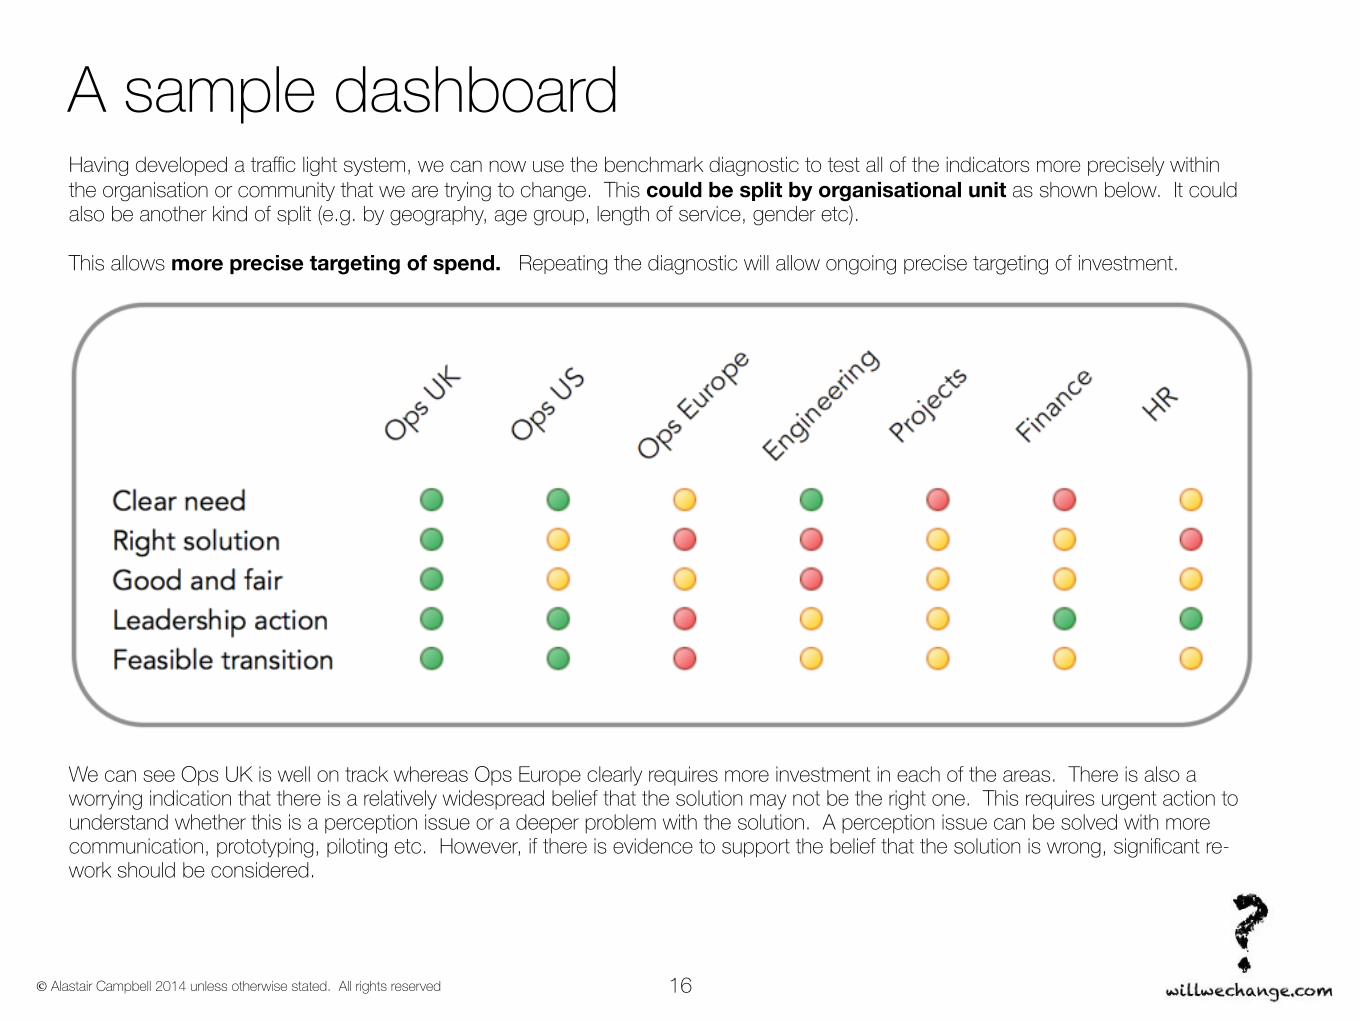
Having developed a traffic light system, we can now use the benchmark diagnostic to test all of the indicators more precisely within the organisation or community that we are trying to change. This could be split by organisational unit as shown below. It could also be another kind of split (e.g. by geography, age group, length of service, gender etc).
This allows more precise targeting of spend. Repeating the diagnostic will allow ongoing precise targeting of investment.
We can see Ops UK is well on track whereas Ops Europe clearly requires more investment in each of the areas. There is also a worrying indication that there is a relatively widespread belief that the solution may not be the right one. This requires urgent action to understand whether this is a perception issue or a deeper problem with the solution. A perception issue can be solved with more communication, prototyping, piloting etc. However, if there is evidence to support the belief that the solution is wrong, significant re-work should be considered.
© Alastair Campbell 2014 unless otherwise stated. All rights reserved
Summary
17
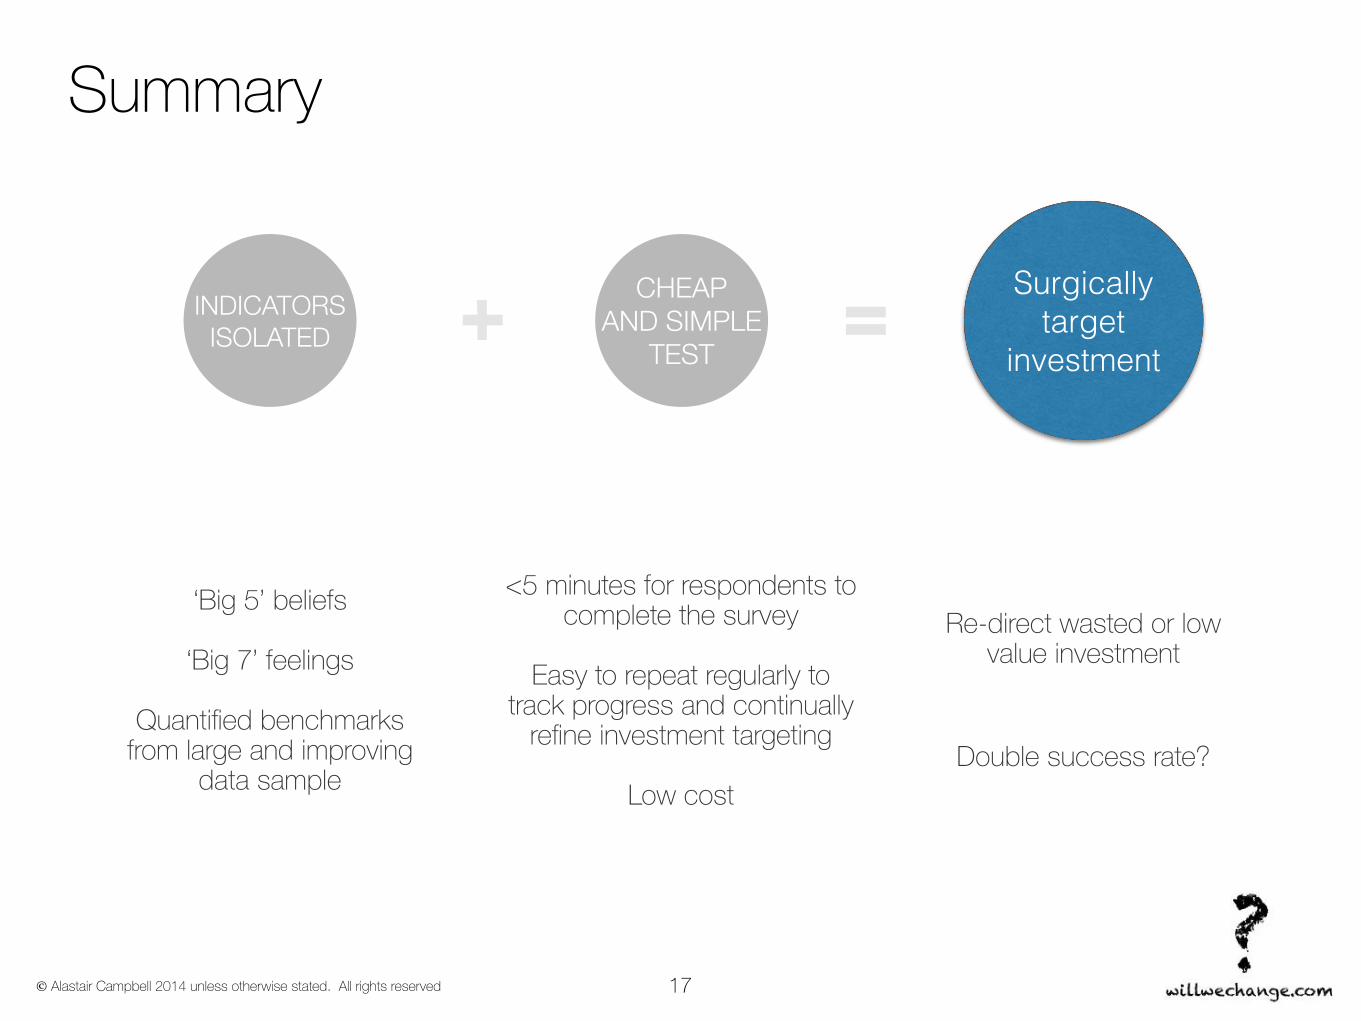
INDICATORS ISOLATED
CHEAP AND SIMPLE
TEST
Surgically target
investment
<5 minutes for respondents to complete the survey
Easy to repeat regularly to
track progress and continually refine investment targeting
Low cost
‘Big 5’ beliefs
‘Big 7’ feelings
Quantified benchmarks from large and improving
data sample
Re-direct wasted or low value investment
Double success rate?
© Alastair Campbell 2014 unless otherwise stated. All rights reserved
Summary
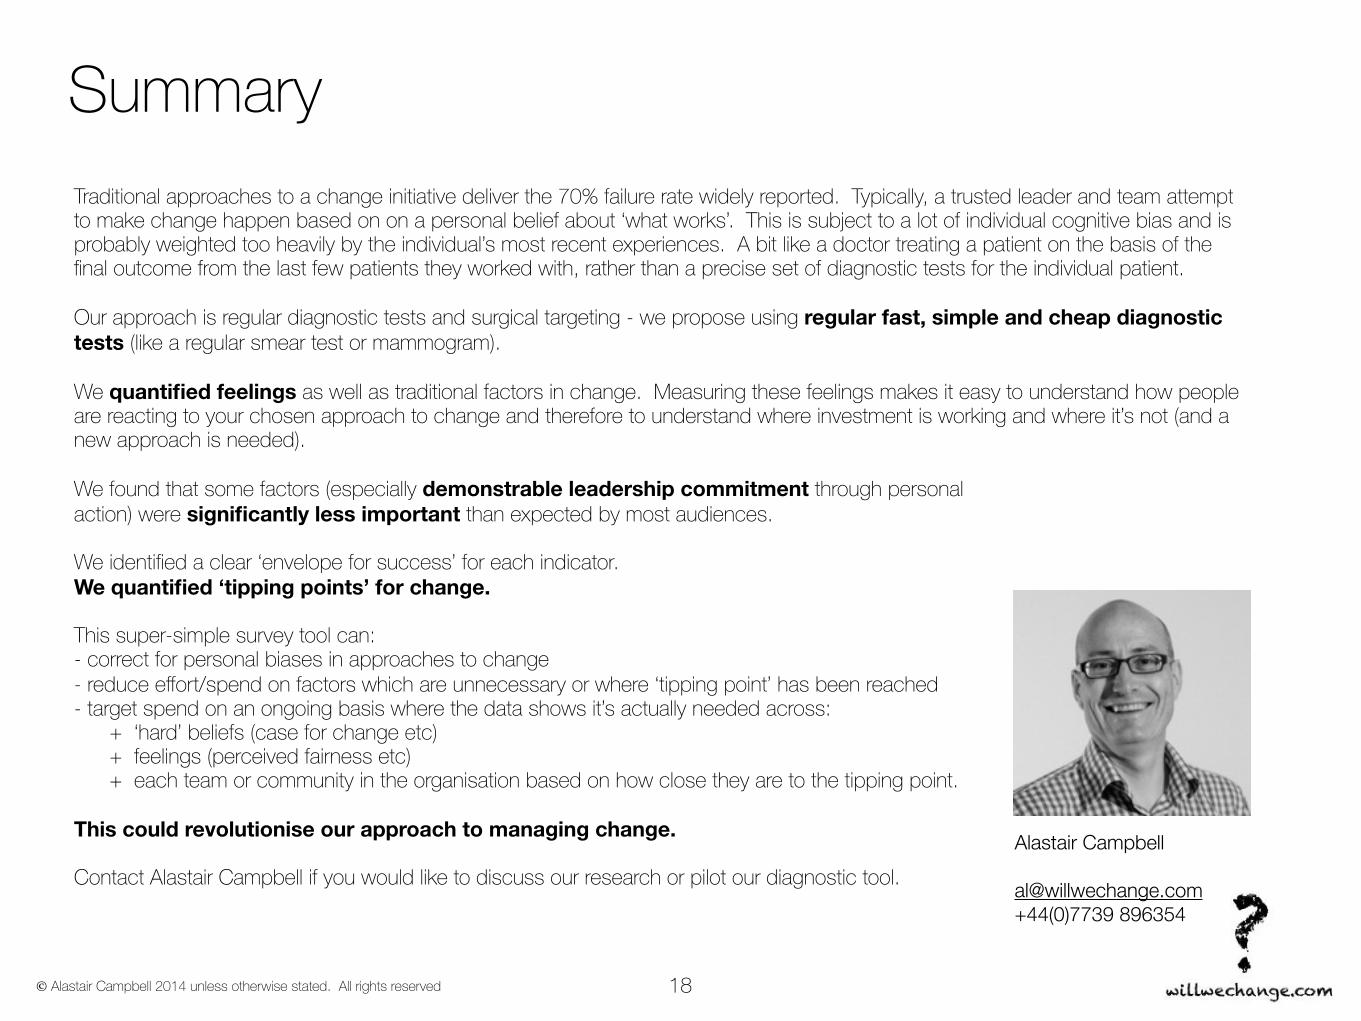
Alastair Campbell
[email protected] +44(0)7739 896354
Traditional approaches to a change initiative deliver the 70% failure rate widely reported. Typically, a trusted leader and team attempt to make change happen based on on a personal belief about ‘what works’. This is subject to a lot of individual cognitive bias and is probably weighted too heavily by the individual’s most recent experiences. A bit like a doctor treating a patient on the basis of the final outcome from the last few patients they worked with, rather than a precise set of diagnostic tests for the individual patient. Our approach is regular diagnostic tests and surgical targeting - we propose using regular fast, simple and cheap diagnostic tests (like a regular smear test or mammogram). We quantified feelings as well as traditional factors in change. Measuring these feelings makes it easy to understand how people are reacting to your chosen approach to change and therefore to understand where investment is working and where it’s not (and a new approach is needed). We found that some factors (especially demonstrable leadership commitment through personal action) were significantly less important than expected by most audiences. We identified a clear ‘envelope for success’ for each indicator. We quantified ‘tipping points’ for change.This super-simple survey tool can:- correct for personal biases in approaches to change - reduce effort/spend on factors which are unnecessary or where ‘tipping point’ has been reached - target spend on an ongoing basis where the data shows it’s actually needed across: + ‘hard’ beliefs (case for change etc) + feelings (perceived fairness etc) + each team or community in the organisation based on how close they are to the tipping point. This could revolutionise our approach to managing change. Contact Alastair Campbell if you would like to discuss our research or pilot our diagnostic tool.
18