Embed Size (px)
Citation preview

January 2012, Number 12-2
WHY DO STATE DISABILITY APPLICATION
RATES VARY OVER TIME?
By Norma B. Coe, Kelly Haverstick, Alicia H. Munnell, and Anthony Webb*
* Norma B. Coe is associate director for research at the Center for Retirement Research at Boston College (CRR). Kelly Haverstick is a former CRR research economist. Alicia H. Munnell is director of the CRR and the Peter F. Drucker Profes-sor in Management Sciences at Boston College’s Carroll School of Management. Anthony Webb is a research economist at the CRR. This brief is the second of two adapted from a longer paper (Coe et al. 2011).
Introduction Social Security Disability Insurance (SSDI) applica-tions and benefit receipts vary greatly by state, which has led to concerns about potential inconsistencies in the way that states apply disability standards.1 An earlier brief concluded that more than 70 percent of the variation across states in SSDI application rates is explained by state health, demographic, and employ-ment characteristics; state policies and politics explain very little.2 Another concern has been the growth in the SSDI program over time. This brief uses the same data as the earlier analysis to answer a related ques-tion: How much of the trends in SSDI application rates within states can be explained by the different factors?
The discussion proceeds as follows. The first section provides background on the variation in SSDI application rates within states over time. The second recaps the model and the variables. The third section reports the results for a state and year fixed-effects model that identifies the changes within states that affect the SSDI application rates over time. To better understand the results, it also estimates equations for two types of SSDI applicants – those who apply to SSDI alone and lower-income individuals who apply concurrently to SSDI and Supplemental Security In-
come (SSI). The key finding is that when states limit the ability of insurance companies to price coverage based on an individual’s characteristics (“community rating”) and to deny coverage (“guaranteed issue”), SSDI application rates decline. This provocative re-sult merits further exploration because it implies that health care reform, such as the Affordable Care Act, could have spill-over effects to the SSDI program.
Trends in Disability Rates Within StatesThe earlier brief found substantial variation in SSDI application rates across states, with average rates ranging from 0.5 percent in Utah to 1.4 percent in Mississippi over the 1993-2009 period.3 This brief concentrates on changes in application rates over time within states. These variations tend to be less dramatic than the differences across states, which is not surprising as many of the health, demographic, and employment factors found to be influential in ex-plaining variations across states do not change rapidly
R E S E A R C HRETIREMENT

Center for Retirement Research2
over time. Figure 1 shows trends in SSDI applica-tion rates for a select group of states and the national average. Ohio had the highest growth rate during the period; after dipping initially, its application rate rose from 0.6 percent in 1998 to 1.1 percent in 2009. New York exhibited the lowest growth rate (one of seven states with a negative growth rate), with its applica-tion rate dropping from 0.9 percent to 0.8 percent over the period. The other two states are included to show the overall boundaries in application rate levels, as Mississippi tends to have the highest rate and Utah the lowest rate.
Figure 1. Total SSDI Application Rates of Selected States, 1993-2009
Source: Authors’ calculations.
0.0%
0.5%
1.0%
1.5%
2.0%
1993 1995 1997 1999 2001 2003 2005 2007 2009
MS NY OH UT Average
The VariablesThe data are grouped in three main categories: 1) health, demographic, and employment characteris-tics; 2) state policies; and 3) state politics. All data cover the period 1993-2009 for the 50 states and the District of Columbia.4
The dependent variable is the annual SSDI appli-cation rate by state, expressed as a percentage of the state’s working-age population (age 18-64) not receiv-ing SSDI benefits.5 The explanatory variables were originally used to explain variation in SSDI applica-tion rates across states and would be expected to have a similar impact on variation within states over time.
Health, Demographic, and Employment Characteristics
Three state-level health variables would all be expect-ed to increase SSDI application rates. These variables come from the Center for Disease Control’s Behav-ioral Risk Factor Surveillance Survey (BRFSS).6 The variables are:
• self-reported fair/poor health status;• smoking (ever smoked more than 100 ciga-
rettes); and • self-reported body mass index (BMI).
Other important factors that could influence SSDI applications are the socioeconomic composition and employability of potential applicants. Variables in the analysis include:
• Age of the population. Younger populations are less likely to be insured by SSDI and less likely to have a disability that warrants an ap-plication.7 Individuals age 50 plus face a dif-ferent screening process, in which it is easier to be accepted, so a state with a relatively older population would be expected to have a higher SSDI application rate.8
• Education. States with a higher proportion of their population with higher education would be expected to have lower SSDI application rates. The effect of low education is ambigu-ous. Individuals with less than a high school degree may be the most vulnerable, but also may not have enough steady work history to be insured under SSDI.
• White, non-Hispanic. The impact of race is ambiguous. States with a higher proportion of non-Hispanic whites could be expected to have lower rates of SSDI applications, because non-whites are more vulnerable. Or whites could have higher application rates because they are more likely to have steady job histo-ries that enable them to qualify for SSDI.
• Male. States with a higher proportion of males would be expected to have higher SSDI application rates due to their higher rates of labor force participation.

Issue in Brief 3
• Married. States with a higher proportion of married residents would be expected to have lower SSDI application rates since married people tend to be healthier.
• Poor. States with a higher proportion of their population under the federal poverty line would be expected to have higher SSDI ap-plication rates.
Variations over time in employment character-istics and unemployment are expected to be associ-ated with differences in SSDI application rates. The variables include:
• Occupation and industry. The greater the proportion of a state’s workforce employed in a blue-collar occupation or an agricultural industry, the higher the expected SSDI ap-plication rate.
• Unemployment rate. Because greater unem-ployment lowers the opportunity cost of apply-ing for SSDI, higher unemployment should lead to more applications.
• Labor force participation rate. Discouraged workers may drop out of the labor force. So the lower the labor force participation rate, the higher the expected application rate.
State Policy
State policies with respect to unemployment insur-ance and health programs could also affect applica-tion rates.9 The variables include:
• Maximum weeks of unemployment insurance (UI). The longer the duration of UI, the lower the expected SSDI application rate.
• UI benefits/average wage. The higher the ratio, the lower the expected SSDI application rate.
• Strict regulation of private insurance mar-ket.10 States are defined as strictly regulated if they have both community rating and guaran-teed issue.11 The effect of health care access on the SSDI application rate is theoretically ambiguous. On the one hand, individuals with access to health insurance might be more likely to apply for SSDI because they would be less likely to go uninsured during the two-year waiting period for Medicare coverage.12 On the other hand, individuals might be less likely to apply for SSDI benefits because Medicare coverage is relatively less attractive when they can obtain health insur-ance elsewhere.
• Medicaid buy-in. States with a Medicaid buy-in program have less strict earnings qualifi-cations for Medicaid eligibility for disabled individuals who work, allowing better access to health insurance outside of the SSDI program.13 Medicaid buy-in programs are expected to have lower SSDI application rates.
State Politics
Due to concerns that state politics could influence the administration of this federal program, three variables are included to test whether the governor’s party affili-ation or tenure in the job appear to have any influence on application rates. The variables are:
• governor’s party affiliation;• an indicator for reaching the term limit; and • an indicator for an incumbent governor.14
The ResultsIn order to explain the variation over time within a state, the analysis estimates a regression equation relating state SSDI application rates over the period 1993-2009 to health/demographic/employment variables, state policies, and political factors. The equation includes a variable for each state in order to isolate the factors affecting within-state changes. The results include the impact on the total SSDI applica-tion rate as well as its two components – SSDI-only and SSDI-SSI concurrent applications – to see if these two sub-populations respond in the same way to dif-ferent state characteristics or policies.
Much variation is lost in a state fixed-effects model, so significantly fewer of the variables have a statistically significant effect on applications than in the prior analysis of variation across states.15 For example, the percent of the state’s population in fair/poor health does not change noticeably over a 17-year period, so health does not explain any change in the application rate within a state even though it was an important explanatory variable for variation across states. However, despite the loss in variation on health and demographic variables, the variation within a state on some of the policy variables remains. For example, a number of states made changes to their health insurance regulations during the time period studied, which could influence application rates.16

Effect of Health, Demographic, and Employment Variables
For the health, demographic, and employment vari-ables, the story that emerges is primarily a cyclical one. That is, the variables that change materially over the period 1993-2009 are those related to the strength of the economy. For total SSDI applications, both the unemployment rate and the labor force participation rate have a statistically significant effect (see Figure 2).17 Interestingly, the effect of these two variables differs between the two sub-populations of applicants. The labor force participation rate has a statistically significant effect on SSDI-only applications, whereas the unemployment rate affects poor individuals who apply concurrently for SSDI and SSI.
A few demographic variables are also statistically significant. Both low- and high-educational attain-ment are negatively related to total SSDI applications, driven by the concurrent SSDI-SSI applicants. Those with less than a high school degree tend to be less consistently attached to the labor market, so increas-ing the percent of the population with less than a high school degree means fewer people are insured for SSDI. On the other side of the spectrum, as expected, increasing the proportion of the population with a post-graduate education also decreases the applica-tion rate. The results also show that increasing the
proportion of non-Hispanic whites and non-married individuals is positively associated with SSDI-only ap-plications. This effect probably indicates that race is important in acquiring the steady job history required for SSDI eligibility, as is not having other sources of economic support within the household.
Effect of State Policy Variables
In terms of state policies, the variable that matters for within-state changes in SSDI applications is “strict regulation” of the health insurance industry. The coefficient is negative, suggesting that regulation reduces application rates. The specific reason for this effect is unclear, but perhaps the ability to obtain private health coverage makes the Medicare coverage associated with SSDI less attractive. This effect holds for both the SSDI-only and the SSDI-SSI applications.
Effect of State Politics Variables
As was the case in variation across states, a Repub-lican governor is associated with lower within-state SSDI applications. In this case, the effect is driven by concurrent SSDI-SSI applications. If Republican gov-ernors indicate a clamping-down on all needs-based assistance, individuals may be less likely to apply for SSI as well.
Center for Retirement Research4
Figure 2. Impact of Selected Factors on Within-State Variation in Total SSDI Application Rates, 1993-2009
Notes: All results are statistically significant at least at the 10-percent level. The results shown for continuous variables are for a one-standard-deviation change; in the case of dummy variables, the results show a change from zero to one. Source: Authors’ calculations.
-0.02
-0.05
-0.01
-0.01
-0.02
0.02
-0.10 -0.05 0.00 0.05 0.10
Unemployment rate
Labor force participation rate
Less than high school
Post-graduate
Strict health regulation
Republican governor
Mean Change in Total SSDI Application Rate = 0.10

Issue in Brief 5
ConclusionThis brief uses data collected to examine why SSDI application rates vary so much across states to answer questions about what drives within-state variation. The results show that the strength of the economy is a key driver of SSDI application rates. When un-employment rises or labor force participation falls, SSDI application rates increase. Several other health, demographic and employment variables also change enough over time to have a significant effect.
The most interesting finding is that strict health insurance market regulation is correlated with lower SSDI application rates within a state. This is the first evidence of which we are aware that health insur-ance regulation influences SSDI applications, and it implies that health care reform, such as the Afford-able Care Act, could have spill-over effects to the SSDI program. This provocative finding merits further exploration in order to understand the precise mecha-nism through which the effect occurs.
Finally, politics appear to matter. Having a Republican governor leads to lower levels of SSDI ap-plications. This effect is concentrated among lower-income applicants who file concurrently for SSDI and SSI, which may indicate an overall decline in applica-tions for needs-based assistance.
Endnotes1 See McVicar (2006); Bound and Burkhauser (1999); and Rupp and Stapleton (1998).
2 Coe et al. (2012).
3 Coe et al. (2012).
4 Data are missing for: Wyoming in 1993, Rhode Island in 1994, Washington, DC in 1995, and Hawaii in 2004 because of lack of coverage in the Behavioral Risk Factor Surveillance Survey. Data are also missing for Nevada in 1994 due to lack of detailed data from Social Security on SSDI-only applications; we have 683 observations for concurrent applications for both SSDI and Supplemental Security Income.
5 The denominator is the number of residents aged 18-64 in a state as of July 1 from the U.S. Census Bureau. From this figure we subtract the number of beneficiaries of each program, obtained from the So-cial Security Administration Statistical Bulletins (SSA 1994-2009), since current beneficiaries are not at risk of applying.
6 The BRFSS has been administered since 1984 and is the largest ongoing telephone survey in the United States. BRFSS provides detailed data on self-rated health; health-related behaviors such as smoking and drinking; and factors correlated with health condi-tions such as obesity, along with state-of-residence indicators. While the BRFSS data include other health-related variables that may be related to the SSDI application rate (such as alcohol consumption, doctor visits, exercise habits, and mental health mea-sures), these variables were not consistently available for all states over the entire 1993-2009 period.
7 To be insured for SSDI, one must have worked the required number of quarters based on age, and 20 quarters within the last 10 years.
8 Age is specifically in the SSDI determination process because the assessment of the ability to be retrained changes depending on whether an appli-cant is age 50-54 (Approaching Advanced Age), 55-59 (Advanced Age), or 60-64 (Retirement Age).

Center for Retirement Research6
9 State-mandated employer temporary disability insurance (TDI) was an important explanatory vari-able in terms of variation of SSDI applications among states. However, since the TDI programs were mostly enacted after the Great Depression, they do not change during the period 1993-2009 and therefore are not included in the current analysis.
10 Data on state regulations of health insurance were compiled from The Henry J. Kaiser Family Founda-tion (2010a; 2010b), and Georgetown University Health Policy Institute (2004).
11 Herring and Pauly (2006). Several studies have shown that these regulations have a significant im-pact on coverage and presumably also on subsequent health care access (e.g., Buchmueller and DiNardo 2002; and Long and Stockley 2009).
12 This hypothesis is explored in Gruber and Kubik (2002), who find that individuals with access to health insurance from a spouse are 26-74 percent more likely to apply for SSDI benefits than those without external access to health insurance.
13 These data were compiled from Kehn, Croake, and Schimmel (2010); Croake and Liu (2009); Gruman et. al (2008); Jensen (2004, 2006); Georgia Depart-ment of Community Health (https://www.gmwd.org/WebForms/StaticContent1.aspx); Delaware Health and Social Services (http://dhss.delaware.gov/dhss/dmma/); and Commonwealth of Kentucky (http://manuals.chfs.ky.gov/dcbs_manuals/DFS/VOLIVA/OMVOLIVA.pdf).
14 The political variables come from National Gover-nors Association (2011) and Council of State Govern-ments (2007).
15 While much variation is lost by relying on within-state changes for identification, the state fixed effects are significant and the Hausman test suggests that a fixed-effects model is more appropriate than a random-effects model.
16 The descriptive statistics for the variables in the three regressions and the full results are shown in the Appendix.
17 For more details on the results of the SSDI-only and concurrent SSDI-SSI applicants, see Appendix Table 2 and Coe et al. (2011).
ReferencesReferences for the data sources used in this brief are available in the full paper (Coe et al. 2011).
Bound, John and Richard V. Burkhauser. 1999. “Eco-nomic Analysis of Transfer Programs Targeted on People with Disabilities.” In Handbook of Labor Economics, edited by Orley C. Ashenfelter and Da-vid E. Card, 3417-3528. Amsterdam: Elsevier.
Buchmueller, Thomas and John DiNardo. 2002. “Did Community Rating Induce an Adverse Selection Death Spiral? Evidence from New York, Pennsyl-vania, and Connecticut.” The American Economic Review 92(1): 280-294.
Coe, Norma B., Kelly Haverstick, Alicia H. Munnell, and Anthony Webb. 2011. “What Explains State Variation in SSDI Application Rates?” Working Paper 2011-23. Chestnut Hill, MA: Center for Retirement Research at Boston College.
Coe, Norma B., Kelly Haverstick, Alicia H. Munnell, and Anthony Webb. 2012. “What Explains Varia-tion in Disability Application Rates Across States?” Issue in Brief 12-1. Chestnut Hill, MA: Center for Retirement Research at Boston College.
Gruber, Jonathan and Jeffrey Kubik. 2002. “Health Insurance Coverage and the Disability Insur-ance Application Decision.” Working Paper 9148. Cambridge, MA: National Bureau of Economic Research.
Herring, Bradley and Mark Pauly. 2006. “The Effect of State Community Rating Regulations on Premi-ums and Coverage in the Individual Health Insur-ance Market.” Working Paper 12504. Cambridge, MA: National Bureau of Economic Research.
Long, Sharon K. and Karen Stockley. 2009. “Health Insurance in Massachusetts: An Update on Insur-ance Coverage and Support for Reform as of Fall 2008.” Washington, DC: Urban Institute.
McVicar, Duncan. 2006. “Why Do Disability Benefit Rolls Vary Between Regions? A Review of the Evi-dence from the USA and the UK.” Regional Studies 40(5): 519-533.
Rupp, Kalman and David Stapleton., eds. 1998. Growth in Disability Benefits. Kalamazoo, MI: W.E. Upjohn Institute of Employment Research.

APPENDIX

Table A1. Descriptive Statistics
Across states over time Within states over time
Mean Standard deviation Standard deviation
Dependent Variables (Percent of Working-Age Population)
Total SSDI application rate
SSDI-only application rate
Concurrent SSDI-SSI application rate
0.83
0.43
0.40
0.24
0.11
0.15
0.11
0.05
0.07
Health, Demographic, and Employment Variables
Health
Fair/poor health
Ever smoke 100+ cigarettes
Overweight or obese (BMI)
Age Profile
Age under 18
Age 18-25
Age 25-50 (omitted)
Age 50+
Education Profile
Less than high school
High school degree (omitted)
Some college
Post-graduate
Other Demographics
White, non-Hispanic
Male
Married
Poor
Occupation
Service occupation
Blue-collar occupation
Other occupations
Industry
Agriculture and physical industries
Professional industries (omitted)
Labor Force
Unemployment rate
Labor force participation rate
0.15
0.47
0.59
0.26
0.11
0.35
0.28
0.15
0.34
0.42
0.09
0.76
0.49
0.55
0.12
0.43
0.25
0.32
0.29
0.71
0.05
0.67
0.03
0.05
0.06
0.03
0.01
0.02
0.04
0.05
0.05
0.06
0.03
0.16
0.01
0.05
0.04
0.03
0.04
0.05
0.05
0.05
0.02
0.04
0.01
0.02
0.05
0.02
0.01
0.02
0.03
0.03
0.02
0.03
0.01
0.03
0.01
0.02
0.02
0.02
0.02
0.03
0.02
0.02
0.01
0.01
Center for Retirement Research8
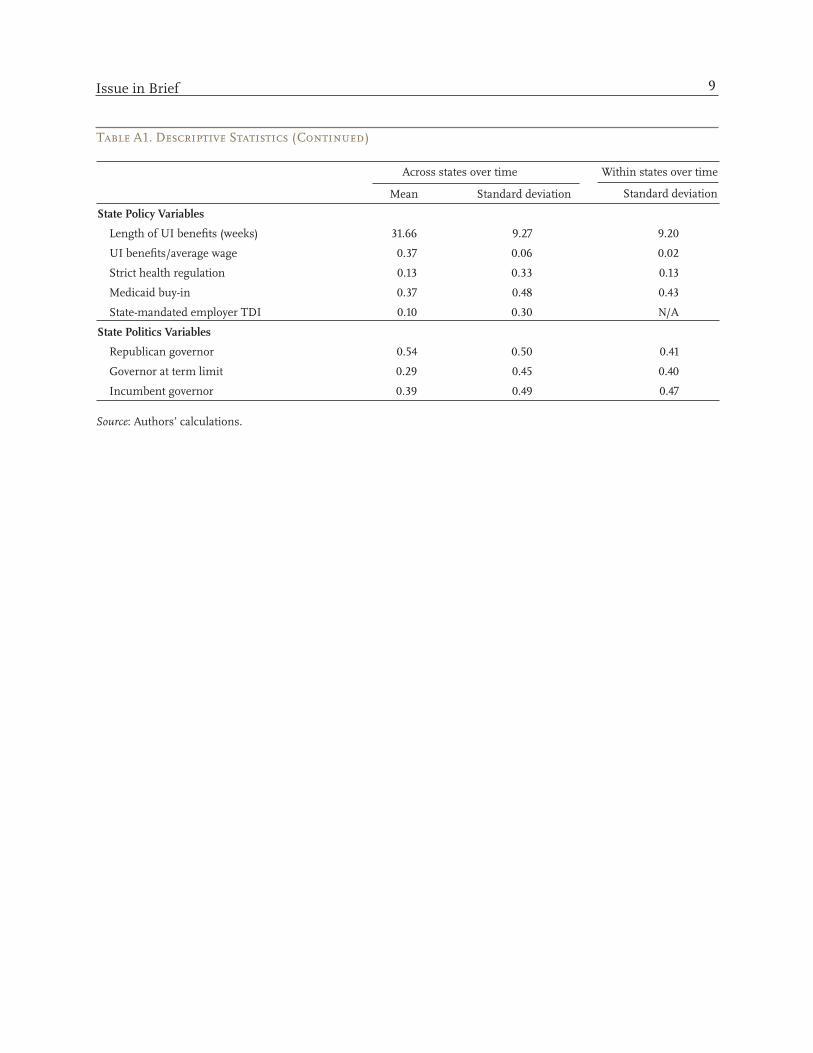
Table A1. Descriptive Statistics (Continued)
Across states over time Within states over time
Mean Standard deviation Standard deviation
State Policy Variables
Length of UI benefits (weeks) 31.66 9.27 9.20
UI benefits/average wage 0.37 0.06 0.02
Strict health regulation 0.13 0.33 0.13
Medicaid buy-in 0.37 0.48 0.43
State-mandated employer TDI 0.10 0.30 N/A
State Politics Variables
Republican governor 0.54 0.50 0.41
Governor at term limit 0.29 0.45 0.40
Incumbent governor 0.39 0.49 0.47
Source: Authors’ calculations.
Issue in Brief 9
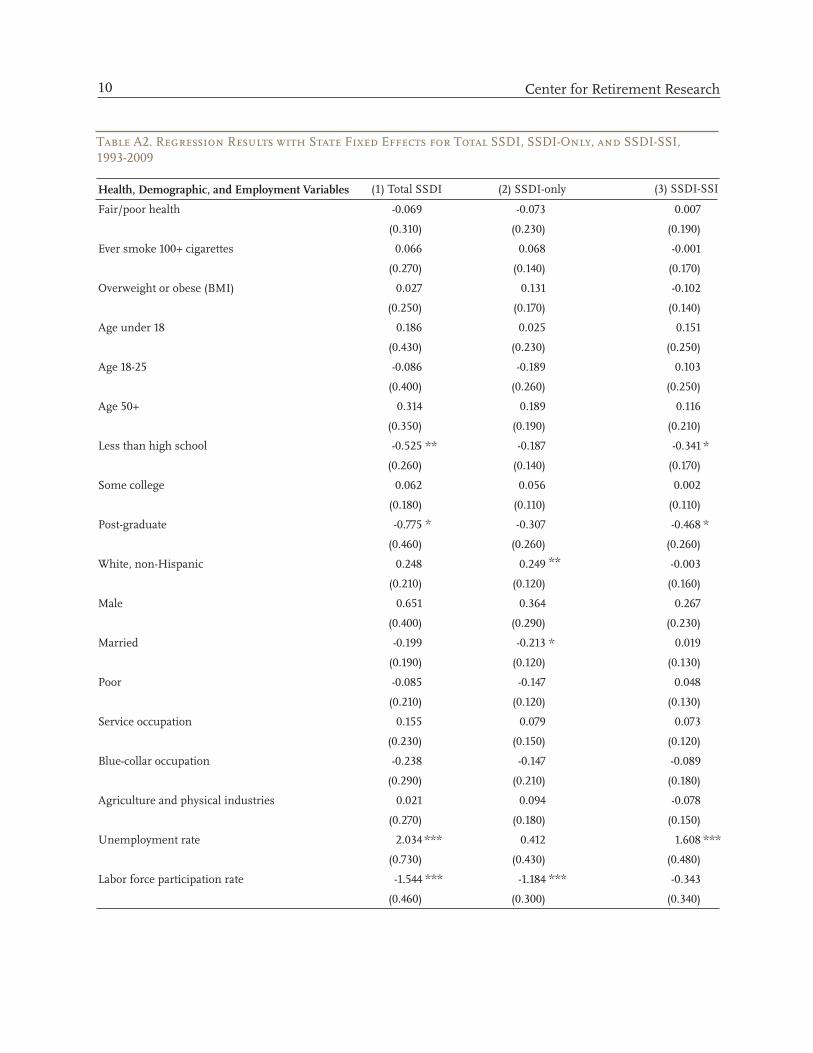
Table A2. Regression Results with State Fixed Effects for Total SSDI, SSDI-Only, and SSDI-SSI, 1993-2009
Health, Demographic, and Employment Variables (1) Total SSDI (2) SSDI-only (3) SSDI-SSI
Fair/poor health -0.069 -0.073 0.007
(0.310) (0.230) (0.190)
Ever smoke 100+ cigarettes 0.066 0.068 -0.001
(0.270) (0.140) (0.170)
Overweight or obese (BMI) 0.027 0.131 -0.102
(0.250) (0.170) (0.140)
Age under 18 0.186 0.025 0.151
(0.430) (0.230) (0.250)
Age 18-25 -0.086 -0.189 0.103
(0.400) (0.260) (0.250)
Age 50+ 0.314 0.189 0.116
(0.350) (0.190) (0.210)
Less than high school -0.525 ** -0.187 -0.341 *
(0.260) (0.140) (0.170)
Some college 0.062 0.056 0.002
(0.180) (0.110) (0.110)
Post-graduate -0.775 * -0.307 -0.468 *
(0.460) (0.260) (0.260)
White, non-Hispanic 0.248 0.249 ** -0.003
(0.210) (0.120) (0.160)
Male 0.651 0.364 0.267
(0.400) (0.290) (0.230)
Married -0.199 -0.213 * 0.019
(0.190) (0.120) (0.130)
Poor -0.085 -0.147 0.048
(0.210) (0.120) (0.130)
Service occupation 0.155 0.079 0.073
(0.230) (0.150) (0.120)
Blue-collar occupation -0.238 -0.147 -0.089
(0.290) (0.210) (0.180)
Agriculture and physical industries 0.021 0.094 -0.078
(0.270) (0.180) (0.150)
Unemployment rate 2.034 *** 0.412 1.608 ***
(0.730) (0.430) (0.480)
Labor force participation rate -1.544 *** -1.184 *** -0.343
(0.460) (0.300) (0.340)
Center for Retirement Research10
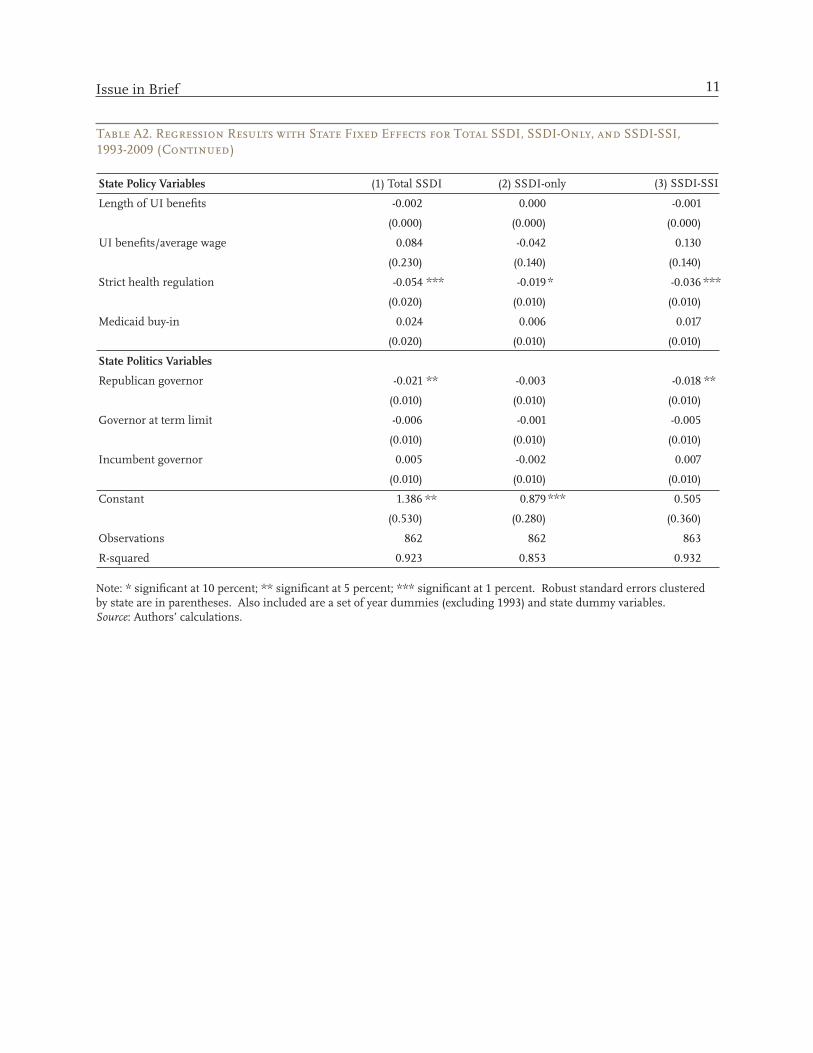
Table A2. Regression Results with State Fixed Effects for Total SSDI, SSDI-Only, and SSDI-SSI, 1993-2009 (Continued)
State Policy Variables (1) Total SSDI (2) SSDI-only (3) SSDI-SSI
Length of UI benefits
UI benefits/average wage
Strict health regulation
Medicaid buy-in
-0.002
(0.000)
0.084
(0.230)
-0.054
(0.020)
0.024
(0.020)
***
0.000
(0.000)
-0.042
(0.140)
-0.019
(0.010)
0.006
(0.010)
*
-0.001
(0.000)
0.130
(0.140)
-0.036
(0.010)
0.017
(0.010)
***
State Politics Variables
Republican governor
Governor at term limit
Incumbent governor
-0.021
(0.010)
-0.006
(0.010)
0.005
(0.010)
** -0.003
(0.010)
-0.001
(0.010)
-0.002
(0.010)
-0.018
(0.010)
-0.005
(0.010)
0.007
(0.010)
**
Constant
Observations
R-squared
1.386
(0.530)
862
0.923
** 0.879
(0.280)
862
0.853
*** 0.505
(0.360)
863
0.932
Note: * significant at 10 percent; ** significant at 5 percent; *** significant at 1 percent. Robust standard errors clustered by state are in parentheses. Also included are a set of year dummies (excluding 1993) and state dummy variables.Source: Authors’ calculations.
Issue in Brief 11

About the CenterThe Center for Retirement Research at Boston College was established in 1998 through a grant from the Social Security Administration. The Center’s mission is to produce first-class research and educational tools and forge a strong link between the academic community and decision-makers in the public and private sectors around an issue of critical importance to the nation’s future. To achieve this mission, the Center sponsors a wide variety of research projects, transmits new findings to a broad audience, trains new scholars, and broadens access to valuable data sources. Since its inception, the Center has established a reputation as an authoritative source of information on all major aspects of the retirement income debate.
Affiliated InstitutionsThe Brookings InstitutionMassachusetts Institute of TechnologySyracuse UniversityUrban Institute
Contact InformationCenter for Retirement ResearchBoston CollegeHovey House140 Commonwealth AvenueChestnut Hill, MA 02467-3808Phone: (617) 552-1762Fax: (617) 552-0191E-mail: [email protected]: http://crr.bc.edu
© 2012, by Trustees of Boston College, Center for Retire-ment Research. All rights reserved. Short sections of text, not to exceed two paragraphs, may be quoted without ex-plicit permission provided that the authors are identified and full credit, including copyright notice, is given to Trustees of Boston College, Center for Retirement Research.
The research reported herein was performed pursuant to a grant from the U.S. Social Security Administration (SSA) funded as part of the Retirement Research Consortium. The opinions and conclusions expressed are solely those of the authors and do not represent the opinions or policy of SSA, any agency of the federal government, or the Center for Retirement Research at Boston College.
R E S E A R C HRETIREMENT