Embed Size (px)
Citation preview
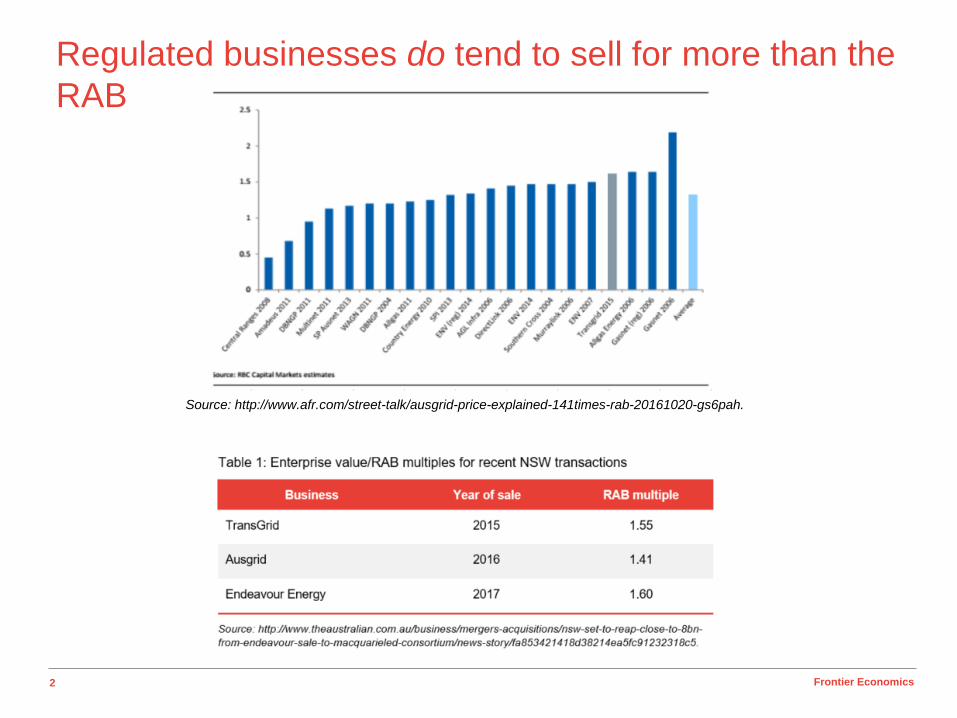
Why do regulated assets sell for more than
the RAB?
IPART 25th Anniversary Conference
October 2017
2 Frontier Economics
Regulated businesses do tend to sell for more than the
RAB
Source: http://www.afr.com/street-talk/ausgrid-price-explained-141times-rab-20161020-gs6pah.
3 Frontier Economics
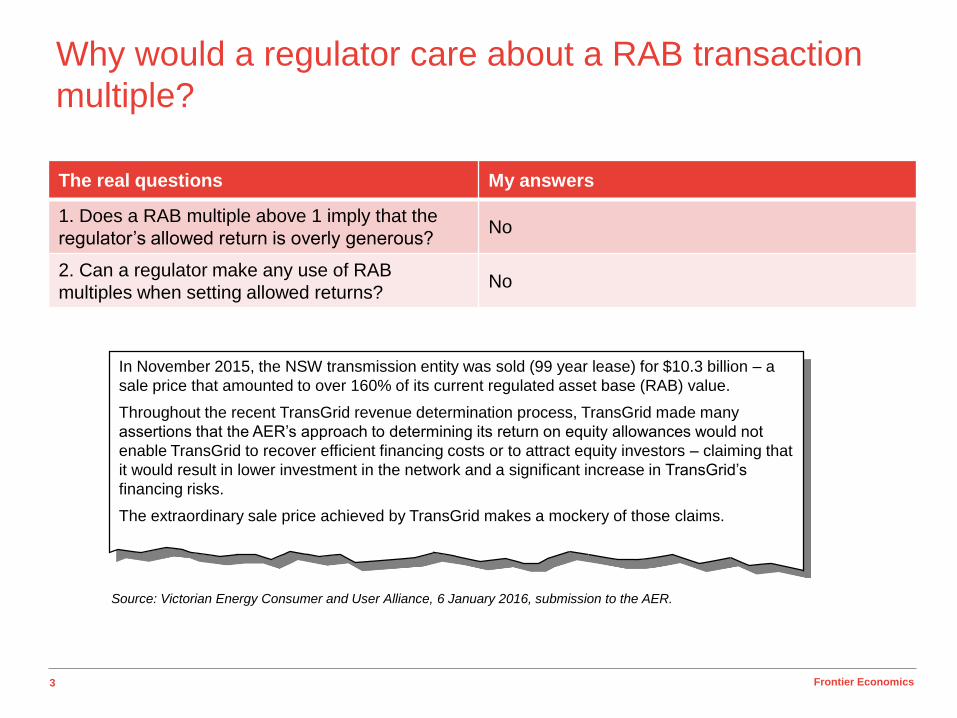
Why would a regulator care about a RAB transaction
multiple?
The real questions My answers
1. Does a RAB multiple above 1 imply that the
regulator’s allowed return is overly generous?No
2. Can a regulator make any use of RAB
multiples when setting allowed returns?No
In November 2015, the NSW transmission entity was sold (99 year lease) for $10.3 billion – a
sale price that amounted to over 160% of its current regulated asset base (RAB) value.
Throughout the recent TransGrid revenue determination process, TransGrid made many
assertions that the AER’s approach to determining its return on equity allowances would not
enable TransGrid to recover efficient financing costs or to attract equity investors – claiming that
it would result in lower investment in the network and a significant increase in TransGrid’s
financing risks.
The extraordinary sale price achieved by TransGrid makes a mockery of those claims.
Source: Victorian Energy Consumer and User Alliance, 6 January 2016, submission to the AER.
4 Frontier Economics
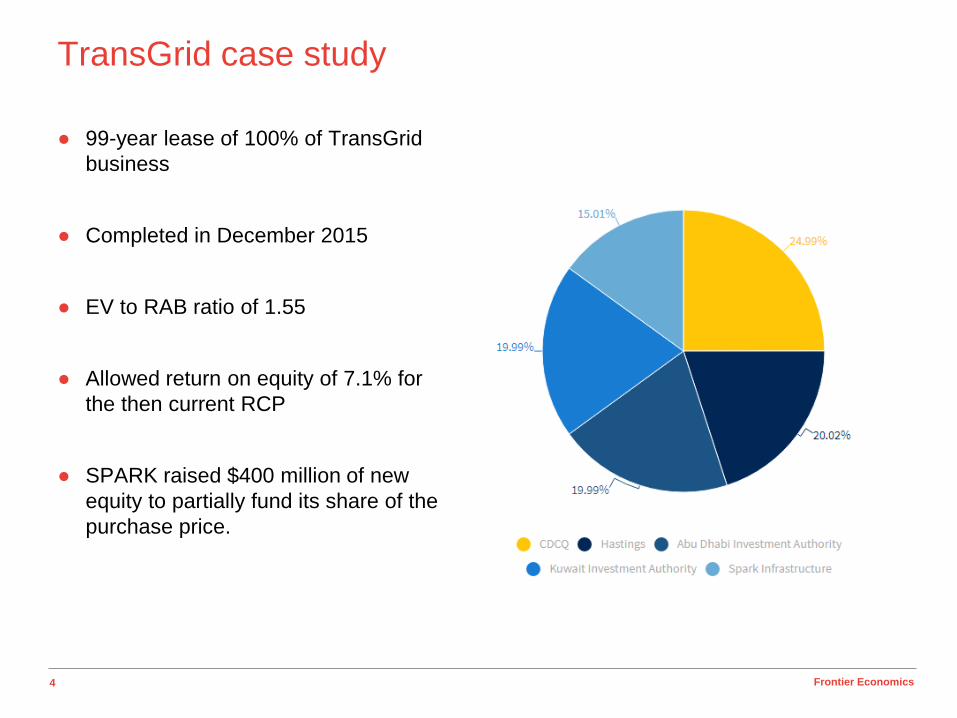
TransGrid case study
● 99-year lease of 100% of TransGrid
business
● Completed in December 2015
● EV to RAB ratio of 1.55
● Allowed return on equity of 7.1% for
the then current RCP
● SPARK raised $400 million of new
equity to partially fund its share of the
purchase price.
5 Frontier Economics
The 99-year lease term
● 4 years remaining in current regulatory period. Only 95 to go...
● Merits review process was already underway.
● AER’s long-standing approach had been to add a constant fixed risk premium to the
prevailing risk free rate. Submissions that this leads to under-compensation when
rates are low, over-compensation when rates are high. Current under-compensation,
but may be expected to average out in the long-run.
● Can’t conclude much at all about the generosity of the allowed return for the first 4
years.
6 Frontier Economics
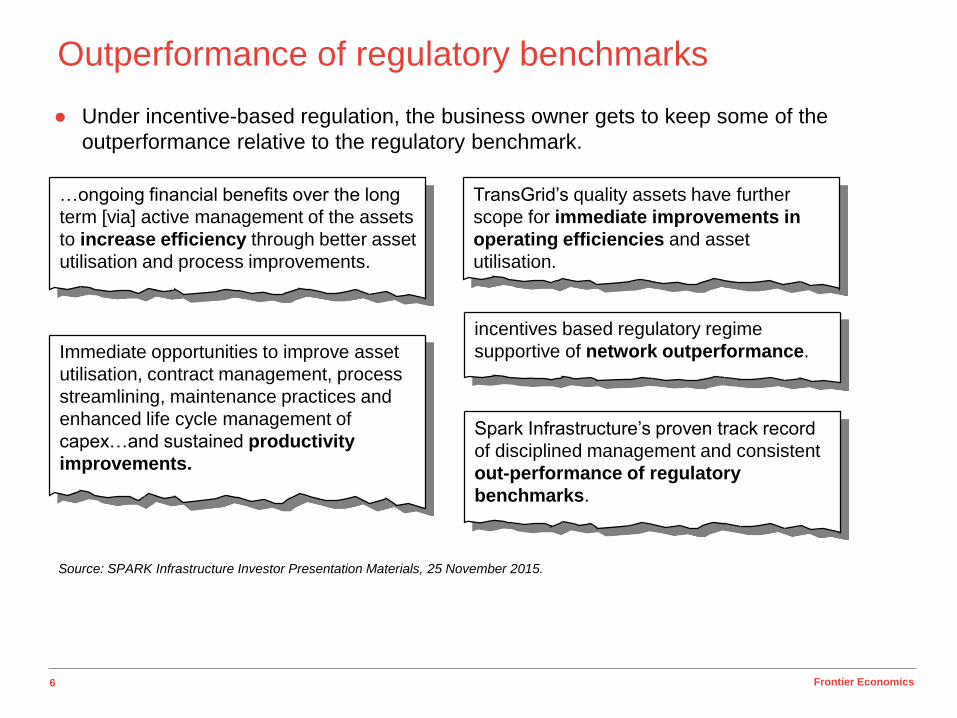
Outperformance of regulatory benchmarks
● Under incentive-based regulation, the business owner gets to keep some of the
outperformance relative to the regulatory benchmark.
…ongoing financial benefits over the long
term [via] active management of the assets
to increase efficiency through better asset
utilisation and process improvements.
Immediate opportunities to improve asset
utilisation, contract management, process
streamlining, maintenance practices and
enhanced life cycle management of
capex…and sustained productivity
improvements.
incentives based regulatory regime
supportive of network outperformance.
TransGrid’s quality assets have further
scope for immediate improvements in
operating efficiencies and asset
utilisation.
Spark Infrastructure’s proven track record
of disciplined management and consistent
out-performance of regulatory
benchmarks.
Source: SPARK Infrastructure Investor Presentation Materials, 25 November 2015.

7 Frontier Economics
Other sources of value
Source: SPARK Infrastructure Investor Presentation Materials, 25 November 2015.
● Diversification benefits
Reduces portfolio risk by providing further diversification to Spark Infrastructure’s existing
investment portfolio by asset type, geography, regulatory timing and partnering.
● Growth options
Long term growth in the Regulatory Asset Base supported by macro economic driven demand
growth expectations, and change in generation mix to renewables…Growth in centralised
renewable energy provides expansion opportunities.
Renewable generation projects expected to come on line as move towards fulfillment of the
LRET progresses. These new generation projects provide opportunities for TransGrid to
grow its connections.
Existing contracts provide significant cashflow and value.
Network modification opportunities as generation mix in the network changes with increases
in large scale renewable energy projects.
8 Frontier Economics
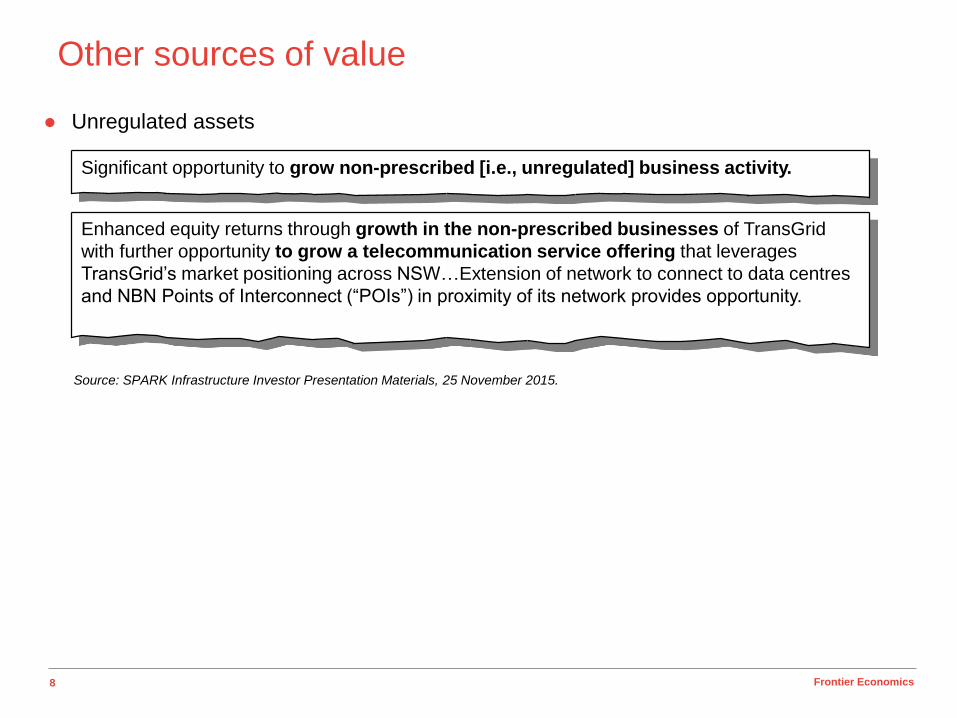
Other sources of value
Source: SPARK Infrastructure Investor Presentation Materials, 25 November 2015.
● Unregulated assets
Significant opportunity to grow non-prescribed [i.e., unregulated] business activity.
Enhanced equity returns through growth in the non-prescribed businesses of TransGrid
with further opportunity to grow a telecommunication service offering that leverages
TransGrid’s market positioning across NSW…Extension of network to connect to data centres
and NBN Points of Interconnect (“POIs”) in proximity of its network provides opportunity.
9 Frontier Economics
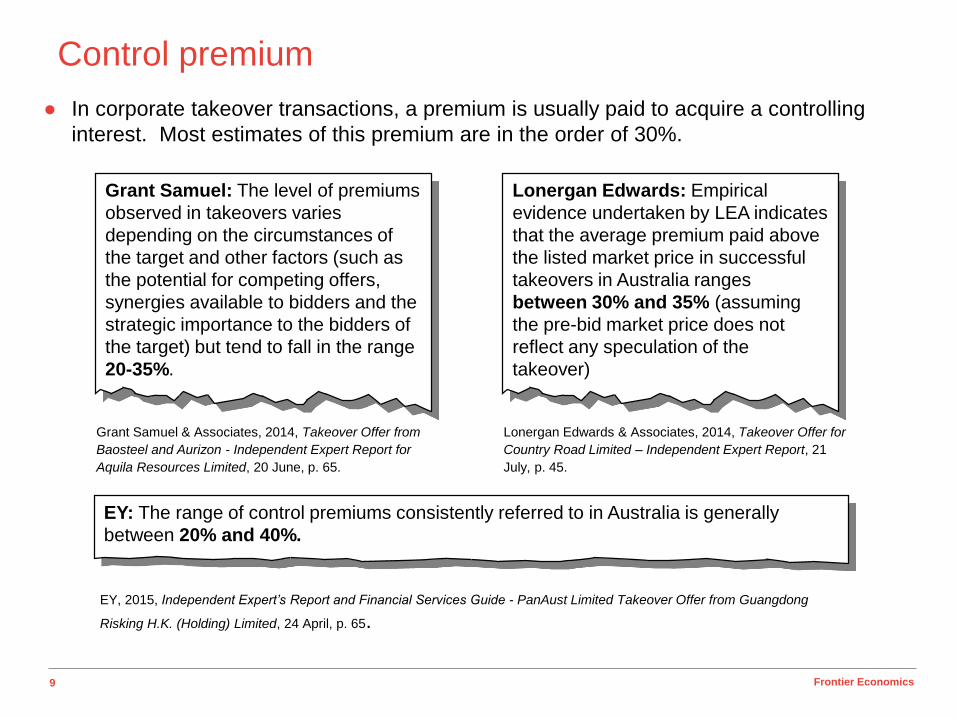
Control premium
● In corporate takeover transactions, a premium is usually paid to acquire a controlling
interest. Most estimates of this premium are in the order of 30%.
Grant Samuel: The level of premiums
observed in takeovers varies
depending on the circumstances of
the target and other factors (such as
the potential for competing offers,
synergies available to bidders and the
strategic importance to the bidders of
the target) but tend to fall in the range
20-35%.
Grant Samuel & Associates, 2014, Takeover Offer from
Baosteel and Aurizon - Independent Expert Report for
Aquila Resources Limited, 20 June, p. 65.
Lonergan Edwards: Empirical
evidence undertaken by LEA indicates
that the average premium paid above
the listed market price in successful
takeovers in Australia ranges
between 30% and 35% (assuming
the pre-bid market price does not
reflect any speculation of the
takeover)
Lonergan Edwards & Associates, 2014, Takeover Offer for
Country Road Limited – Independent Expert Report, 21
July, p. 45.
EY: The range of control premiums consistently referred to in Australia is generally
between 20% and 40%.
EY, 2015, Independent Expert’s Report and Financial Services Guide - PanAust Limited Takeover Offer from Guangdong
Risking H.K. (Holding) Limited, 24 April, p. 65.
10 Frontier Economics
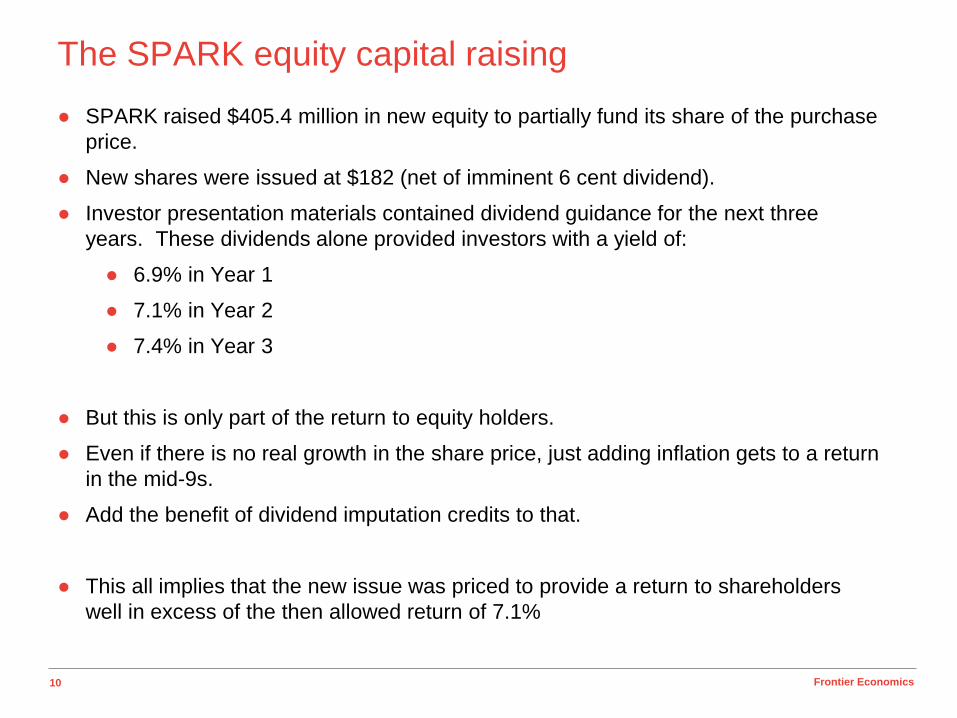
The SPARK equity capital raising
● SPARK raised $405.4 million in new equity to partially fund its share of the purchase
price.
● New shares were issued at $182 (net of imminent 6 cent dividend).
● Investor presentation materials contained dividend guidance for the next three
years. These dividends alone provided investors with a yield of:
● 6.9% in Year 1
● 7.1% in Year 2
● 7.4% in Year 3
● But this is only part of the return to equity holders.
● Even if there is no real growth in the share price, just adding inflation gets to a return
in the mid-9s.
● Add the benefit of dividend imputation credits to that.
● This all implies that the new issue was priced to provide a return to shareholders
well in excess of the then allowed return of 7.1%
11 Frontier Economics
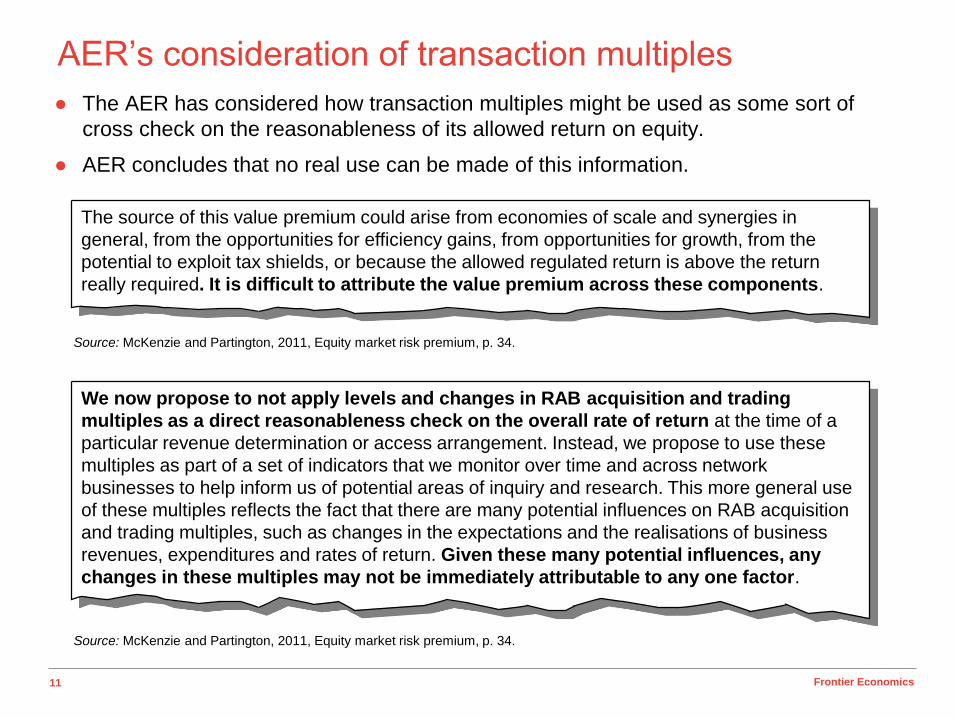
AER’s consideration of transaction multiples
● The AER has considered how transaction multiples might be used as some sort of
cross check on the reasonableness of its allowed return on equity.
● AER concludes that no real use can be made of this information.
Source: McKenzie and Partington, 2011, Equity market risk premium, p. 34.
The source of this value premium could arise from economies of scale and synergies in
general, from the opportunities for efficiency gains, from opportunities for growth, from the
potential to exploit tax shields, or because the allowed regulated return is above the return
really required. It is difficult to attribute the value premium across these components.
Source: McKenzie and Partington, 2011, Equity market risk premium, p. 34.
We now propose to not apply levels and changes in RAB acquisition and trading
multiples as a direct reasonableness check on the overall rate of return at the time of a
particular revenue determination or access arrangement. Instead, we propose to use these
multiples as part of a set of indicators that we monitor over time and across network
businesses to help inform us of potential areas of inquiry and research. This more general use
of these multiples reflects the fact that there are many potential influences on RAB acquisition
and trading multiples, such as changes in the expectations and the realisations of business
revenues, expenditures and rates of return. Given these many potential influences, any
changes in these multiples may not be immediately attributable to any one factor.

12 Frontier Economics
Frontier Economics Pty Ltd in Australia is a member of the Frontier Economics network, which consists of separate companies
based in Australia (Brisbane, Melbourne & Sydney) and Europe (Brussels, Cologne, London and Madrid). The companies are
independently owned, and legal commitments entered into by any one company do not impose any obligations on other
companies in the network. All views expressed in this document are the views of Frontier Economics Pty Ltd.

13 Frontier Economics
FRONTIER ECONOMICS PTY. LTD.
BRISBANE | MELBOURNE | SINGAPORE | SYDNEY
Frontier Economics Pty Ltd, 395 Collins Street, Melbourne, Vic 3000
Tel. +61 (0)3 9620 4488 Fax. +61 (0)3 9620 4499 www.frontier-economics.com.au