Embed Size (px)
Citation preview
1
Why do Internet services fail, and what can be done about it?1
David OppenheimerUniversity of California at [email protected]
24 May 2002
Abstract
We describe the architecture, operational practices, and failure characteristics of three verylarge-scale Internet services. Our research on architecture and operational practices took theform of interviews with architects and operations staff at those (and several other) services.Our research on component and service failure took the form of examining the operationsproblem tracking databases from two of the services and a log of service failure post-mortemreports from the third.
Architecturally, we find convergence on a common structure: division of nodes into servicefront-ends and back-ends, multiple levels of redundancy and load-balancing, and use of cus-tom-written software for both production services and administrative tools. Operationally, wefind a thin line between service developers and operators, and a need to coordinate problemdetection and repair across administrative domains. With respect to failures, we find thatoperator errors are their primary cause, operator error is the most difficult type of failure tomask, service front-ends are responsible for more problems than service back-ends but fewerminutes of unavailability, and that online testing and more thoroughly exposing and detectingcomponent failures could reduce system failure rates for at least one service.
1.This work was supported in part by the Defense Advanced Research Projects Agency of the Department of Defense,contract no. DABT63-96-C-0056, the National Science Foundation, grant no. CCR-0085899, NSF infrastructuregrant no. EIA-9802069, Alocity, Microsoft, and the California State MICRO Program. The information presentedhere does not necessarily reflect the position or the policy of the Government and no official endorsement should beinferred.

2
3
Section 1
Introduction
The number and popularity of large-scale Internet services such as Google, MSN, andYahoo! have grown significantly in recent years. Moreover, such services are poised toincrease in importance as they become the repository for data in ubiquitous computingsystems and the platform upon which new global-scale services and applications are built.These services’ large scale and need for 24x7 operation have led their designers to incorpo-rate a number of techniques for achieving high availability. Nonetheless, failures stilloccur.
The architects and operators of these services might see such problems as failures ontheir part. But these system failures provide important lessons for the systems communityabout why large-scale systems fail, and what techniques are or would be effective in pre-venting component failures from causing user-visible service failures. To answer the ques-tion “Why do Internet services fail and what can be done about it?”, we have studied boththe architecture and failure reports from three very large-scale Internet services. In thisreport we describe the lessons we have learned from this study. We observe that services
• are generally housed in geographically distributed colocation facilities and usemostly commodity hardware and networks;
• use multiple levels of redundancy and load balancing for performance and availabil-ity;
• are built from a load-balancing tier, a stateless front-end tier, and a back-end tierthat stores persistent data;
• use primarily custom-written software to provide and administer the service;• undergo frequent software upgrades and configuration updates;• operate their own 24x7 Systems Operations Centers staffed by operators who moni-
tor the service and respond to problems.Despite redundancy throughout the services and trained operations staff, the services
still experience end-user visible service failures. In studying these failures, we discover that• operator errors are their primary cause;• operator error is the most difficult type of failure to mask;• contrary to conventional wisdom, service front-ends are responsible for more prob-
lems than service back-ends; and• online testing and more thoroughly detecting and exposing component failures
could reduce system failure rates for at least one service.Although software architecture, operational practices, and failures of various kinds
have been studied in the context of end-user and enterprise software, researchers have thus
4
far paid much less attention to these attributes when it comes to large-scale Internet ser-vices. Before presenting the results of our study, we briefly describe the important differ-ences between the Internet service environment and more traditional platforms.
1.1 The emergence of a new application environment
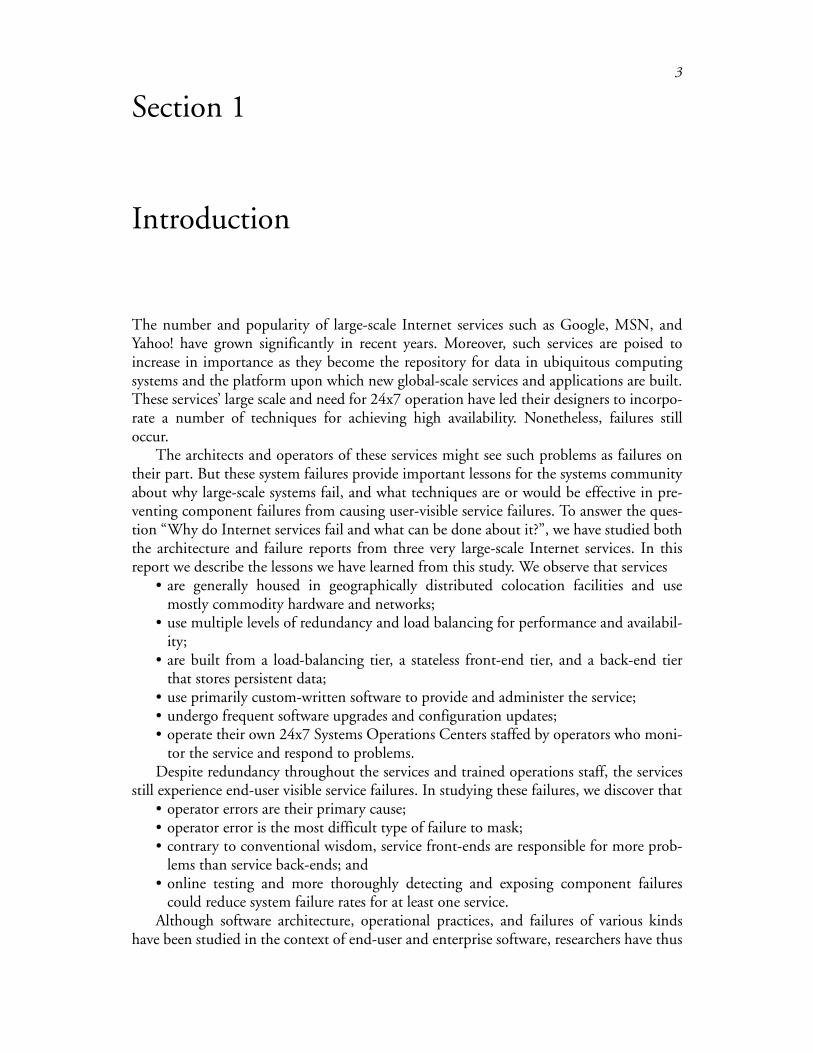
The dominant software platform is evolving from one of shrink-wrapped applicationsinstalled on end-user personal computers to one of Internet-based application servicesdeployed in large-scale, globally distributed clusters. Although they share some character-istics with traditional desktop applications and traditional high-availability software,Internet services are built from a unique combination of building blocks, they have differ-ent requirements, and they are deployed in a different environment. Table 1 summarizesthese differences.
Continuous 24x7 availability is demanded by a globally distributed user base thatincreasingly sees these services as essential parts of the world's communications infrastruc-ture. As suggested in Table 1, however, large-scale Internet services present an availabilitychallenge because they
Characteristic Traditional desktop applications
Traditional high- availability applications
Large-scale Internet service applications
Dominant application productivity applica-tions, games
database, enterprise messaging
email, search, news, e-commerce, data storage
Typical hardware platform
desktop PC fault-tolerant server or failover cluster
cluster of 100s-1000s of cheap PCs, often geographically distrib-uted
Software model off-the-shelf, standalone
off-the-shelf, multi-tier custom-written, multi-tier
Frequency of new software releases
months months days or weeks
Networking environment
none (standalone) enterprise-scale within cluster, Internet among data centers, Internet to/from user clients
Who operates the software
end-user corporate IT staff service operations staff, datacenter/colocation site staff
Typical physical environment
home or office corporate machine room
colocation facility
Key metrics functionality, interactive latency
availability, throughput availability, functional-ity, scalability, manage-ability, throughput
Table 1: Internet services vs. traditional applications.

5
• are typically built from large numbers of inexpensive PCs that lack expensive reli-ability features;
• undergo frequent scaling, reconfiguration, and functionality changes; • often run custom-written software with limited testing; • rely on networks within service clusters, among geographically distributed colloca-
tion facilities, and between collocation facilities and end-user clients; and • are expected to be available 24x7 for access by users around the globe, thus making
planned downtime undesirable or impossible. On the other hand, some features of large-scale services can be exploited to enhance
availability: • plentiful hardware allows for redundancy; • use of collocation facilities allows controlled environmental conditions and resil-
ience to large-scale disasters via geographic distribution; • operators can learn the software's inner workings from developers and thus more
quickly identify and correct problems, as compared to IT staffs running shrink-wrapped software.
We will examine a number of techniques have been developed to exploit these charac-teristics.
A challenge closely related to availability is maintainability. Not only are human oper-ators essential to keeping a service running, but the same issues of scale, complexity, andrate of change that makes these services prone to failure also makes them challenging forhuman operators to manage. Yet existing tools and techniques for configuring systems,visualizing system configurations and the changes made to them, partitioning and migrat-ing persistent data, and detecting, diagnosing and fixing problems, are largely ad hoc andoften inadequate.
As a first step toward formalizing the principles for building highly available andmaintainable large-scale Internet services, we have conducted a survey of the architecture,operational practices, and dependability of existing services. This report describes ourobservations and is organized as follows. Section 2 describes in detail the architectures ofthree representative large-scale Internet services. In Section 3 we describe some opera-tional issues involved in maintaining Internet services, and Section 4 summarizes ouranalysis of failure data from three of these services. In Section 5 we discuss related work,and in Section 6 we conclude and discuss possible future directions.

6
7
Section 2
Architecture
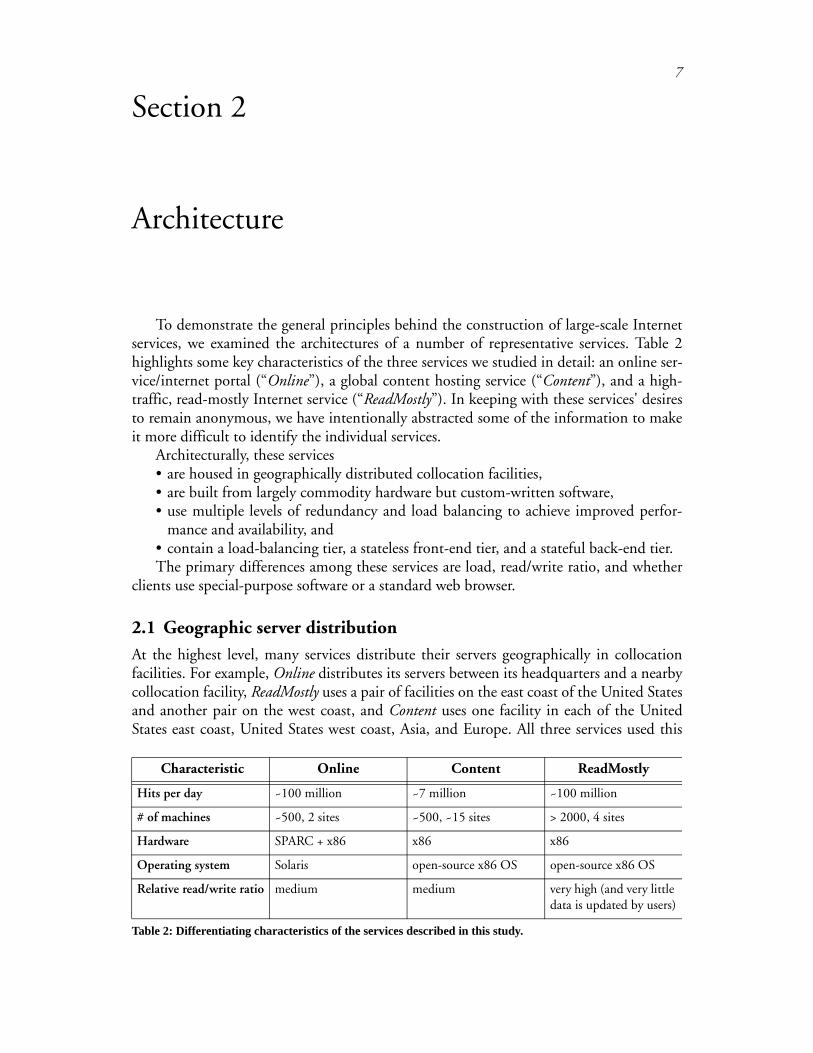
To demonstrate the general principles behind the construction of large-scale Internetservices, we examined the architectures of a number of representative services. Table 2highlights some key characteristics of the three services we studied in detail: an online ser-vice/internet portal (“Online”), a global content hosting service (“Content”), and a high-traffic, read-mostly Internet service (“ReadMostly”). In keeping with these services' desiresto remain anonymous, we have intentionally abstracted some of the information to makeit more difficult to identify the individual services.
Architecturally, these services • are housed in geographically distributed collocation facilities, • are built from largely commodity hardware but custom-written software, • use multiple levels of redundancy and load balancing to achieve improved perfor-
mance and availability, and• contain a load-balancing tier, a stateless front-end tier, and a stateful back-end tier.The primary differences among these services are load, read/write ratio, and whether
clients use special-purpose software or a standard web browser.
2.1 Geographic server distribution
At the highest level, many services distribute their servers geographically in collocationfacilities. For example, Online distributes its servers between its headquarters and a nearbycollocation facility, ReadMostly uses a pair of facilities on the east coast of the United Statesand another pair on the west coast, and Content uses one facility in each of the UnitedStates east coast, United States west coast, Asia, and Europe. All three services used this
Characteristic Online Content ReadMostly
Hits per day ~100 million ~7 million ~100 million
# of machines ~500, 2 sites ~500, ~15 sites > 2000, 4 sites
Hardware SPARC + x86 x86 x86
Operating system Solaris open-source x86 OS open-source x86 OS
Relative read/write ratio medium medium very high (and very little data is updated by users)
Table 2: Differentiating characteristics of the services described in this study.
8
geographic distribution for availability, and all but Content also used the redundant data-centers to improve performance by sharing in the handling of user requests.
Several mechanisms are available for directing user queries to the most appropriate sitewhen distributed datacenters are used for load sharing. The choice of site generally takesinto account the load on each site and its availability. In the case of Content, this function-ality is pushed to the client, which is pointed to one primary site and one backup site. Thetwo sites work in redundant pairs to reduce administrative complexity--some clients arepointed to one pair of sites, while others are pointed to the other pair. Updates are propa-gated from a client's primary server site to its secondary server site on a nightly basis. Inthe case of Online, a server at the company's headquarters is responsible for providing cli-ents with an up-to-date list of the best servers to contact whenever the client connects;these servers may be at the company's headquarters or at its collocation facility. Read-Mostly uses its switch vendor's proprietary global load balancing mechanism, whichrewrites DNS responses based on load and health information about other sites collectedfrom the cooperating switches at those sites.
2.2 Single site architecture
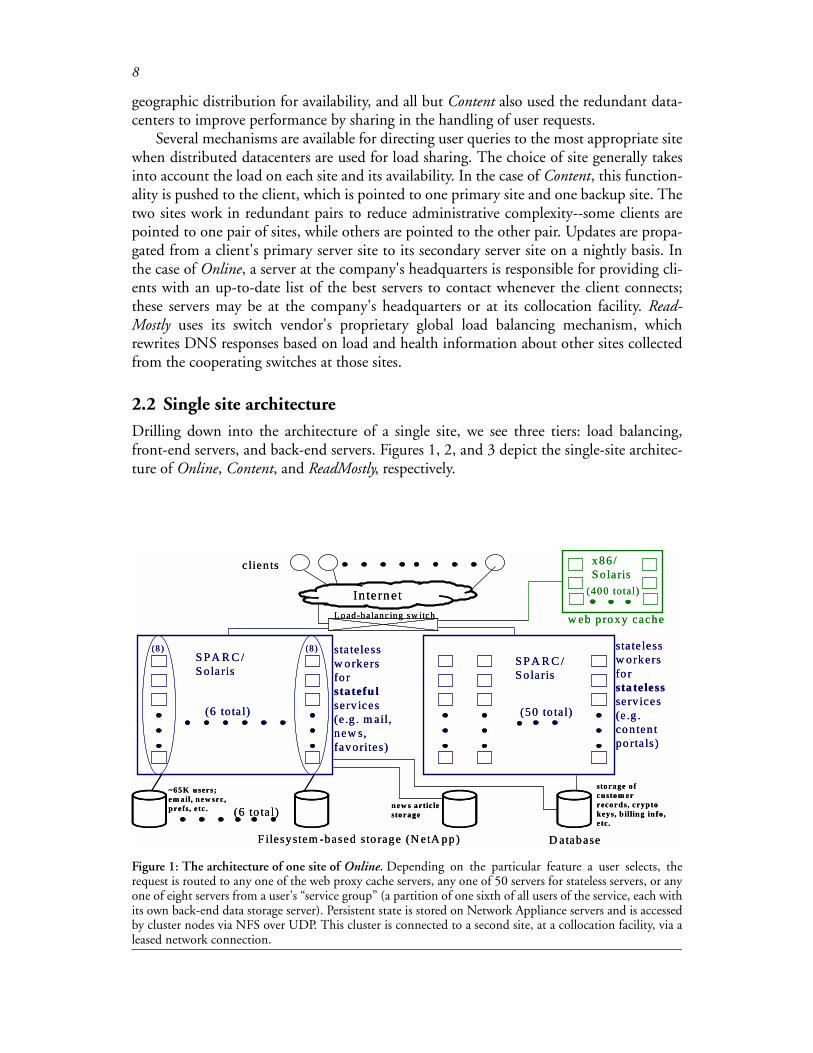
Drilling down into the architecture of a single site, we see three tiers: load balancing,front-end servers, and back-end servers. Figures 1, 2, and 3 depict the single-site architec-ture of Online, Content, and ReadMostly, respectively.
w eb p roxy cache
(400 to tal)
x86 / S o laris
sta te less w orkers fo r sta te lessserv ices (e .g . con ten t po rta ls)
(8)(8 ) sta teless w orkers fo r sta tefu lserv ices (e .g . m ail, new s, favorites)
(6 to ta l) (50 to ta l)
S PA R C /S olaris
S P A R C /S o laris
storage o f custom er records, crypto keys, b illing in fo, e tc.
In ternetL oad-balancing sw itch
c lien ts
(6 to ta l)
F ilesystem -based sto rage (N etA pp)
~65K users; em ail, new src, prefs, e tc . new s artic le
storage
D atabase
Figure 1: The architecture of one site of Online. Depending on the particular feature a user selects, therequest is routed to any one of the web proxy cache servers, any one of 50 servers for stateless servers, or anyone of eight servers from a user's “service group” (a partition of one sixth of all users of the service, each withits own back-end data storage server). Persistent state is stored on Network Appliance servers and is accessedby cluster nodes via NFS over UDP. This cluster is connected to a second site, at a collocation facility, via aleased network connection.
9
2.2.1 Tier 1: Load balancingA front-end network balanced load by distributing incoming requests to front-end serversbased on the load on those servers. Though many modern switches offer “layer 7" switch-ing functionality, meaning they can route requests based on the contents of a user'srequest, none of the sites we surveyed actually use this switch feature. Instead, they gener-
Load-balancing sw itch
paired client service proxies
(14 total)
(100 total)
data storage servers
metadata servers
Internetto paired backup site
Load-balancing sw itch
paired client service proxies
(14 total)
(100 total)
data storage servers
metadata servers
Internetto paired backup site
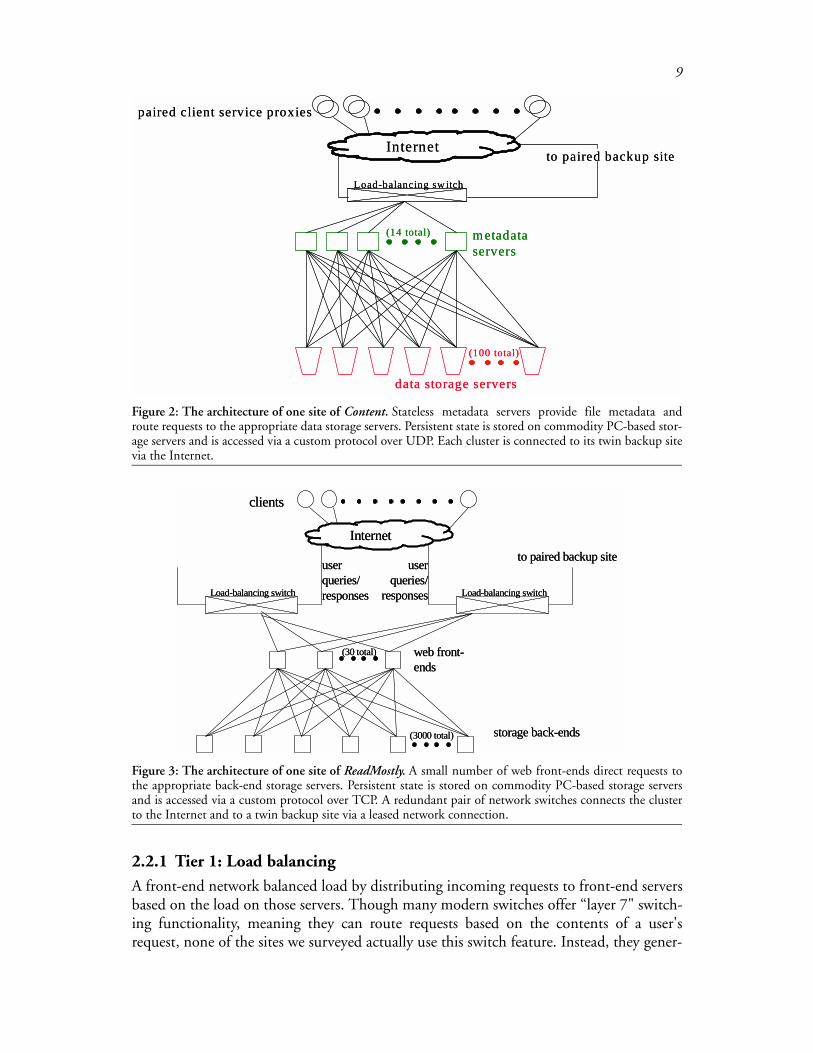
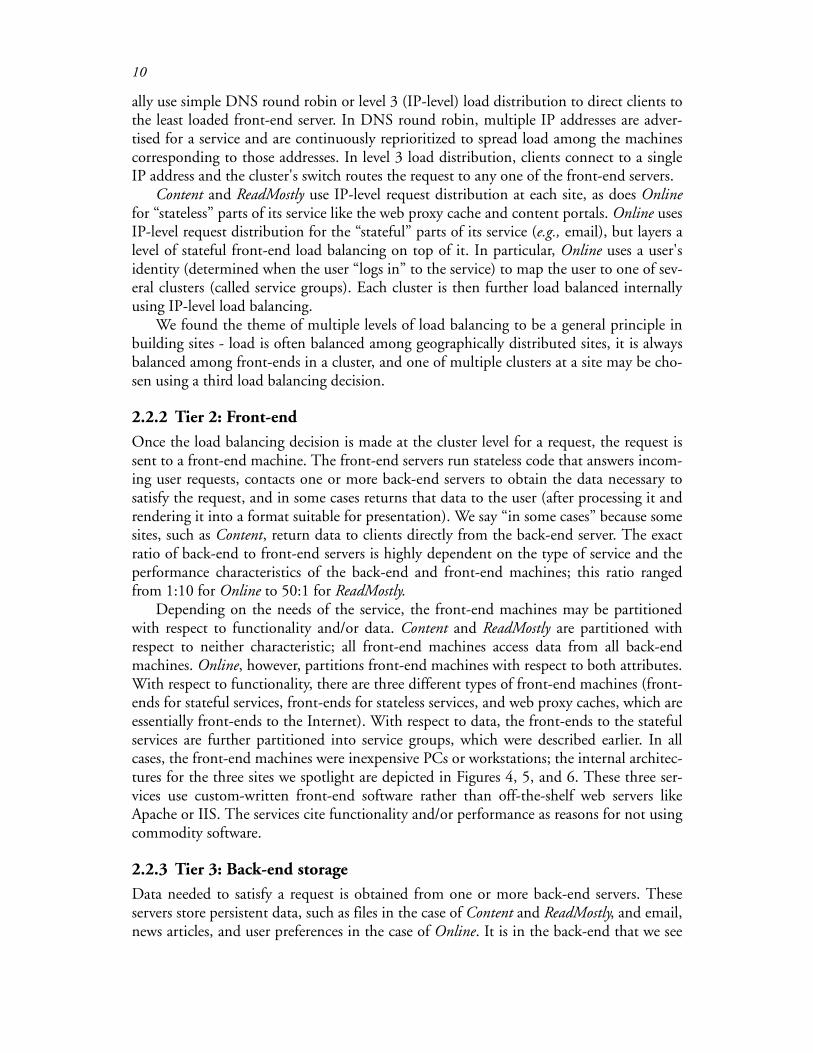
Figure 2: The architecture of one site of Content. Stateless metadata servers provide file metadata androute requests to the appropriate data storage servers. Persistent state is stored on commodity PC-based stor-age servers and is accessed via a custom protocol over UDP. Each cluster is connected to its twin backup sitevia the Internet.
Load-balancing switch
clients
(30 total) web front-ends
Internet
(3000 total) storage back-ends
Load-balancing switch
to paired backup siteuser queries/ responses
user queries/
responsesLoad-balancing switch
clients
(30 total) web front-ends
Internet
(3000 total) storage back-ends
Load-balancing switch
to paired backup siteuser queries/ responses
user queries/
responses
Figure 3: The architecture of one site of ReadMostly. A small number of web front-ends direct requests tothe appropriate back-end storage servers. Persistent state is stored on commodity PC-based storage serversand is accessed via a custom protocol over TCP. A redundant pair of network switches connects the clusterto the Internet and to a twin backup site via a leased network connection.
10
ally use simple DNS round robin or level 3 (IP-level) load distribution to direct clients tothe least loaded front-end server. In DNS round robin, multiple IP addresses are adver-tised for a service and are continuously reprioritized to spread load among the machinescorresponding to those addresses. In level 3 load distribution, clients connect to a singleIP address and the cluster's switch routes the request to any one of the front-end servers.
Content and ReadMostly use IP-level request distribution at each site, as does Onlinefor “stateless” parts of its service like the web proxy cache and content portals. Online usesIP-level request distribution for the “stateful” parts of its service (e.g., email), but layers alevel of stateful front-end load balancing on top of it. In particular, Online uses a user'sidentity (determined when the user “logs in” to the service) to map the user to one of sev-eral clusters (called service groups). Each cluster is then further load balanced internallyusing IP-level load balancing.
We found the theme of multiple levels of load balancing to be a general principle inbuilding sites - load is often balanced among geographically distributed sites, it is alwaysbalanced among front-ends in a cluster, and one of multiple clusters at a site may be cho-sen using a third load balancing decision.
2.2.2 Tier 2: Front-end
Once the load balancing decision is made at the cluster level for a request, the request issent to a front-end machine. The front-end servers run stateless code that answers incom-ing user requests, contacts one or more back-end servers to obtain the data necessary tosatisfy the request, and in some cases returns that data to the user (after processing it andrendering it into a format suitable for presentation). We say “in some cases” because somesites, such as Content, return data to clients directly from the back-end server. The exactratio of back-end to front-end servers is highly dependent on the type of service and theperformance characteristics of the back-end and front-end machines; this ratio rangedfrom 1:10 for Online to 50:1 for ReadMostly.
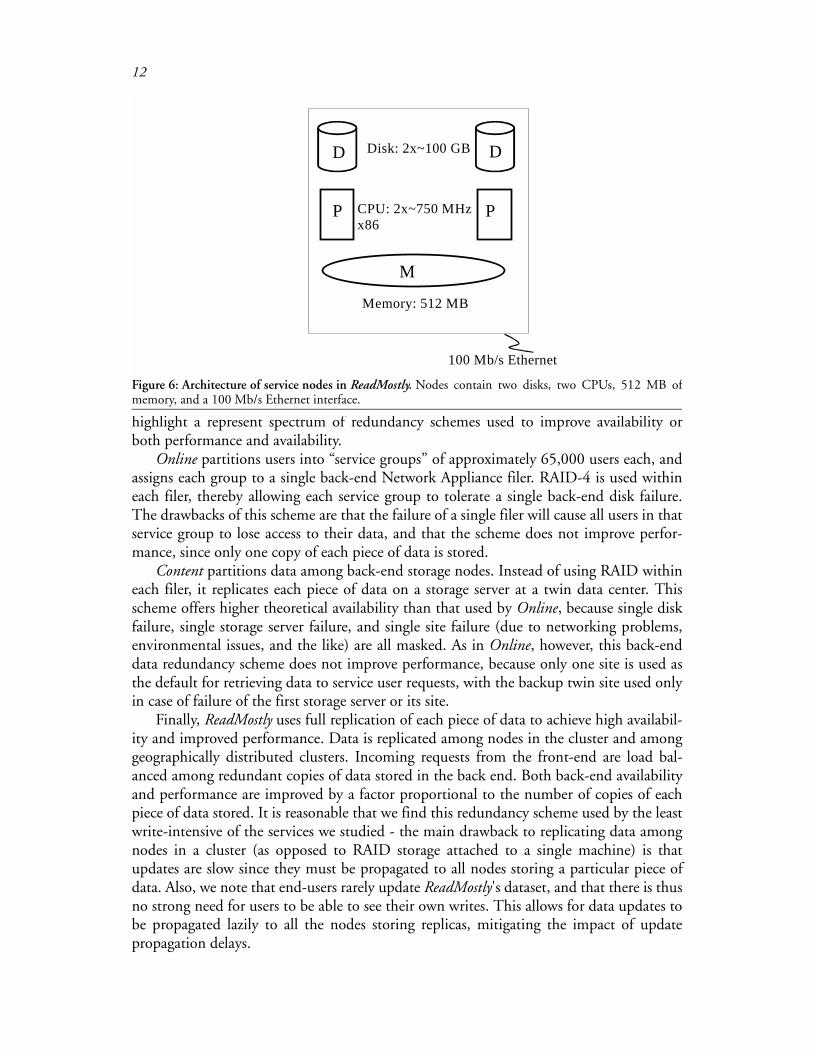
Depending on the needs of the service, the front-end machines may be partitionedwith respect to functionality and/or data. Content and ReadMostly are partitioned withrespect to neither characteristic; all front-end machines access data from all back-endmachines. Online, however, partitions front-end machines with respect to both attributes.With respect to functionality, there are three different types of front-end machines (front-ends for stateful services, front-ends for stateless services, and web proxy caches, which areessentially front-ends to the Internet). With respect to data, the front-ends to the statefulservices are further partitioned into service groups, which were described earlier. In allcases, the front-end machines were inexpensive PCs or workstations; the internal architec-tures for the three sites we spotlight are depicted in Figures 4, 5, and 6. These three ser-vices use custom-written front-end software rather than off-the-shelf web servers likeApache or IIS. The services cite functionality and/or performance as reasons for not usingcommodity software.
2.2.3 Tier 3: Back-end storageData needed to satisfy a request is obtained from one or more back-end servers. Theseservers store persistent data, such as files in the case of Content and ReadMostly, and email,news articles, and user preferences in the case of Online. It is in the back-end that we see
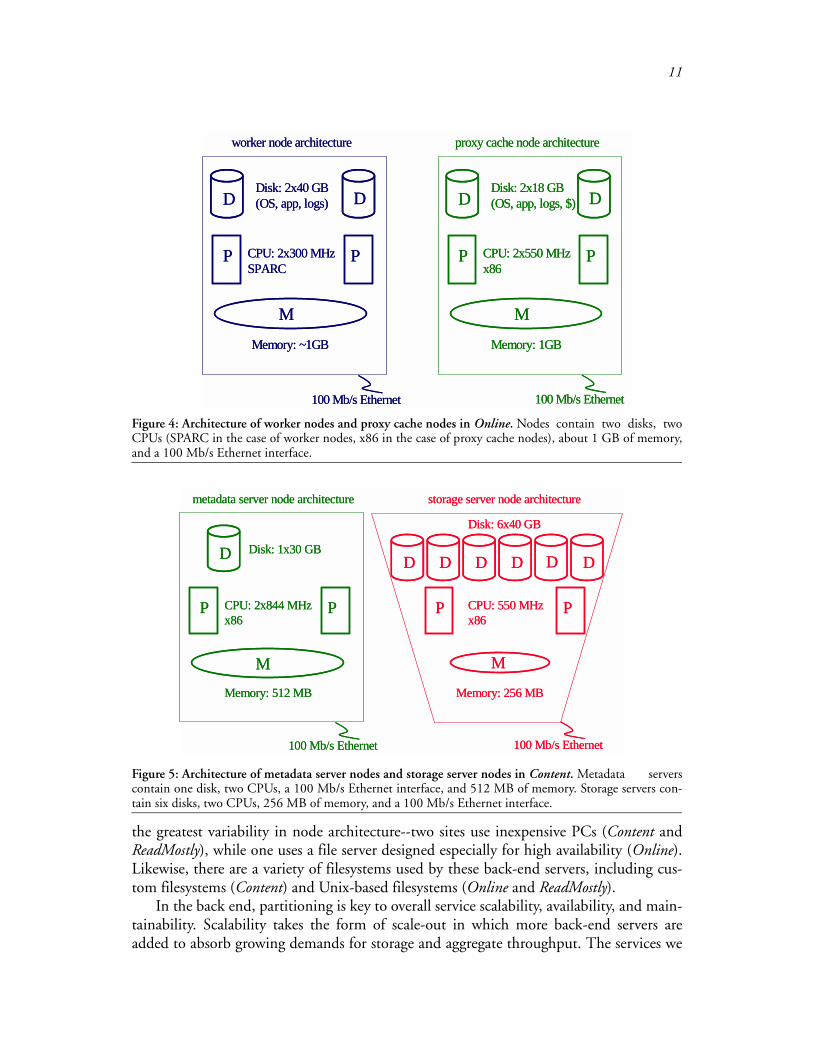
11
the greatest variability in node architecture--two sites use inexpensive PCs (Content andReadMostly), while one uses a file server designed especially for high availability (Online).Likewise, there are a variety of filesystems used by these back-end servers, including cus-tom filesystems (Content) and Unix-based filesystems (Online and ReadMostly).
In the back end, partitioning is key to overall service scalability, availability, and main-tainability. Scalability takes the form of scale-out in which more back-end servers areadded to absorb growing demands for storage and aggregate throughput. The services we
Disk: 2x40 GB (OS, app, logs)D D
P PCPU: 2x300 MHz SPARC
M
Memory: ~1GB
worker node architecture
Disk: 2x18 GB (OS, app, logs, $)D D
P PCPU: 2x550 MHz x86
M
Memory: 1GB
proxy cache node architecture
100 Mb/s Ethernet 100 Mb/s Ethernet
Disk: 2x40 GB (OS, app, logs)D D
P PCPU: 2x300 MHz SPARC
M
Memory: ~1GB
worker node architecture
Disk: 2x18 GB (OS, app, logs, $)D D
P PCPU: 2x550 MHz x86
M
Memory: 1GB
proxy cache node architecture
100 Mb/s Ethernet 100 Mb/s Ethernet
Figure 4: Architecture of worker nodes and proxy cache nodes in Online. Nodes contain two disks, twoCPUs (SPARC in the case of worker nodes, x86 in the case of proxy cache nodes), about 1 GB of memory,and a 100 Mb/s Ethernet interface.
Disk: 1x30 GBD
P PCPU: 2x844 MHz x86
M
Memory: 512 MB
metadata server node architecture
Disk: 6x40 GB
D D
P PCPU: 550 MHz x86
M
Memory: 256 MB
storage server node architecture
100 Mb/s Ethernet 100 Mb/s Ethernet
D D D DDisk: 1x30 GBD
P PCPU: 2x844 MHz x86
M
Memory: 512 MB
metadata server node architecture
Disk: 6x40 GB
D D
P PCPU: 550 MHz x86
M
Memory: 256 MB
storage server node architecture
100 Mb/s Ethernet 100 Mb/s Ethernet
D D D D
Figure 5: Architecture of metadata server nodes and storage server nodes in Content. Metadata serverscontain one disk, two CPUs, a 100 Mb/s Ethernet interface, and 512 MB of memory. Storage servers con-tain six disks, two CPUs, 256 MB of memory, and a 100 Mb/s Ethernet interface.
12
highlight a represent spectrum of redundancy schemes used to improve availability orboth performance and availability.
Online partitions users into “service groups” of approximately 65,000 users each, andassigns each group to a single back-end Network Appliance filer. RAID-4 is used withineach filer, thereby allowing each service group to tolerate a single back-end disk failure.The drawbacks of this scheme are that the failure of a single filer will cause all users in thatservice group to lose access to their data, and that the scheme does not improve perfor-mance, since only one copy of each piece of data is stored.
Content partitions data among back-end storage nodes. Instead of using RAID withineach filer, it replicates each piece of data on a storage server at a twin data center. Thisscheme offers higher theoretical availability than that used by Online, because single diskfailure, single storage server failure, and single site failure (due to networking problems,environmental issues, and the like) are all masked. As in Online, however, this back-enddata redundancy scheme does not improve performance, because only one site is used asthe default for retrieving data to service user requests, with the backup twin site used onlyin case of failure of the first storage server or its site.
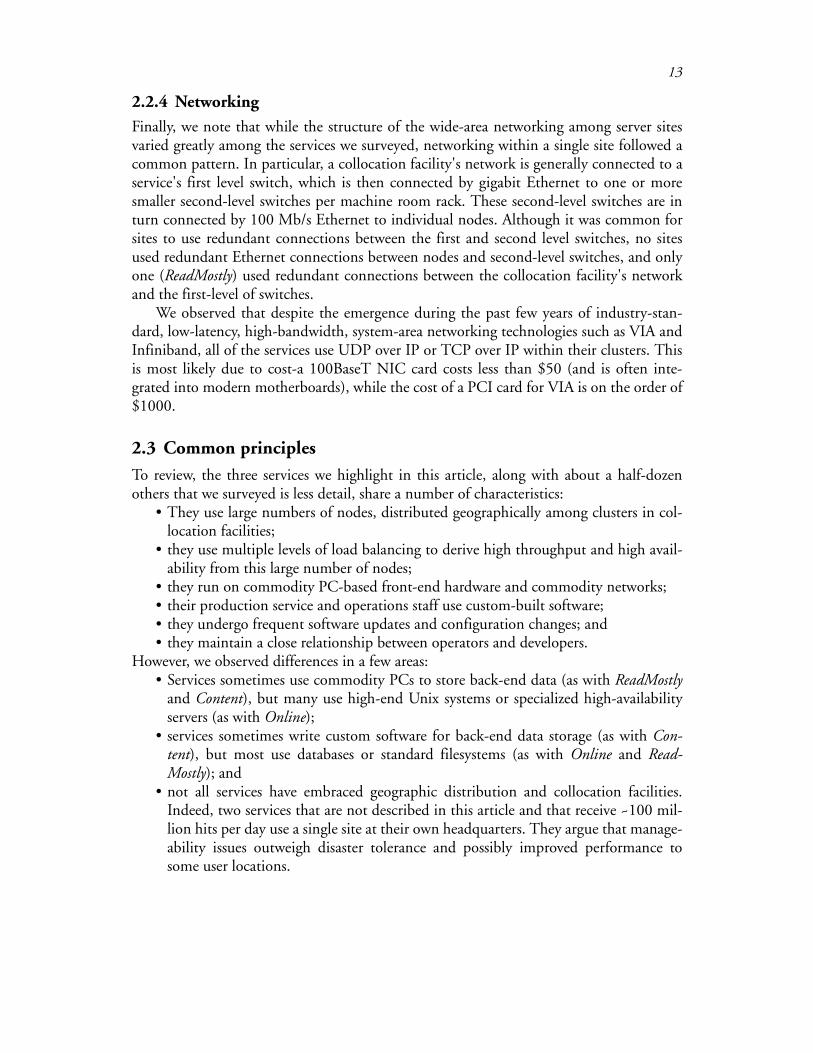
Finally, ReadMostly uses full replication of each piece of data to achieve high availabil-ity and improved performance. Data is replicated among nodes in the cluster and amonggeographically distributed clusters. Incoming requests from the front-end are load bal-anced among redundant copies of data stored in the back end. Both back-end availabilityand performance are improved by a factor proportional to the number of copies of eachpiece of data stored. It is reasonable that we find this redundancy scheme used by the leastwrite-intensive of the services we studied - the main drawback to replicating data amongnodes in a cluster (as opposed to RAID storage attached to a single machine) is thatupdates are slow since they must be propagated to all nodes storing a particular piece ofdata. Also, we note that end-users rarely update ReadMostly's dataset, and that there is thusno strong need for users to be able to see their own writes. This allows for data updates tobe propagated lazily to all the nodes storing replicas, mitigating the impact of updatepropagation delays.
Disk: 2x~100 GBD D
P P CPU: 2x~750 MHz x86
M
Memory: 512 MB
100 Mb/s Ethernet
Figure 6: Architecture of service nodes in ReadMostly. Nodes contain two disks, two CPUs, 512 MB ofmemory, and a 100 Mb/s Ethernet interface.
13
2.2.4 Networking
Finally, we note that while the structure of the wide-area networking among server sitesvaried greatly among the services we surveyed, networking within a single site followed acommon pattern. In particular, a collocation facility's network is generally connected to aservice's first level switch, which is then connected by gigabit Ethernet to one or moresmaller second-level switches per machine room rack. These second-level switches are inturn connected by 100 Mb/s Ethernet to individual nodes. Although it was common forsites to use redundant connections between the first and second level switches, no sitesused redundant Ethernet connections between nodes and second-level switches, and onlyone (ReadMostly) used redundant connections between the collocation facility's networkand the first-level of switches.
We observed that despite the emergence during the past few years of industry-stan-dard, low-latency, high-bandwidth, system-area networking technologies such as VIA andInfiniband, all of the services use UDP over IP or TCP over IP within their clusters. Thisis most likely due to cost-a 100BaseT NIC card costs less than $50 (and is often inte-grated into modern motherboards), while the cost of a PCI card for VIA is on the order of$1000.
2.3 Common principles
To review, the three services we highlight in this article, along with about a half-dozenothers that we surveyed is less detail, share a number of characteristics:
• They use large numbers of nodes, distributed geographically among clusters in col-location facilities;
• they use multiple levels of load balancing to derive high throughput and high avail-ability from this large number of nodes;
• they run on commodity PC-based front-end hardware and commodity networks;• their production service and operations staff use custom-built software;• they undergo frequent software updates and configuration changes; and• they maintain a close relationship between operators and developers.
However, we observed differences in a few areas:• Services sometimes use commodity PCs to store back-end data (as with ReadMostly
and Content), but many use high-end Unix systems or specialized high-availabilityservers (as with Online);
• services sometimes write custom software for back-end data storage (as with Con-tent), but most use databases or standard filesystems (as with Online and Read-Mostly); and
• not all services have embraced geographic distribution and collocation facilities.Indeed, two services that are not described in this article and that receive ~100 mil-lion hits per day use a single site at their own headquarters. They argue that manage-ability issues outweigh disaster tolerance and possibly improved performance tosome user locations.

14
15
Section 3
Service operational issues
The need to develop, deploy, and upgrade services on “Internet time,” combined with thesize and complexity of service infrastructures, has placed unique pressures on the tradi-tional software lifecycle. This pressure can be seen particularly in testing, deployment, andoperations. The amount of time available for testing has shrunk, the frequency and scaleof deployment and upgrade has expanded, and the importance of operational issues suchas monitoring, problem diagnosis and repair, configuration and reconfiguration, and gen-eral system usability for human operators has grown. The services we studied are address-ing these challenges in a variety of ways.
3.1 Testing
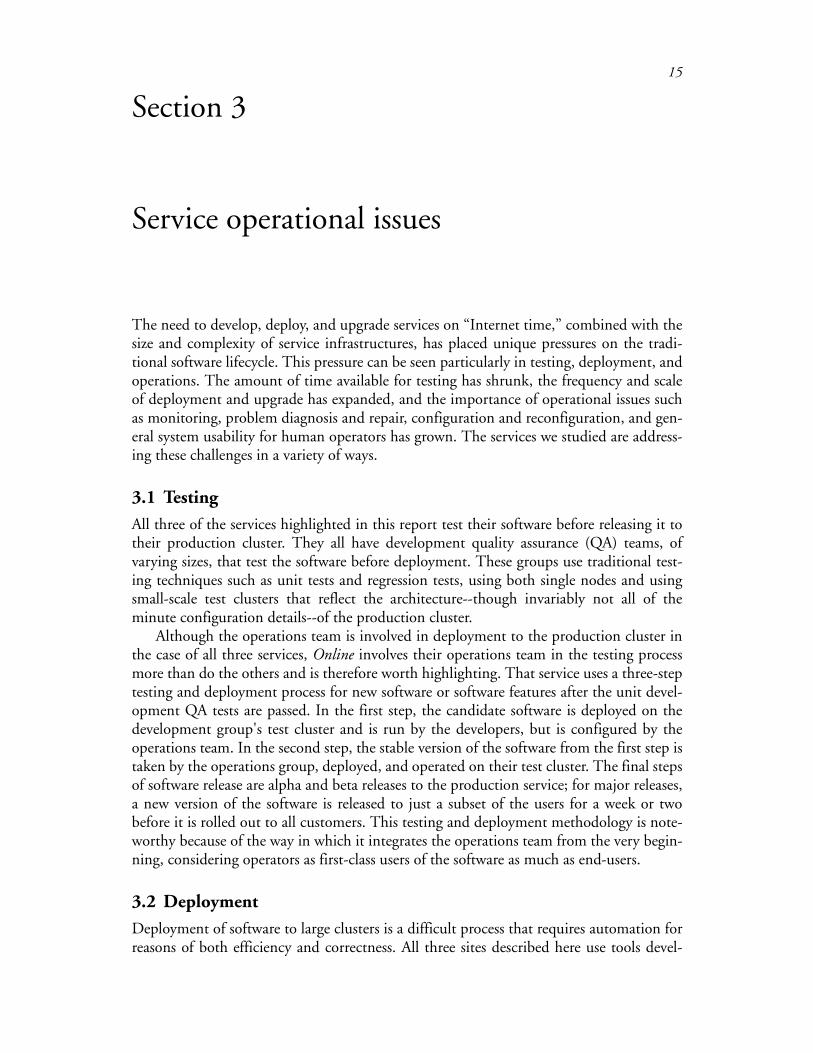
All three of the services highlighted in this report test their software before releasing it totheir production cluster. They all have development quality assurance (QA) teams, ofvarying sizes, that test the software before deployment. These groups use traditional test-ing techniques such as unit tests and regression tests, using both single nodes and usingsmall-scale test clusters that reflect the architecture--though invariably not all of theminute configuration details--of the production cluster.
Although the operations team is involved in deployment to the production cluster inthe case of all three services, Online involves their operations team in the testing processmore than do the others and is therefore worth highlighting. That service uses a three-steptesting and deployment process for new software or software features after the unit devel-opment QA tests are passed. In the first step, the candidate software is deployed on thedevelopment group's test cluster and is run by the developers, but is configured by theoperations team. In the second step, the stable version of the software from the first step istaken by the operations group, deployed, and operated on their test cluster. The final stepsof software release are alpha and beta releases to the production service; for major releases,a new version of the software is released to just a subset of the users for a week or twobefore it is rolled out to all customers. This testing and deployment methodology is note-worthy because of the way in which it integrates the operations team from the very begin-ning, considering operators as first-class users of the software as much as end-users.
3.2 Deployment
Deployment of software to large clusters is a difficult process that requires automation forreasons of both efficiency and correctness. All three sites described here use tools devel-
16
oped in-house to deploy and upgrade production software and configurations for applica-tions and operating systems. All three sites used rolling upgrades [2] for deployingsoftware to their clusters. All three sites used version control during software development,and Online and ReadMostly use it for configuration management. Online always keep twoversions of the service installed on every machine, thereby allowing them to revert to anolder version in less than five minutes if a new installation goes awry.
The three services differed with respect to the frequency with which they updateapplication software and operating system and application configurations. Back-end soft-ware changed the least frequently, front-end software changed more frequently, andmachine configurations changed the most often. Of course, content changes on a dailybasis in all three services.
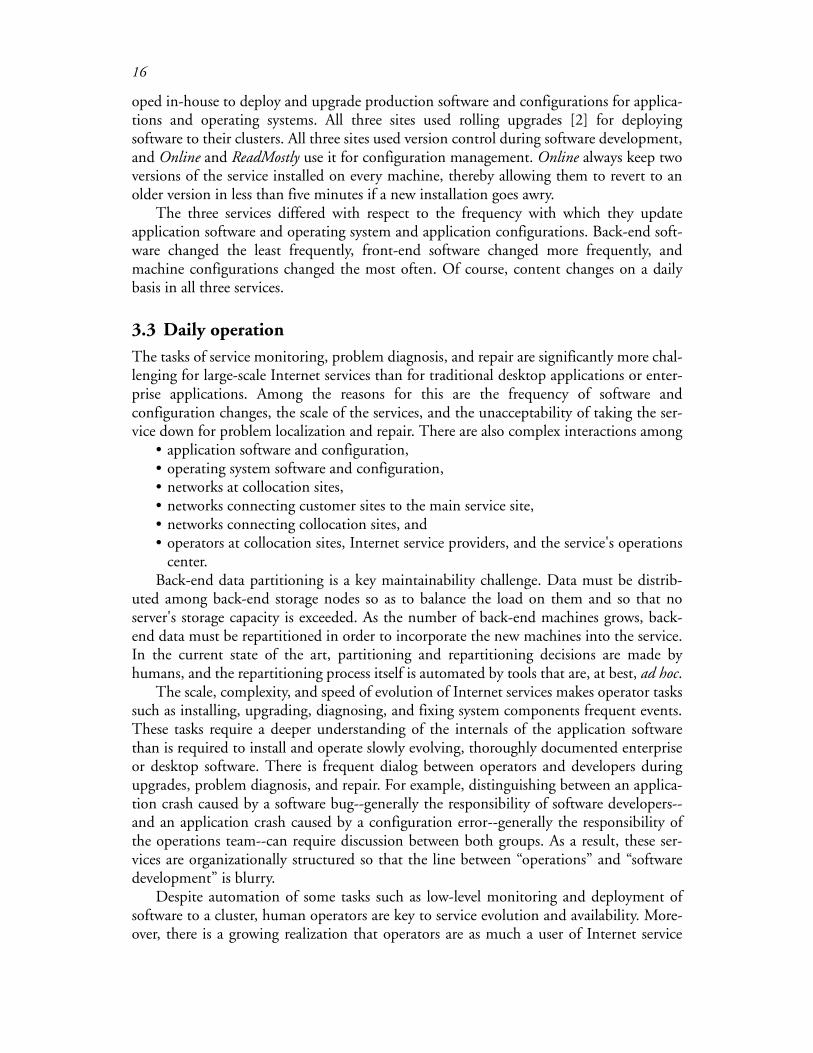
3.3 Daily operation
The tasks of service monitoring, problem diagnosis, and repair are significantly more chal-lenging for large-scale Internet services than for traditional desktop applications or enter-prise applications. Among the reasons for this are the frequency of software andconfiguration changes, the scale of the services, and the unacceptability of taking the ser-vice down for problem localization and repair. There are also complex interactions among
• application software and configuration,• operating system software and configuration,• networks at collocation sites,• networks connecting customer sites to the main service site,• networks connecting collocation sites, and• operators at collocation sites, Internet service providers, and the service's operations
center.Back-end data partitioning is a key maintainability challenge. Data must be distrib-
uted among back-end storage nodes so as to balance the load on them and so that noserver's storage capacity is exceeded. As the number of back-end machines grows, back-end data must be repartitioned in order to incorporate the new machines into the service.In the current state of the art, partitioning and repartitioning decisions are made byhumans, and the repartitioning process itself is automated by tools that are, at best, ad hoc.
The scale, complexity, and speed of evolution of Internet services makes operator taskssuch as installing, upgrading, diagnosing, and fixing system components frequent events.These tasks require a deeper understanding of the internals of the application softwarethan is required to install and operate slowly evolving, thoroughly documented enterpriseor desktop software. There is frequent dialog between operators and developers duringupgrades, problem diagnosis, and repair. For example, distinguishing between an applica-tion crash caused by a software bug--generally the responsibility of software developers--and an application crash caused by a configuration error--generally the responsibility ofthe operations team--can require discussion between both groups. As a result, these ser-vices are organizationally structured so that the line between “operations” and “softwaredevelopment” is blurry.
Despite automation of some tasks such as low-level monitoring and deployment ofsoftware to a cluster, human operators are key to service evolution and availability. More-over, there is a growing realization that operators are as much a user of Internet service
17
software as are end-users, and that usability by operators is a concern that should be inte-grated throughout the software development process. Many operational tasks are not fullyautomated or are not automated at all, such as scaling the service; configuring and recon-figuring software and network equipment; partitioning and repartitioning users and data;identifying the root cause of problems; tuning performance; and responding to hardware,software, security, and networking issues. Conversely, there seems to be much moreopportunity for more sophisticated and standardized problem diagnosis and configurationmanagement tools, as all of the sites we surveyed used some combination of their owncustom-written tools and manual operator intervention for these tasks.
Unfortunately, building generic tools for these tasks that can be customized for a par-ticular site is difficult. Even a seemingly simple activity such as finding the root cause ofan outage can be difficult. For example, in a large network, unreachability of twenty serv-ers might be not be unusual. But if those twenty servers are exactly the set of nodes behinda single switch, then most likely the cause of the problem is not the nodes themselves butrather the switch them connects them to the rest of the network. Ideally the service opera-tor would be told of the switch outage and the alarms for the twenty servers would be sup-pressed, as they just lead to confusion about the root cause of the problem. Butperforming even this simple filtering requires an understanding of the topology of the net-work, which must be part of the monitoring system’s configuration. There is a tradeoffbetween hiring sophisticated programmers to build and configure automated monitoringand maintenance tools, and simply hiring a larger number of less skilled operators toapply their human intelligence to system operation tasks using less sophisticated tools. Asthe scale of deployed systems and the number of such systems grows, the advantage mayshift from the human-centric model to an automation-centric one. But the day of fullyautomatic system operation seems a long way off, and the prevalent operational modeltoday is clearly that of many operators using relatively unsophisticated tools.
3.4 Common principles
All of the large-scale Internet services we studied are in a state of constant flux with respectto hardware and software configuration. They are also under pressure to rapidly test anddeploy new software. In response, the services operate their own 24x7 Systems OperationsCenters staffed by operators who monitor the service and respond to problems. Theseoperators also work closely with developers when diagnosing, and sometimes whenresponding to, problems.
Our architectural study reveals pervasive use of hardware and software redundancy atthe geographic, node, and component levels. Nonetheless, outages at large-scale Internetservices are frequent. Motivated by this observation, we set out to study the causes of fail-ures in such services.

18
19
Section 4
Dependability
This section describes the results of our study of the dependability of the three servicesoutlined in Section 2. We examine the root causes of component and user-visible servicefailures, and the mean time to repair service failures. We also speculate on the potentialeffectiveness of a number of techniques for mitigating failures, had they been applied tothe failure scenarios experienced by one of the services for which we have extensive data(Online).
Our primary conclusions in this section are that• operator error is the leading contributor to user-visible failures;• operator error is the most difficult type of component failure to mask;• contrary to conventional wisdom, front-end software can be a significant cause of
user-visible failure, primarily due to configuration errors;• back-end failures, while infrequent, take longer to repair than do front-end failures;• more online testing, increased redundancy, and more thoroughly exposing and
reacting to software and hardware failures would have reduced service failures in oneservice studied (Online); and
• automatic sanity checking of configuration files, and online fault and load injection,would also offer some potential benefit to that service.
4.1 Survey methodology and terminology
Because we are interested in why and how large-scale Internet services fail, we studiedindividual problem reports rather than aggregate availability statistics. The operations staffof all three services use problem-tracking databases to record information about compo-nent and service failures. Two of the services (Online and Content) gave us access to thesedatabases, and one of the services (ReadMostly) gave us access to the problem post-mortemreports written after every major user-visible service failure. For Online and Content, wedefined a service failure as one that could (1) prevent an end-user from accessing the ser-vice or a part of the service, even if the user is given a reasonable error message; or (2) sig-nificantly degrade a user-visible aspect of system performance. We chose this definition offailure because it most closely matched the criteria that ReadMostly used to select problemsthat merited a post-mortem. Note that “user-visible” is implicit in our definition of servicefailure.
“Significantly degrades a user-visible aspect of system performance” is admittedly avaguely-defined metric. A more precise definition of failure would involve correlating
20
component failure reports with degradation in some aspect of externally observed systemQuality of Service such as response time. But even in those cases where these services mea-sured and archived response times for the time period studied, we are not guaranteed todetect all user-visible failures, due to the periodicity and placement in the network of theprobes. Thus our definition of user-visible is problems that were potentially user-visible,i.e., service problems observed by operators and monitoring tools within the service infra-structure, that would have been visible externally if a user had tried to access the serviceduring the failure.
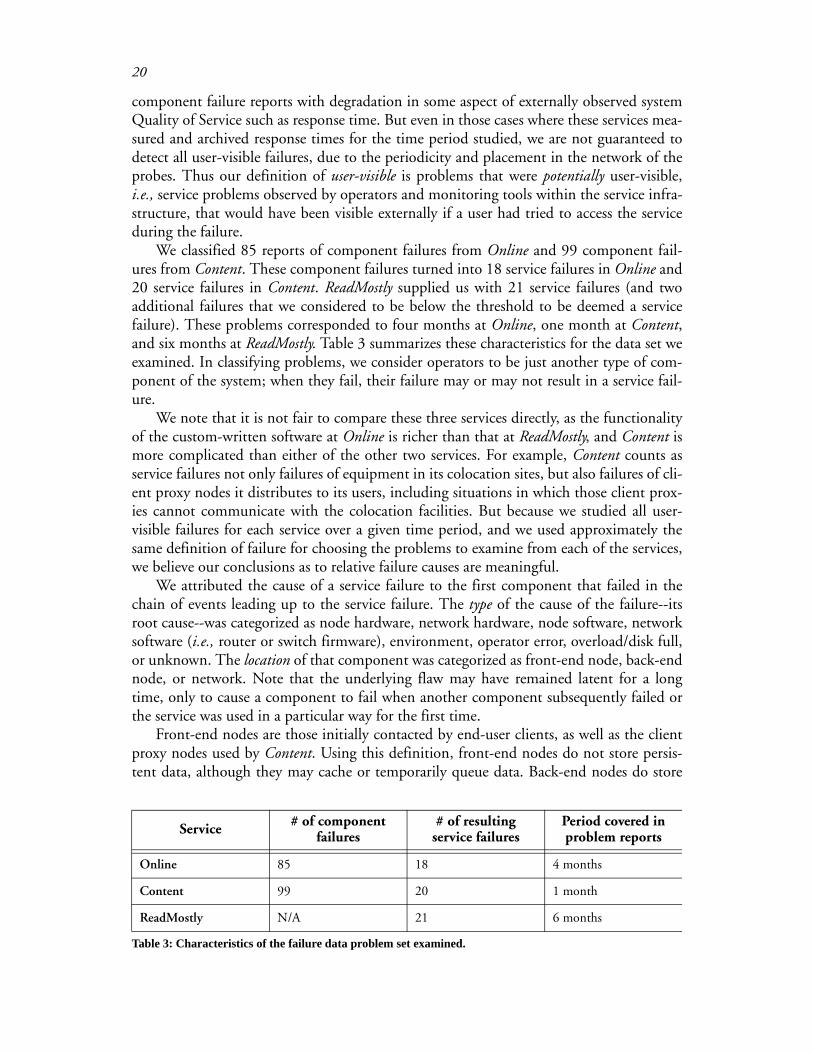
We classified 85 reports of component failures from Online and 99 component fail-ures from Content. These component failures turned into 18 service failures in Online and20 service failures in Content. ReadMostly supplied us with 21 service failures (and twoadditional failures that we considered to be below the threshold to be deemed a servicefailure). These problems corresponded to four months at Online, one month at Content,and six months at ReadMostly. Table 3 summarizes these characteristics for the data set weexamined. In classifying problems, we consider operators to be just another type of com-ponent of the system; when they fail, their failure may or may not result in a service fail-ure.
We note that it is not fair to compare these three services directly, as the functionalityof the custom-written software at Online is richer than that at ReadMostly, and Content ismore complicated than either of the other two services. For example, Content counts asservice failures not only failures of equipment in its colocation sites, but also failures of cli-ent proxy nodes it distributes to its users, including situations in which those client prox-ies cannot communicate with the colocation facilities. But because we studied all user-visible failures for each service over a given time period, and we used approximately thesame definition of failure for choosing the problems to examine from each of the services,we believe our conclusions as to relative failure causes are meaningful.
We attributed the cause of a service failure to the first component that failed in thechain of events leading up to the service failure. The type of the cause of the failure--itsroot cause--was categorized as node hardware, network hardware, node software, networksoftware (i.e., router or switch firmware), environment, operator error, overload/disk full,or unknown. The location of that component was categorized as front-end node, back-endnode, or network. Note that the underlying flaw may have remained latent for a longtime, only to cause a component to fail when another component subsequently failed orthe service was used in a particular way for the first time.
Front-end nodes are those initially contacted by end-user clients, as well as the clientproxy nodes used by Content. Using this definition, front-end nodes do not store persis-tent data, although they may cache or temporarily queue data. Back-end nodes do store
Service # of component failures
# of resulting service failures
Period covered in problem reports
Online 85 18 4 months
Content 99 20 1 month
ReadMostly N/A 21 6 months
Table 3: Characteristics of the failure data problem set examined.
21
persistent data. The “business logic” of traditional three-tier systems terminology is there-fore part of our definition of front-end, a reasonable decision because these services inte-grate their service logic with the code that receives and replies to client requests.
Most problems were relatively easy to map into this two-dimensional location-typespace, except for wide-area network problems. Network problems affected the linksbetween colocation facilities for all services, and, in the case of Content, also between cus-tomer sites and colocation facilities. Because the root cause of such problems often laysomewhere in the network of an Internet Service Provider to whose records we did nothave access, the best we could do with such problems was to label the location as networkand the cause as unknown.
4.2 Analysis of component and service failure causes
We analyze our data on component and service failure with respect to three properties:how many component failures turned into service failures, categorized by location andtype (Section 4.2.1); the relative frequency of each component and service failure rootcause, categorized by location and type (Section 4.2.2); and the Mean Time To Repair(MTTR) of each root cause location and type (Section 4.2.2)
4.2.1 Component failures resulting in service failures
As described in Section 2, the services we studied use redundancy in an attempt to maskcomponent failures. That is, they try to prevent component failures from turning into ser-vice failures. As indicated by Figure 7 and Figure 8, these techniques generally do a goodjob of preventing hardware, software, and network component failures from turning intoservice failures, but they are much less effective at preventing operator failures frombecoming service failures. A qualitative analysis of the failure data suggests that this isbecause operator actions tend to be performed on files that affect the operation of theentire service or of a partition of the service, e.g., configuration files or content files. Nodehardware and software failures are masked relatively well. Network failures generally arenot masked as effectively because of the smaller degree of network redundancy as com-pared to node redundancy. This masking issue is discussed in more detail in the next sec-tion.
4.2.2 Failure root causes and time to repair
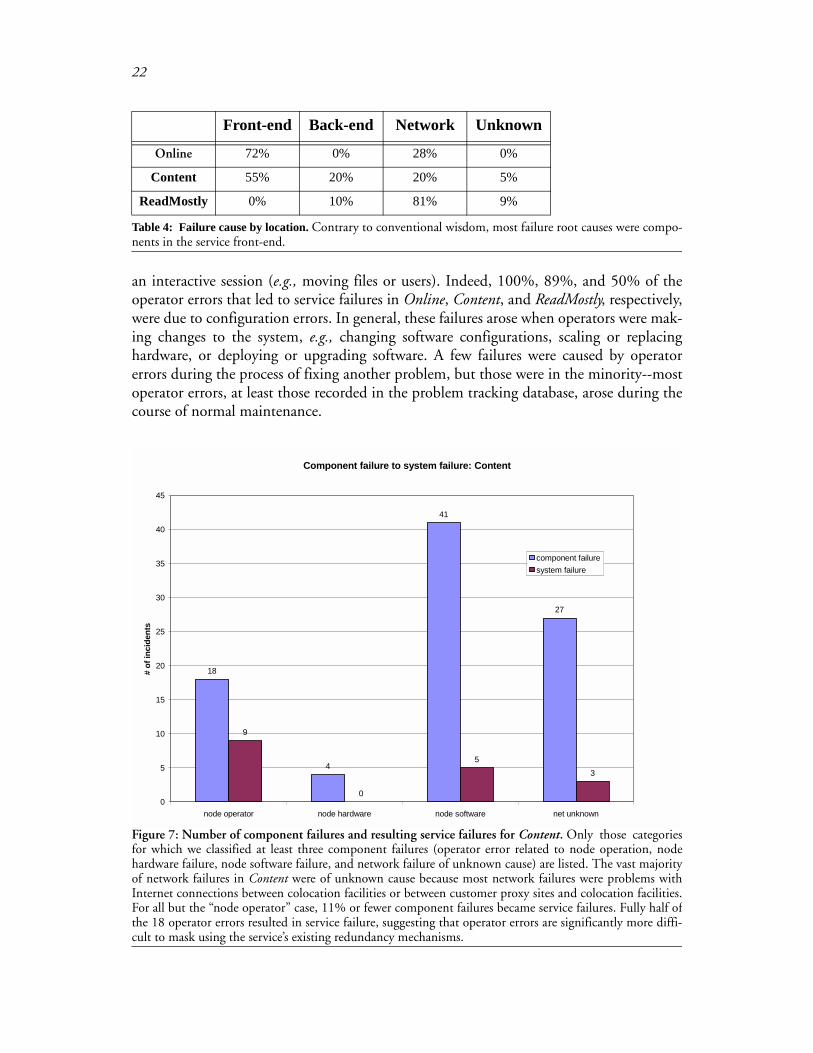
Next we examine the source and magnitude of service failures, categorized by the rootcause location and type of component failure. Table 4 shows that contrary to conventionalwisdom, front-end machines are a significant source of failure--in fact, they are responsi-ble for more than half of the service failures in Online and Content. This fact was largelydue to operator error in configuration and administration of front-end software (bothapplication and operating system). Almost all of the problems in ReadMostly were net-work-related; this was likely due to simpler and better-tested application software at thatservice, less operator “futzing” with the service on a day-to-day basis, and a higher degreeof hardware redundancy than is used at Online and Content.
Table 5 shows that operator error is the largest single cause of service failures in Onlineand Content. Operator error in all three services tended to take the form of configurationerrors (errors in setting up configuration files) rather than procedural errors made during
22
an interactive session (e.g., moving files or users). Indeed, 100%, 89%, and 50% of theoperator errors that led to service failures in Online, Content, and ReadMostly, respectively,were due to configuration errors. In general, these failures arose when operators were mak-ing changes to the system, e.g., changing software configurations, scaling or replacinghardware, or deploying or upgrading software. A few failures were caused by operatorerrors during the process of fixing another problem, but those were in the minority--mostoperator errors, at least those recorded in the problem tracking database, arose during thecourse of normal maintenance.
Component failure to system failure: Content
18
4
41
27
9
0
53
0
5
10
15
20
25
30
35
40
45
node operator node hardware node software net unknown
# of
inci
dent
s
component failuresystem failure
Figure 7: Number of component failures and resulting service failures for Content. Only those categoriesfor which we classified at least three component failures (operator error related to node operation, nodehardware failure, node software failure, and network failure of unknown cause) are listed. The vast majorityof network failures in Content were of unknown cause because most network failures were problems withInternet connections between colocation facilities or between customer proxy sites and colocation facilities.For all but the “node operator” case, 11% or fewer component failures became service failures. Fully half ofthe 18 operator errors resulted in service failure, suggesting that operator errors are significantly more diffi-cult to mask using the service’s existing redundancy mechanisms.
Front-end Back-end Network Unknown
Online 72% 0% 28% 0%
Content 55% 20% 20% 5%
ReadMostly 0% 10% 81% 9%
Table 4: Failure cause by location. Contrary to conventional wisdom, most failure root causes were compo-nents in the service front-end.
23
Networking problems were the largest cause of failure in ReadMostly and, as men-tioned in Section 4.2.1, somewhat more difficult to mask than node hardware or softwarecomponent failures. An important reason for these facts is that networks are often a singlepoint of failure. For example, ReadMostly was the only site we examined that used redun-dant first and second-level switches within clusters. Also, consolidation in the collocationand network provider industries has increased the likelihood that “redundant” networklinks out of a collocation facility will actually share a physical link fairly close (in terms ofInternet topology) to the data center. Moreover, network failure modes tend to be com-plex: networking hardware and software can fail outright or become overloaded and startdropping packets. Combined with the inherent redundancy of the Internet, these failuremodes generally lead to increased latency and decreased throughput, often experiencedintermittently--far from the “fail stop” behavior that high-reliability hardware and soft-ware aims to achieve. Finally, because most services use a single network operations center,operators sometimes cannot see the network problems among their collocation sites orbetween their collocation sites and customers; these problems may thus be at the root of amysterious performance problem or outage.
Colocation facilities did appear effective in eliminating “environmental” problems--noenvironmental problems, such as power, temperature, and so forth, led to service failure.
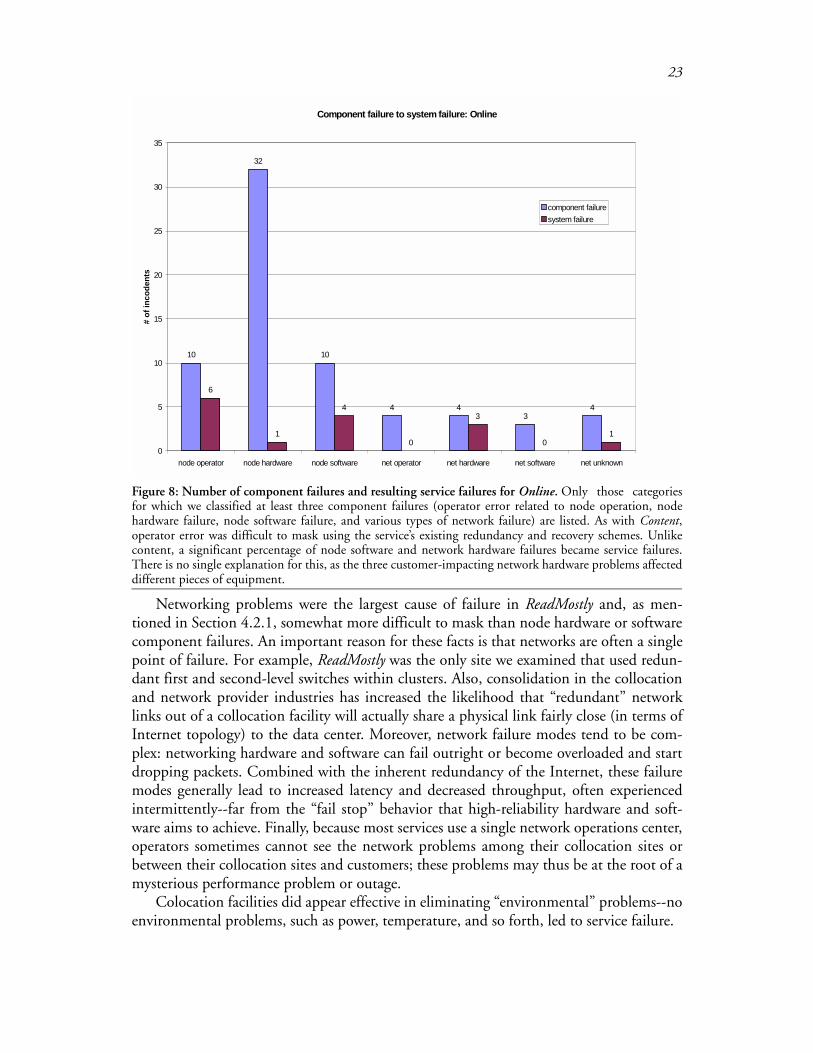
Figure 8: Number of component failures and resulting service failures for Online. Only those categoriesfor which we classified at least three component failures (operator error related to node operation, nodehardware failure, node software failure, and various types of network failure) are listed. As with Content,operator error was difficult to mask using the service’s existing redundancy and recovery schemes. Unlikecontent, a significant percentage of node software and network hardware failures became service failures.There is no single explanation for this, as the three customer-impacting network hardware problems affecteddifferent pieces of equipment.
Component failure to system failure: Online
10
32
10
4 43
4
6
1
4
0
3
01
0
5
10
15
20
25
30
35
node operator node hardware node software net operator net hardware net software net unknown
# of
inco
dent
s
component failuresystem failure
24
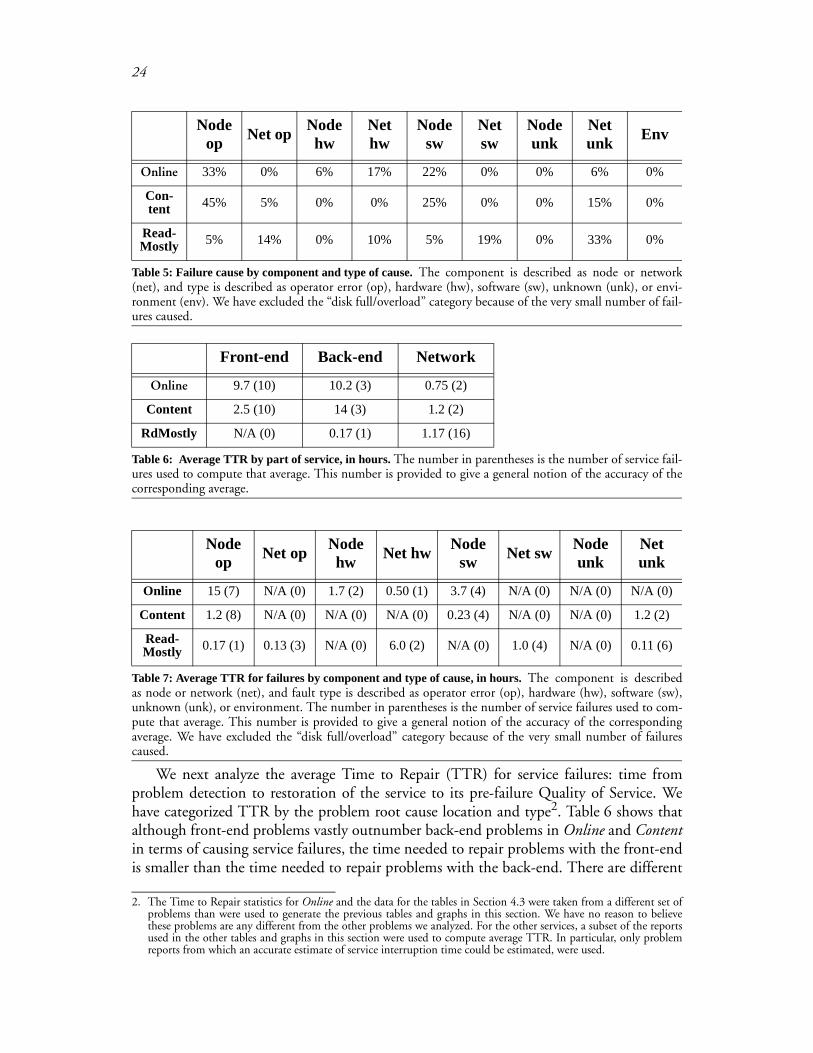
We next analyze the average Time to Repair (TTR) for service failures: time fromproblem detection to restoration of the service to its pre-failure Quality of Service. Wehave categorized TTR by the problem root cause location and type2. Table 6 shows thatalthough front-end problems vastly outnumber back-end problems in Online and Contentin terms of causing service failures, the time needed to repair problems with the front-endis smaller than the time needed to repair problems with the back-end. There are different
2. The Time to Repair statistics for Online and the data for the tables in Section 4.3 were taken from a different set ofproblems than were used to generate the previous tables and graphs in this section. We have no reason to believethese problems are any different from the other problems we analyzed. For the other services, a subset of the reportsused in the other tables and graphs in this section were used to compute average TTR. In particular, only problemreports from which an accurate estimate of service interruption time could be estimated, were used.
Node op Net op Node
hwNet hw
Node sw
Net sw
Node unk
Net unk Env
Online 33% 0% 6% 17% 22% 0% 0% 6% 0%
Con-tent 45% 5% 0% 0% 25% 0% 0% 15% 0%
Read-Mostly 5% 14% 0% 10% 5% 19% 0% 33% 0%
Table 5: Failure cause by component and type of cause. The component is described as node or network(net), and type is described as operator error (op), hardware (hw), software (sw), unknown (unk), or envi-ronment (env). We have excluded the “disk full/overload” category because of the very small number of fail-ures caused.
Front-end Back-end Network
Online 9.7 (10) 10.2 (3) 0.75 (2)
Content 2.5 (10) 14 (3) 1.2 (2)
RdMostly N/A (0) 0.17 (1) 1.17 (16)
Table 6: Average TTR by part of service, in hours. The number in parentheses is the number of service fail-ures used to compute that average. This number is provided to give a general notion of the accuracy of thecorresponding average.
Node op Net op Node
hw Net hw Node sw Net sw Node
unkNet unk
Online 15 (7) N/A (0) 1.7 (2) 0.50 (1) 3.7 (4) N/A (0) N/A (0) N/A (0)
Content 1.2 (8) N/A (0) N/A (0) N/A (0) 0.23 (4) N/A (0) N/A (0) 1.2 (2)
Read-Mostly 0.17 (1) 0.13 (3) N/A (0) 6.0 (2) N/A (0) 1.0 (4) N/A (0) 0.11 (6)
Table 7: Average TTR for failures by component and type of cause, in hours. The component is describedas node or network (net), and fault type is described as operator error (op), hardware (hw), software (sw),unknown (unk), or environment. The number in parentheses is the number of service failures used to com-pute that average. This number is provided to give a general notion of the accuracy of the correspondingaverage. We have excluded the “disk full/overload” category because of the very small number of failurescaused.
25
reasons for the two services: for Content this was due to incidents involving serious back-end software bugs that were difficult to isolate and fix, while in Online this was due to anoperator error that was extremely difficult to undo (a repartition of users that was per-formed incorrectly).
Table 6 and Table 7 indicate that networking problems generally have the smallestTime to Repair. This is because the locus of a network problem is usually easy to deter-mine, and the fix is generally rebooting, rebooting and reloading (possibly updated) firm-ware, or switching out a failed component with another identical one.
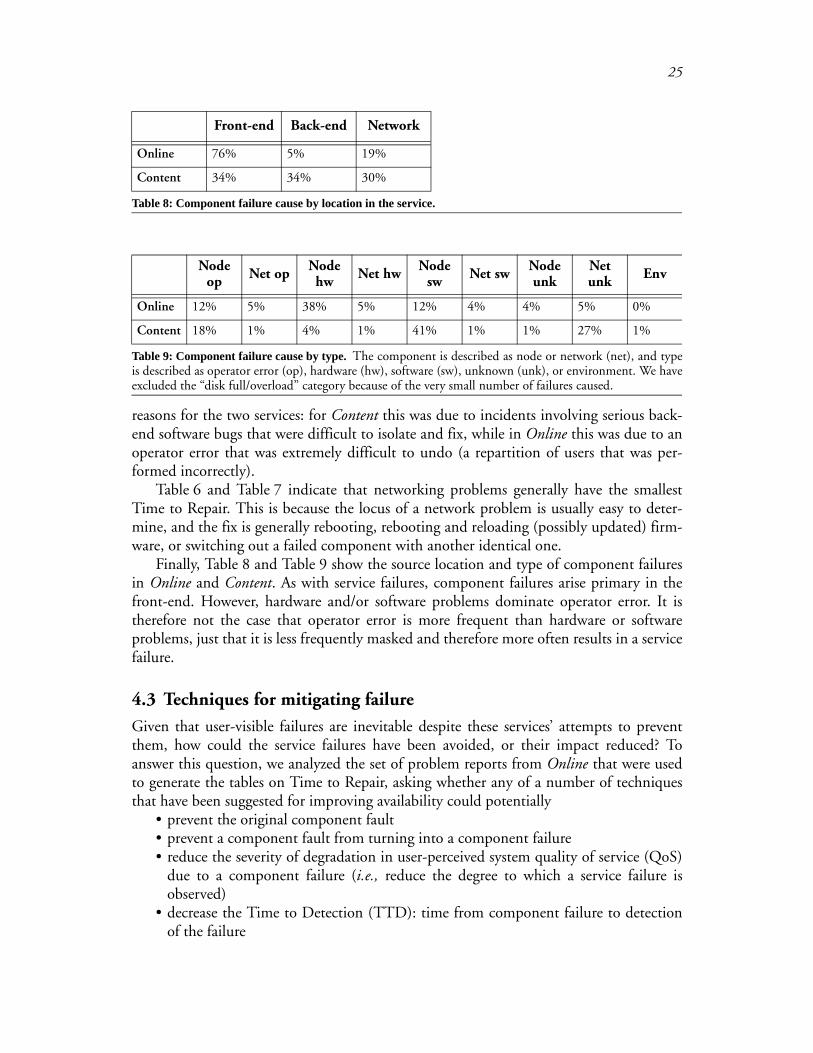
Finally, Table 8 and Table 9 show the source location and type of component failuresin Online and Content. As with service failures, component failures arise primary in thefront-end. However, hardware and/or software problems dominate operator error. It istherefore not the case that operator error is more frequent than hardware or softwareproblems, just that it is less frequently masked and therefore more often results in a servicefailure.
4.3 Techniques for mitigating failure
Given that user-visible failures are inevitable despite these services’ attempts to preventthem, how could the service failures have been avoided, or their impact reduced? Toanswer this question, we analyzed the set of problem reports from Online that were usedto generate the tables on Time to Repair, asking whether any of a number of techniquesthat have been suggested for improving availability could potentially
• prevent the original component fault• prevent a component fault from turning into a component failure• reduce the severity of degradation in user-perceived system quality of service (QoS)
due to a component failure (i.e., reduce the degree to which a service failure isobserved)
• decrease the Time to Detection (TTD): time from component failure to detectionof the failure
Front-end Back-end Network
Online 76% 5% 19%
Content 34% 34% 30%
Table 8: Component failure cause by location in the service.
Node op Net op Node
hw Net hw Node sw Net sw Node
unkNet unk Env
Online 12% 5% 38% 5% 12% 4% 4% 5% 0%
Content 18% 1% 4% 1% 41% 1% 1% 27% 1%
Table 9: Component failure cause by type. The component is described as node or network (net), and typeis described as operator error (op), hardware (hw), software (sw), unknown (unk), or environment. We haveexcluded the “disk full/overload” category because of the very small number of failures caused.
26
• decrease the Time to Repair (TTR): time from component failure detection to com-ponent repair. (This corresponds to the time during which system QoS is degraded.)
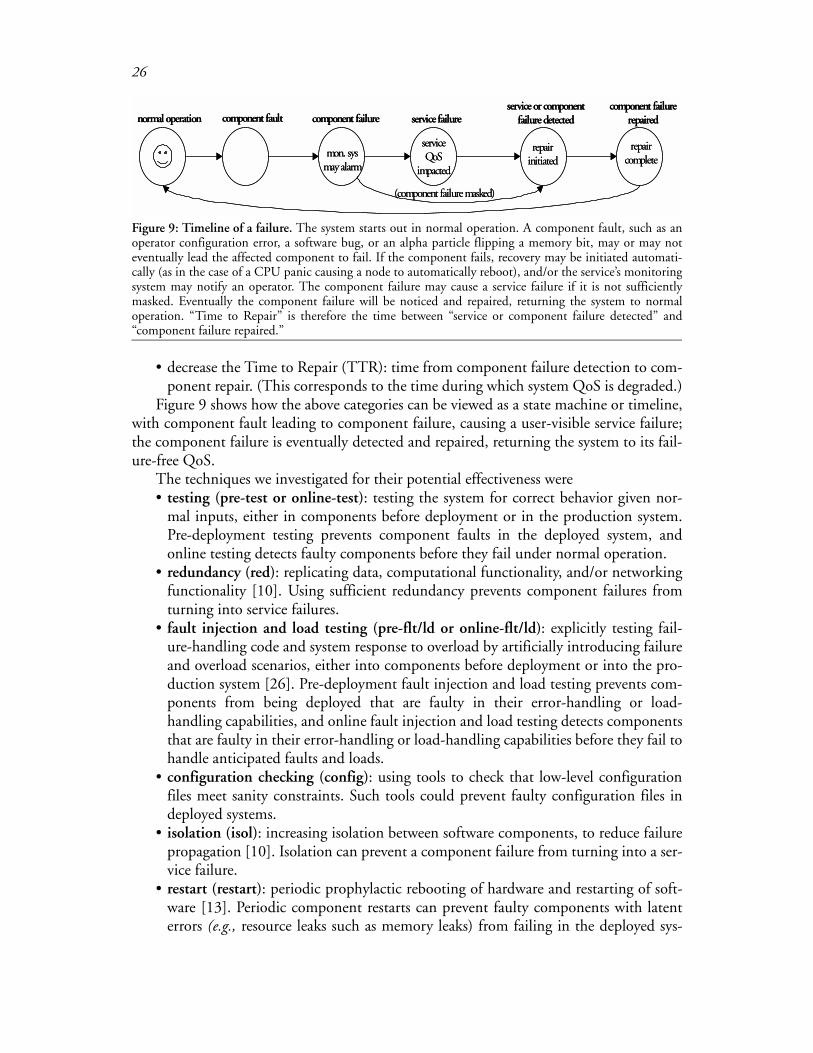
Figure 9 shows how the above categories can be viewed as a state machine or timeline,with component fault leading to component failure, causing a user-visible service failure;the component failure is eventually detected and repaired, returning the system to its fail-ure-free QoS.
The techniques we investigated for their potential effectiveness were• testing (pre-test or online-test): testing the system for correct behavior given nor-
mal inputs, either in components before deployment or in the production system.Pre-deployment testing prevents component faults in the deployed system, andonline testing detects faulty components before they fail under normal operation.
• redundancy (red): replicating data, computational functionality, and/or networkingfunctionality [10]. Using sufficient redundancy prevents component failures fromturning into service failures.
• fault injection and load testing (pre-flt/ld or online-flt/ld): explicitly testing fail-ure-handling code and system response to overload by artificially introducing failureand overload scenarios, either into components before deployment or into the pro-duction system [26]. Pre-deployment fault injection and load testing prevents com-ponents from being deployed that are faulty in their error-handling or load-handling capabilities, and online fault injection and load testing detects componentsthat are faulty in their error-handling or load-handling capabilities before they fail tohandle anticipated faults and loads.
• configuration checking (config): using tools to check that low-level configurationfiles meet sanity constraints. Such tools could prevent faulty configuration files indeployed systems.
• isolation (isol): increasing isolation between software components, to reduce failurepropagation [10]. Isolation can prevent a component failure from turning into a ser-vice failure.
• restart (restart): periodic prophylactic rebooting of hardware and restarting of soft-ware [13]. Periodic component restarts can prevent faulty components with latenterrors (e.g., resource leaks such as memory leaks) from failing in the deployed sys-
Figure 9: Timeline of a failure. The system starts out in normal operation. A component fault, such as anoperator configuration error, a software bug, or an alpha particle flipping a memory bit, may or may noteventually lead the affected component to fail. If the component fails, recovery may be initiated automati-cally (as in the case of a CPU panic causing a node to automatically reboot), and/or the service’s monitoringsystem may notify an operator. The component failure may cause a service failure if it is not sufficientlymasked. Eventually the component failure will be noticed and repaired, returning the system to normaloperation. “Time to Repair” is therefore the time between “service or component failure detected” and“component failure repaired.”
component fault component failure service failureservice or component
failure detectedcomponent failure
repairednormal operation
(component failure masked)
mon. sysmay alarm
serviceQoS
impacted
repairinitiated
repaircomplete
component fault component failure service failureservice or component
failure detectedcomponent failure
repairednormal operation
(component failure masked)
mon. sysmay alarm
serviceQoS
impacted
repairinitiated
repaircomplete
27
tem. For example, periodically rebooting a node that is running software that has amemory leak can prevent the leak from growing large enough to cause the node toexhaust its available swap space and thereby crash.
• exposing (exp/mon): better exposing software and hardware component failure toother modules and/or to a monitoring system, or using better tools to diagnoseproblems. This technique can reduce time to detect and repair component failures.
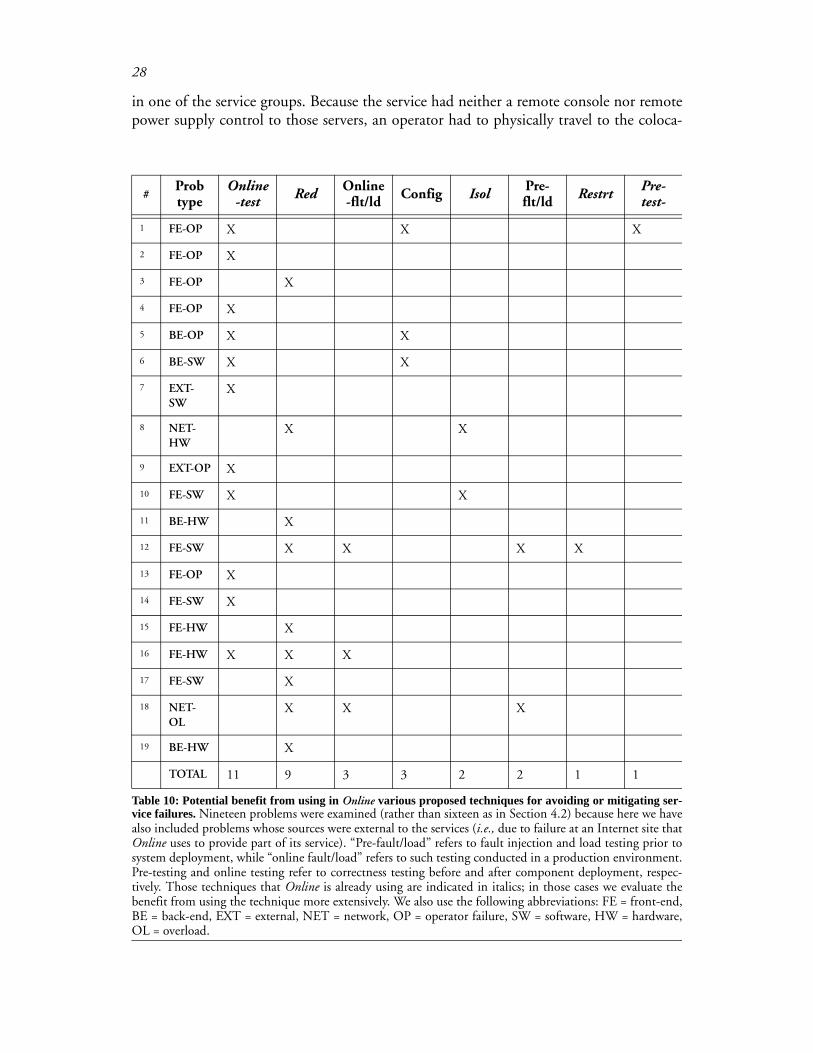
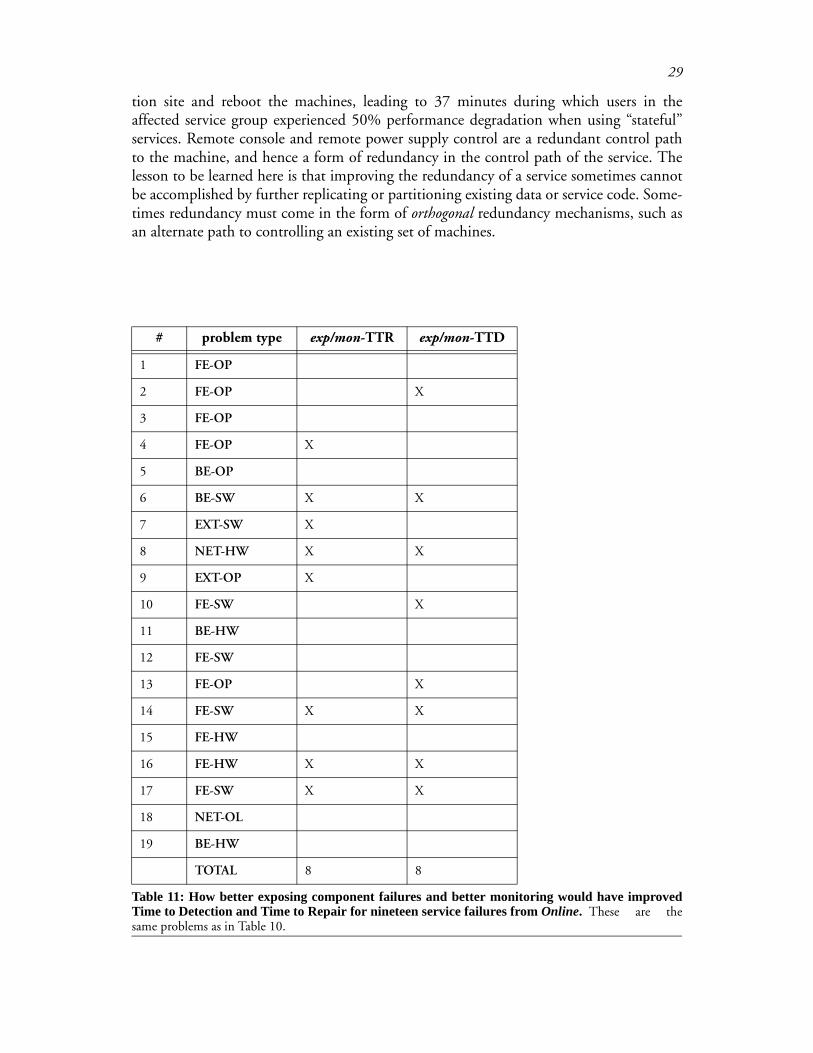
Table 10 shows the number of problems from Online’s problem tracking database forwhich use, or more use, of each technique could potentially have prevented the problemthat directly caused the system to enter the failure state described in the previous para-graph as corresponding to that failure mitigation technique. Table 11 does the same, butshows how each technique could reduce Time to Repair and Time to Detection.
Note that if a technique prevents a problem from causing the system to enter somefailure state, it also necessarily prevents the problem from causing the system to enter asubsequent failure state. For example, checking a configuration file might prevent a com-ponent fault, which therefore prevents the fault from turning into a system-level failure, adegradation in QoS, a need to detect the failure, and a need to repair the failure. Also,note that techniques that reduce time to detect or time to repair component failure reducethe overall service loss experienced (we define the loose notion of “overall service loss” asthe amount of QoS lost during the failure, multiplied by the duration of the failure).
From Table 10 and Table 11 we observe that just increasing the degree of redundancyand using online testing would have mitigated 8 and 11 service failures in Online, respec-tively. Furthermore, more thoroughly exposing and reacting to software and hardware fail-ures would have decreased TTR and/or TTD in 8 instances. Automatic sanity checking ofconfiguration files, and online fault and load injection, also appear to offer significantpotential benefit. Note that of the techniques, Online already uses redundancy, isolation,restart, and pre-deployment and online testing, so Table 10 and Table 11 underestimatethe effectiveness of adding those techniques to a system that does not already use them.
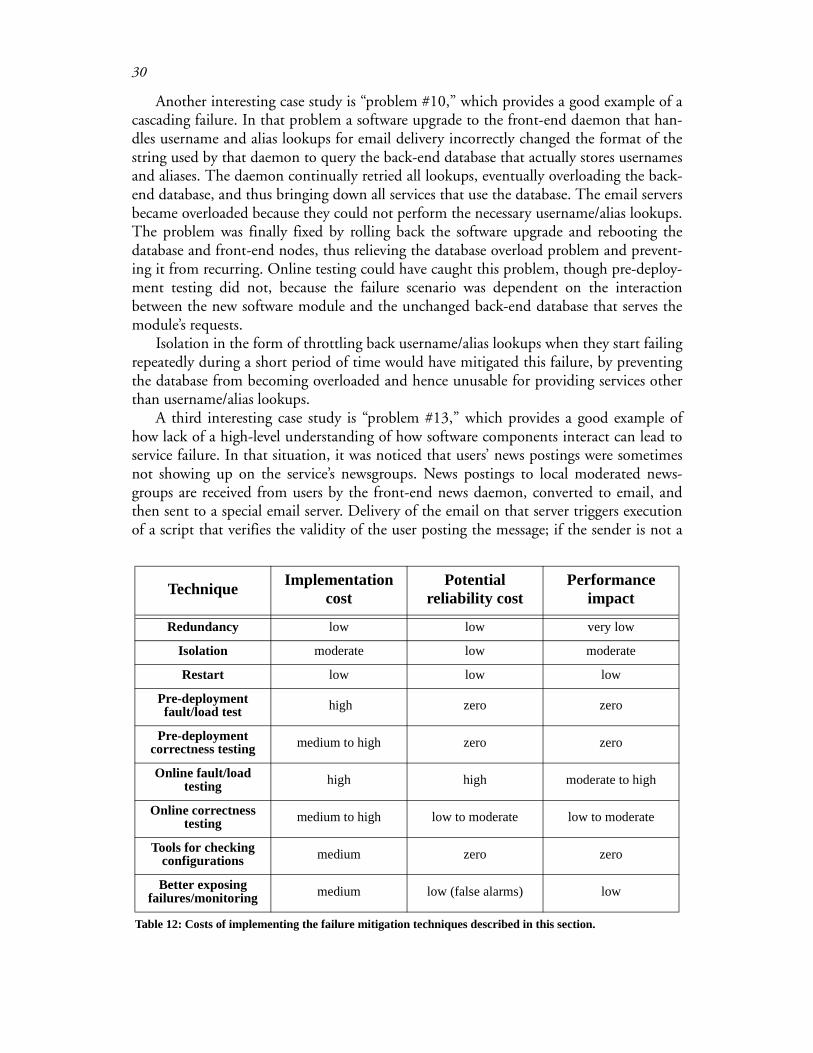
All of the failure mitigation techniques described in this section have not only benefits(which we have just analyzed), but also costs. These costs may be financial or technical.Technical costs may come in the form of a performance degradation (e.g., by increasingservice response time or reducing throughput) or in the potential to actually reduce reli-ability (if the complexity of the technique means bugs are likely in the technique’s imple-mentation). We analyze the proposed failure mitigation techniques with respect to theircosts in Table 12. With this cost tradeoff in mind, we observe that two techniques of add-ing additional redundancy and better exposing failures offer significant “bang for thebuck” in the sense that they would have helped mitigate a relatively large number of fail-ure scenarios (as indicated in Table 10 and Table 11) while incurring relatively low cost.
4.4 Case studies
In this section we examine in detail a few of the more interesting service failures fromOnline.
One interesting case study is “problem #3” from Section 4.5; only one technique weexamined, redundancy, would have mitigated the service failure in that case. In that prob-lem, an operator at Online accidentally brought down half of the front-end servers usingthe same administrative shutdown command issued individually to three of the six servers
28
in one of the service groups. Because the service had neither a remote console nor remotepower supply control to those servers, an operator had to physically travel to the coloca-
#Probtype
Online-test Red Online
-flt/ld Config Isol Pre-flt/ld Restrt Pre-
test-
1 FE-OP X X X
2 FE-OP X
3 FE-OP X
4 FE-OP X
5 BE-OP X X
6 BE-SW X X
7 EXT-SW
X
8 NET-HW
X X
9 EXT-OP X
10 FE-SW X X
11 BE-HW X
12 FE-SW X X X X
13 FE-OP X
14 FE-SW X
15 FE-HW X
16 FE-HW X X X
17 FE-SW X
18 NET-OL
X X X
19 BE-HW X
TOTAL 11 9 3 3 2 2 1 1
Table 10: Potential benefit from using in Online various proposed techniques for avoiding or mitigating ser-vice failures. Nineteen problems were examined (rather than sixteen as in Section 4.2) because here we havealso included problems whose sources were external to the services (i.e., due to failure at an Internet site thatOnline uses to provide part of its service). “Pre-fault/load” refers to fault injection and load testing prior tosystem deployment, while “online fault/load” refers to such testing conducted in a production environment.Pre-testing and online testing refer to correctness testing before and after component deployment, respec-tively. Those techniques that Online is already using are indicated in italics; in those cases we evaluate thebenefit from using the technique more extensively. We also use the following abbreviations: FE = front-end,BE = back-end, EXT = external, NET = network, OP = operator failure, SW = software, HW = hardware,OL = overload.
29
tion site and reboot the machines, leading to 37 minutes during which users in theaffected service group experienced 50% performance degradation when using “stateful”services. Remote console and remote power supply control are a redundant control pathto the machine, and hence a form of redundancy in the control path of the service. Thelesson to be learned here is that improving the redundancy of a service sometimes cannotbe accomplished by further replicating or partitioning existing data or service code. Some-times redundancy must come in the form of orthogonal redundancy mechanisms, such asan alternate path to controlling an existing set of machines.
# problem type exp/mon-TTR exp/mon-TTD
1 FE-OP
2 FE-OP X
3 FE-OP
4 FE-OP X
5 BE-OP
6 BE-SW X X
7 EXT-SW X
8 NET-HW X X
9 EXT-OP X
10 FE-SW X
11 BE-HW
12 FE-SW
13 FE-OP X
14 FE-SW X X
15 FE-HW
16 FE-HW X X
17 FE-SW X X
18 NET-OL
19 BE-HW
TOTAL 8 8
Table 11: How better exposing component failures and better monitoring would have improvedTime to Detection and Time to Repair for nineteen service failures from Online. These are thesame problems as in Table 10.
30
Another interesting case study is “problem #10,” which provides a good example of acascading failure. In that problem a software upgrade to the front-end daemon that han-dles username and alias lookups for email delivery incorrectly changed the format of thestring used by that daemon to query the back-end database that actually stores usernamesand aliases. The daemon continually retried all lookups, eventually overloading the back-end database, and thus bringing down all services that use the database. The email serversbecame overloaded because they could not perform the necessary username/alias lookups.The problem was finally fixed by rolling back the software upgrade and rebooting thedatabase and front-end nodes, thus relieving the database overload problem and prevent-ing it from recurring. Online testing could have caught this problem, though pre-deploy-ment testing did not, because the failure scenario was dependent on the interactionbetween the new software module and the unchanged back-end database that serves themodule’s requests.
Isolation in the form of throttling back username/alias lookups when they start failingrepeatedly during a short period of time would have mitigated this failure, by preventingthe database from becoming overloaded and hence unusable for providing services otherthan username/alias lookups.
A third interesting case study is “problem #13,” which provides a good example ofhow lack of a high-level understanding of how software components interact can lead toservice failure. In that situation, it was noticed that users’ news postings were sometimesnot showing up on the service’s newsgroups. News postings to local moderated news-groups are received from users by the front-end news daemon, converted to email, andthen sent to a special email server. Delivery of the email on that server triggers executionof a script that verifies the validity of the user posting the message; if the sender is not a
Technique Implementation cost
Potential reliability cost
Performance impact
Redundancy low low very low
Isolation moderate low moderate
Restart low low low
Pre-deployment fault/load test high zero zero
Pre-deployment correctness testing medium to high zero zero
Online fault/load testing high high moderate to high
Online correctness testing medium to high low to moderate low to moderate
Tools for checking configurations medium zero zero
Better exposing failures/monitoring medium low (false alarms) low
Table 12: Costs of implementing the failure mitigation techniques described in this section.
31
valid Online user, the server silently drops the message. The service operators at somepoint had configured that email server not to run the daemon that looks up usernamesand aliases (the same daemon as is described in problem #10 above), so the server wassilently dropping all news-postings-converted-into-email-messages that it was receiving.The operators accidentally configured that special email server not to run the user-name/alias lookup daemon because they did not realize that proper operation of that mailserver depended on its running the username/alias lookup daemon.
The lessons to be learned here are that operators need an understanding of the high-level dependencies among the software modules that comprise the service, and that soft-ware should never silently drop messages or other data in response to an error condition.Online testing would have detected this dependency, while better exposing failures, andimproved techniques for diagnosing failures, would have decreased the amount of timeneeded to detect and localize this problem.
Finally, “problem #9“is representative of the occasional failures Online experiencedbecause of problems with external services. In this case, Online used an external providerfor one of its services3. That external provider made a configuration change to its serviceto restrict the IP addresses from which users could connect. In the process, they acciden-tally blocked clients of Online. This problem was difficult to identify because of a lack ofthorough error reporting in Online’s software and a lack of communication betweenOnline and the external service when the external service made the change. Online testingof the security changes would have detected this problem.
Although problems with external providers were rare during the time period of prob-lem tickets we examined from Online, this type of problem is likely to become increas-ingly common as composed network services become more common. Indeed, techniquesthat could have prevented several failures described in this section--orthogonal redun-dancy, isolation, and understanding the high-level dependencies among software mod-ules--are likely to become more difficult, and yet essential to reliability, in a world ofplanetary-scale ecologies of networked services.
Our data argues for the importance of including techniques such as online testing,exposing and logging of operator actions, thorough reporting of errors, good distributeddiagnosis tools, and communication among service providers. We believe it is importantthat APIs for these emerging services allow for easy online testing, automatic propagationof errors to code modules and/or operators that can handle them, and distributed control-flow and data-flow tracing to help detecting, diagnosing, and debugging performance,functionality, and security failures.
4.5 Comments on data collection and analysis
The process of collecting and analyzing failure data from Online, Content, and ReadMostly,and attempting to collect and/or analyze failure data from a number of other organiza-tions, has led us to several observations about the data collection and analysis processitself.
First, our use of operations problem tracking databases may have skewed our results.At both Online and Content, entries are made in the database both automatically andmanually. A new problem ticket is opened automatically when the monitoring software
3. We do not indicate the nature of the outsourced service because it might help to reveal the actual identity of Online.
32
detects a that a monitored component (e.g., a node) is not responding properly. A newproblem ticket is opened manually when an operator detects a problem or is notified of aproblem by a customer. Therefore an operator can “cover up” an error he or she made if itdoes not cause a problem that anyone notices. This may happen if the operator fixes theerror before it causes an observable component or service failure, or if the operator makesthe error in the course of fixing another failure but does not cause a different componentor service failure. This imprecision has two important impacts. First, by leaving out oper-ator failures that are “covered up,” we are underestimating the operator failure percentageof total component and service failure causes. Second, our observation in Section 4.2.2that most operator errors were made during the course of normal maintenance (not whilefixing a problem) may simply be because operators were reluctant to record errors theymade, but were able to correct, while fixing a problem.
Second, the contents of most problem reports were useless except for the name of thecomponent that failed and the human operator narrative log. Both Online and Contentused customized failure tracking databases (based on software by Remedy, Inc.), but vitalfields such as problem type, problem cause, whether the problem affected customers, andproblem duration, were often filled in wrong. We extracted this information by readingthe operator log; because it is timestamped, we could extract problem duration for mostproblems.
Third, even if operators were forced to fill in the existing problem type and problemcause fields correctly, the problem forms used by the problem tracking databases (1) usenonstandard, and often insufficiently sufficient, categories; and (2) do not allow for mul-tiple causes of a problem to be expressed. The first problem could be addressed by insti-tuting a standard taxonomy for problem causes. We used an ad hoc taxonomy in thissection, based on dividing root cause location into front-end, back-end, or network, androot cause type into the cross-product of <node or network> and <hardware, software,operator, or unknown>. An additional improvement would be to allow multiple failurecauses to be indicated, with the rule that the components contributing to the failure(starting with the root cause) be listed in the temporal order in which they contributed tothe problem. This listing of all contributors to a failure would allow a variety of informa-tion to be computed automatically, such as the frequency and magnitude of cascading fail-ures, the number of components typically involved in cascades, which types of failures aremost likely to be part of a cascade (and hence suggestions where failure isolation bound-aries needed to be strengthened), and the like.
Fourth, even if operators were forced to fill in the existing problem duration fieldaccurately, the services do not measure true customer impact by computing a metric likecustomer-minutes [16]. Computing this metric would require knowing the number ofcustomers who were using the service or the portion of the service that is affected duringthe service failure. Alternatively, customer-minutes could be estimated by using historicaldata about the number of customers who are generally using the service, or the portion ofthe service that is affected, at about the time and day of the week of the failure.
Finally, we note that we used a combination of text files and spreadsheets to recordand tabulate the data presented in this section. This was a mistake--we should have keptthe data in a database of our own. Using text files and spreadsheets, we had to make a newpass over the entire dataset each time we wanted to try a different categorization of thedata or ask a new “question” about it. The flexible querying enabled by databases would
33
have allowed us to avoid numerous passes over the source data. Certainly we now knowwhat the appropriate database schema would look like for future failure analysis data col-lection.
4.6 Conclusion
From our examination of the failure data from Online, Content, and ReadMostly, we con-clude that
• operator error is the leading contributor to user-visible failures;• operator error is the most difficult type of failure to mask, and generally comes in
the form of configuration mistakes;• contrary to conventional wisdom, front-end software can be a significant cause of
user-visible failure, primarily due to operator configuration mistakes;• back-end failures, while infrequent, take longer to repair than do front-end failures;
andSo, as we ask in the title of this report, what can be done to avoid or mitigate failures? Clearly, better online testing would have mitigated a large number of system failures
in Online. The kind of online testing that would have helped is fairly high-level tests thatrequire application semantic information (e.g., posting a news article and checking to seethat it showed up in the newsgroup, or sending email and checking to see that it isreceived correctly and in a timely fashion). Unfortunately these kinds of tests are hard towrite and need to be changed every time the service functionality or interface changes.But, qualitatively we can say that this kind of testing would have helped with the otherservices we examined as well, so it seems worth pursuing in real systems.
Online fault injection and load testing would also have been helpful in Online andother services. This observation goes hand-in-hand with the need for better exposing fail-ures and monitoring for those failures--online fault injection and load testing are ways toensure that component failure monitoring mechanisms are correct and sufficient. Choos-ing a set of representative faults and error conditions, instrumenting code to inject thosefaults and error conditions, and then monitoring for a response, requires potentially evenmore work than does online testing. Moreover, online fault injection and load testingessentially require an isolated subset of the production service to be used, because of thethreat to reliability and performance that they pose if used in the standard productioncluster. But we found that, despite the best intentions, test clusters tend to be set upslightly differently than the production cluster, so any partitioning mechanism needs to beextremely transparent, perturbing the configuration of the system being tested as little aspossible.
Despite the huge contribution of operator error to service failures, operator error isalmost completely overlooked in designing high-dependability systems and the tools usedto monitor and control them. This oversight is particularly problematic because as ourdata shows, operator error is the most difficult component failure to mask through tradi-tional redundancy. We found that tools to sanity check configuration files against actualsystem configuration and operator intent would have helped to avoid most operatorserrors. A high-level specification of operator intent is a form of semantic redundancy, atechnique that is useful for catching errors in other contexts (types in programming lan-guages, data structure invariants, and so on). Unfortunately there are no widely used

34
generic tools to allow an operator to specify in a high-level way how the service’s architec-ture should appear and how the service it should work functionally, such that the specifi-cation could be checked against the existing configuration.
An overarching difficulty related to diagnosing and fixing problems relates to problemsolving with multiple entities. Even single-function Internet services like Content andReadMostly require coordinated activity by multiple administrative entities for diagnosingand solving some problems. These entities include the network operations staff of the ser-vice, the service's software developers, the operators of the collocation facilities that theservice uses, the network providers between the service and its collocation facilities, andsometimes the customers (in cases where customer problems are escalated to the service'soperations staff). Today, this coordination is almost entirely handled manually, via tele-phone calls to contacts at the various services. Tools for determining the root cause ofproblems across administrative domains are rudimentary, e.g., traceroute, and the toolsgenerally cannot distinguish between certain types of problems, such as end-host failuresfrom network problems on the network segment where a node is located. Moreover, toolsfor fixing a problem once its source is located are controlled by the administrative entitythat owns the broken hardware or software, not by the site that determines that the prob-lem exists, and that may be the most affected by it. These problems lead to increasedMean Time to Repair for problems.
Clearly, improvements could be made in the area of tools and techniques for problemdiagnosis and repair across administrative boundaries. This issue is likely to become evenmore important in the age of composed network services built on top of emerging plat-forms such as Microsoft's .NET and Sun's SunOne.
Qualitatively we can say that redundancy, isolation through partitioning into statelessfront-ends and stateful back-ends, incremental rollout of code, integrating operations anddevelopment roles, periodic component restart, and offline component testing, are allimportant, and already widely-used, techniques for achieving high availability in large-scale Internet services. We note that the observed need for more redundancy in Onlinewas more an artifact of Online’s architecture than a valid generalization across multipleservices. In particular, their use of a single back-end database to store information aboutcustomer billing, passwords, and so on, represented a single point of failure that causedmany service failures. Similarly, the use of only six “storefull” machines per service groupfrequently led to service failure in the face of correlated failures on a few of thosemachines. The other services we examined generally used sufficient redundancy.
35
Section 5
Related work
Because large-scale commercial Internet services are a relatively new phenomenon, theirarchitecture, operational practices, and failure causes are relatively unstudied. Some havestudied or made suggestions for appropriate architectures of such sites [2] [21] but we arenot aware of any studies of operational practices or failure causes.
A number of studies have been published on the causes of failure in various types ofcomputer systems that are not commonly used for running Internet sites, and in opera-tional environments unlike those of Internet services. Gray [10] [11] is responsible for themost widely cited studies of reliable computer system failure data. In 1986 he found thathuman error was the largest single cause of failure in deployed Tandem systems, account-ing for 42% of failures, with software the runner-up at 25%. Somewhat amusingly, wefound almost identical percentages at Online and Content (an average of 39% for nodeoperator error and 24% for node software). He found hardware to be responsible for 18%of failures and environmental problems to be responsible for 14%; we found that nodehardware and environmental problems contributed negligibly to failures in Online andContent, but that networking problems largely replaced those two categories in causingproblems (responsible for about 20% of failures). In 1989, however, he found that soft-ware had become the major source of outages (55%), swamping the second largest con-tributor, system operations (15%). He found that hardware and software outages have anMTTR of 4 hours and operations outages an MTTR of 10 hours, but that these distribu-tions have very high variance. We are wary to compare the results in Table 7 to our resultsbecause we found hardware TTR was so much smaller than software TTR, and operationsTTR was so widely varying. Finally, Gray also looked at the length of fault chains; thoughwe did not analyze this quantitatively, he found longer fault chains than we did (Grayfound 20% of fault chains were of length three or more, with only 20% of length one,whereas we found that almost all chains were of length two (the system was designed tomask a component failure but some other problem caused it not to) or one (the systemwas not designed to mask a particular failure mode).
Kuhn [16] examined two years of data on failures in the Public Switched TelephoneNetwork as reported to the FCC by telephone companies. He concluded that humanerror was responsible for more than 50% of failure incidents, and about 30% (still thelargest single cause of failure) in terms of customer impact (measuring in customer min-utes, i.e.., number of customers impacted multiplied by number of minutes the failurelasted). Enriquez [9] extended this study by examining a year’s worth of more recent dataand also considering the blocked calls metric collected on the outage reports. She came toa similar conclusion--human error was responsible for more than 50% of outages, cus-tomer-minutes, and blocked calls.
36
Several studies have examined failures in networks of workstations. Thakur et al. [32]examined failures in a network of 69 SunOS workstations but only divided problem rootcause into network, non-disk machine problems, and disk-related machine problems.Kalyanakrishnam et al. [15] studied six months of event logs from a LAN of WindowsNT workstations used for mail delivery, to determine the causes of machines rebooting.They found that most problems are software-related, and that average downtime is twohours. They used a state machine model of system failure states similar in spirit to, thoughmore detailed than, our Figure 9 to describe failure timelines on a single node. In a closelyrelated study, Xu et al. [34] studied a network of Windows NT workstations used for24x7 enterprise infrastructure services, again by studying the Windows NT event logentries related to system reboots. Unlike the Thakur or Kalyanakrishnam studies, this oneallowed operators to annotate the event log to indicate the reason for reboot; thus theauthors were able to draw conclusions about the contribution of operator failure to systemoutages. They found that planned maintenance and software installation and configura-tion caused the largest number of outages (18% and 8%, respectively), and that systemsoftware and planned maintenance caused the largest amount of total downtime (22%and 13%, respectively). They were unable to classify a large percentage of the problems(58%). We note that they counted reboots after installation or patching of software as a“failure.” Their software installation/configuration category therefore is not comparable toour operator failure category, despite its being named somewhat similarly.
A number of researchers have examined the causes of failures in enterprise-class serverenvironments. Sullivan and Chillarege [28] [29] examined software defects in MVS, DB2,and IMS. Tang and Iyer [31] did the same for the VAX/VMS operating system in twoVAXclusters. Lee and Iyer [18] categorized software faults in the Tandem GUARDIANoperating system. Murphy and Gent [23] examined causes of system crashes in VAX sys-tems between 1985 and 1993; in 1993 they found that hardware was responsible forabout 10% of failures, software for about 20% of failures, and system management for abit over 50% of failures. Lancaster and Rowe [17] recently examined NFS data availabilityin Network Appliance’s NetApp filers. They found that power failures and software fail-ures were the largest contributors to downtime, with operator failures contributing negli-gibly.
Finally, there is a large body of existing work in the areas of system monitoring, diag-nosis, and configuration. SNMP is the most commonly used protocol for remote moni-toring of networked devices [6]. A number of free and commercial products use SNMPalerts as the basis of their monitoring systems; examples include Netcool [20], OpenView[12], and various offerings from Tivoli [14].
True root cause analysis and problem diagnosis are significantly more complicatedthan simple monitoring. Among the most sophisticated systems recently developed is theauto-diagnosis subsystem that comprises part of Network Appliance’s Data ONTAP oper-ating system [1]. It combines continuous monitoring, protocol augmentation, cross-layeranalysis, active probing, and automatic configuration change tracking to detect and local-ize hardware and software problems in NetApp fileservers.
Tools for automating the configuration of computer systems date back at least to theearly 1980’s, with McDermott’s R1, which was used to suggest how to physically config-ure VAX 11/780 systems given a customer’s order [19]. Recent tools for deploying andconfiguring software include Sun’s JumpStart [30] and Burgess’s Cfengine [5].

37

38
39
Section 6
Conclusion and future work
We have studied the architecture, operational practices, and failure data of three large-scale Internet services. Despite differences in number of users, number of machines, andworkload, these service, and others we surveyed but did not describe in this report, share anumber of similarities with respect to their node, site, and geographic structure and build-ing blocks, as well as many of their operational practices. From a study of approximately200 component failures and approximately 60 user-visible service failures, we draw con-clusions about failure distribution across parts of the service, the primary contributors tofailure and their associated Times to Repair, and the effectiveness of redundancy tech-niques at preventing component failure from turning into service-level failure. Finally, wedescribe a “thought experiment” in which we explore how various failure mitigation tech-niques might have prevented component faults from occurring, component faults fromturning into component failures, component failures from turning into service failures,and might have reduced time to detect and time to repair failures.
This work suggests a number of future directions, in the areas of both failure data col-lection and analysis, and benchmarking.
6.1 Future directions for failure data collection and analysis
There are a number of avenues for expanding the data collection and analysis workdescribed in this paper. First, it would be interesting to examine data from a broader spec-trum of services, particularly over a range of service type (e.g., including e-commerce, animportant category of service that we did not examine in this study), maturity, rate ofchange, architecture, and operational practices. In doing so, one could attempt to corre-late some of these service characteristics to overall service dependability. Also, more ser-vices means more data, which would increase the statistical validity of our results.
Second, it would be interesting to collect more data from the three services we havealready examined, both to increase the statistical significance of the data, and as part of alongitudinal study of one or more services. A longitudinal study might address questionssuch as whether a service becomes more reliable over time (because software qualityimproves, operators learn from their mistakes, etc.). While Online and ReadMostly are rela-tively mature services, Content would be an excellent candidate for such a study, because itdid mature in both software and operational practices over the time period of the datasetto which we have access (although not the single month we examined in this study). Also,with more data (from the services we have already examined or from new ones) we would
40
be able to examine the role of failure propagation in causing service failures, something wewere not able to do because there simply were not enough problem reports that actuallyinvolved multiple component failures leading to a larger failure. It would be interesting tosee what components are most often involved in such cascading failure scenarios, toinform the implementation of better isolation boundaries or to otherwise decorrelate cor-related failures.
A third avenue for expanding the work described in this paper is to broaden the rangeof quantitative metrics we are collecting. Among the possibilities are
• the time between the events of fault occurrence, component failure, service failure(or masking of the component failure), problem detection, service recovery (i.e.,original pre-failure service QoS restored), service restored to being fully redundant,and fixing the original flaw (by repairing a software bug, fixing a maintenance pro-cess, and the like)
• metrics that take into account the number of customers impacted, e.g., “customer-minutes” or an Internet service analog of “blocked calls,” both of which are used tocharacterize failures in the Public Switched Telephone Network [16]
• instead of treating service failure impact as binary (either a failure was severe enoughto be considered a service failure or it was not), metrics that take into account thetype and degree of Quality of Service degradation, e.g., the fraction of the servicethat is unavailable or the percent reduction in service response time or throughput
• metrics that take into account revenue lost to the service itself and/or its customers,as well as the cost of repairing failures
• metrics internal to the service, as opposed to purely user-visible ones (e.g., numberof false alarms relative to true alarms)
• number of operators needed to repair different types of problems• number of components involved in cascading failure scenarios• number of problems that are automatically repaired (e.g., a RAID system recon-
structing onto a spare disk) as opposed to simple masked through redundancyFourth, it would be useful to investigate additional qualitative information related to
problems, possibly leading to additional taxonomies for classifying them. We have implic-itly used two taxonomies in this study to describe root cause: “location” of the failure(front-end, back-end, network) and “type” of the failure (the two-dimensional cross prod-uct of <node, network> x <hardware, software, operator, overload/disk full, unknown>).But there are other ways to classify failures. For example, one could look at the scope ofthe impact--a single component, a node, a rack of servers, a datacenter, or the entire ser-vice. Or, one could try to trace problems back to the fault rather than just the type ofcomponent failure, and then describe the fault using a taxonomy like that in [25] (e.g.,physical vs. logical, manufacturing vs. design vs. operation, and so on). Additional inter-esting attributes for partitioning problems include whether the fault originated in the ser-vice or with a vendor, whether a particular failure mode was anticipated or not, and whatthe exact causes of operator errors were (configuration vs. procedural, initial deploymentvs. routine maintenance vs. responding to an existing problem, and so on). Finally, itwould be interesting to classify problems according to what actions the services took inresponse to the problems (e.g., using a short-term fix versus fixing the root cause); whattype of fix, if any, was used (software vs. process vs. architectural), and whether the fix pre-vented the problem from recurring.
41
Fifth, it would be interesting to correlate the failures we observed to actual changes inQuality of Service as observed by end-users (or simulated end-users, e.g., using a globallydistributed testing service such as Keynote). As noted in Section 4.1, the study we con-ducted looked at failures only from a vantage point within the service; we did not actuallyverify our intuition about which component failures had “significant” end-user visibleimpacts (in degradation of performance or service functionality or fidelity) and whichwere truly masked by redundancy.
Sixth, it would be interesting to examine the potential benefit of other failure mitiga-tion techniques that have been proposed, including improvements in operations pro-cesses, and to investigate ways to quantify the benefits of potential mitigation techniques.
We have only begun to explore the potential value of mining failure data. Only byallowing many researchers to access failure datasets can the full potential of this data beexplored. Our experience was that companies are extremely reluctant to release this data,especially for examination off-site, out of concern for their own privacy and that of ven-dors and customers who may be mentioned in problem reports. The solution to this prob-lem is to develop a standard for anonymizing failure data. Such a system requires astandard schema for problem reports, including a taxonomy of underlying fault causesand failed component locations and types. Of course, the accuracy of such a datasethinges on operators’ filling out the multiple-choice part of problem report forms muchmore accurately than they did at the two services we examined that use problem trackingdatabases. Alternatively, a human researcher could read the operator narratives from theproblem reports, ignoring the fields that we found were often filled out incorrectly, suchas root cause, whether customers were affected, problem duration, and so on, and coercethis data into a standard format. Either way, such data then could be put into a databaseaccessible by researchers either for downloading or through interactive querying via theweb. We believe that this dataset would be of similar value as existing datasets of CPUinstruction traces in the architecture community, network intrusion traces in the securitycommunity, and SQL workloads in the database community. Of course, one common useof such datasets is benchmarking (new CPU and system architecture designs, new intru-sion detection techniques, and new database architectures and implementations, in theprevious examples), so we next discuss how the data we have collected could be used todrive dependability and recoverability benchmarks.
6.2 Making use of failure data: benchmarks
In this report we have examined failure data to learn why systems fail. In addition tostudying this data to point to how individual services and services as a whole can improvetheir dependability, we can use the data to drive service-level dependability or recoverybenchmarks akin to the availability benchmarks described in [4]. Such benchmarksrequire a faultload, and the data we have collected, including that related to relativelyunder-studied failure causes such as those induced by humans and those occurring in net-works among geographically distributed sites, could be turned into a stochastic faultmodel to drive dependability or recoverability benchmarks. Non-binary Quality of Servicemetrics such as throughput, fraction of service functionality available, response time,financial cost of unavailability, and the like could be used to measure the impact of failuresand subsequent recovery (be it automatic or human-controlled) while a workload is pre-sented the system.
42
To perform a recoverability benchmark, the data presented in this report, perhaps aug-mented with data from other services, could be used to establish the set of componentfailures that services experience. The simplest way to evaluate a service is to inject each ofthe component failure modes we have observed (including operator failures) one at a timeand to measure the service’s Quality of Service response. The Quality of Service decreasewhile the service is affected is an inverse measure of its “recoverability.” These responses tocomponent failures can be reported individually, to indicate how a service could improveits recoverability. A somewhat more sophisticated evaluation would weight the responsesto these individual recovery events by the relative frequency with which the differentclasses of failures occur in the service being benchmarked, to indicate an aggregate mea-sure of the service’s recoverability. Finally, one could test multi-failure scenarios, asdescribed in [4], to test system response to cascading failures and human repair activityfollowing an initial failure.
Benchmarking dependability is similar to benchmarking recoverability, but it requiresinformation about the absolute frequency with which the failures occur. In other words,for dependability benchmarks, we need to know the MTTF for each component that willfail, whereas a service’s “recoverability” depends only on the mix of component failures itis likely to experience. The recoverability benchmark described above can be turned into adependability benchmark by weighting the QoS responses to the recovery events by thefrequencies of the component failures computed from their MTTF.
We must also address the issue of what workload should be presented to the systemwhile it is being benchmarked. In this respect, Internet service benchmarks are more diffi-cult to design than are benchmarks for traditional applications, e.g., SPECweb and SPEC-mail [27], because for Internet services the workload is very site-specific. Among existingbenchmarks, TPC-W [33] comes closest to approximating what the workload for anInternet service benchmark might look like, in the sense that it specifies a mixture of high-level user tasks rather than a protocol-level workload (as in SPECweb and SPECmail). Itmay be possible to formulate a taxonomy of Internet service functionality (email, news,instant messenger, web search, retrieving static web content, auctions, traditional web-based product ordering, and so on), and then to develop an application-level workloadsimilar to TPC-W’s but targeted to each of these services. Then, an Internet service couldbe benchmarked for the particular mixture of services it provides.
Note that not only user activities, but also operator activities, are a vital component ofa service-level benchmark workload. Because Internet services operate 24x7, administra-tive tasks such as preventative hardware maintenance, software upgrades, scaling, rebal-ancing data across back-end machines, and the like should be considered a standard partof the workload. The data we collected for this report did not include routine administra-tive tasks (except when they resulted in a component or service failure), but one could askthe administrators of these or similar services to record their daily activities over a periodof several months. This data could then be used to build a stochastic model of operatoractivities (similar to the stochastic failure model described above and the stochastic work-load mixture utilized in TPC-W) to be used as part of the service workload.
Finally, one can imagine developing languages to specify user dependability require-ments and failure models of system components (hardware, software, networking, andhuman operators) so that tools can be developed (1) to match user performance anddependability requirements to system capabilities, and (2) to automate benchmark gener-ation and the fault injection process.

43

44
45
References
[1] G. Banga. Auto-diagnosis of field problems in an appliance operating system InProceedings of the 2000 USENIX Annual Technical Conference, 2000, 2000.
[2] E. Brewer. Lessons from giant-scale services. IEEE Internet Computing, July 2001.
[3] A. Brown and D. A. Patterson. To Err is Human. In Proceedings of the First Work-shop on Evaluating and Architecting System dependabilitY (EASY '01), 2001.
[4] A. Brown and D. A. Patterson. Towards Availability Benchmarks: A Case Study ofSoftware RAID Systems. Proceedings of the 2000 USENIX Annual Technical Confer-ence, San Diego, CA, 2000.
[5] M. Burgess. Cfengine: a site configuration engine. USENIX Computing systems,vol. 8, no. 3, 1995.
[6] J. Case, M. Fedor, M. Schoffstall, and J. Davin. A simple network managementprotocol (SNMP). Internet RFC 1157.
[7] R. Chillarege, S. Biytani, and J. Rosenthal. Measurement of failure rate in widelydistributed software. In Proceedings of the 25th International Symposium on Fault-Tolerant Computing, 1995.
[8] J. Christmansson and R. Chillarege. Generation of an error set that emulates soft-ware faults based on field data. In Proceedings of FTCS-26, 1996.
[9] P. Enriquez, A. Brown, and D. A. Patterson. Lessons from the PSTN for depend-able computing. Submission to Workshop on Self-Healing, Adaptive and self-MAN-aged Systems, 2002.
[10] J. Gray. A census of Tandem system availability between 1985 and 1990. TandemComputers Technical Report 90.1, 1990.
[11] J. Gray. Why do computers stop and what can be done about it? Symposium on reli-ability in distributed software and database systems, 3-12, 1986.
[12] Hewlett Packard. HP OpenView. http://www.openview.hp.com/
[13] Y. Huang, C. Kintala, N. Kolettis, and N. D. Fulton. Software rejuvenation: analy-sis, models, and applications. In Proceedings of 25th symposium on fault-tolerant com-puting, 1995.
46
[14] IBM. Tivoli software. http://www.tivoli.com/
[15] M. Kalyanakrishnam, Z. Kalbarczyk, and R. Iyer. Failure data analysis of a LAN ofWindows NT based computers. In Proceedings of the 18th IEEE Symposium on Reli-able Distributed Systems, 1999.
[16] D. R. Kuhn. Sources of failure in the public switched telephone network. IEEEComputer 30(4), 1997.
[17] L. Lancaster and A. Rowe. Measuring real-world data availability. Proceedings ofLISA 2001, 2001.
[18] I. Lee and R. Iyer. Software dependability in the Tandem GUARDIAN system.IEEE Transactions on Software Engineering, 21(5), 1995.
[19] J. McDermott. R1: A Rule-Based Configurer of Computer Systems. Artificial Intel-ligence vol. 19, no. 1, 1982.
[20] Micromuse. Netcool. http://www.micromuse.com/
[21] Microsoft TechNet. Building scalable services. http://www.microsoft.com/tech-net/treeview/default.asp?url=/TechNet/itsolutions/ecommerce/deploy/proj-plan/bss1.asp, 2001.
[22] B. Murphy. Windows 2000 Dependability. Proceedings of the IEEE InternationalConference on Dependable Systems and Networks, 2000.
[23] B. Murphy and T. Gent. Measuring system and software reliability using an auto-mated data collection process. Quality and Reliability Engineering International, Vol11, 1995.
[24] D. A. Patterson. A simple way to estimate the cost of downtime. Submission to16th Systems Administration Conference (LISA '02), 2002
[25] D. A. Patterson. Five nines of availability, million hour MTBF, and other myths.Submission to ;login, 2002.
[26] D. A. Patterson., A. Brown, P. Broadwell, G. Candea, M. Chen, J. Cutler, P.Enriquez, A. Fox, E. Kiciman, M. Merzbacher, D. Oppenheimer, N. Sastry, W. Tet-zlaff, J. Traupman, N. Treuhaft. Recovery-Oriented Computing (ROC): Motiva-tion, Definition, Techniques, and Case Studies. UC Berkeley Computer ScienceTechnical Report UCB//CSD-02-1175, 2002.
[27] Standard Performance Evaluation Corporation. http://www.spec.org/

47
[28] M. S. Sullivan and R. Chillarege. A comparison of software defects in databasemanagement systems and operating systems. In Proceedings of the 22nd InternationalSymposium on Fault-Tolerant Computing, 1992.
[29] M. Sullivan and R. Chillarege. Software defects and their impact on system avail-ability--a study of field failures in operating systems. In Proceedings of the 21st Inter-national Symposium on Fault-Tolerant Computing, 1991.
[30] Sun Microsystems. Solaris JumpStart. http://wwws.sun.com/software/solaris/archive/8/ds/ds-webstart/
[31] D. Tang and R. Iyer. Analysis of the VAX/VMS error logs in multicomputer envi-ronments--a case study of software dependability. In Proceedings of the Third Inter-national Symposium on Software Reliability Engineering, 1992.
[32] A. Thakur and R. Iyer. Analyze-NOW--an environment for collection adn analysisof failures in a network of workstations. IEEE Transactions on Reliability, R46(4),1996.
[33] Transaction Processing Council. http://www.tpc.org/
[34] J. Xu, Z. Kalbarczyk, and R. Iyer. Networked Windows NT system field failure dataanalysis. In Proceedings of the 1999 Pacific Rim International Symposium on Depend-able Computing, 1999.

48