Embed Size (px)
Citation preview

IZA DP No. 3974
Why Do Individuals Choose Self-Employment?
Christopher DawsonAndrew HenleyPaul Latreille
DI
SC
US
SI
ON
PA
PE
R S
ER
IE
S
Forschungsinstitutzur Zukunft der ArbeitInstitute for the Studyof Labor
January 2009
Why Do Individuals Choose
Self-Employment?
Christopher Dawson Swansea University
Andrew Henley
Swansea University and IZA
Paul Latreille Swansea University
Discussion Paper No. 3974 January 2009
IZA
P.O. Box 7240 53072 Bonn
Germany
Phone: +49-228-3894-0 Fax: +49-228-3894-180
E-mail: [email protected]
Any opinions expressed here are those of the author(s) and not those of IZA. Research published in this series may include views on policy, but the institute itself takes no institutional policy positions. The Institute for the Study of Labor (IZA) in Bonn is a local and virtual international research center and a place of communication between science, politics and business. IZA is an independent nonprofit organization supported by Deutsche Post Foundation. The center is associated with the University of Bonn and offers a stimulating research environment through its international network, workshops and conferences, data service, project support, research visits and doctoral program. IZA engages in (i) original and internationally competitive research in all fields of labor economics, (ii) development of policy concepts, and (iii) dissemination of research results and concepts to the interested public. IZA Discussion Papers often represent preliminary work and are circulated to encourage discussion. Citation of such a paper should account for its provisional character. A revised version may be available directly from the author.
IZA Discussion Paper No. 3974 January 2009
ABSTRACT
Why Do Individuals Choose Self-Employment?*
This paper undertakes an analysis of the motivating factors cited by the self-employed in the UK as reasons for choosing self-employment. Very limited previous research has addressed the question of why individuals report that they have chosen self-employment. Two questions are addressed using large scale labour force survey data for the UK. The first concerns the extent to which the self-employed are self-employed out of necessity, opportunity, lifestyle decision or occupational choice. The second concerns the extent to which there is heterogeneity amongst the self-employed on the basis of the motivations that they report for choosing self-employment. Factor analysis reveals a number of different dimensions of entrepreneurship on the basis of stated motivation, but with no evidence that being ‘forced’ into entrepreneurship through economic necessity is a significant factor. Motivation towards entrepreneurship is therefore highly multidimensional. Multivariate regression analysis is employed using a method to control for self-selection into self-employment. This reveals significant differences between men and women, with women concerned more with lifestyle factors and less with financial gain. Market-directed ‘opportunity’ entrepreneurship is more strongly associated with higher educational attainment. Those joining family businesses appear not to value prior educational attainment. Public policy to promote entrepreneurship therefore needs to be tailored carefully to different groups. JEL Classification: L26, J24 Keywords: self-employment, entrepreneurship, motivation, occupational choice Corresponding author: Andrew Henley School of Business and Economics Swansea University Singleton Park Swansea, SA2 8PP United Kingdom E-mail: [email protected]
* Dawson’s contribution to this work was funded through a research studentship from the UK Economic and Social Research Council in association with the Welsh Assembly Government.

1. Introduction
Self-employment is a form of labour market status which may encompass a wide
range of different activity. Individuals may choose to be self-employed for many different
reasons, and as a result the self-employed as a group may be highly heterogeneous. At one
end of a possible spectrum the self-employed may be identified as entrepreneurial, single
employee micro-businesses. A substantial body of research investigates the self-employed as
entrepreneurs, using self-employment as an observable category which, albeit imperfectly,
identifies the stock of entrepreneurial talent in the economy. At the other end this spectrum,
self-employment may comprise a far less desirable state chosen reluctantly by individuals
unable to find appropriate paid employment under current labour market conditions. So, for
example, individuals wanting flexible working hours might choose self-employment if a paid
employment contract offering sufficient flexibility is unavailable. For some self-employment
may be chosen as the only available alternative to unemployment. Indeed in many developing
economies self-employment may be viewed as a form of informal sector employment
activity.
To gain an understanding of the ‘positive’ reasons why individuals might choose to
become self-employed in order to venture a new business, a range of underlying motivations
might be considered. These might include, for example, the need for self-expression, for
independence, for status, or for pecuniary advantage. An extensive literature has addressed
the process of the formation of entrepreneurial intention (Krueger et al., 2000). Empirical
analysis typically develops a range of constructs related to the formation of entrepreneurial
intention by using detailed questionnaires with samples of individuals and correlating these
with reported strength of feeling about self-employment or entrepreneurship. In such studies
1

reported levels of interest in entrepreneurship are often very high, particularly if questions are
framed loosely in terms of open-ended career aspirations (see Blanchflower et al, 2001). Such
high levels are difficult to square with much lower levels of actual self-employment in many
countries. This suggests that intentions to become self-employed are either frustrated or that
self-reported aspirations are vague and poorly formed. A further literature in economics
models the choice of self-employment as an occupational choice decision, focusing on the
importance of background and demographic associations. A key objective of this literature,
taking its lead from the seminal study of Rees and Shah (1986), is to address whether the
choice of self-employment might be motivated by the expected income differential between
self-employment and employment for a given individual (see Le, 1999 and Parker, 2004, for
surveys).
Very little, if any, research has addressed the question of why those who have actually
chosen self-employment, made that choice. The preceding discussion suggested that the self-
employed can be classified into two broad types; those that have entered voluntarily for
reasons such as independence, job satisfaction and or anticipated higher incomes, and those
that have been ‘pushed’ into self-employed because of the absence of any other attractive
alternative. If the motivations behind the decision to become self-employed are largely the
former then self-employment can be viewed positively, providing the opportunity for
individuals to improve their quality of life and/or for exploring creative entrepreneurial
opportunities. Public policy which supports transitions into self-employment may therefore
have wider economic and societal benefits. On the other hand, if a substantial number are in
self-employment for ‘negative’ reasons then approaches to public policy which frame self-
employment in entrepreneurial terms may unwittingly encourage some to launch business
ventures for which they are ill-prepared and poorly resourced. Resulting spells of self-
2

employment may be short and disheartening, and in some cases may simply result in delayed
transition into unemployment.
In this paper we undertake an analysis of the motivating factors cited by the self-
employed in the UK as reasons for choosing self-employment over the alternative of paid
employment working for someone else. This is undertaken by analyzing information
contained within selected years of the UK Labour Force Survey, the main quarterly British
household survey of labour market activity. The principal contribution of the paper is to
provide a multivariate analysis of the association of a range of demographic and background
characteristics with differing motivations for choosing self-employment, whilst controlling
for the selection bias that arises because the self-employed as a group are unlikely to be
representative of the whole population of the economically active. Specifically then we are
concerned with two questions. The first concerns the extent to which the self-employed are
self-employed out of necessity, opportunity, lifestyle decision or occupational choice. The
second concerns the extent to which there is heterogeneity amongst the self-employed on the
basis of the motivations that they report for choosing self-employment. A factor analysis
finds the existence of a number of different dimensions of entrepreneurship on the basis of
stated motivation. We conclude that there are significant differences between different types
within the self-employed in terms of gender, ethnicity, educational attainment and housing
tenure status. The remainder of the paper is structured as follows. Section 2 provides further
background and reviews previous related literatures. Section 3 describes the data source used.
Section 4 discusses the methodology chosen to model self-employment motivation. Section 5
describes the results of the analysis. Section 6 provides a concluding discussion.
3

2. Background and Previous Literature
Entrepreneurship, as a topic for research, has grown dramatically in recent years
primarily due to the relationship thought to exist between entrepreneurial activity and
economic development. New firms are thought to create new employment opportunities
(Parker and Johnson 1996, Ashcroft and Love 1996). New firms are also thought to be
involved significantly in innovative activity, such that the role of innovative entrepreneurship
is viewed as a key transmission mechanism between the creation of knowledge and economic
growth (Audretsch, 2007). In addition, self-employment is an important occupational option
for many in the labour force. At any one time it may account for approximately a tenth of all
employed workers (Evans and Leighton, 1989).1 The perceived economic importance of
entrepreneurial activity has thus spawned extensive research attempting to understand the
characteristics of potential entrepreneurs, and the process of transition into entrepreneurship.
Whilst much previous empirical work has sought to determine what personal
characteristics separate the self-employed from the employed, less attention has been given to
the reasons that individuals cite for choosing self-employment. Moreover, very few previous
studies employ nationally representative data, and those that do, have generally refrained
from the further analysis of background characteristics that may be associated with these
motivations. Previous research on entrepreneurial motivations has predominantly focused on
‘push’ versus ‘pull’ factors, or to a lesser extent the divergence between the necessity
entrepreneur and the opportunity entrepreneur. Opportunity entrepreneurs start their business
venture voluntarily, that is as individuals attracted into self-employment by perceived
benefits such as independence, wealth, satisfaction, and personal and family motivations. In
4
contrast, necessity entrepreneurs are ‘pushed’ into self-employment because of negative
external forces, such as layoff and a subsequent lack of available paid-employment work.
At the aggregate level research has addressed the case for both ‘push’ and ‘pull’
theories by examining the relationship between self-employment and unemployment. There
is little agreement here. Theoretical arguments have been constructed in support of both a
positive and a negative relationship between self-employment and unemployment. On one
hand, the prosperity-pull hypothesis suggests that individuals are more likely to attempt to
start a new firm under conditions of economic expansion, when incomes are growing and
opportunities are strong for market specialisation. Accordingly, a higher new firm formation
rate may be associated with lower local unemployment. High unemployment will inhibit the
market demand for products of the self-employed, and expose those who are self-
employment to greater risk of falling incomes and possibly bankruptcy. This implies a
negative relationship between self-employment and unemployment.
On the other hand, according to the ‘push’ hypothesis, increasing levels of
unemployment reduce the prospects for finding paid employment; as a result the expected
returns from entrepreneurship become more attractive, pushing people into self-employment
(Storey, 1982; Storey and Johnson, 1987). Moreover, second hand capital becomes both
cheaper and more readily obtainable, as business closures increase in a time of recession.
Thus the recession-push hypothesis suggests that worsening economic conditions activate
previously dormant entrepreneurial ambitions, pushing individuals towards self-employment.
Therefore, the principal issue when using unemployment as an explanatory variable in an
empirical analysis of self-employment is one of identification. Unemployment will capture
both supply side and demand side effects. Whilst most cross sectional analysis has found a
negative association (for example, Evans and Leighton, 1989 and Blanchflower and Meyer,
5

1994), the majority of times series studies report significant positive correlation between self-
employment and unemployment, reflecting the recession push hypothesis (for example
Hamilton 1989). Some time series analyses, notably Black et al. (1996), Cowling and
Mitchell (1997) and Robson (1998) also report a positive association between house prices
and self-employment, consistent with a prosperity-pull hypothesis. Henley (2004), using
individual-level longitudinal data, finds that initial housing wealth exerts a positive effect on
the likelihood of being self-employed, but also reports that inertia plays an important role.
Once someone has been pulled or pushed in to self-employment they more likely to continue
to choose self-employment as an occupation. Some authors have identified windfall financial
gains as positively associated with transition into self-employment, for example Georgellis et
al. (2005). The transmission mechanism here between such indicators of individual economic
prosperity and entrepreneurship is thought to be the relationship between the value of
personal collateral and access to business loan finance.
Nearly all cross-sectional studies, using individual-level data, suggest that motivations
for choosing self-employment are dominated by positive factors. However studies which
sample only the self-employed suffer from a potential selection bias, which may lead to
differences between stated (ex-post) motivation and actual (ex ante) motivations. That is,
people may be reluctant to admit to negative factors ex post, preferring to provide
information which is consistent with revealed behaviour. This potential caveat must be
considered. Dennis (1996), reporting findings from a survey of around 3000 new business
founders in the USA in the late 1980s, suggests that people enter into self-employment
because they want to and not because of lack of available alternatives. In particular, just 8 per
cent of the sample described ‘the lack of alternatives’ as a very important motivation for
choosing self-employment. 57 per cent reported that using their ‘skills and abilities’ was a
6

very important motivating factor. 54 per cent reported that both ‘greater control over their
life’ and ‘building something for the family’ were very important motivating factors for
forming their own business. In a very small-scale study, Hughes (2003) uses data from 61
Canadian female respondents in the province of Alberta who are self-employed. In general
‘push’ factors were not found to be the primary motivator behind the decision to become self-
employed. In contrast most were motivated by reasons such as independence and a positive
working environment.
Similarly, using data from a much larger nationally representative survey of 3,840
self-employed Canadians for 2000, the same author reports that ‘independence/freedom’ is
the most important motivator for both men and women when entering into self-employment
(Hughes, 2006). 42 per cent of men and 24 per cent of women cite this as their main
motivation. For women, ‘work-family balance’ and ‘flexibility of hours’ were the next most
cited reasons. For men ‘challenge’ and ‘prospects of more money’ were the next most cited
motivators. Overall Hughes suggests that over 71 per cent of men can be classified as
‘opportunity’ entrepreneurs, with only 22 per cent pushed into self-employment as a result of
the lack of other suitable opportunities. A further 7 per cent of men could be classified as
‘work-family entrepreneurs’. For women the percentages were 53 per cent, 22 per cent and
25 per cent respectively, demonstrating for women the far greater importance of work-family
relationships when making the decision to become self-employed.
Taylor (1996), using UK data from 1991 found that self-employed Britons were less
likely then those in paid-employment to regard pay and security as important job criteria, but
were more likely to cite enjoyment and work satisfaction then their paid-employment
counterparts. Smeaton (2003), using UK data from 1986 and 2000, found that in 1986 16 per
7
cent of men cited ‘unemployment/redundancy’ as a motivating factor behind choosing self-
employment, whereas by 2000 this figure had risen to 26 per cent. For women the results
were 5 and 10 per cent respectively. The most cited reason for men in both 1986 and 2000, at
39 per cent, was a preference for being one’s own boss. For women in 1986 the most cited
motivating factor was ‘going into business with a family member’. By 2000 women cited
‘going into business with a family member’ equally at 23 per cent with ‘prefer to be own
boss’ and ‘to follow an interest’ as the most popular reasons. These results suggest that for
both men and women, despite lower rates of UK unemployment in 2000, the self-employed
seemed to have become more pessimistic about the availability of paid employment. Carter
et al (2003), find evidence from US data that the motivations offered by nascent
entrepreneurs when starting a business are dominated by self-realisation, financial success,
innovation and independence.
Frey and Benz (2003) assess the level of job satisfaction of the self-employed
compared to those in organizational employment using individual-level longitudinal data for
Germany, Switzerland and the UK. Although these data sources are not specifically
concerned with explicit motivations for choosing self-employment, the authors are able to
conclude that higher levels of subsequently reported job satisfaction amongst those
transitioning into self-employment are associated with an absence of hierarchy and sense of
independence, as proxied by the size of the former employer.
Whilst the ease with which alternative employment can be obtained may be an
important factor affecting a decision to transition into or remain in self-employment,
opportunity cost considerations are also important; that is the wage rate that might otherwise
be earned in paid-employment. In a seminal study, Rees and Shah (1986) find evidence that
8
provides support for self-employment/paid-employment decisions being made rationally on
the basis of a consideration of the expected earnings differential in the two states. Taylor
(1996) also finds that individuals appear to be attracted to self-employment because of higher
expected earnings. Similarly, Clark and Drinkwater (2000) suggest that the difference
between an individual’s predicted earnings in paid and self-employment exerts a powerful
influence upon the employment decision. On the other hand other studies, including Gill
(1988) and Earle and Sakova (2000), question this finding. These mixed empirical results
may be explained by the divergence of data sources used, the robustness of model
specifications and identifying exclusions, the ambiguous nature of the definition of
employment or self-employment and the difficulties in accurately measuring self-
employment income and therefore the differential between the two states. It is therefore open
to debate as to whether the expected financial gain from choosing self-employment is a
predominant factor in determining occupational status, or whether other non-pecuniary
considerations are of equal or greater importance.
Whilst this literature offers some pointers to potential motivations behind self-
employment as occupational choice, the direct survey evidence which is available is limited
and usually based upon small samples under non-random selection criteria. Moreover, whilst
an expansive literature exists on which personal characteristics separate entrepreneurs from
non-entrepreneurs, little attempt has been made to determine systematically what personal
characteristics are associated with the pattern of reported motivations for choosing self-
employment.2
9

3. UK Labour Force Survey Data Source
The data used in the present study is obtained from the United Kingdom Quarterly
Labour Force Survey (QLFS), covering the years 1999-2001. The QLFS is a national UK
household survey in which all adults at each sampled postal address are asked about current
labour market status and activity. The survey is used by the British government to provide
important labour market intelligence data, but is also made available, after a certain time lag,
to the research community in anonymised form for other secondary analysis. Although, the
QLFS has a panel design, with each household of the sample interviewed for 5 consecutive
quarters, we are primarily interested in individual responses to a schedule of ‘recall’
questions about self-employment choice asked of each individual, and so include only one
observation on each individual for analysis.3 Interviews were achieved at approximately
59,000 addresses in each quarter, resulting in a sample of approximately 138,000 individual
adult respondents in each quarter. The very large size of the QLFS means that it is possible to
obtain a large sample of observations on the self-employed, facilitating robust analysis of
particular sub-groups. The QLFS questionnaire includes schedules of household and
individual questions covering family structure, housing information, economic activity,
employment, educational and health issues.
Between 1999 and 2001, in each spring quarter only, all economically active adults,
who reported that their current status was self-employed, were asked about their motives
behind the decision to become self-employed. The exact wording of the question was as
follows:
“(Question 108) May I just check, why did you become self-employed? Was it…
1. to be independent / a change
10

2. wanted more money 3. for better conditions of work 4. family commitments / wanted to work at home 5. opportunity arose – capital, space, equipment available 6. saw the demand / market 7. joined the family business 8. nature of the occupation 9. no jobs available (locally) 10. made redundant 11. other reasons 12. no reason given”
(Source: QLFS questionnaire, Spring Quarter (March to May) 1999) Each individual respondent was asked to choose up to four reasons. Individual observations
are pooled across the three available Spring quarters providing a total pooled sample of
147,686 economically active individuals, of which 17,507 (11.9 per cent) are self-employed.4
As a result of multiple choices there are 23,851 choice responses to the question for these
17,507 self-employed respondents. Table 1 reports the proportions of the self-employed who
provide each reason for becoming self-employed using the pooled data over the period 1999
to 2001. Table 2 reports the proportions of total responses for each reason given, providing
columns which sum to 100 percent.
Overall Tables 1 and 2 suggest that, for the majority of respondents, entry into self-
employment is influenced by a range of non-pecuniary factors, of which the need for
‘independence’ is the most pronounced. This finding supports the conclusions in Dennis
(1996) and in Frey and Benz (2004) who suggest the attraction of entrepreneurship is work
satisfaction and independence, irrespective of income and hours worked. The next most cited
motivation in the QLFS is the ‘nature of the occupation’. This result suggests that a
significant minority of the self-employed select themselves into an occupation, such as a
professional trade in the construction sector or a profession such as lawyer or accountant, in
which self-employment is the most common mode of employment.
11

Other motivations, reflecting ‘pull’ factors, attract significant response levels. 5.4 per
cent of respondents cite the desire for ‘better working conditions’ and 8.8 per cent indicate as
a motivation that they ‘saw the demand’ for the product or service which they felt they had to
potential to provide. The least cited reason for choosing self-employment is the negative
motivation of a lack of ‘availability of jobs locally’. The nature of this option directly focuses
attention on those respondents who were forced into self-employment as the only viable
alternative to unemployment. Only just over 3 per cent of individuals indicate that the lack of
jobs available locally was a motivation behind their transition into self-employment. This
implies that for most the decision to become self-employed is overwhelmingly a positive
action. However, whilst there appears to be a low proportion motivated by the ‘availability of
jobs locally’ it is important to note that the UK unemployment rate averaged only around 6
per cent over the time period in question. The restrictive nature of this question makes it clear
that those individuals who cite this reason have been pushed into selecting self-employment.
Many of the other possible motivations, such as ‘more money’, ‘joined the family business’
and ‘family commitment’ could operate as either ‘push’ or ‘pull’ factors. For example, ‘more
money’ could be suggestive of attractive higher earnings in self-employment or could be
suggestive of perceived poor wages in the paid-employment sector. Moreover, motivations
that might typically be considered as attractors – for example, ‘to be independent’ and ‘better
conditions of work’, can undoubtedly also operate as ‘push’ factors. That is, a lack of
independence and poor working conditions in paid-employment pushes individuals into self-
employment. The difficulty of separating ‘push’ and ‘pull’ factors is emphasized further by
the multiple response nature of the question. Specifically, individuals may highlight both
‘push’ and ‘pull’ factors operating simultaneously to influence their decision to become self-
employed.
12

We turn now the different pattern of responses between men and women. Table 1
reports the results of t-tests for the significance of the difference in the response rates
between men and women for each motivating reason. In all but two cases these differences
are statistically significant. However ‘independence’ and ‘nature of the occupation’ are the
two most commonly cited motivations for both men and women, although the proportion of
women citing ‘independence’ is considerably lower than for men. The most important
difference in the pattern of responses is that nearly 22 per cent of women cite ‘family
commitments’ as a reason for choosing self-employment, compared to only 2 per cent of
men. Corresponding to the importance of balancing family and work for women, it is also
clear that women are less likely to cite financial gain as a reason for choosing self-
employment. Self-employment for women is far more likely to be framed in broader quality
of life terms, than in terms of narrow pecuniary advantage.
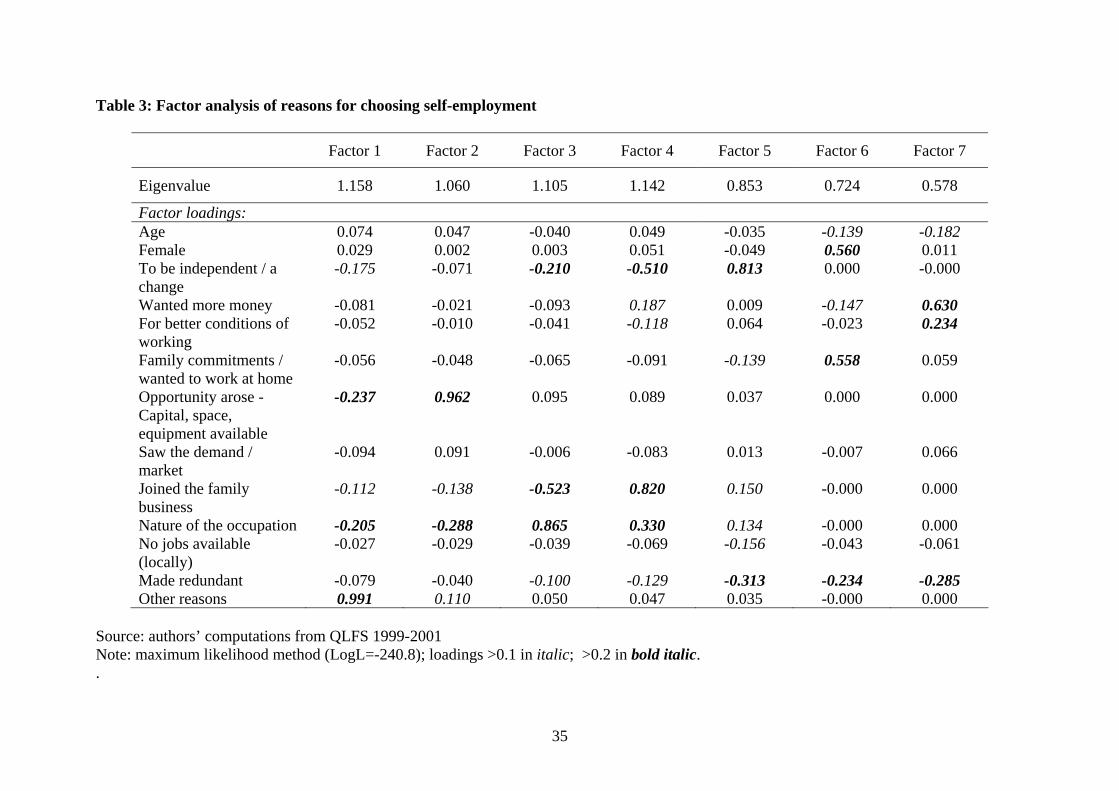
As an exercise in attempting to identify key dimensions in the pattern of reasons given
for choosing self-employment, Table 3 reports the results of a factor analysis. Since it is clear
that key demographic factors may be correlated with the pattern of responses, the factor
analysis includes gender and age as well as the different reasons for choosing self-
employment. The method of estimation is maximum likelihood and the preferred number of
factors which results is seven. Table 3 reports the eigenvalues of each factor in the first row
and factor loadings for each variable (age, female and eleven different reasons for choosing
self-employment5). Factor loadings above (absolute) thresholds of 0.1 and 0.2 are
highlighted. We suggest the following typology of different dimensions of entrepreneurship,
corresponding to the different estimated factors and their factor loadings, in the order of
eigenvalue as reported in the Table:
13

1. idiosyncratic entrepreneurship; those choosing self-employment regardless of
opportunity and fit with professional background for ‘other reasons’;
2. market-facing opportunity entrepreneurship; those choosing self-employment because
of perceived external opportunity, but contrary to prior professional background;
3. professional entrepreneurship; those choosing self-employment to join professional
partnerships and establish a professional practice;
4. family entrepreneurship; those choosing self-employment to join family businesses,
some of which may be professional in nature;
5. independence-seeking entrepreneurship; those actively attracted to self-employment
by a desire for independence, not associated with economic necessity;
6. lifestyle entrepreneurs; those, particularly women and younger people, who choose
self-employment because it offers improved ability to balance work and family
commitments, but not associated with economic necessity;
7. reward-seeking entrepreneurship; those younger people voluntarily leaving paid
employment to pursue actively financial reward and improved working conditions.
This exercise in data description points to significant heterogeneity in the motivations
behind particular individual decisions to choose self-employment. The majority of these
dimensions entail considerable elements of ‘pull’. In fact it is noticeable that ‘push’ factors
tend to be absent. Indeed neither ‘no jobs available’ nor ‘made redundant’ attract positive
loadings in any of the estimated factors. Conversely, the loadings for ‘saw the
demand/market’ are also across all estimated factors low, suggesting that it is very unusual
for someone to choose self-employment mainly because they have identified a market niche.
Rather than focused on ‘demand’, opportunity entrepreneurship appears to be driven by
‘supply’ considerations related to the availability of resources. The significant dimensions of
14
entrepreneurship appear to be related to the type of entrepreneurial activity (professional,
family business), the need for independence and/or financial reward, and, particularly in the
case of women, lifestyle considerations.
4. Methodology
The purpose of this section is to describe the empirical methodology used to model
associations between a range of background and demographic factors and particular
motivations for choosing self-employment. This is in order to understand more about which
individuals are more likely to indicate particular motivations for self-employment. The
approach adopted recognizes that the self-employed are a non-random sample of the
economically active, and therefore that any modeling of the motivations of the self-employed
must control for the non-random nature of the sample. This is undertaken using a selection
bias correction method. Uncorrected estimates of the association between a certain
background factor and one of the motivations will typically provide spurious indicators of the
statistical significance of that association.
The conventional approach to this statistical issue has been to employ a Heckman
selection correction (Heckman 1979). However identification in the Heckman model rests on
establishing the validity of covariate exclusion restrictions. In short there must be at least one
explanatory factor that influences sample selection but does not determine the outcome.
Where the economic and social processes determining sample selection are very similar to
those determining the outcome in question, such an exclusion restriction may not exist. In
practice model identification may come down to finding ex post one or more covariates
whose coefficients fail to attract statistical significance in the outcome equation and might on
15

empirical grounds be restricted to zero. In the present case it seems unlikely that such
restrictions might exist ex ante, since the underlying processes which determine whether
someone is self-employed are likely to very similar to those which determine the reason why
someone chose to be self-employed.
Sartori (2003) develops an estimator where selection and outcome equations can share
a common structure and where identification is achieved on the assumption of identical errors
in the selection and outcome equations. Equations (1) and (2) show selection and outcome
processes under the case of non-random selection for individual i from a sample 1 to n. The
dependent variable in equation (1) represents sample selection on the basis of an underlying
standardised continuous process. The dependent variable in the outcome equation (2) is also
unobserved, standardised and continuous. The explanatory variables, x, are the same in both
selection and outcome equation, with γ and β denoting the different coefficient vectors in
each. Each equation contains a normally distributed, mean zero error term, v1 and v2.
(1) iii vxU 11 ' +=γ
(2) iii vxU 22 ' += β
Instead of observing the U’s, we observe two dichotomous variables, and , shown as
the dependent variables in equations (3) and (4). The relationship between the unobserved
selection and outcome processes and the observed dichotomous variables is as follows:
iZ1 iZ 2
(3) 01,00 1111 ≥=<= iiii UifZUifZ
(4) 01,00 2222 ≥=<= iiii UifZUifZ
Under the key identifying assumption that the error terms in equations (3) and (4) are
identical, that is v1 = v2 , Sartori then proceeds to derive a maximum likelihood estimator for
the effect of the independent variables on the dependent outcome variable of interest, taking
16

into account the selection process. This can be described by defining three random variables
such that: ijY
.otherwise0and,1and1if1
;otherwise0and,0and1if1
;otherwise0and,01
212
211
10
===
===
==
iii
iii
ii
ZZY
ZZY
ZifY
(5)
iY0 has a value of 1 if the observation is not selected, has a value of 1 if the observation is
selected but the value of the outcome variable is 0, and has a value of 1 if the observation
is selected and the value of the outcome variable is 1. In order to construct a likelihood
function for the model it is necessary to specify the data generating process for the
probability that in each case. As shown by Sartori (2003) these probabilities are as
follows:
iY1
iY2
1=jiY
⎪⎩
⎪⎨⎧
≤′−′′Φ
>′−′′Φ==
⎪⎩
⎪⎨⎧ =′−′′−Φ−′−Φ
==
′−Φ==
0)( if)(
0)( if)()1Pr(
otherwise0
0)(if)()()1Pr(
)()1Pr(
2
1
0
ii
ii
i
iii
i
ii
xx
xxY
xxxY
xY
βγγ
βγβ
βγγβ
γ
(6)
Φ is the cumulative standard normal density function. The likelihood function is then
conventionally defined as the product of the different probabilities, Pji , for each combination
for each individual:
(7) ji
n
i jji PYLL lnln*
1
2
0∑∑= =
=≡
where equals 0 if and ijij PY ln 0=ijY .0≤ijP
17

The critical assumption here is that the error terms in the selection and outcome
equations are identical. It is important to assess this model restriction. The assumption of
(near) identical errors can be expected to hold when the decision processes behind selection
and the outcome of interest are very similar, and result from the same causal process (see
Sartori, 2003, p. 112). In the present case this seems reasonable, since, as already noted, the
process governing the decision to be self-employed is likely to be very similar to that behind
the motivation for that decision. Sartori also notes that the two processes should occur at the
same time and/or in the same place, and in the present case this is by definition true.
For the purposes of the selection analysis an individual is defined as self-employed
(i.e. Z1i = 1) if they reported their employment status in their main occupation as self-
employment and gave at least one response to the question concerning their motive for
choosing to become self-employed. The non-selected group are the paid-employed and are
defined as those individuals reporting their employment status in their main occupation to be
an employee.
The choice of which covariates to include as having potential association with
different motivations for choosing self-employment is to some extent constrained by the
nature of the QLFS data source. The QLFS is a deliberately designed as a large survey in
order to allow the derivation of official estimates of labour market activity on a detailed
spatial and occupational basis. However the trade-off here is that the questionnaire is kept
fairly short, and therefore limited to largely factual questioning about household structure and
housing circumstance, demographics, earnings and hours of work, educational attainment and
health status. Little or no other attitudinal or cognitive background information is available.
The previous discussion has highlighted the potentially crucial role of gender in moderating
the formation of motivation towards self-employment and this is included as a key covariate,
18

alongside other basic demographic information including age (in a non-linear quadratic form)
and marital status. Membership of an ethnic minority is also included, since the relationship
between ethnicity and entrepreneurial activity is one that has figured in previous literature.6
The potential role of household structure is captured through the inclusion of the number of
dependent children under the age of 16. Self-employed activities are higher heterogeneous
and it is therefore important to control for the role of education in order to assess the extent to
which both higher educated individuals may be motivated to choose self-employment as a
route to professional status and less educated individuals may be motivated to choose self-
employment due to a lack of other economic alternatives. Educational attainment is captured
in the model through a series of dichotomous highest level of educational attainment
variables. These are: university or college degree level; other non-degree higher education;
A-levels or equivalent (post-compulsory examinations taken at 18 as qualifying exams for
college or university entrance), GCSE or O-levels (age 16 schooling attainment
qualifications); and other qualifications. The literature on education and self-employment is
mixed; arguments can be made for both a positive and a negative relationship. Skills
associated with successful entrepreneurship may not necessarily be those skills obtained from
formal qualifications. However, those with higher levels of education may select themselves
into professional occupations where self-employment status, perhaps within the context of a
professional partnership is more common. Housing tenure status is also included, not least
because, as implied in the discussion above, owner-occupation status, either as a mortgagor
or outright-owner, may provide access to business funding collateral. This may be associated
with more positive motivations towards self-employment. A set of twelve regional dummy
variables are included to capture any broad spatial patterns in self-employment which are not
otherwise captured through variation in demographic and housing factors. Finally, as the data
19

is pooled over three years, year dummy variables are included to capture any effect on stated
motivations of changing aggregate economic or societal conditions.
5. Empirical Results
Table 4 reports estimated marginal effects from the regression of the selection
equation. Only one equation is reported since the marginal effects of the selection equation
remain identical for each different outcome, with only very minor variation in levels of
significance. Levels of statistical significance are very high for most of the covariates. Older
individuals are, other things equal, more likely to be self-employed, but the significance of
the quadratic term suggests that the likelihood of self-employment increases at a declining
rate. Women are, other things equal, four percentage points less likely to be self-employed, a
result that is well-established in the literature. The disabled are 0.6 percentage points more
likely to be self-employed, almost certainly reflecting the greater flexibility in working
conditions that self-employment may offer. Members of ethnic minorities are nine percentage
points more likely to be self-employed. The presence of dependent children raises the
probability of self-employment. The precise explanation for this association is uncertain, but
it may be related again to greater working flexibility. There is no statistically significant
association between likelihood of self-employment and marital status. However the signs on
the coefficients are plausible; negative for the married and positive for the widowed or
divorced. Educational attainment is significantly related, other things equal, to the probability
of self-employment. Those most likely to be self-employed have reached A-level
qualifications but lack university or college qualifications. This is consistent with finding
higher levels of self-employment amongst skilled individuals who have undertaken some
post-compulsory schooling, but who preferred perhaps to pursue vocational rather than
professional skills. Housing tenure status is also significantly associated with self-
20

employment. All tenure groups are more likely, other things equal, to be in self-employment
compared to those in social rental housing. Outright owners are, other things equal, over 4
percentage points more likely to be self-employed. This may reflect access to capital
resources which can be used to provide collateral for business finance. Finally the year
dummies show that the rate of self-employment falls very slightly in the later years.
Table 5 reports the estimated marginal effects for each outcome equation. Results will
be discussed for each group of covariates in turn across the different motivations for choosing
self-employment. Turning first to age, it is clear that the strongest positive association is with
‘independence’ – older individuals appear to be more likely to value independence as a
positive attribute associated with entrepreneurship, and the results suggest a positive but
decreasing association with age up to 56 years of age.. All other motivations are positively
associated with age, but at a declining rate as indicated by negative quadratic terms; however
the sizes of the associations are much smaller than for ‘independence’.
There is a negative association between being female and the likelihood of stating a
particular motivation for self-employment in all cases except for ‘family / home’. These
negative coefficients reflect lower levels of self-employment generally amongst women.
However it is clear that women are significantly more likely than men to choose self-
employment in order to balance work and home commitments. The marginal effect here is
over eight percentage points. There are some very large negative gender effects for other
motivations. Women are 29 percentage points less likely to state ‘independence’ as a
motivation. Additionally, ‘more money’ and ‘nature of the occupation’ are both
approximately 15 percentage points less likely to be chosen by women compared to men,
suggesting that female entrepreneurs are less interested in pecuniary rewards compared to
21

their male counterparts and are less likely to choose occupations more commonly associated
with self-employment.
Disability is in most cases positively associated with the different motivations for
choosing self-employment, reflecting the positive association between self-employment
status and being disabled. The strongest associations are for ‘working conditions’,
‘occupation’, ‘no jobs’ and in particular ‘other reasons’. It may be the case that the disabled
are more likely to be pushed rather than pulled towards self-employment, either because of
segregation into particular occupations or because of discrimination in the paid employment
market. To this extent it is noticeable that the more economic motivations such as ‘money’
have smaller coefficients, and that the only negative (albeit insignificant) coefficient is in the
equation for ‘opportunity arose’.
Membership of an ethnic minority is in most cases positively associated with the
different reasons for choosing self-employment. Ethnic minorities are particularly likely,
other things equal, to state ‘independence’ as a reason (marginal effect: nine percentage
points). Other significant reasons are ‘family business’ and ‘no jobs’. These findings are
consistent with the view that members of ethnic minorities may choose self-employment
because they are excluded from the formal labour market, and may prefer to build business
ventures within their own communities, where formal skills, particularly host country
language skills, are less necessary.
The presence of dependent children generally has a positive association with the
different motivations. The role of children appears to be two-fold. On the one hand it raises
the importance of financial motivations for self-employment – for example having a
22

dependent child raises the likelihood of stating ‘money’ as a motivation by 2.6 percentage
points. On the other hand having a dependent child also raises the attractiveness of self-
employment for those seeking independence (marginal effect of 4.2 percentage points per
child) and flexibility to deal with family and home circumstances (marginal effect of 3.1
percentage points per child).
The marital status controls attract a mixed set of coefficients. Both those who are
married (or cohabiting) and who were formerly married (widowed, divorced or separated) are
more likely to report ‘money’ as a motivation compared to the never married. In either case
however the motivations may be different. In the case of the formerly married, bereavement
or separation may have resulted in financial distress and the need to increase income. For the
married the motivation may be more aspirational – related to a stronger desire to ‘build’ a
home compared to those not married. Thus the results show that, other things equal, those
who are married are 2.4 percentage points more likely to cite ‘family / home’ as a motivation,
reinforcing the association already noted above with dependent children The results show
negative associations between being married and ‘independence’ (marginal effect of -3.3
percentage points) and ‘occupation’ (marginal effect of -2.5 percentage points). Being
married may be associated with a stronger desire for financial security which is in turn
associated with a greater tolerance for building a career working for an organization. Those
formerly married are less likely, other things equal, to report ‘family business’ and
‘occupation’ as motivations for self-employment. This suggests that for these people
entrepreneurship is pursued less as a long term career strategy and more for financial
necessity.
23

The results in Table 5 show a complex and varied association between educational
attainment and different motivations for choosing self-employment. The better educated, in
particular those individuals with degree-level qualifications, are more likely to report that
self-employment was chosen for such reasons as ‘independence’, ‘better working conditions’
and the ‘nature of their occupation’. In particular, the table shows significant positive
marginal effects for university graduates compared to someone with no formal qualifications
for ‘independence’ (3.2 percentage points), for ‘working conditions’ (1.5 percentage points)
and for ‘occupation’ (7.4 percentage points). Degree holders are also very significantly more
likely to cite ‘other reasons’ (6.2 percentage points). More educated individuals are also less
likely to report ‘family business’, ‘no jobs’ or ‘redundancy’ as motivations. Graduates in
particular are significantly more likely than others to report that self-employment was chosen
because of the nature of their occupation, consistent with self-employment being a normal
occupational status for sizeable numbers of university-educated professionals. It was noted in
Table 4 that those whose highest academic qualification is A-levels (post-compulsory school
examinations at age 18) are significantly more likely to be in self-employment. The pattern of
coefficients in Table 5 for this group is rather different, with a number of significant positive
associations with various motivations, especially ‘independence’ (marginal effect of 10.8
percentage points) and ‘money’ (marginal effect of 5.4 percentage point). In effect this group
comprises individuals who have failed to achieve a standard of academic achievement for
college or university entry, or have subsequently dropped out of higher education (although
in the British context this seems less likely). They may be more independently minded, well-
motivated individuals who have chosen not to pursue higher education because of particular
character traits associated with the desire to be successful as an entrepreneur outside of a
usual organizational career path.
24

Those individuals who have no formal qualifications are more likely to enter into self-
employment for reasons such as ‘no jobs available locally’, ‘joined the family business’ and
‘more money’ compared to most skill levels. These results are consistent with the unskilled
being more likely to encounter greater problems in finding work, and less likely subsequently
to command a high wage. Therefore individuals with no formal qualifications are
significantly more likely to enter into self-employment due to the both the lack of jobs
available locally and for pecuniary reasons, and therefore may ultimately find self-
employment to be a less fulfilling occupational choice. Similarly, those individuals who
report ‘family business’ as a motivation are less likely to have acquired skills and more likely
to have left education at an early stage in order to start working for that family business.
Entry into self-employment may for such individuals have presented itself as a straight-
forward family expectation. Others with educational qualifications are significantly less
likely to have entered self-employment because of a family business, with marginal
probability effects ranging from around minus two percentage points for those with age 16
school qualifications to minus nine percentage points for higher education graduates.
As noted above home-ownership and private sector renter status are significantly
positively associated with self-employment. Consistent with this finding in Table 4, Table 5
reveals a wide range of significant associations between home ownership and different
motivations for choosing self-employment. For every motivation excluding ‘no jobs available
locally’, there appears to be a strong association between home ownership (mortgaged and
outright ownership) and the self-employment motivations. The same is also true for private
sector renter status. In particular, individuals who own their houses outright are 24 percentage
points more likely to be motivated by ‘independence’ than those renting social housing, 13
percentage points more likely to cite ‘joined the family business’ and 13 percentage points
more likely to be motivated by ‘nature of the occupation’. Perhaps the key issue here is to
25
explain why those renting social housing are almost always less likely to report a particular
motivation. Social housing status is associated with a wide range of other factors associated
with poverty, such as low income, low skill and single parent status. These work additively to
contribute to lack of economic opportunity. This self-employment seems much more likely to
associated with ‘forced’ entrepreneurship. However, as the discussion above has highlighted,
this type of self-employment appears to comprise only a small proportion of the total and
does not figure as a significant dimension of entrepreneurship.
5. Discussion and Conclusions
The existing literature providing large scale survey evidence on why individuals
choose self-employment is very limited. We currently know a good deal about who chooses
self-employment, but not very much about why. This paper has analyzed data which is
available over a particular time period between 1999 and 2001 within the UK Quarterly
Labour Force Survey, a very large survey which asks a significant sample of the self-
employed to indicate up to four choices from a list of eleven possible reasons for their
decision. Clearly some of these respondents will have been self-employed for some
considerable length of time, while others may have only recently transitioned from another
economic status. To that extent responses may be subject to some unknown element of recall
bias, or ex post rationalization. Nevertheless such data is the best that is typically available.
Longitudinal analysis, focusing on those recently transitioning into self-employment might be
preferable, but such data, even where qualitative information on reasons for choice might be
available, tends to yield much smaller samples.
This paper has established that the reported motivations for choosing self-employment
are highly multi-dimensional, revealing very considerable heterogeneity within the self-
26

employed as a group. In very broad terms the different motivational dimensions can be
summarized as relating to the existence of opportunity to start of business, the nature of an
individual’s profession (if they have one), the desire for a particular lifestyle and need to
balance family commitment with working life, and finally the opportunity afforded by having
resources available to support a new business venture.
Significant differences in the pattern of response are apparent for certain groups.
Women are much more likely to report lifestyle and family reasons for choosing self-
employment than men – a conclusion that is perhaps not surprising but does imply issues of
equal opportunity. Women are less likely to report financial gain as a motivating factor. Two
other groups for whom lifestyle issues figure more importantly are older individuals and
members of ethnic minorities. However for the latter group, care must be taken in the
interpretation of this finding, since we cannot rule out the possibility that it may be culturally
more acceptable to provide a justification other than one which is financial for certain groups.
What we have termed opportunity entrepreneurship appears from the results to be
associated with educational attainment. More educated individuals appear to be more likely
to view self-employment in positive terms, offering independence and financial reward, as
well as better working conditions. The least educated individuals, that is those lacking any
formal academic qualifications, are the most likely to indicate that their choice of self-
employment arose from a lack of alternative employment opportunity. They are also most
likely to indicate that the reason for choosing self-employment was in order to join a family
business. This is a rather worrying finding, since it may indicate that for some individuals the
incentive to acquire qualifications and skills is severely reduced, because they feel that there
is an existing family business waiting for them. Such businesses may therefore perform
27

poorly because of a lack of appreciation of the value of education and skills. This finding
accords with other recent research on the relationship between management practice and firm
performance (Van Reenen and Bloom, 2007). This research concludes that family-run
businesses are significantly less likely to employ good management practices.
The present study has found little direct evidence for ‘forced’ entrepreneurship; that is
significant numbers of individuals who appear to have chosen self-employment out of
necessity because of loss of previous paid employment and a lack of other paid alternatives.
The vast majority choose self-employment for positive reasons. However it should be noted
that the time period covered by the data analyzed extends across the middle of a period of
sustained economic growth in the UK economy. Whether this conclusion would be as robust
during the current period of severe economic downturn and rapidly rising unemployment is
open to debate and, with suitable data, further future analysis. Indeed it would give cause for
considerable concern if the proportion choosing self-employment because it represents the
only alternative to economic inactivity was to rise significantly in the next few years. Such
‘forced’ choices may not lay solid foundations for well-resourced, successful new business
ventures.
For public policy, the finding of significant heterogeneity amongst reasons for
choosing self-employment suggests that policies to encourage successful entrepreneurship
need to be tailored carefully to different groups, particularly demographic groups. For
example so called ‘family-friendly’ policies may increase entrepreneurship amongst women.
One feature of the results presented here is the rather limited number of individuals who
report the perception of a market opportunity as a significant reason for choosing self-
employment. Given the significant numbers who report financial reward as a motivation,
28

observers may be left pondering how many of these individuals actually achieve the
significant improvement in earnings that they appear to desire. This in turn points to the need
for policy interventions designed to promote more careful business planning amongst
aspiring entrepreneurs. By contrast what might be termed supply-side factors appear to play a
relatively larger role – ‘opportunity’ entrepreneurs frame opportunity in terms of possessing
sufficient resources to take advantage of a potential opportunity, rather than in terms of
available market. Finally a small proportion of the self-employed chose this state because
they joined a family business. Such individuals do not appear to be particularly well educated
and may fail to appreciate the contribution that academic qualifications and other skills may
make to business performance. Policy intervention needs to be designed carefully to target
such individuals.
29

Footnotes:
1 Within the UK, self-employed individuals account for approximately 12.5% of the work-
force. Blanchflower (2000) provides recent comparative data for OECD economies.
2 Previous literature has looked at the gender differences between motivations to become
self-employed, and identified the importance of work-family balance issues for women. See
Buttner and Moore (1997) and Hughes (2006) for an overview of the evidence.
3 The choice of time period 1999 to 2001 is constrained by the availability of the question on
motivation for becoming self-employed. This question has been asked only periodically in
the QLFS and was dropped after 2001.
4 Each member of the QLFS sample is interviewed for five consecutive quarters in order to
provide a rotating longitudinal element to the survey. This means that the spring quarter files
for 2000 and for 2001 included two observations on those who were self-employed in each
year, and therefore a duplicate (although potentially inconsistent) response to the question on
reasons for becoming self-employed. To avoid duplicate observations in our analysis, those
individuals in the spring quarter 2000 sample who were also included in the spring quarter
1999 sample, and those in the spring quarter 2001 sample who were also included in the
spring quarter 2000 sample, were deleted from the analysis. In principle one could have
deleted the first rather than the second duplicate observation. Both methods were
investigated, and it was found that the results of the secondary analysis in each case were
almost identical.
5 “No reason given” is not included in the factor analysis.
6 Parker (2004), Chapter 4 provides a comprehensive and succinct summary of arguments and
evidence concerning this relationship. See Clark and Drinkwater (2000) for recent British
evidence.
30

References
Ashcroft, B.K. and Love, J.H. (1996), Firm births and employment change in British counties, Papers in Regional Science, 75(4): 1-18.
Audretsch, D.B. (2007), Entrepreneurship capital and economic growth, Oxford Review of Economic Policy, 23(1): 63–78.
Black, J., de Meza, D. and Jeffreys, D. (1996), House prices, the supply of collateral and the enterprise economy, Economic Journal, 106(434): 60-75.
Blanchflower, D.G. (2000), Self-employment in OECD countries, Labour Economics, 7(5): 471-505.
Blanchflower, D.G. and Meyer, B.D. (1994), A longitudinal analysis of the young self-employed in Australia and the United States, Small Business Economics, 6(1): 1-19.
Blanchflower, D.G., Oswald, A., and Stutzer, A. (2001), Latent entrepreneurship across nations. European Economic Review, 45: 680-691.
Buttner, E.H. and. Moore, D.P (1997), Women’s organizational exodus to entrepreneurship: self-reported motivations and correlates with success, Journal of Small Business Management, 35(1): 34-46.
Carter, N.M., Gartner, W.B., Shaver, K.G. and Gatewood, E.J. (2003), The career reasons of nascent entrepreneurs, Journal of Business Venturing, 18(1): 13-39.
Clark, K. and Drinkwater, S. (2000), Pushed out or pulled in? Self-employment amongt Britain’s ethnic minorities, Labour Economics, 7: 603-628.
Cowling, M. and Mitchell, P. (1997), The evolution of UK self-employment: a study of government policy and the role of the macroeconomy, The Manchester School, 65(4): 427-442.
Dennis, J. (1996), Self-employment: When nothing else is available?, Journal of Labour Research, 17(4): 645-661.
Earle, J.S. and Sakova, Z. (2000), Business start-ups or disguised unemployment? Evidence on the character of self-employment from transition economies, Labour Economics, 7(5): 575-601.
Evans D.S. and Leighton, L.S. (1989), Some empirical aspects of entrepreneurship, American Economic Review, 79(3): 519-535.
Frey, B. and Benz, M. (2003), Being independent is a great thing: subjective evaluations of self-employment and hierarchy, CESifo Working Paper No. 959, Munich.
Georgellis, Y., Sessions, J.G. and Tsitsianis, N. (2005), Windfalls, wealth and the transition to self-employment, Small Business Economics, 13(2):407-428.
Gill, A.M. (1988), Choice of employment status and the wages of employees and the self-employed: some further evidence, Journal of Applied Econometrics, 3(3): 229-234.
31
Hamilton, R.T. (1989), Unemployment and business formation rates: reconciling time series and cross-section evidence, Environment and Planning, 21(2): 249-255.
Heckman, J. (1979), Sample selection bias as a specification error, Econometrica, 47(1): 153-161.
Henley, A. (2004), Self-employment status: the role of state dependence and initial conditions, Small Business Economics 22(1): 67-82.
Hughes, K (2003), Pushed or pulled? Women’s entry into self-employment and small business ownership, Gender, Work and Organization, 10(4): 433-454.
Hughes, K (2006), Exploring motivation and success among Canadian women entrepreneurs, Journal of Small Business and Entrepreneurship, 19(2): 107-120.
Krueger, N.F., Reilly, M.D., and Carsrud, A.L. (2000), Competing models of entrepreneurial intentions. Journal of Business Venturing 15: 411-432.
Le, A.T (1999), Empirical studies of self-employment, Journal of Economic Surveys, 13(4): 381-416.
Parker, S.C. (2004), The Economics of Self-Employment and Entrepreneurship, Cambridge (UK): Cambridge University Press.
Parker, S.C. and Johnson, P. (1996), Spatial variations in the determinants and effects of firm births and deaths, Regional Studies, 30(7): 679-688.
Rees, H. and Shah, A. (1986), An empirical analysis of self- employment in the UK, Journal of Applied Econometrics, 1(1): 95-108.
Robson, M.T. (1998), The rise in self-employment amongst UK males, Small Business Economics, 10(3); 199-212.
Sartori, A (2003), An estimator for some binary-outcome selection models without exclusion restrictions, Political Analysis, 11(2): 111-138.
Smeaton, D (2003), Self-employed workers: calling the shots or hesitant independents? A consideration of the trends, Work, Employment & Society, 17(2): 379-391.
Storey, D.J. (1982), Entrepreneurship and the New Firm, Westport CT: Praeger Publishers.
Taylor, M (1996), Earnings, independence or unemployment: why become self-employed? Oxford Bulletin of Economics and Statistics, 58(2): 253-66.
Van Reenen, J. and Bloom, N. (2007), Measuring and explaining management practices across firms and countries, Quarterly Journal of Economics, 122 (4): 1351-1408.
32

Table 1: Reported reasons for becoming self-employed - by individual
Reason (percentage) All Men Women
t-test
(p-value)
To be independent / a change 30.2 32.3 24.9 0.000
Wanted more money 12.7 14.5 8.0 0.000
For better conditions of working 5.4 6.0 4.0 0.000
Family commitments / wanted to work at home 7.7 2.2 21.5 0.000
Opportunity arose - Capital, space, equipment available 12.5 12.7 12.1 0.291
Saw the demand / market 8.8 8.8 8.6 0.722
Joined the family business 6.9 6.6 7.6 0.025
Nature of the occupation 21.5 21.1 22.5 0.030
No jobs available (locally) 3.4 3.7 2.4 0.000
Made redundant 9.3 11.6 3.6 0.000
Other reasons 14.6 13.8 16.6 0.000
No reason given 3.4 3.7 2.5 0.000
N 17507 12582 4925
Source: authors’ tabulations from LFS Spring Quarters 1999-2001 Notes: Columns do not sum to 100 per cent because respondents can give up to four reasons. The right hand side reports the significance of a t-test for the difference between men and women. Bold italic indicates p-value < 0.05
33

34
Table 2: Reported reasons for becoming self-employed – all responses
Reason (percentage) All Men Women
t-test
(p-value)
To be independent / a change 22.2 23.6 18.5 0.000
Wanted more money 9.33 10.6 6.0 0.000
For better conditions of working 4.0 4.4 3.0 0.000
Family commitments / wanted to work at home 5.6 1.6 16.0 0.000
Opportunity arose - Capital, space, equipment available 9.2 9.3 9.0 0.520
Saw the demand / market 6.4 6.4 6.4 0.978
Joined the family business 5.0 4.8 5.6 0.012
Nature of the occupation 15.8 15.4 16.8 0.009
No jobs available (locally) 2.5 2.7 1.8 0.000
Made redundant 6.8 8.4 2.7 0.000
Other reasons 10.7 10.1 12.3 0.000
No reason given 2.5 2.7 1.9 0.000
N 23851 17227 6624
Source: authors’ tabulations from LFS Spring Quarters 1999-2001 Notes: The right hand side reports the significance of a t-test for the difference between men and women. Bold italic indicates p-value < 0.05.
Factor 1 Factor 2 Factor 3 Factor 4 Factor 5 Factor 6 Factor 7
Eigenvalue 1.158 1.060 1.105 1.142 0.853 0.724 0.578
Factor loadings: Age 0.074 0.047 -0.040 0.049 -0.035 -0.139 -0.182Female
0.029 0.002 0.003 0.051 -0.049 0.560 0.011 To be independent / a change
-0.175 -0.071 -0.210 -0.510 0.813 0.000 -0.000
Wanted more money -0.081 -0.021 -0.093 0.187 0.009 -0.147 0.630 For better conditions of working
-0.052 -0.010 -0.041 -0.118 0.064 -0.023 0.234
Family commitments / wanted to work at home
-0.056 -0.048 -0.065 -0.091 -0.139 0.558 0.059
Opportunity arose - Capital, space, equipment available
-0.237 0.962 0.095 0.089 0.037 0.000 0.000
Saw the demand / market
-0.094 0.091 -0.006 -0.083 0.013 -0.007 0.066
Joined the family business
-0.112 -0.138 -0.523 0.820 0.150 -0.000 0.000
Nature of the occupation -0.205 -0.288 0.865 0.330 0.134 -0.000 0.000No jobs available (locally)
-0.027 -0.029 -0.039 -0.069 -0.156 -0.043 -0.061
Made redundant -0.079 -0.040 -0.100 -0.129 -0.313 -0.234 -0.285Other reasons 0.991 0.110 0.050 0.047 0.035 -0.000 0.000
35
Table 3: Factor analysis of reasons for choosing self-employment
Source: authors’ computations from QLFS 1999-2001 Note: maximum likelihood method (LogL=-240.8); loadings >0.1 in italic; >0.2 in bold italic. .

36
Table 4: Sartori estimates of self-employment selection equation
Marginal Effect
p-value
Demographic factors: Age .0041 .000 Age squared/100 -.0024 .000 Female -.0407 .000 Disabled .0058 .000 Ethnic minority .0088 .000 Household and family status: No. dependent Children<16 .0116 .000 Marital Status (reference: never married Married -.0017 .212 Widowed/divorced/separated .0007 .670 Highest educational attainment (reference: no qualifications):
Degree -.0016 .317 Other higher education -.0146 .000 A-levels .0091 .000 O-levels/GCSEs -.0103 .000 Other-qualifications -.0136 .000 Housing tenure (reference: social renter): Outright owner .0437 .000 Owner with mortgage .0237 .000 Private sector renter .0333 .000 Year effects (reference: 1999) 2000 -.0005 .626 2001 -.0019 .067 Log Likelihood (combined model) -58301.519 chi² (28) (p-value) 7661.3 N 147,668
(of which 16,860 self-employed)
Source: authors’ computations from QLFS 1999-2001 Notes: reported equation is from the model for “to be independent / a change”. Selection equations for other motivations have identical marginal effects, with only minor differences in levels of coefficient statistical significance. Model also includes 12 regional controls – coefficients not reported. Full results available on request. Italic indicates p-value < 0.10, bold italic indicates p-value < 0.05.

Table 5: Sartori estimates of motivation for choosing self-employment equations
(1)Independence
(2) Money
(3) Working conditions
(4) Family/home
(5) Opportunity
MarginalEffect
p-value
Marginal Effect
p-value
Marginal Effect
p-value
Marginal Effect
p-value
Marginal Effect
p-value
Demographic factors: Age .0418 .000 .0061 .000 .0044 .000 .0063 .000 .0139 .000 Age squared/100 -.0373 .000 -.0060 .001 -.0043 .001 -.0051 .000 -.0104 .000 Female -.2853 .000 -.1557 .000 -.0582 .000 .0824 .000 -.0896 .000 Disabled .0066 .601 .0094 .240 .0152 .003 .0090 .034 -.0076 .353 Ethnic minority .0933 .000 -.0038 .758 .0132 .091 .0033 .626 .0017 .897Household and family status: No. dependent Children<16 .0421 .000 .0261 .000 .0068 .000 .0311 .000 .0106 .001 Marital Status (reference: never married Married -.0330 .014 .0206 .014 .0036 .523 .0241 .000 -.0001 .992 Widowed/divorced/separated .0170 .311 .0488 .000 .0106 .138 .0341 .000 -.0081 .473Highest educational attainment (reference: no qualifications):
Degree .0321 .039 -.0231 .023 .0152 .025 -.0038 .502 -.0138 .148 Other higher education -.0122 .504 -.0330 .006 .0050 .529 -.0060 .329 -.0397 .001 A-levels .1077 .000 .0541 .000 .0254 .000 .0139 .009 .0091 .290 O-levels/GCSEs -.0279 .084 -.0276 .006 -.0045 .528 -.0044 .382 -.0282 .004 Other-qualifications -.0514 .003 -.0388 .000 -.0008 .919 -.0081 .165 -.0254 .014 Housing tenure (reference: social renter) Outright owner .2392 .000 .0751 .000 .0371 .000 .0539 .000 .1107 .000 Owner with mortgage .1754 .000 .0709 .000 .0415 .000 .0384 .000 .0848 .000 Private sector renter .2339 .000 .0726 .000 .0453 .000 .0472 .000 .0655 .000 Year effects (reference: 1999) 2000 -.0029 .774 -.0043 .497 -.0040 .342 -.0039 .253 .0026 .688 2001 -.0342 .001 -.0028 .661 -.0050 .247 -.0093 .009 -.0058 .380 Log Likelihood (combined model) -58301.519 -54342.503 -51654.381 -51674.104 -54430.764chi² (29) (p-value) 0.000 0.000 0.000 0.000 0.000N 5129 2177 932 1311 2115
37

Table 5 (continued)
(6)Saw the demand
(7) Family business
(8) Occupation
(9) No jobs
(10) Redundancy
MarginalEffect
p-value
Marginal Effect
p-value
Marginal Effect
p-value
Marginal Effect
p-value
Marginal Effect
p-value
Demographic factors: Age .00878 .000 .0021 .014 .0115 .000 .0039 .000 .0113 .000 Age squared/100 -.0070 .000 -.0004 .630 -.0061 .009 -.0031 .000 -.0087 .000 Female -.0627 .000 -.0279 .000 -.1544 .000 -.0314 .000 -.0883 .000 Disabled .0013 .856 -.0019 .682 .0256 .022 .0174 .000 .0042 .271 Ethnic minority .0217 .038 .0363 .000 -.0176 .322 .0258 .000 -.0247 .002 Household and family status: No. dependent Children<16 .0103 .000 .0171 .000 .0522 .000 .0059 .000 .0026 .113 Marital Status (reference: never married Married .0054 .473 .0003 .951 -.0245 .037 -.0127 .001 .0063 .191 Widowed/divorced/separated -.0033 .738 -.0272 .001 -.0268 .081 -.0067 .147 .0065 .262Highest educational attainment (reference: no qualifications):
Degree -.0022 .801 -.0871 .000 .0742 .000 -.0069 .095 -.0041 .398 Other higher education -.0008 .932 -.0445 .000 -.0592 .000 -.0123 .020 -.0009 .872 A-levels .0226 .003 -.0269 .000 -.0023 .856 -.0011 .772 .0191 .000 O-levels/GCSEs -.0147 .096 -.0165 .001 -.0574 .000 -.0082 .061 -.0021 .675 Other-qualifications -.0052 .563 -.0249 .000 -.0364 .013 -.0063 .149 -.0132 .015 Housing tenure (reference: social renter): Outright owner .0799 .000 .1320 .000 .1321 .000 -.0089 .053 .0302 .000 Owner with mortgage .0614 .000 .0736 .000 .0416 .003 -.0136 .000 .0248 .000 Private sector renter .0761 .000 .0743 .000 .1311 .000 -.0078 .114 .0023 .791Year effects (reference: 1999) 2000 .0061 .275 -.0042 .267 -.0029 .746 -.0188 .000 -.0082 .010 2001 .0019 .739 -.0060 .117 .0035 .702 -.0152 .000 -.0149 .000 Log Likelihood (combined model) -53105.7 -51918.914 -56707.727 -50504.177 -52983.946chi² (28) (p-value) 0.000 0.000 0.000 0.000 0.000N 1477 1141 3623 575 1589
38

Table 5 (continued)
(11)Other reason
Source: authors’ computations from QLFS 1999-2001 MarginalEffect
Notes: Models also include 12 regional controls – coefficients not reported. Full results available on request. Italic indicates p-value < 0.10, bold italic indicates p-value < 0.05.
p-value
Demographic factors: Age .0049 .001 Age squared/100 .0020 .203 Female -.0704 .000 Disabled .0441 .000 Ethnic minority .0202 .134Household and family status: No. dependent Children<16 .0208 .000 Marital Status (reference: never married Married -.0034 .721 Widowed/divorced/separated .0071 .540Highest educational attainment (reference: no qualifications):
Degree .0619 .000 Other higher education -.0062 .619 A-levels .0362 .000 O-levels/GCSEs -.0064 .558 Other-qualifications -.0080 .478 Housing tenure (reference: social sector renter):
Outright owner .0650 .000 Owner with mortgage .0141 .207 Private sector renter .0646 .000 Year effects (reference: 1999) 2000 -.0104 .135 2001 -.0239 .001 Log Likelihood (combined model) -54859.0 chi² (28) (p-value) 0.000 N 2405
39