Embed Size (px)
Citation preview
Economics Working Paper Series
2013/004
Why Do Indian Firms Go Abroad?
V. N Balasubramanyam and Nicolas Forsans
The Department of Economics Lancaster University Management School
Lancaster LA1 4YX UK
© Authors All rights reserved. Short sections of text, not to exceed
two paragraphs, may be quoted without explicit permission, provided that full acknowledgement is given.
LUMS home page: http://www.lums.lancs.ac.uk/
Wednesday, 15 May 2013
Why Do Indian Firms Go Abroad?
V. N Balasubramanyam1
Lancaster University Management School
Nicolas Forsans
Leeds University Business School
1 Corresponding author [email protected]
Abstract
Overseas investments by the emerging economies are a feature of globalisation. Investments
by Indian firms, though not large in volume, differ from that of other emerging economies
such as China in their composition, destination and modality of investments. A relatively
high proportion of their investments are in the manufacturing and services sectors of the
developed economies such as the UK and the USA. A number of statistical studies have
attempted to identify the factors motivating Indian firms to invest abroad. Most of these
studies attempt to ground the analysis in the received theory of foreign direct investment
centred on the ownership advantages, location and internalisation (OLI) paradigm. This paper
argues that statistical tests cannot fully account for the unique nature of India’s investments
abroad. The pattern of investments that differs from that of the other emerging economies is
to be attributed to India’s endowments of entrepreneurial skills centring on exploration of
investment opportunities and astute management of complex organisations. These
endowments are an inheritance from history augmented by the contribution of India’s
diaspora abroad. The lukewarm investment climate at home may also be a factor in the
decision of Indian firms in technology and skill intensive firms to venture abroad.
Explanations for the unique nature of overseas direct investments by Indian firms have to be
sought in the organisational structure and history of Indian business houses.
2
I Introduction
Foreign Direct Investment (FDI) these days doesn’t arouse the sort of impassioned
controversies and debates familiar to development economists during the decades of the
sixties and the seventies of the last century. Rules and regulations governing inflows of FDI
have been considerably relaxed by most developing countries that were lukewarm if not
hostile to foreign investment in the recent past. Indeed, in recent years, the gamekeepers
have turned poachers. India and China, two countries that were almost closed to FDI, have
not only liberalised their FDI regimes, but also emerged as investors abroad. The stock of
China’s outward FDI increased from $27 billion in the year 2000 to $365 billion by the end
of the year 2011 (UNCTAD, 2012). Comparable figures for India are $1.7 billion and $111
billion. India’s FDI abroad, although much lower than that of China has increased
substantially since the late 1990s, and differs significantly from that of China in its
destination, composition and mode of entry into foreign markets.
China has financed its investments abroad from its huge reserves of foreign exchange
generated by its exports. Indian firms have raised considerable volumes of funds in
international capital markets for financing their overseas investments. According to the
Statistical Bulletin of China’s Outward Direct Investment (Ministry of Commerce, 2008)
China’s overseas investments, more than 90% of the total, are in developing countries in
search of raw materials and oil to fuel the growing Chinese economy/ India’s investments, for
the most part are in developed countries, such as the UK, in skill-intensive manufactures and
services. India’s investments abroad add a new dimension to the observed flows of
technology and know-how across frontiers with interplay between trade, labour flows and
FDI.
Several papers have assessed the factors contributing to the growth in overseas direct
investment (ODI here in after) from India and China in recent years. Most of the
painstakingly designed econometric tests generally endorse the traditional theories of FDI as
adequate for explaining the growth of ODI from the two countries. These exercises though
are constrained by the absence of adequate data, problems associated with quantifying some
of the characteristics specific to the emerging economies, and unexpected statistical results
that defy explanation in the context of the received theories. This paper attempts to provide a
3
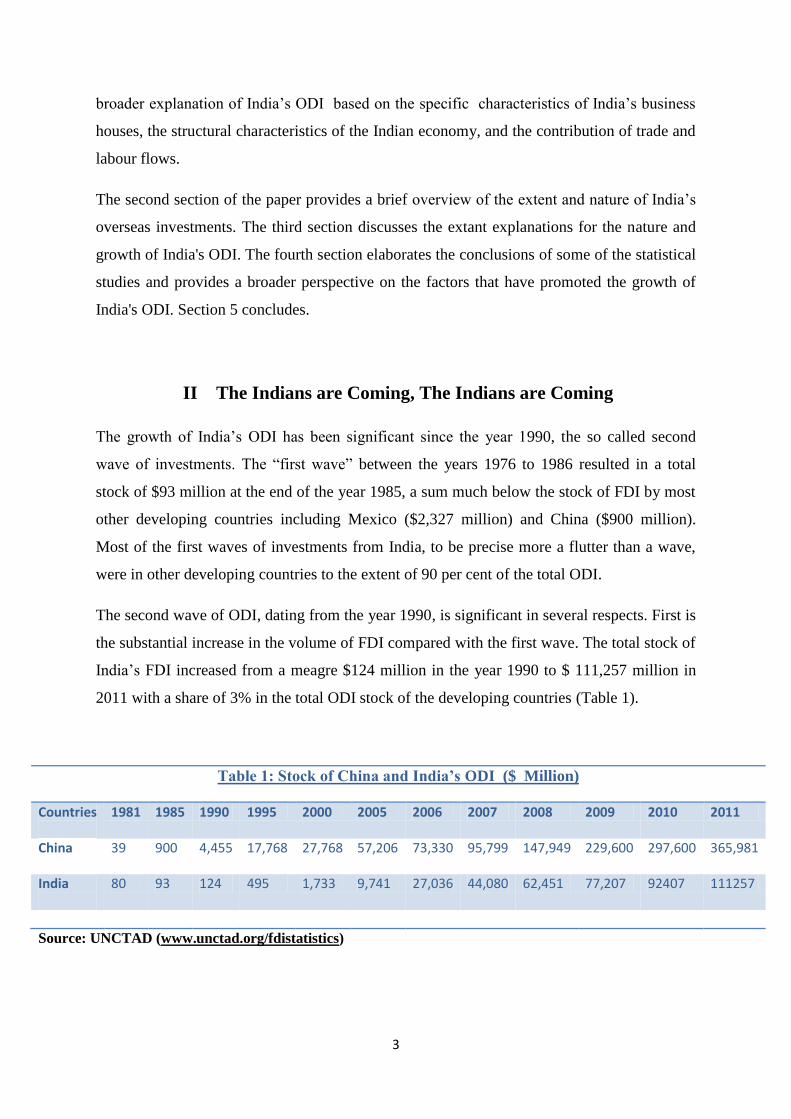
Table 1: Stock of China and India’s ODI ($ Million)
Countries
1981 1985 1990 1995 2000 2005 2006 2007 2008 2009 2010 2011
China
39 900 4,455 17,768 27,768 57,206 73,330 95,799 147,949 229,600 297,600 365,981
India
80 93 124 495 1,733 9,741 27,036 44,080 62,451 77,207 92407 111257
Source: UNCTAD (www.unctad.org/fdistatistics)
broader explanation of India’s ODI based on the specific characteristics of India’s business
houses, the structural characteristics of the Indian economy, and the contribution of trade and
labour flows.
The second section of the paper provides a brief overview of the extent and nature of India’s
overseas investments. The third section discusses the extant explanations for the nature and
growth of India's ODI. The fourth section elaborates the conclusions of some of the statistical
studies and provides a broader perspective on the factors that have promoted the growth of
India's ODI. Section 5 concludes.
II The Indians are Coming, The Indians are Coming
The growth of India’s ODI has been significant since the year 1990, the so called second
wave of investments. The “first wave” between the years 1976 to 1986 resulted in a total
stock of $93 million at the end of the year 1985, a sum much below the stock of FDI by most
other developing countries including Mexico ($2,327 million) and China ($900 million).
Most of the first waves of investments from India, to be precise more a flutter than a wave,
were in other developing countries to the extent of 90 per cent of the total ODI.
The second wave of ODI, dating from the year 1990, is significant in several respects. First is
the substantial increase in the volume of FDI compared with the first wave. The total stock of
India’s FDI increased from a meagre $124 million in the year 1990 to $ 111,257 million in
2011 with a share of 3% in the total ODI stock of the developing countries (Table 1).
4
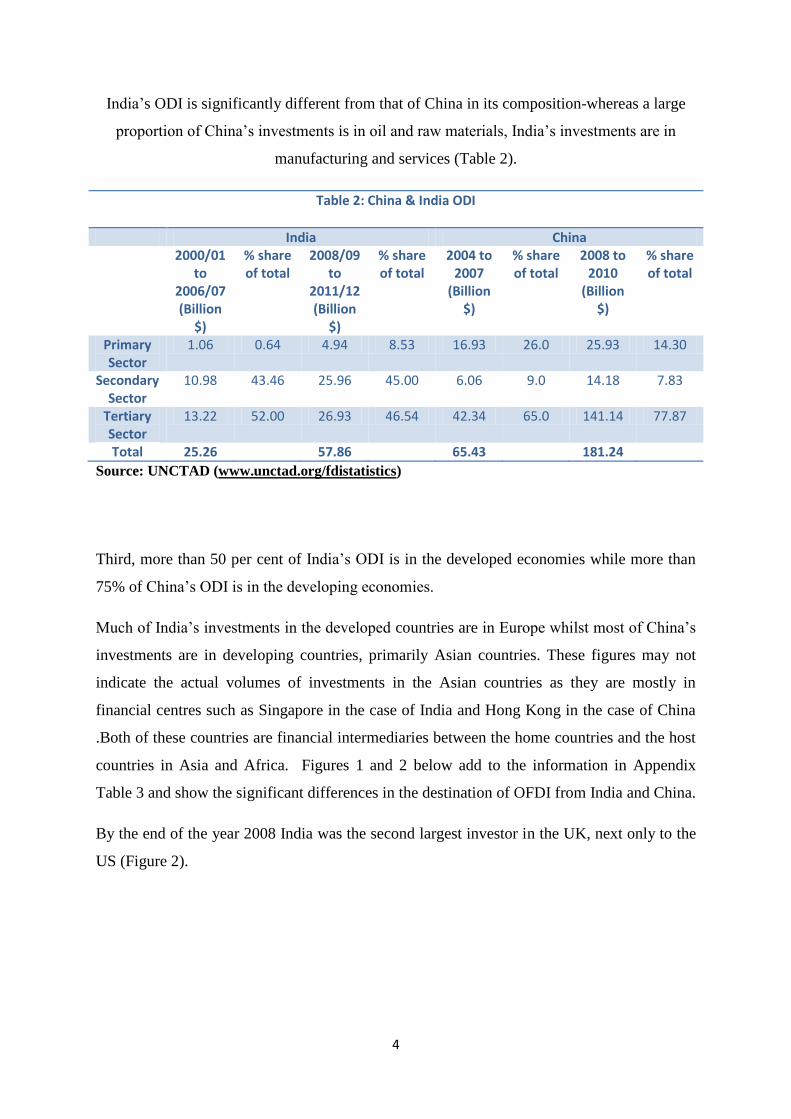
India’s ODI is significantly different from that of China in its composition-whereas a large
proportion of China’s investments is in oil and raw materials, India’s investments are in
manufacturing and services (Table 2).
Table 2: China & India ODI
India China 2000/01
to 2006/07 (Billion
$)
% share of total
2008/09 to
2011/12 (Billion
$)
% share of total
2004 to 2007
(Billion $)
% share of total
2008 to 2010
(Billion $)
% share of total
Primary Sector
1.06 0.64 4.94 8.53 16.93 26.0 25.93 14.30
Secondary Sector
10.98 43.46 25.96 45.00 6.06 9.0 14.18 7.83
Tertiary Sector
13.22 52.00 26.93 46.54 42.34 65.0 141.14 77.87
Total 25.26 57.86 65.43 181.24
Source: UNCTAD (www.unctad.org/fdistatistics)
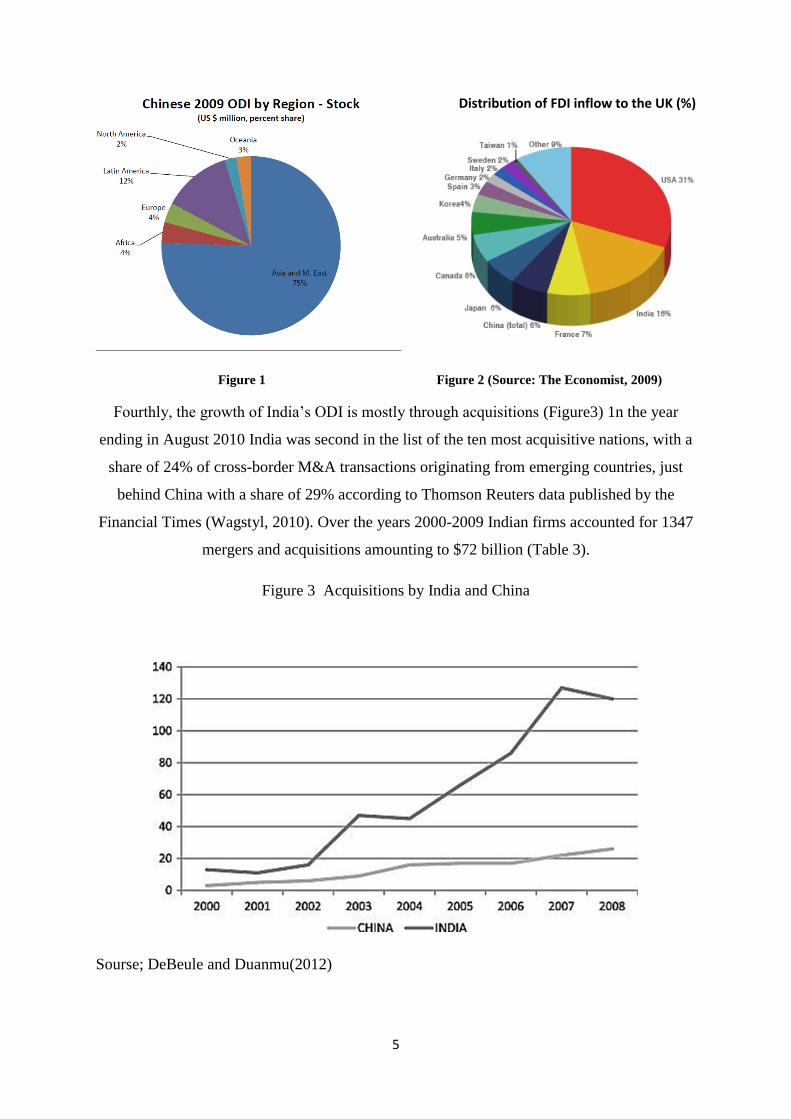
Third, more than 50 per cent of India’s ODI is in the developed economies while more than
75% of China’s ODI is in the developing economies.
Much of India’s investments in the developed countries are in Europe whilst most of China’s
investments are in developing countries, primarily Asian countries. These figures may not
indicate the actual volumes of investments in the Asian countries as they are mostly in
financial centres such as Singapore in the case of India and Hong Kong in the case of China
.Both of these countries are financial intermediaries between the home countries and the host
countries in Asia and Africa. Figures 1 and 2 below add to the information in Appendix
Table 3 and show the significant differences in the destination of OFDI from India and China.
By the end of the year 2008 India was the second largest investor in the UK, next only to the
US (Figure 2).
5
Distribution of FDI inflow to the UK (%)
Figure 1 Figure 2 (Source: The Economist, 2009)
Fourthly, the growth of India’s ODI is mostly through acquisitions (Figure3) 1n the year
ending in August 2010 India was second in the list of the ten most acquisitive nations, with a
share of 24% of cross-border M&A transactions originating from emerging countries, just
behind China with a share of 29% according to Thomson Reuters data published by the
Financial Times (Wagstyl, 2010). Over the years 2000-2009 Indian firms accounted for 1347
mergers and acquisitions amounting to $72 billion (Table 3).
Figure 3 Acquisitions by India and China
Sourse; DeBeule and Duanmu(2012)
6
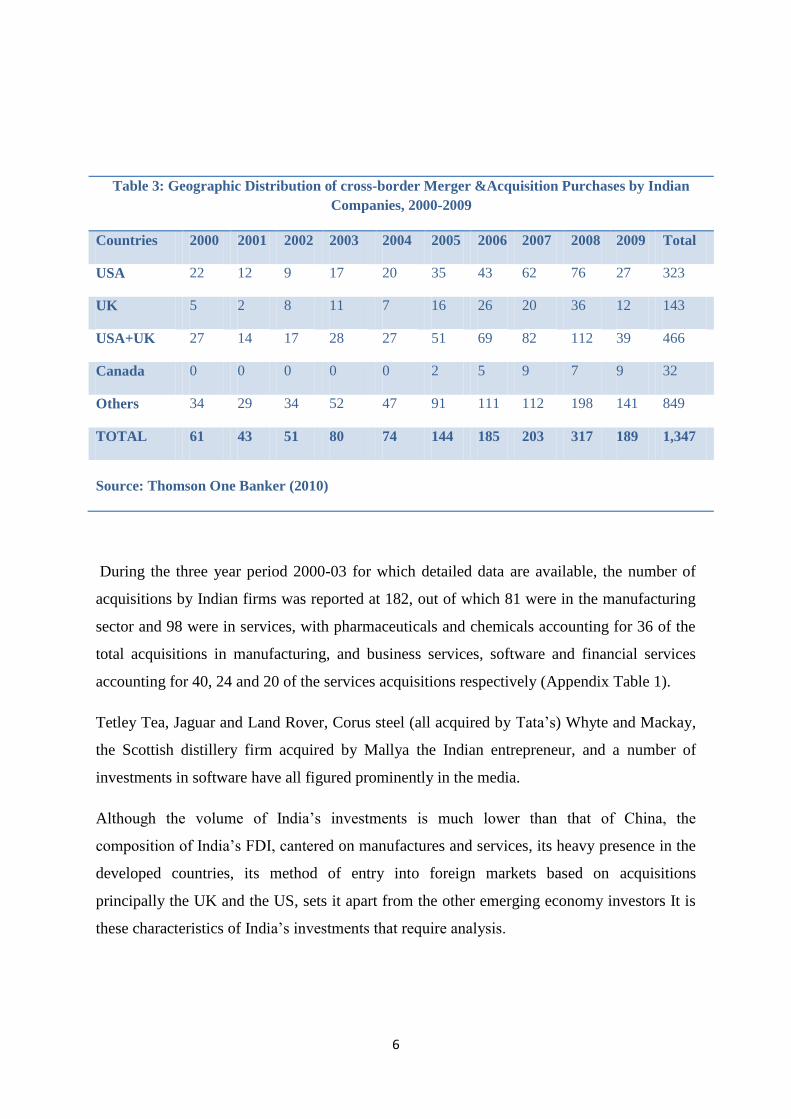
Table 3: Geographic Distribution of cross-border Merger &Acquisition Purchases by Indian
Companies, 2000-2009
Countries 2000 2001 2002 2003 2004 2005 2006 2007 2008 2009 Total
USA 22 12 9 17 20 35 43 62 76 27 323
UK 5 2 8 11 7 16 26 20 36 12 143
USA+UK 27 14 17 28 27 51 69 82 112 39 466
Canada 0 0 0 0 0 2 5 9 7 9 32
Others 34 29 34 52 47 91 111 112 198 141 849
TOTAL 61 43 51 80 74 144 185 203 317 189 1,347
Source: Thomson One Banker (2010)
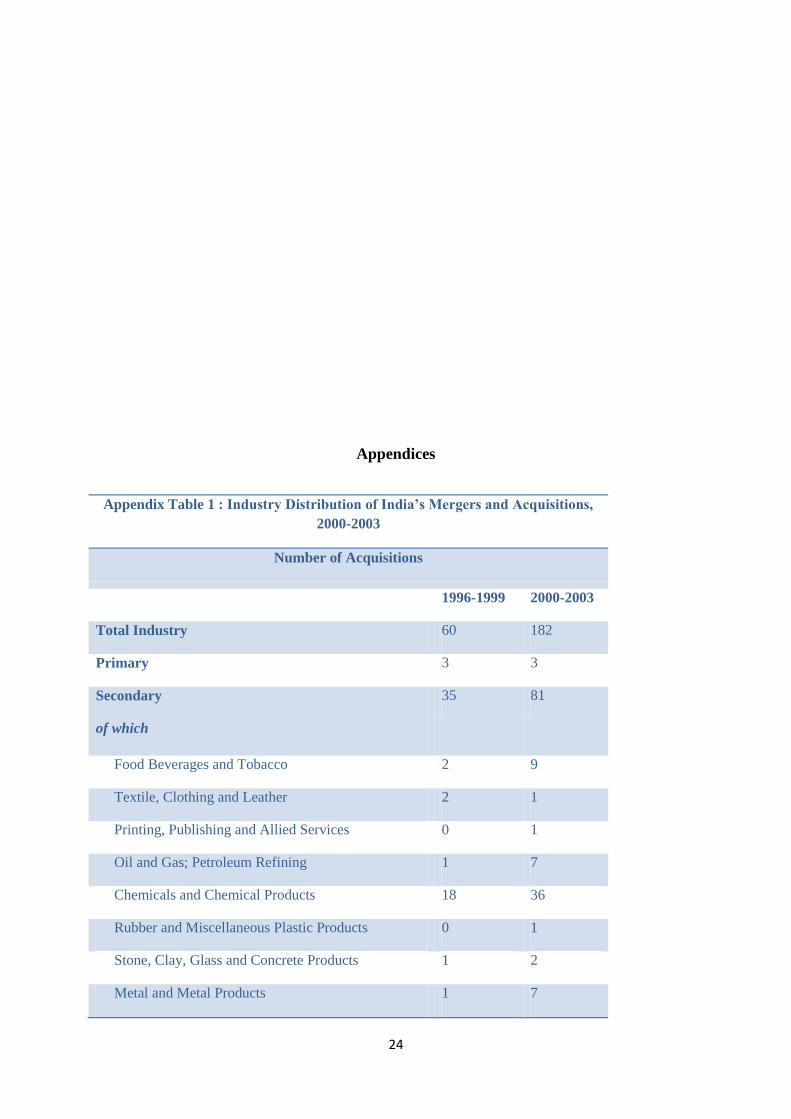
During the three year period 2000-03 for which detailed data are available, the number of
acquisitions by Indian firms was reported at 182, out of which 81 were in the manufacturing
sector and 98 were in services, with pharmaceuticals and chemicals accounting for 36 of the
total acquisitions in manufacturing, and business services, software and financial services
accounting for 40, 24 and 20 of the services acquisitions respectively (Appendix Table 1).
Tetley Tea, Jaguar and Land Rover, Corus steel (all acquired by Tata’s) Whyte and Mackay,
the Scottish distillery firm acquired by Mallya the Indian entrepreneur, and a number of
investments in software have all figured prominently in the media.
Although the volume of India’s investments is much lower than that of China, the
composition of India’s FDI, cantered on manufactures and services, its heavy presence in the
developed countries, its method of entry into foreign markets based on acquisitions
principally the UK and the US, sets it apart from the other emerging economy investors It is
these characteristics of India’s investments that require analysis.
7
III Traditional Explanations
Firms invest abroad to exploit their monopoly over advantages(O) especially so when
market imperfections of various sorts and institutional factors deny them the options of
exporting the products or licensing the advantages they possess to foreign entities. This
insight of Stephen Hymer (1976) has been discussed and elaborated to include choice of
locations for investments abroad and ways and means of guarding ones monopolistic
advantages from predators. The choice of locations abroad for investment would be dictated
by a number of factors including the availability of efficient labour, infrastructure facilities,
and stability of institutions and policies of host governments. All of these and other host
country attributes favourable to investing firms are clubbed together as location advantage
(L). Firms guard the advantages they own in production and distribution by internalizing all
aspects of production and distribution, that is they extend their ownership and control over
operations to sources of raw materials and distribution outlets (I). These three aspects of FDI
are clubbed together and referred to as the OLI paradigm or the eclectic theory of FDI
(Dunning, 1993).
The paradigm or theory is the subject of a number of econometric tests utilizing a variety of
regression equations. The latest of these relate to ODI from India and China (Pradhan 2011,
Buckley et.al, 2007; Kumar, 2007 & Nunnenkamp et.al, 2010).
The pioneering studies relating to India are those by Jayaprakash Pradhan who has produced
a book (2008) and a number of articles on India’s ODI (2011; 2004). These studies endorse
the OLI paradigm, mostly O and L, I is taken as given as the firms that invest abroad do
exercise control over operations. The first of several problems facing the statistical analyst is
the availability of data on the dependent variable- the volume of ODI undertaken by Indian
firms. Published data on ODI by Indian firms leaves a lot to be desired. A continuous time
series on the volume, pattern and destination of ODI from published sources is hard to find
and data on acquisitions differ between the sources.
Pradhan (2004) has painstakingly put together a set of data from a number of sources
including the media and unpublished data from government sources. His data set relates to
ODI undertaken by 2155 firms with the extent of ODI measured as the stock of ODI equity
held abroad by each of the firms as a percentage of their net worth for the 10 year period
1990-91 to 2000-01. The variables that are used to measure ownership advantages of the
firms venturing abroad include their R and D expenditures as a percentage of sales, labour
8
productivity defined as net value added per unit of wage and managerial skills variable
measured as profits net of tax as a proportion of sales adjusted for a number of factors
including age of the firm, advertising expenditures, technology and foreign ownership. The
adjustments are undertaken to separate profits of the firm that can be attributed to managerial
efficiency from profits arising from other attributes of the firm. Imports of technology by
firms are yet another variable included to cover the ownership advantages of the outward
investing firms. In addition to these variables the exercise includes exports of the firms
measured as a percentage of their sales in each of the years covered by the exercise and a
dummy variable to denote post 1991 liberalisation measures. The results of the regression
analysis suggest that firms with high labour productivity, R and D expenditures, managerial
skills as defined above, exports and the post 1991 liberalisation measures are a factor in the
decision of Indian manufacturing firms to go abroad.
It is arguable whether or not these results endorse the proposition that Indian firms venturing
abroad possess ownership advantages of the sort that the OLI theory emphasises. High
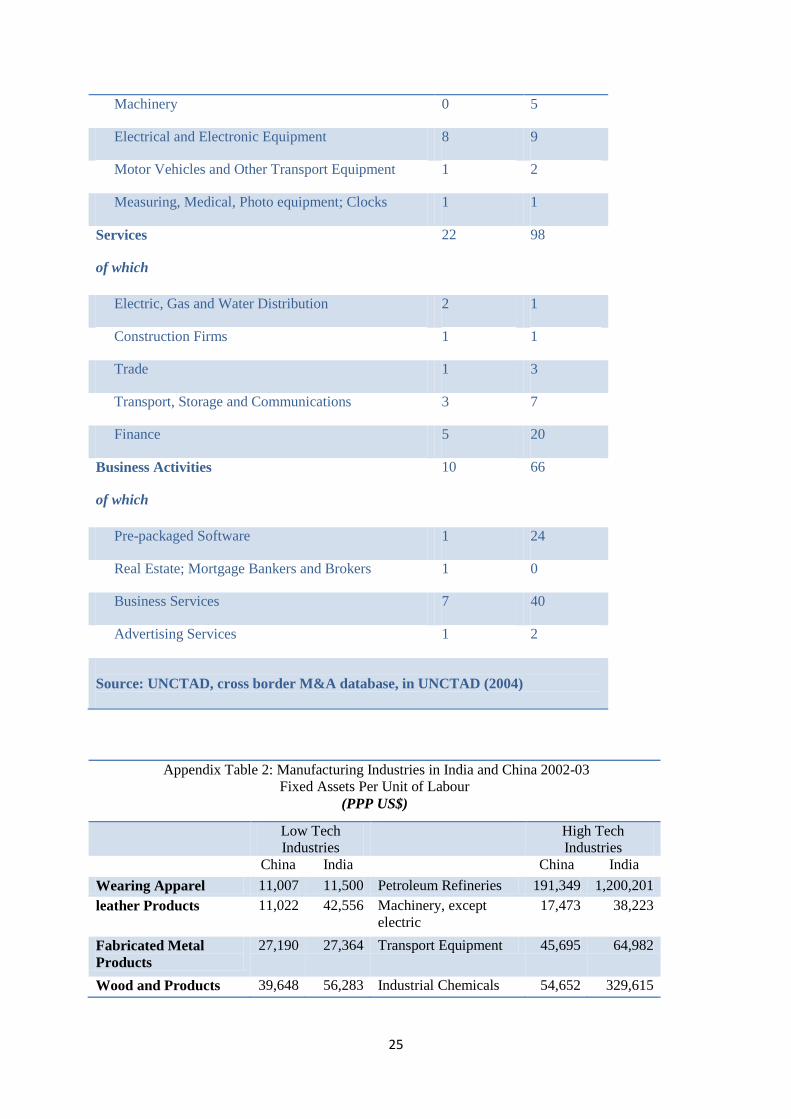
labour productivity of the Indian manufacturing firms flows from the relatively high capital
intensity of their production process and their heavy presence in industries that are typically
capital intensive. These two features of Indian manufacturing are mostly a consequence of the
pre liberalization import substituting industrialisation (ISI) era that is extensively noted in the
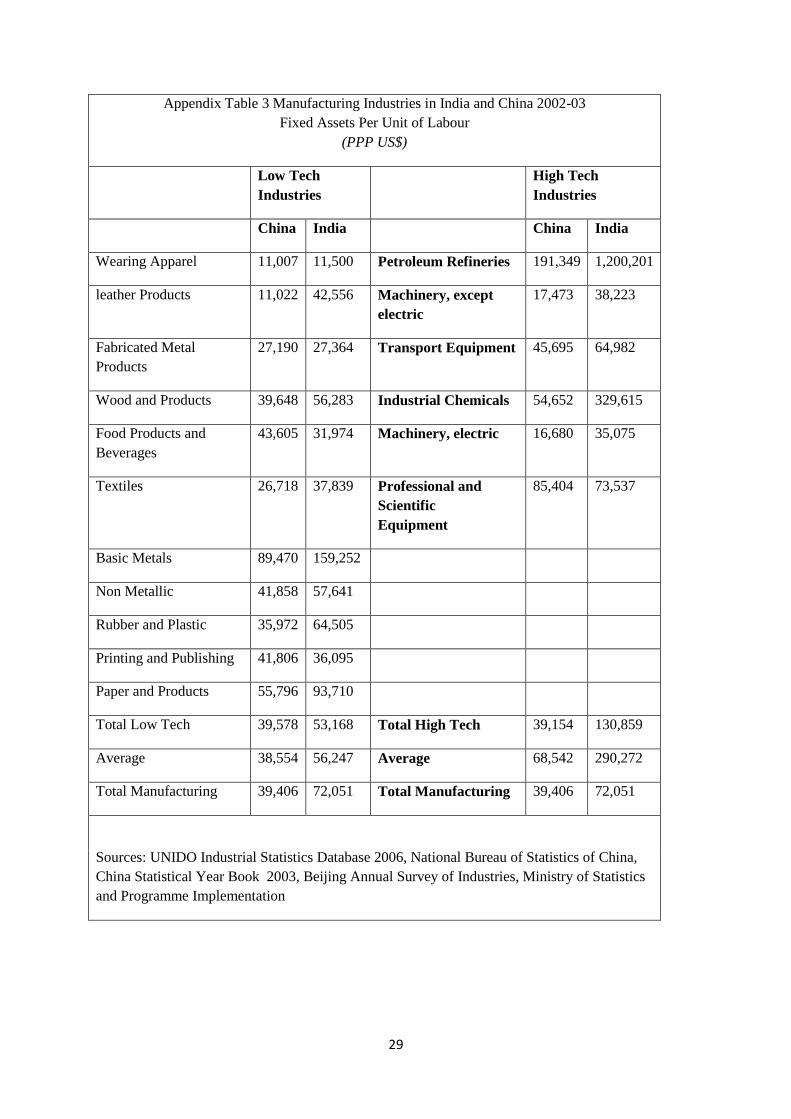
literature (Bhagwati & Desai, 1970, Panagariya, 2008). In fact, most sub groups in the Indian
manufacturing sector are much more capital intensive than comparable industry groups in
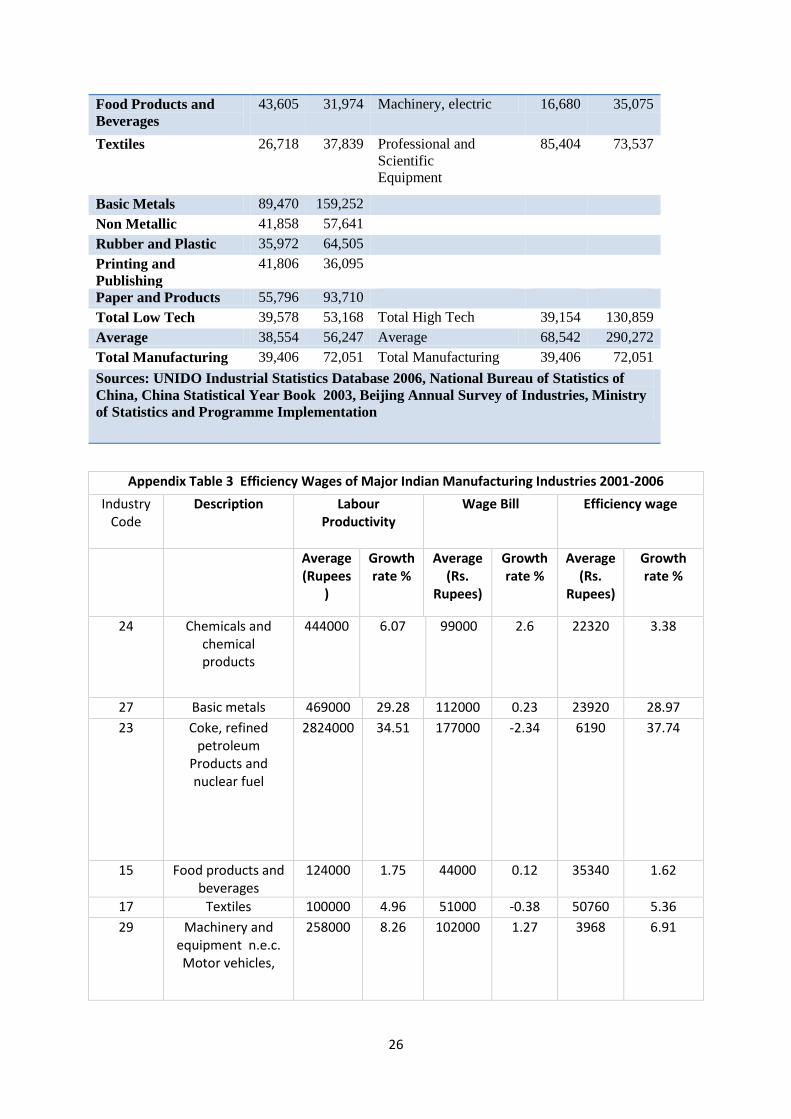
China (Appendix Table 2). The measure of labour productivity used in the aforementioned
statistical exercise is not output per unit of labour, but value added per unit of wage or the
reciprocal of the efficiency wage. The high value added per wage unit of most firms may be a
result of high labour productivity that is not matched by growth in the wage bill (Appendix
table 3). It is not that the wage rate has not increased but just that employment in India’s
manufacturing has not increased appreciably. The low growth of wages as also that of
employment is a feature of the manufacturing sector in the post liberalization era (Kannan &
Raveendran, 2009). Indeed, there are studies that show that growth of exports in the post
reform era has had very little impact on employment if any (Raj & Sen, 2012).It is widely
noted that the high capital intensity of India’s manufacturing sector is mostly driven by the
numerous stringent labour laws that render hiring of labour and arduous and expensive task.
The highly capital intensive organized manufacturing sector contributes only 13 per cent to
total employment in the Indian economy. For these reasons high labour productivity may not
9
be an indicator of ownership advantages gained by labour training and organization, but a
product of high capital intensity of Indian industry in general.
Most studies, including that by Pradhan (2004) report R and D to be a factor in the decision
of firms to go abroad although none can identify the specific ownership advantages it yields,
in fact the composition of Rand D expenditures is rarely reported. It is also surprising that the
technology imports variable in the estimated equation is not statistically significant. This
finding suggests that local R and D may not be the sort that can restructure and adapt
imported technologies to local conditions. Capital and technology intensive industries such as
pharmaceuticals do invest in R and D to keep abreast of rapid changes in technology and it
may be a factor specific to the overseas investments of pharmaceutical firms. It is worth
noting that Rand D though ranks only 8 out of a total of 11 factors that Pradhan includes in
his analysis of the factors that motivate ODI by Indian firms.
The factor that tops the list of variables included in Pradhans’ analysis of ODI by Indian
firms is what he refers to as managerial skills. Indeed, by all accounts managerial expertise of
Indian firms is an ownership advantage that influences firms to go abroad. But managerial
abilities that consist of a variety of attributes is not an easily quantifiable variable, Pradhan
quantifies it by regressing profits per unit of assets of firms on age, size, R and D, royalties
paid for imported know how, sales expenditures and a set of dummy variables for type and
ownership of industries and sectors. The estimated level of profits is deducted from the
actual to arrive at returns to managerial expertise. This is an ingenious method of estimating
managerial skills, something that is inherent in managers, which includes entrepreneurial
skills unrelated to factors that characterize the firm. There may,however, be one problem with
the measure however; it may merely reflect total returns to capital, say value added net of
wages. If the wage rate is low or level of employment is low the residual after deducting
wages from value added would be high. Put another way high profits may not be due to a
high rate of return to managerial ingenuity but just total returns to ownership of capital,
unearned income in Marxist terminology.
Managerial talents including organisational abilities are captured in the ‘A’ term(indicator
of total factor productivity) in the estimated Cobb-Douglas type of production functions
subject to constant returns to scale. Available estimates of total factor productivity growth in
the Indian economy show that it hasn’t increased by much in the post liberalization period
(Deb Kusum et.al, 2010; Goldar and Kumari, 2002, Sen, 2007). Goldar and Kumar’s study
10
records a decline in the annual rate of growth of total factor productivity of Indian
manufacturing sector in the post liberalization period compared with that during the pre-
liberalization period. They attribute this decline in the rate of growth of TFP in the post
liberalization era to a reduction in capacity utilization in Indian manufacturing firms in
general. Yet another study (Mukherjee & Majumdar, 2007) that provides a detailed analysis
of technical change in Indian organised manufacturing industry from the year 1980 to the
year 2000 arrives at a similar conclusion. The study analyses the contribution of technical
progress (adoption of new technologies) and technical efficiency (increased productivity of
existing inputs through organisation and improved utilisation)of existing inputs) across a
number of industries and regions in India and arrives at the conclusion that neither of these
factors have made a significant contribution to growth in productivity. The absence of
technical efficiency in the case of most manufacturing firms shouldn’t be regarded as the
absence of managerial talent required to increase productivity of inputs. It is just that in the
presence of rigid labour laws and a bureaucracy intent on stifling initiative managers may
have opted for maximising profits through adding capital to the production process. They
may also have resorted to outsourcing the production of some of the parts and components of
products to labour in the unorganised sector, but it would add very little to the promotion of
labour efficiency of the main production process.
The statistical results referred to earlier suggest that firms with large profits tend to go
abroad. But not all firms with large profits may be able to do so. Indeed, it is likely that some
if not many of the firms that have invested abroad may have raised the necessary funds in
international capital markets.† Those Indian firms that have ventured abroad not only enjoy
large profits but also a unique ownership advantage that can be termed entrepreneurship that
includes managerial efficiency but is much more comprehensive and extends to risk taking,
forecasting and identification of new markets to name only a few of the attributes of
entrepreneurship. Indian firms may be unique amongst the firms of the emerging economies
in this respect. A number of these unique attributes of firms that cannot be adequately
captured in regression equations may explain the sort of investments and locales that Indian
firms venturing abroad have opted for.
† Reports on acquisitions made by Indian firms suggest that foreign investors in Indian firms . prefer to invest
cash than acquire equity in Indian firms.
11
IV The Unique Attributes of Indian Firms That Go Abroad
The theory or the eclectic paradigm of FDI suggests that firms venturing abroad should
possess a monopoly over advantages that other firms including those in overseas markets do
not enjoy. As discussed earlier the results of statistical studies on ODI by Indian firms do not
adequately endorse this proposition. The so called ownership advantages are enjoyed by both
domestic market oriented and foreign market oriented firms. It is impossible to generalise on
the factors influencing firms that go abroad (Ramamurti 2008, Athreye and Sayeed 2013,
Athukorala, 2009). In fact, most firms from emerging markets invest abroad to acquire
technological capabilities- this is the so called asset seeking motive for ODI. The acquisition
of existing firms does require managerial efficiency, but it is not the kind of efficiency that is
referred to in the statistical studies. The skills that are essential for asset seeking ODI include
identification of the nature and productivity of the assets that the targeted firms possess, the
market potential of these firms, risks involved in operating abroad and above all the ability to
manage operations in a foreign locale. The significance of these skills for firms from
emerging economies, principally for Indian firms, investing abroad is reflected in the
statistical exercises that report the impact of the presence of the country’s diaspora in the
host countries and the gravity models that account for the destination choice of firms
investing abroad (Nunnenkamp et.al, 2012). Geographical proximity of the locales of
investment to the home countries of investing firms and the presence of diaspora of the
investor countries abroad are factors that enable investing firms to deploy the specific skills
required to organise production abroad.
Additionally the acquired firms may have to be revived, they may possess production
oriented advantages but may be ailing because of their inability to explore and develop
markets. For the Indian entrepreneurs that were unshackled from the dirigiste economic
regime during the 1990s, investing abroad and participating fully in the fast growing global
economy was a challenge that had to be met.‡ To use an expression coined by Keynes
“animal spirits” of entrepreneurs, for long locked up by the dirigiste economic policies of the
pre-liberalisation era, were released and there was a spontaneous urge to act on the part of
‡ Nagesh Kumar suggests that the import-substituting phase of the Indian economy may have provided infant
industry protection to Indian firms. Protected access to the domestic markets may have helped them to grow and
build capacity. There is though little evidence to show this is the case. The fact that manufacturing accounts for
only 18 percent of GDP is but one indicator of the negative impact of the controlled economic regime on the
efficiency of the manufacturing sector. See Panagariya (2008) for a detailed analysis of the impact of differing
policy regimes on growth and productivity of the Indian economy.
12
entrepreneurs.§ It is such entrepreneurial talent that seems to have driven several Indian
firms, most notably Tata’s, to raise the capital required for their investments abroad in
international capital markets. In the words of Nathaniel Leff (1979)
” entrepreneurship may reflect superior information, more importantly imagination, which
subjectively reduces the risks and uncertainties of new opportunities, which are ignored or
rejected by other investors”
Studies on entrepreneurship classify entrepreneurship into two broad groups-necessity
entrepreneurship and opportunity entrepreneurship (Koster & Raj, 2008). The former is said
to come into play when employment opportunities deteriorate and job seekers are forced to
establish production facilities on their own. Opportunity based entrepreneurship occurs at
high levels of growth, firms perceive opportunities for growth and explores ways and means
of capturing new markets. Indian firms venturing abroad in the post liberalisation era may
belong to the opportune based class or Schumpeterian entrepreneurs.
The entrepreneurial instincts and expertise of Indian firms is to be traced to several unique
features of the Indian economy, Foremost of these is the inheritance from history. The sort of
business management oriented skills India’s managers possesses is shaped by the history of
India’s business and the structure of major business entities. India has had a long history of
business entrepreneurship marked by its caste and community orientation. Foremost amongst
these groups are the Banias and the Marwaris, primarily merchants and money lenders with a
prominent role in financing India’s foreign trade during the British colonial era. The Parsis
who had no religious affiliation with either the Hindus or the Muslims were in a class of their
own. They provided a link between the British and the Indian business houses
Harish Damodaran (2008), in a study of India’s business classes, captures the special
relationship of the Parsis with the British; “being part of neither the Hindu nor Muslim
mainstream, nursing no political ambition and exposed to commercial influences because of
their proximity to the ports of Bharuch, Surat, and Daman, the Parsis seemed ideal for
recruitment as native brokers, agents and shippers” (Damadoran, 2008, p.14). Their
business ties with the British East India Company were extensive stretching to participation
in the lucrative opium trade with China in the 19 century.
§ The purchase of Blackburn Rovers, a football club in the North of England, by Venkys (an Indian firm in the
poultry business) can only be attributed to the animal spirits of Venkys’ managers, not to their knowledge of
soccer.
13
Business interests of both the Parsis and the Banias were oriented towards global markets for
cotton, tea, silk and other raw materials. In general, Indian firms have had an exposure to
international markets for long. A feature of Indian business enterprises during the colonial
period was the ability of the Indian businessmen to move between two cultures- the Indian
and the European with ease. As Tirthankar Roy (2011) writes “the Indians moved between
the informal world of community norms and the formal world of corporate law and capital
market, with much greater facility than the Europeans, They straddled both spheres
successfully, and used it to great advantage in undercutting European cartels.” It is this
ability to traverse in two cultures with ease that is a factor in the managerial efficiency or
specific ownership advantage that Indian entrepreneurs enjoy to this day. It is an advantage
that has roots in the economic history of India some of the big business houses such as the
Tata’s have had international connections for long. Andrea Goldstein reports that “Tata’s
outlook has been outward- oriented from the very beginning. Tata Limited was established in
London in 1907 as the Tata group’s representative in London (Goldstein, 2008). It is also of
interest to learn from Goldstein’s well researched paper on the Tata group that the Tata
Foundation gave seed research funds to Sidney and Beatrice Webb, the founders of the
London School of Economics.
Second factor that has contributed to the development of entrepreneurial talent amongst
Indian firm is the existence of business groups, mostly of the family orientation. Three
quarters of the total number of acquisitions estimated at 1347 during the period 2000-2008
are reported to be undertaken by group affiliated firms as opposed to stand alone firms. This
reflects the superior advantage enjoyed by business groups over standalone firms that enable
them to efficiently internalize market externalities. (Pradhan, 2010, Khanna and Palepu,
1997, Khanna and Yateh 2007). Group oriented firms are not unique to India, they exist in
other emerging economies too, but the family orientation of the Indian groups may be a
feature of Indian business houses. The units that form the groups produce products and
services that are diversified ,but they all share risks, draw on a pool of finance and
information and invest in training of labour and management. Groups make up for the
absence of developed capital markets and institutions of the sort that facilitate risk taking and
planning in developed countries.
A third factor that has contributed to the sort of services oriented entrepreneurial skills of
Indian business is the system of education, unique to India, from historic times to the present
day. As Tirthankar Roy (2011) notes, the education system in India during the colonial days
14
was caste driven- “the historical pattern of demand for education at all levels was biased
towards certain castes and communities because these people had an inherited association
with literate services. Groups that had contact with scribal professions, medicine, teaching,
and priesthood, in the pre-colonial times, entered education, medicine and public
administration in the colonial times. These classes and castes eagerly used the new schools
and colleges, while other classes and castes entered schools on a smaller scale, and dropped
out more readily. The correlation between family history of literate services, preference for
service professions, and thus, preference for education, was especially close in the three port
cities – Madras, Bombay, and Calcutta”. The education system was caste based and
dominated by those who wished to enter the professions. It was thus that the elite caste
groups advanced from primary to higher education and the system catered to their needs and
primary education for the population in general was ignored. It is the caste based education,
primarily oriented towards the civil service and the professions, which laid the base for the
growth of the services economy and software in the services group, which is one of India’s
major investors abroad.
Indeed, India’s software industry of the present day reflects the sort of caste oriented
education that promoted services in the past. The industry is dominated by members of the
middle class, mostly upper castes, especially the Brahmins, that were prominent in civil
service jobs in the past(Upadhaya 2007, Tauebe). Most of them were pushed out or barred
from the civil service and government oriented jobs with the policy of reservation of jobs for
the backward classes implemented by most state governments including Karnataka and Tamil
Nadu. Faced with a loss of their domination of the civil service and other state related jobs
the Brahmins sought their fortunes in the USA. The choice of software by the upper caste
Indians with engineering and science education is explained by their aversion to manual
labour and jobs involving work on the factory floor. It is of interest that Veblen (1899) in his
well-known treatise the Theory of the Leisure Class cites the Brahmins of India as a fair
illustration of the class of people who are exempt from what he terms as industrial
employments. Veblen’s category of the non-industrial upper class occupations includes
government, warfare, religious observances and sports. Now to this list may be added
software, a non-industrial job that requires an aptitude for organisation and attention to detail
but not manual or industrial sort of work. The sort of ownership advantages Indian firms
including the software firms possess is associated with organization, planning, forecasting,
and exploration of sources of supply of goods and services. All of this that can be categorized
15
as managerial know how and efficiency is grounded in India’s economic history, the pattern
of education and other cultural attributes.
A fourth factor that has contributed to the growth of managerial expertise of the Indian
business houses is the presence of India’s diaspora in the UK and the US. Available data for
the later part of the last decade shows that there were 1.6 million Indians in the UK
accounting for 1.8% of total population of the country and in the US there were 2.8 million
Indians accounting for 0.9% of US population. Whilst the Indian population in the UK is
spread across a number of occupations Indians in the US are mostly in the professions .Most
Indians who migrated to the US from the state of Karnataka in South India during the late
sixties and the early seventies, entered American colleges of engineering and in jobs
associated with space research which, of course, was oriented towards IT programming.
Their median income of $90,000 is above that of the Americans estimated at $50,046.The
professionals in both the US and the UKs act as what Devesh Kapur (2010) refers to as
“reputational intermediaries”; the success of India’s diaspora in the software industry in the
Silicon Valley has enhanced global perception of India, especially perceptions concerning
India’s technology businesses. The diaspora are also a conduit for the transfer of technology
and knowhow, especially so in the software industry. Many of the diaspora are what Jagdish
Bhagwati (1974) refers to as “to and fro migrants,” they traverse between India and the
countries of their residence frequently and they have business interests in both countries. All
of this enhances the managerial expertise of Indian business firms especially so in the service
sector components of the economy such as finance, market intelligence and the software
industry.
The attraction of investing abroad in the presence of a large domestic market, not just a
potential one but one in place, fuelled by the demand for luxury goods and services by India’s
large middle and upper income groups, may seem odd. An often cited explanation for India’s
investments abroad, especially acquisitions of existing firms in the developed countries, is the
so called asset seeking motive on the part of investors. There is some truth in this explanation
as acquisitions provide a ready and easy access to tried and tested technologies in place. The
utilization of these technologies back home requires their assimilation and adaptation to suit
Indian conditions. There may be two other explanations for this spectacular growth of Indian
investments abroad in the post liberalization era- foreign locales may be easier to access and
operate in than the domestic locale. Although the 1991 reforms did do way with many
cumbersome procedures including the licensing system and reservation of specific sectors for
16
small industries, corruption and cumbersome red tape persists. Recent reports in the media
note the frustrations of Indian businessmen with the slow moving government regulatory
system, even on the part of those, known as the bollygarchs, who had built up a working
relationship with the bureaucrats (Crabtree, 2012). Add to this the often cited poor
infrastructure facilities; investing abroad in developed countries may be attractive to profit
laden Indian firms.
This attraction of foreign markets in the presence of a fairly lucrative domestic market in
India has echoes of Britain’s experience during the second half of the 19th century. During
the period 1870-1914 Britain exported substantial volumes of portfolio capital mostly to the
colonies, the total stock of British capital abroad in the year 1914 is estimated at $20 billion.
These exports of capital occurred although there was unemployment at home and a
substantial deficit in the trade balance. The recipients of Britain’s investments abroad were
the colonies, they serviced the borrowings with their export earnings and Britain paid for its
imports of raw materials from the colonies with these returns to its investments abroad. This
scenario, revisited during the 1980s, aroused considerable debate between those who
attributed Britain’s capital exports to differences in rates of return and risk between domestic
equities and foreign bonds (Temin, 1987) and those who attributed it to various sorts of
imperfections in the domestic markets (Pollard, 1985; Balasubramanyam, 1989). The
imperfections in the domestic market that may have led to capital exports included structural
rigidities, trade union power, and unwillingness to change occupations too quickly. These
sorts of imperfections and rigidities seem to be a feature of the present day Indian economy
too. It is of interest to note that the former colony that was the recipient of capital from the
mother country during the 19th century is now exporting capital in the form of FDI to the
former mother country for reasons similar to those that influenced the former mother country
to invest in the colonies.
Yet another factor though not a significant one in the decision of Indian firms to go abroad
may be the complementarity between trade and investment abroad, first suggested by
Pradhan (2008). Exports of raw materials from the parent companies to their subsidiaries,
however, may provide only a partial explanation for this complementarity. It is likely that
whilst these firms export standardised undifferentiated products they invest abroad to
manufacture differentiated products. Presence in markets abroad may be essential for the
17
production and sales of differentiated products. It is also the case that in certain industries,
such as pharmaceuticals, firms produce a diverse range of interrelated products, and it may be
economical and profitable to produce some of the products abroad and export the others from
the home base. It is these factors that result in substantial volumes of intra-industry trade.
Indeed, intra-industry trade appears to have grown substantially since the introduction of
economic liberalisation measures in the year 1991. Available evidence on intra-industry trade
suggests that it consists of both horizontal and vertical intra industry trade with the latter
being prominent (Veeramani, 2001; 2012). Vertical intra-industry trade refers to the
importation of goods belonging to a particular category from one set of countries and exports
of goods belonging to the same category of industry to other countries. It is likely that the
differentiated products abroad are imported back to the home country to service the domestic
market.
In addition to the explanation in terms of costs of production stated above there is also the
consumer preferences for variety, especially the love of goods produced abroad which
provides an explanation for the growth in intra industry trade. As The Economist (2009) puts
it “Indians are fond of shopping abroad, a habit left over from the era of import substitution,
when they had to put up with shoddy homespun goods in the name of national self-
sufficiency”. Recognition of the growth in demand for differentiated products at home that
could be serviced from investments abroad provides yet another example of the
entrepreneurial abilities of Indian business houses.
In sum, the sort of skills Indian entrepreneurs possess that serves them well in their quest for
investment locales abroad are an inheritance from the country’s history - entrepreneurial and
business skills from the colonial days and the engineering and human skills form the more
recent past - the post-independence years. All of these skills were not dimmed but locked up
during the days of the license Raj that lasted for more than three decades until the
introduction of the liberalisation measures in the year 1991. During the import-substituting
industrialisation era entrepreneurial skills were mostly deployed in acquiring various sorts of
licenses and surviving in an economic environment of strict rules and regulations rather than
one of healthy competition. Indeed, some entrepreneurs thrived on manipulating the
investment and trade framework of the license raj to their advantage.**
The sort of activities
that the distorted economic regime encouraged, christened as “Directly Unproductive
**
One entrepreneur who played the system to the advantage of his firm Reliance was Dhirubhai Ambani, See
Hamish McDonald’s (2010) narrative on the birth and growth of one of India’s large corporations .
18
Enterprise” (DUPE) by Bhagwati (2004) may have provided entrepreneurs with adequate
returns but it did little to promote the growth of trade and industry. The economic
liberalisation measures let the genie out of the bottle. They liberated the entrepreneurs from
the sort of dull and dreary chores of coping with rules and regulations and provided an
environment for risk taking and facing the challenges posed by competitive markets in a
globalised world.
V Conclusions
Outward FDI from India for reasons of history and the evolution of India’s economic policies over the
years is unique and distinct from that of other emerging economies. This paper argues that the
proximate reason for the growth of India’s outward FDI is her inheritance of a gifted
entrepreneurial class of businessmen. The paper discusses the roots of the entrepreneurial
class and the economic and social factors that have endowed them with the sort of
entrepreneurial abilities that firms in other emerging economies do not possess. This affinity
for international trade and finance of India’s caste and community based business houses was
held at bay by the dirigiste economic regime that was in place for four decades from the
1950s. The abolition of rules, regulations and restraints on entrepreneurship during the 1990s
unleashed the animal spirits of the entrepreneurs and their desire to participate in the global
economy through trade and investment. The sort of ownership advantages Indian firms
investing abroad possess is in the domain of organisation, identification of investment and
market opportunities and entrepreneurial talent that enables them to operate in international
markets. These and other attributes identified in the paper cannot be easily quantified.
Research in this sphere has to be based on case studies of the sort that Andrea Goldstein has
put together. Perhaps the attributes that Indian firms going abroad can be quantified by
analysing statistical data on their performance abroad compared with that of indigenous firms
in theses locales. Unfortunately data for such an exercise is not easily available
19
References
Athreye, S. & Saeed, A. (2013), “Financial reforms and their effect on domestic and foreign
investment in China and India”, Parallel 3G Institution Presentations, Available at
[https://www.conftool.pro/aibuki2013/index.php?page=browseSessions&path=adminSession
s&form_session=37&print=yes].
Premachandra, A. (2009), “Outward foreign direct Investment from India”, Asian
Development Review, Vol.26, No.2.
Balasubramanyam, V.N. (1989), “Capital Exports, 1870-1914”, Economic History Review,
2nd Edition.
Bhagwati, J. & Padma, D. (1970), “India; Planning for Industrialisation and Trade Policies
since 1951”, Oxford University Press.
Bhagwati, J. (1977) “The Brain Drain, International Resource Flow Accounting,
Compensation, Taxation and Related Policy Proposals”, In Balasubramanyam V. N. (1997).
Bhagwati, J.; Writings on International Economics, Oxford University Press, New Delhi---
(2004) In Defense of Globalization, Oxford University Press.
20
Buckley, P., Clegg, J., Cross, A., Liu, X., Voss, H. & Zheng, P.(2007), “The determinants of
Chinese outward foreign direct investment”, Journal of International Business Studies,
Vol.38, P499-518.
Crabtree, J. (2012), India: Bollygarchs at Bay, Financial Times, Available at
[http://www.ft.com/cms/s/0/aa6814e4-aee9-11e1-a8a7-00144feabdc0.html#axzz2S8aCdfKu].
Damodaran, H. (2008) “India’s New Capitalists”, Permanent Black in collaboration with
New India Foundation.
Kusum Das, D., Azzez, E., Suresh, A. and Wadhwa, D. (2010), “Total Factor Productivity
Growth in India in the Reform Period, A Disaggregated Sectoral Analysis, and Paper
Presented at the KLEM Conference Harvard University.
De Beule, Filip and Duanmu, Jing-Lin (2012), “Locational determinants of
internationalization: A firm-level analysis of Chinese and Indian acquisitions”, European
Management Journal, Vol.30, No.3, P264-277.
Dunning, J. (1993), “Multinational Enterprises and the Global Economy”, Addison-Wesley.
The Economist (2009) “Indian Firms Foreign Purchases: Gone Shopping”, The Economist,
Available at [http://www.economist.com/node/13751556].
Goldar, B.N. & Kumari (2002), “Import Liberalisation and Productivity Growth In Indian
Manufacturing Industries in the 1990s”, Working Paper Number E/219, Institute of Economic
Growth, Delhi.
Goldstein, A. (2008), “Emerging economies Transnationals; The Case of Tata”,
Transnational Corporations, Vol.17, No.3.
Hymer S. (1976), “The International Operations of National Firms: A Study of Direct
Foreign Investment”, Cambridge, MA: MIT Press (1960 PhD Thesis).
21
Kapur, D. (2010), “Diaspora Development and Democracy; The Domestic Impact of
International Migration From India”, Princeton University Press, Princeton and Oxford.
Kannan, P. & Raveendran, G. (2009), “Growth Sans Employment; A Quarter Century of
Jobless Growth in Indian Manufacturing”, Economic and Political Weekly, Vol.44, No.10.
Khanna, T. & Palepu K. G. (1997), “Why Focused Strategies May be Wrong in Emerging
Markets”, Harvard Business Review.
Koster, S. & Rai, S.K. (2008), “Entrepreneurship in a Developing Country; Case Study of
India”, Journal of Entrepreneurship, Vol.17 No.117.
Kumar Nagesh (2008) Internationalisation of Indian enterprises; patterns, strategies,
ownership advantages and implications, Asian Economic Policy Review.
Kumar Nagesh(2007) Emerging TNCs; trend, patterns and determinants of outward FDI by
Indian enterprises , Transnational Corporations, No.1, Vol.16.
Leff, N. (1979), “Entrepreneurship and Development; The Problem Revisited”, Journal of
Economic Literature, Vol.XVII, No.1.
McDonald, H. (2010), “Mahabharata in Polyester; The making of the world’s richest brothers
and their feud”, University of New South Wales, Sydney.
Mukherjee Dipa and Majumder Rajarshi (2008), “Efficiency, Technological Progress and
Regional Comparative Advantage: A Study of Organised Manufacturing Sector in India”,
MPRA Paper 12758, University Library of Munich.
Ministry of Commerce (2008), “Statistical Bulletin of China’s Outward Foreign Direct
Investment”, Ministry of Commerce, Available at [http://hzs2.mofcom.gov.cn].
Nunnenkamp, P., Maximiliano, S.A., Krishna, C.V. & Andreas, W. (2012), “What Drives
India’s Outward FDI?”, Kiel Working Papers, Kiel Institute for the World Economy,
No.1800.
22
Panagariya Arvind (2010), “India; The Emerging Giant”, Oxford University Press, Delhi.
Pradhan, J.P. (2010), “Group Affiliation and Location of India’s Foreign Acquisitions”,
MPRA Paper No. 24018, Journal of International Commerce, Economics & Policy (JICEP).
Pradhan, J.P. (2008), “Indian Multinationals in the World Economy; Implications for
Development”, Bookwell, First Edition.
Pradhan, J.P. (2004) “The Determinants of Outward Foreign Direct Investment: A Firm
Level Analysis of Indian Manufacturing”, Oxford Development Studies, Vol.32.
Pollard, S. (1985), “Capital Exports, 1870-1914: Harmful or Beneficial”, Economic History
Review, 2nd series XL.
Rajesh, R. & Kunal, S. (2012), “The Impact of International Trade on Manufacturing
Employment in India” In Pushpangadan, K. & Balasubramanyam V.N. (2012) “India’s
Record Since Liberalisation; Growth, Development and Diversity”, Oxford University Press.
Sen Kunal (2007) “Why Did the Elephant Start to Trot? India’s Growth Acceleration Re
Examined” Economic and Political Weekly, 27 November, volume 43 number2 PP 37-47
Murti, R. (2010), “What Have We Learned About Emerging-Market MNEs? Insights from a
Multi-Country Research Project Paper presented at a conference on “Emerging
Multinationals: Outward FDI from Emerging and Developing Economies”, Copenhagen
Business School, Copenhagen, Denmark, October 9-10, 2008.
Roy, T. (2011), “The Economic History of India, 1757-2010”, Third Edition, Oxford
University Press.
Temin, P. (1987), “Capital Exports,1870-1914: An Alternative Model”, Economic History
Review, 2nd series XL.
Teube, F.A. (2003), “Proximities and Innovation: Evidence from the Indian IT Industry in
Bangalore”, Working Paper No 04-10, Danish Research Unit For Industrial Dynamics.
23
UNCTAD (2010), “World Investment Report”, United Nations, Geneva.
Upadhya, C. (2004), “A new capitalist transnational class? Capital flows, business networks
and entrepreneurs in the Indian software industry”, Economic and Political Weekly, Vol.39,
No.48, P5141-51.
Thorstein, V. (1899), “The Theory of the Leisure Class”, Macmillan New York, 7th Edition.
Veeramani, C. (2001), “India’s Intra-Industry Trade Under Economic Liberalization”,
Working Paper No. 313, Centre for Development Studies.
Veeramani, C. (2012), “Anatomy of India's Merchandise Export Growth, 1993-94 to 2010-
11”, Economic and Political Weekly, Vol.XLVII, No.1.
Wagstyl, S. (2010), “The Rise of the Developing World”, Financial Times, Available at
[http://www.ft.com/cms/s/2/35a004c6-ca4f-11df-a860-00144feab49a.html#axzz2S8aCdfKu].
24
Appendices
Appendix Table 1 : Industry Distribution of India’s Mergers and Acquisitions,
2000-2003
Number of Acquisitions
1996-1999 2000-2003
Total Industry 60 182
Primary 3 3
Secondary
of which
35 81
Food Beverages and Tobacco 2 9
Textile, Clothing and Leather 2 1
Printing, Publishing and Allied Services 0 1
Oil and Gas; Petroleum Refining 1 7
Chemicals and Chemical Products 18 36
Rubber and Miscellaneous Plastic Products 0 1
Stone, Clay, Glass and Concrete Products 1 2
Metal and Metal Products 1 7
25
Machinery 0 5
Electrical and Electronic Equipment 8 9
Motor Vehicles and Other Transport Equipment 1 2
Measuring, Medical, Photo equipment; Clocks 1 1
Services
of which
22 98
Electric, Gas and Water Distribution 2 1
Construction Firms 1 1
Trade 1 3
Transport, Storage and Communications 3 7
Finance 5 20
Business Activities
of which
10 66
Pre-packaged Software 1 24
Real Estate; Mortgage Bankers and Brokers 1 0
Business Services 7 40
Advertising Services 1 2
Source: UNCTAD, cross border M&A database, in UNCTAD (2004)
Appendix Table 2: Manufacturing Industries in India and China 2002-03
Fixed Assets Per Unit of Labour
(PPP US$)
Low Tech
Industries
High Tech
Industries
China India China India
Wearing Apparel 11,007 11,500 Petroleum Refineries 191,349 1,200,201
leather Products 11,022 42,556 Machinery, except
electric
17,473 38,223
Fabricated Metal
Products
27,190 27,364 Transport Equipment 45,695 64,982
Wood and Products 39,648 56,283 Industrial Chemicals 54,652 329,615
26
Food Products and
Beverages
43,605 31,974 Machinery, electric 16,680 35,075
Textiles 26,718 37,839 Professional and
Scientific
Equipment
85,404 73,537
Basic Metals 89,470 159,252
Non Metallic 41,858 57,641
Rubber and Plastic 35,972 64,505
Printing and
Publishing
41,806 36,095
Paper and Products 55,796 93,710
Total Low Tech 39,578 53,168 Total High Tech 39,154 130,859
Average 38,554 56,247 Average 68,542 290,272
Total Manufacturing 39,406 72,051 Total Manufacturing 39,406 72,051
Sources: UNIDO Industrial Statistics Database 2006, National Bureau of Statistics of
China, China Statistical Year Book 2003, Beijing Annual Survey of Industries, Ministry
of Statistics and Programme Implementation
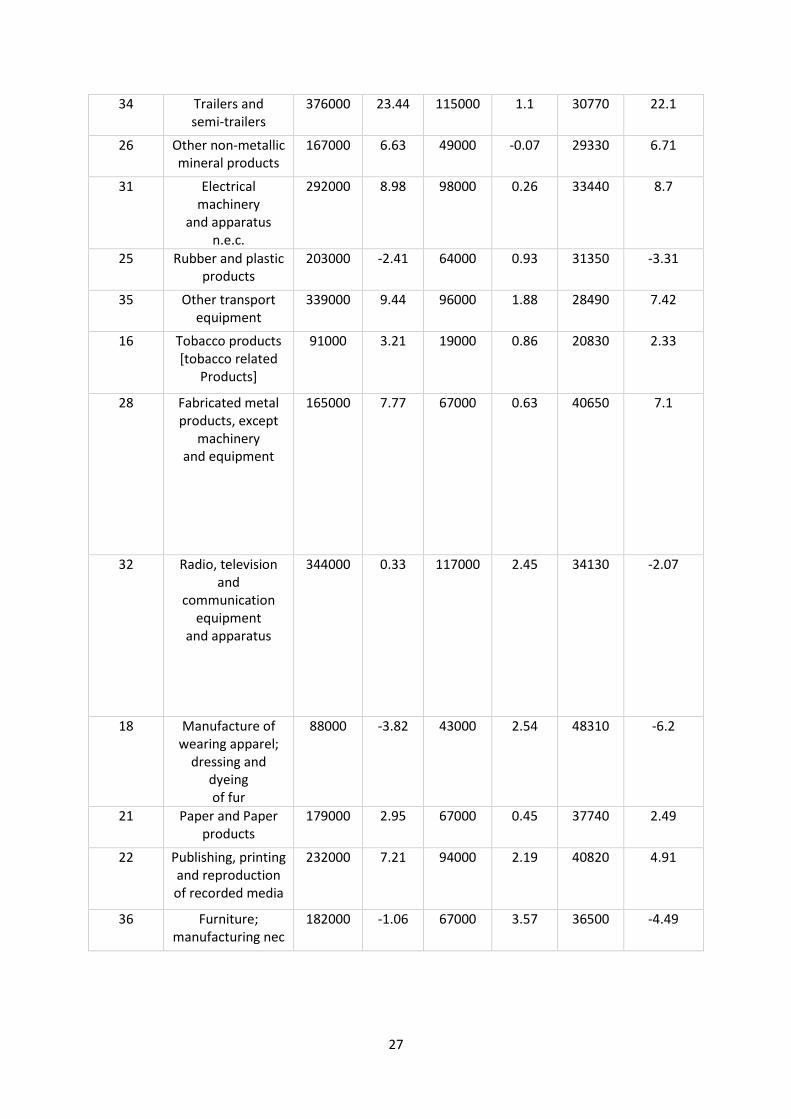
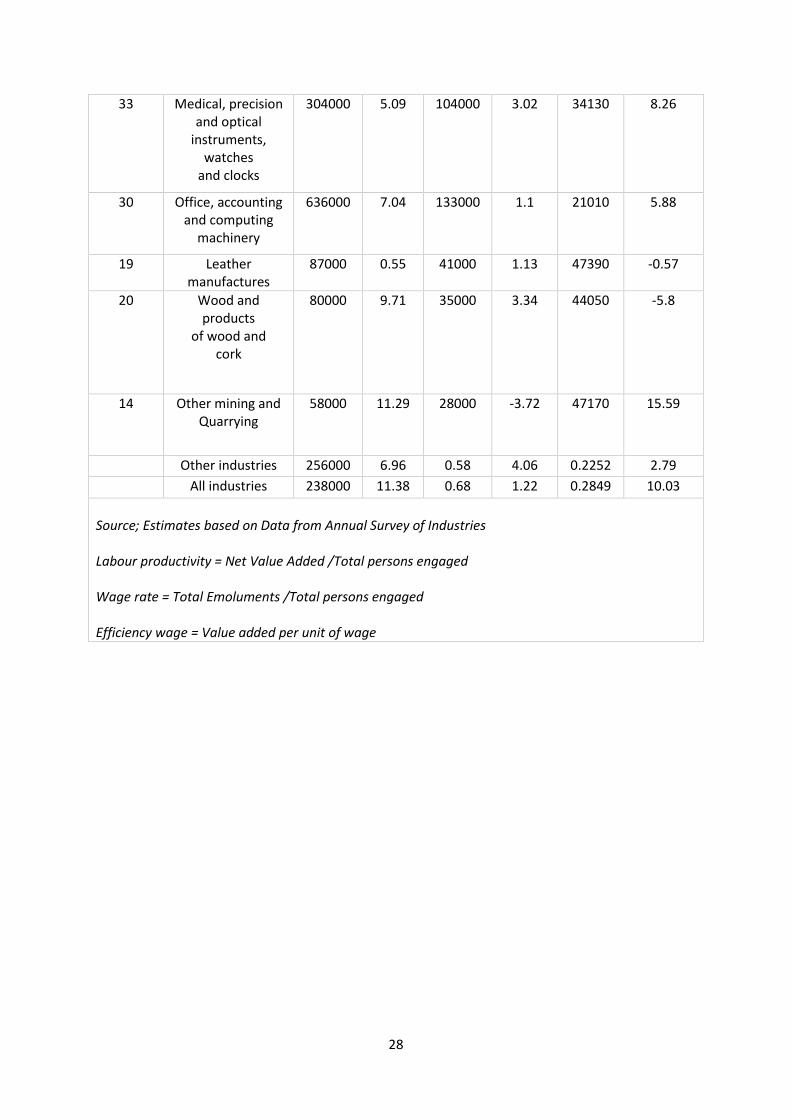
Appendix Table 3 Efficiency Wages of Major Indian Manufacturing Industries 2001-2006
Industry Code
Description Labour Productivity
Wage Bill Efficiency wage
Average (Rupees
)
Growth rate %
Average (Rs.
Rupees)
Growth rate %
Average (Rs.
Rupees)
Growth rate %
24 Chemicals and chemical products
444000 6.07 99000 2.6 22320 3.38
27 Basic metals 469000 29.28 112000 0.23 23920 28.97
23 Coke, refined petroleum
Products and nuclear fuel
2824000 34.51 177000 -2.34 6190 37.74
15 Food products and beverages
124000 1.75 44000 0.12 35340 1.62
17 Textiles 100000 4.96 51000 -0.38 50760 5.36
29 Machinery and equipment n.e.c. Motor vehicles,
258000 8.26 102000 1.27 3968 6.91
27
34 Trailers and semi-trailers
376000 23.44 115000 1.1 30770 22.1
26 Other non-metallic mineral products
167000 6.63 49000 -0.07 29330 6.71
31 Electrical machinery
and apparatus n.e.c.
292000 8.98 98000 0.26 33440 8.7
25 Rubber and plastic products
203000 -2.41 64000 0.93 31350 -3.31
35 Other transport equipment
339000 9.44 96000 1.88 28490 7.42
16 Tobacco products [tobacco related
Products]
91000 3.21 19000 0.86 20830 2.33
28 Fabricated metal products, except
machinery and equipment
165000 7.77 67000 0.63 40650 7.1
32 Radio, television and
communication equipment
and apparatus
344000 0.33 117000 2.45 34130 -2.07
18 Manufacture of wearing apparel;
dressing and dyeing of fur
88000 -3.82 43000 2.54 48310 -6.2
21 Paper and Paper products
179000 2.95 67000 0.45 37740 2.49
22 Publishing, printing and reproduction of recorded media
232000 7.21 94000 2.19 40820 4.91
36 Furniture; manufacturing nec
182000 -1.06 67000 3.57 36500 -4.49
28
33 Medical, precision and optical
instruments, watches
and clocks
304000 5.09 104000 3.02 34130 8.26
30 Office, accounting and computing
machinery
636000 7.04 133000 1.1 21010 5.88
19 Leather manufactures
87000 0.55 41000 1.13 47390 -0.57
20 Wood and products
of wood and cork
80000 9.71 35000 3.34 44050 -5.8
14 Other mining and Quarrying
58000 11.29 28000 -3.72 47170 15.59
Other industries 256000 6.96 0.58 4.06 0.2252 2.79
All industries 238000 11.38 0.68 1.22 0.2849 10.03
Source; Estimates based on Data from Annual Survey of Industries Labour productivity = Net Value Added /Total persons engaged Wage rate = Total Emoluments /Total persons engaged Efficiency wage = Value added per unit of wage
29
Appendix Table 3 Manufacturing Industries in India and China 2002-03
Fixed Assets Per Unit of Labour
(PPP US$)
Low Tech
Industries
High Tech
Industries
China India China India
Wearing Apparel 11,007 11,500 Petroleum Refineries 191,349 1,200,201
leather Products 11,022 42,556 Machinery, except
electric
17,473 38,223
Fabricated Metal
Products
27,190 27,364 Transport Equipment 45,695 64,982
Wood and Products 39,648 56,283 Industrial Chemicals 54,652 329,615
Food Products and
Beverages
43,605 31,974 Machinery, electric 16,680 35,075
Textiles 26,718 37,839 Professional and
Scientific
Equipment
85,404 73,537
Basic Metals 89,470 159,252
Non Metallic 41,858 57,641
Rubber and Plastic 35,972 64,505
Printing and Publishing 41,806 36,095
Paper and Products 55,796 93,710
Total Low Tech 39,578 53,168 Total High Tech 39,154 130,859
Average 38,554 56,247 Average 68,542 290,272
Total Manufacturing 39,406 72,051 Total Manufacturing 39,406 72,051
Sources: UNIDO Industrial Statistics Database 2006, National Bureau of Statistics of China,
China Statistical Year Book 2003, Beijing Annual Survey of Industries, Ministry of Statistics
and Programme Implementation

30