Embed Size (px)
Citation preview

RE S E AR C H RE P O R T
Why Did Medicare Advantage
Enrollment Grow As Payment
Pressure Increased? Examining the Role of Market and Demographic Changes
Laura Skopec Stephen Zuckerman Eva H. Allen Joshua Aarons
April 2019
H E A L T H P O L I C Y C E N T E R

AB O U T T H E U R BA N I N S T I T U TE
The nonprofit Urban Institute is a leading research organization dedicated to developing evidence-based insights
that improve people’s lives and strengthen communities. For 50 years, Urban has been the trusted source for
rigorous analysis of complex social and economic issues; strategic advice to policymakers, philanthropists, and
practitioners; and new, promising ideas that expand opportunities for all. Our work inspires effective decisions that
advance fairness and enhance the well-being of people and places.
Copyright © April 2019. Urban Institute. Permission is granted for reproduction of this file, with attribution to the
Urban Institute. Cover image by Tim Meko.

Contents Acknowledgments iv
Why Did Medicare Advantage Enrollment Grow As Payment Pressure Increased? 1
Introduction and Background 1
Data and Methods 3
Findings 5
Descriptive Analyses of Medicare Advantage Enrollment Growth 5
What Explains Differences in MA Enrollment Growth across Counties? 12
Discussion 15
Appendix 18
Notes 21
References 23
About the Authors 25
Statement of Independence 27

I V A C K N O W L E D G M E N T S
Acknowledgments This report was funded by the National Institute for Health Care Reform. We are grateful to them and
to all our funders, who make it possible for Urban to advance its mission. The authors also thank Robert
Berenson and Timothy Waidmann for their review and comments.
The views expressed are those of the authors and should not be attributed to the Urban Institute,
its trustees, or its funders. Funders do not determine research findings or the insights and
recommendations of Urban experts. Further information on the Urban Institute’s funding principles is
available at urban.org/fundingprinciples.

Why Did Medicare Advantage
Enrollment Grow As Payment
Pressure Increased? Examining the Role of Market and Demographic Changes
Introduction and Background
Medicare Advantage (MA), also known as Medicare Part C, gives Medicare beneficiaries an option to
receive their Parts A and B benefits through private health insurance plans as an alternative to
traditional Medicare. MA has been attractive to many Medicare beneficiaries in part because of several
enhancements plans typically make to the Part A and B benefit packages. For example, depending on
MA plans’ bids, they receive rebates that they must use to offer supplemental benefits such as dental,
vision, and hearing coverage at no extra cost, or other benefit enhancements such as yearly limits on
out-of-pocket spending and low or $0 premiums beyond that required for Part B.1 Most Medicare
Advantage plans also include integrated Part D prescription drug coverage. In addition, MA plans must
also have an out-of-pocket maximum, which is not available in traditional Medicare without
supplemental coverage.
Overall, MA is often a cheaper, one-stop-shopping alternative compared to a comprehensive
traditional Medicare package that includes Part A, Part B, Part D, and MediGap (Berenson 2004).
However, though beneficiaries enrolled in the traditional Medicare program enjoy access to almost any
health care provider, MA plan enrollees are generally limited in their choice of provider and may need a
referral to see a specialist or prior authorization to obtain a particular procedure or service.2
Many policymakers believe including private health insurance plans in Medicare has the potential
to improve quality, increase beneficiaries’ choices, and reduce government spending, among other
policy objectives (Berenson and Dowd 2009). But, the federal government has struggled to control MA
costs, and in 2009, average payments to MA plans peaked at 114 percent of spending on traditional
Medicare (MedPAC 2009a). These overpayments to private plans were partially attributed to the
bidding and benchmark process, established in the Medicare Modernization Act of 2003 to stabilize
declining plan participation and benefit generosity of private plans in Medicare (Berenson and Dowd
2009; Patel and Guterman 2017; Zarabozo and Harrison 2009).

2 W H Y D I D M A E N R O L L M E N T G R O W A S P A Y M E N T P R E S S U R E I N C R E A S E D ?
The Affordable Care Act (ACA), enacted in 2010, introduced several changes to the MA payment
rate calculation to better align Medicare spending on private plan enrollees with average spending per
traditional enrollee. Under the ACA, the Centers for Medicare & Medicaid Services (CMS) sets county-
level benchmarks at four levels based on estimated per capita spending in traditional Medicare, where
the quartile of counties with the highest per capita traditional Medicare spending is assigned a
benchmark of 95 percent of traditional Medicare cost, and the lowest-spending quartile is assigned a
benchmark of 115 percent of traditional Medicare costs (Biles et al. 2012). The ACA also lowered the
rebate amounts from 75 percent to 50–70 percent of the difference between the benchmark and a
plan’s bid, depending on the plan’s quality ratings, and allowed plans with four-star quality ratings and
above to receive both higher benchmarks and rebate percentages (Hayes 2015). Changes introduced
under the ACA succeeded in lowering the payments MA plans from an average of 114 percent of
traditional Medicare spending per beneficiary in 2009 to an average of 101 percent in 2018 (MedPAC
2009b, 2017).
The CMS Office of the Actuary and the Congressional Budget Office expected ACA payment
changes to reduce enrollment in MA plans by making private plans less attractive to both insurers,
through reduced payments, and beneficiaries, through expected cuts to supplemental benefits and
increased cost sharing (Foster 2010; Nicholas 2014).3 Despite those expectations, MA plan enrollment
has nearly doubled since ACA implementation, increasing from 10.5 million in 2009 to 18.5 million in
2017 (MedPAC 2018a). Today, one-third of Medicare beneficiaries are enrolled in private plans, a share
that the Congressional Budget Office estimates will increase to 42 percent by 2028.4
Research shows that MA programs’ significant growth in recent years has likely been aided by
several factors that also helped plans withstand payment cuts (Guterman, Skopec, and Zuckerman
2018; L&M Policy Research 2016; MedPAC 2009b, 2017, 2018b; Skopec, Zuckerman, and Aarons,
forthcoming; Song and Pelech 2018). First, quality bonus payments to MA plans may have alleviated the
impact of payment rate cuts. For example, the ACA established bonus payments only for plans that
achieve a four-star or higher quality rating, but between 2012 and 2014, CMS conducted a three-year
demonstration project that extended bonuses to plans with three- or three-and-a-half-star ratings. An
independent evaluation did not find evidence that the demonstration improved MA performance on
clinical measures relative to other health insurance sectors (L&M Policy Research 2016). Plan
consolidation has also allowed some plans to obtain larger quality bonuses than they would have
otherwise received (MedPAC 2018b).
Second, the ACA phased in payment cuts over several years, giving plans time to adjust by
controlling costs. On average, MA plans reduced their bids from 102 percent of traditional Medicare

W H Y D I D M A E N R O L L M E N T G R O W A S P A Y M E N T P R E S S U R E I N C R E A S E D ? 3
spending per beneficiary in 2009 to 90 percent in 2018 (Guterman, Skopec, and Zuckerman 2018;
MedPAC 2009b, 2017). Contrary to initial fears, MA plans lowered their bids without reducing
supplemental benefits or increasing premiums and cost sharing, resulting in relatively stable enrollee
access and affordability since ACA implementation (Skopec, Zuckerman, and Aarons, forthcoming; Song
and Pelech 2018).
Third, rebate reductions under the ACA have been modest; nationally, rebates declined from an
average of 12 percent of traditional Medicare spending per beneficiary in 2009 to 10 percent in 2017
(MedPAC 2009b, 2017). Average rebate amounts per beneficiary have grown since ACA
implementation, from $83 per beneficiary per month in 2011 to $95 in 2018 (MedPAC 2017, 2018b).
Finally, MA plans’ payments are risk adjusted to account for variation in enrollee risk across MA
plans and between MA plans and traditional Medicare. Over time, risk scores for MA plans have
increased because MA plans more completely code relevant patient diagnoses than traditional
Medicare (Kronick 2017). This results in increased risk adjustment payments to MA plans, which could
have offset payment cuts, helping preserve revenue (Guterman, Skopec, and Zuckerman 2018; Kronick
2017). While the ACA included an adjustment to risk scores to partially correct for this problem, that
adjustment is insufficient to fully recapture excess risk adjustment payments to MA plans (MedPAC
2018b).
These findings alone do not fully explain MA’s rapid growth, however. Stable rebates and premiums
would be expected to yield stable MA enrollment or modest growth, not rapidly double the size of the
program. This report disaggregates MA enrollment growth by plan type and geography to better
understand variation in the growth of Medicare private plans and explores county-level market and
demographic changes associated with increased MA penetration.
Data and Methods
Our data cover 2009 and 2017 and were collected from publicly available sources provided by CMS and
compiled at the state and county levels. CMS files include county-level information on MA penetration
and benchmarks, plan- and county-level information on enrollment, contract-level data on star ratings,
and both MA and prescription drug plan premiums.5 Though aggregate enrollment data are available for
2018, the other data needed for this study were only available through 2017 when we conducted the
analysis. We supplemented the state- and county-level Medicare information for 2009 and 2017 with

4 W H Y D I D M A E N R O L L M E N T G R O W A S P A Y M E N T P R E S S U R E I N C R E A S E D ?
data from the American Community Survey one-year estimates for the corresponding years, which
provide the demographic characteristics for counties with populations of at least 65,000.6
We used these data for descriptive and multivariate analyses. For the descriptive analyses, we
calculated changes in MA penetration and enrollment by plan type across states and regions between
2009 and 2017. Our analysis excluded Programs of All-Inclusive Care for the Elderly and
demonstration plans, including dual-eligible demonstrations. Our analysis included plans reimbursed on
the basis of their costs that do not take financial risk. Though these plans are not technically part of the
MA program, CMS includes them in estimates of the share of the elderly enrolled in private plans, and
they are an important component of the Medicare program in some states.7 Table 1 shows the plan
types included in our analyses.
TABLE 1
Medicare Advantage Plan Types
Plan type Description
Health maintenance organization (HMO)
These plans generally have a network of providers and require enrollees to choose a primary care doctor. Referrals from that primary care doctor are generally required to see specialists. Includes local and regional HMO plans but excludes all employer and special needs plans.
Preferred provider organization (PPO)
These plans generally have a network of providers but do not require enrollees to choose a primary care doctor, and often do not require a referral from a primary care doctor to see specialists. Includes local and regional MA PPO plans but excludes all employer and special needs plans.
Private fee-for-service (PFFS) plans
These plans generally have open networks and no specialist referral requirements. Their availability significantly decreased between 2009 and 2017. Excludes all employer PFFS plans.
Cost plans These are not MA plans but are administered by private health insurers and included in CMS’s estimates of Medicare private plan enrollment. Unlike MA plans, which require both Parts A and B enrollment, cost plans are available to beneficiaries who are only enrolled in Part A, such as those who maintain employer coverage. Cost plans are also available for enrollment or disenrollment all year. Beneficiaries can also receive out-of-network care with Parts A and B standard coverage.
Special needs plans (SNP) These plans are available only to Medicare beneficiaries who are dually eligible for Medicare and Medicaid (D-SNP), who have certain chronic conditions like diabetes (C-SNP), or who are institutionalized (I-SNP). They can be HMO or PPO plan types.
Employer group health plans (EGHP)
These plans are sponsored by employers or unions and made available to retirees. They can be HMO, PPO, or PFFS plan types.
Notes: CMS = Centers for Medicare & Medicaid Services. MA = Medicare Advantage.
To explain the variation in MA penetration growth across counties between 2009 and 2017, we
estimated multivariate first differences models as a function of county-level MA market and
demographic changes over the period. The dependent variable for each model was the change in MA
penetration. In these models, we only included HMO, PPO, PFFS, cost, and special needs plans when

W H Y D I D M A E N R O L L M E N T G R O W A S P A Y M E N T P R E S S U R E I N C R E A S E D ? 5
calculating MA penetration changes. We excluded changes in employer group health plan penetration
because employers, rather than beneficiaries, make decisions about retiree coverage. However, we
included cost plans because they greatly affect overall private Medicare plan selection in some states.
We used two samples for the multivariate models:
Sample 1, used in Model 1, includes changes in market characteristics for 2,833 counties.
Sample 2, used for Model 2, includes changes in demographic data and market characteristics
and is limited to 790 counties with populations of 65,000 or greater because of the restrictions
of the American Community Survey one-year estimates.
Both models include the following market characteristics for each county: (1) changes in access to a
$0 premium plan, (2) changes in access to a four- or four-and-a-half-star plan, (3) changes in access to a
five-star plan, (4) changes in monthly Part D premiums, and (5) changes in monthly MA benchmarks. The
second model also includes the following demographic characteristics for each county: (1) changes in
the share of the population that is elderly (ages 65 and older), (2) changes in the share of the elderly
population ages 65 to 69, (3) changes in the share of the elderly population with income below the
census poverty line, and (4) changes in the share of the elderly population reporting a disability.
Findings
Descriptive Analyses of Medicare Advantage Enrollment Growth
Between 2009 and 2017, MA enrollment in HMO, PPO, PFFS, SNP, employer, and cost plans grew from
10.2 million to 18.5 million beneficiaries. As shown in table 2, nearly all plan types grew between 2009
and 2017, and, except for PFFS and PPO plans, the share of MA enrollees in each plan type remained
relatively stable. A substantial share of the growth in PPO plan enrollment seems related to
beneficiaries switching from PFFS to PPO plans, because many PFFS plans were discontinued over this
period because of a policy change requiring MA plans to form networks (Pelech 2017). In both 2009 and
2017, HMOs were the dominant plan type in MA, covering nearly half of beneficiaries, but PPOs,
employer plans, and SNPs also grew significantly over this period.8
Between 2009 and 2017, HMO plan growth accounted for half of the growth in MA, and PPO
plans accounted for 29.1 percent of all MA growth (figure 1). However, employer plan growth
accounted for 21.7 percent of MA growth over this period, meaning MA growth was not driven
exclusively by beneficiary and insurer choices but also by employer choices. Similarly, 11.9 percent of
6 W H Y D I D M A E N R O L L M E N T G R O W A S P A Y M E N T P R E S S U R E I N C R E A S E D ?
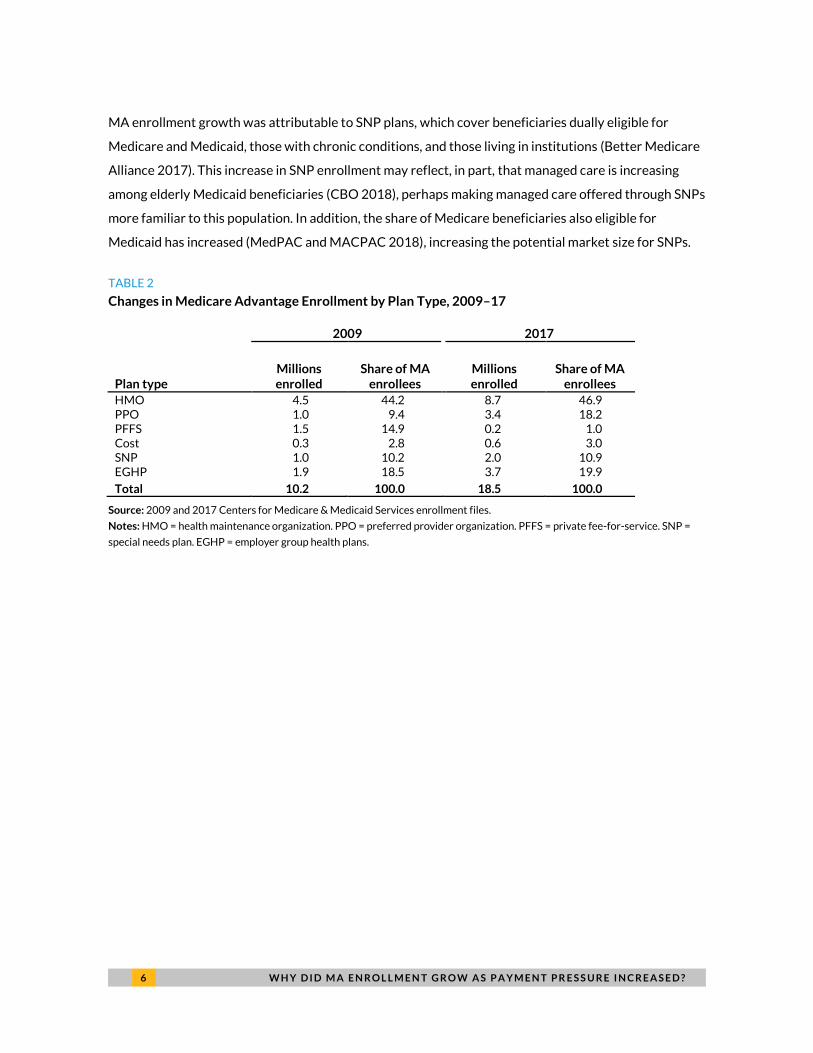
MA enrollment growth was attributable to SNP plans, which cover beneficiaries dually eligible for
Medicare and Medicaid, those with chronic conditions, and those living in institutions (Better Medicare
Alliance 2017). This increase in SNP enrollment may reflect, in part, that managed care is increasing
among elderly Medicaid beneficiaries (CBO 2018), perhaps making managed care offered through SNPs
more familiar to this population. In addition, the share of Medicare beneficiaries also eligible for
Medicaid has increased (MedPAC and MACPAC 2018), increasing the potential market size for SNPs.
TABLE 2
Changes in Medicare Advantage Enrollment by Plan Type, 2009–17
2009 2017
Plan type Millions enrolled
Share of MA enrollees
Millions enrolled
Share of MA enrollees
HMO 4.5 44.2 8.7 46.9 PPO 1.0 9.4 3.4 18.2 PFFS 1.5 14.9 0.2 1.0 Cost 0.3 2.8 0.6 3.0 SNP 1.0 10.2 2.0 10.9 EGHP 1.9 18.5 3.7 19.9
Total 10.2 100.0 18.5 100.0
Source: 2009 and 2017 Centers for Medicare & Medicaid Services enrollment files.
Notes: HMO = health maintenance organization. PPO = preferred provider organization. PFFS = private fee-for-service. SNP =
special needs plan. EGHP = employer group health plans.

W H Y D I D M A E N R O L L M E N T G R O W A S P A Y M E N T P R E S S U R E I N C R E A S E D ? 7
FIGURE 1
Share of 2009–17 Medicare Advantage Enrollment Growth Attributable to Each Plan Type
URBAN I NS T I T UT E
Source: 2009 and 2017 Centers for Medicare & Medicaid Services enrollment files.
Notes: HMO = health maintenance organization. PPO = preferred provider organization. PFFS = private fee-for-service. SNP =
special needs program. EGHP = employer group health plan.
MA enrollment grew unevenly across regions (figure 2 and table 3).9 The South Atlantic region
accounted for 23.3 percent of all MA growth between 2009 and 2017, and penetration in that region
grew 12.3 percentage points, faster than the national average of 10.2 percentage points (table 3).
Penetration grew fastest in the East South Central region, at 13.8 percentage points, but it accounted
for only 7.4 percent of MA enrollment growth because of its smaller size. MA was least popular in New
England, which accounted for only 3.4 percent of MA growth and had the lowest 2017 penetration rate
at 22.7 percent.
50.2%
29.1%
-16.1%
3.3%
11.9%
21.7%
HMO PPO PFFS Cost SNP EGHP

8 W H Y D I D M A E N R O L L M E N T G R O W A S P A Y M E N T P R E S S U R E I N C R E A S E D ?
FIGURE 2
Share of 2009–17 Medicare Advantage Enrollment Growth Attributable to Each Region
URBAN I NS T I T UT E
Source: 2009 and 2017 Centers for Medicare & Medicaid Services enrollment files.
Note: Table A.1 lists the states in each region.
3.4%
10.5%
16.6%
6.8%
23.3%
7.4%
12.3%
5.7%
14.1%
NewEngland
MiddleAtlantic
East NorthCentral
West NorthCentral
SouthAtlantic
East SouthCentral
West SouthCentral
Mountain Pacific
Northeast Midwest South West

W H Y D I D M A E N R O L L M E N T G R O W A S P A Y M E N T P R E S S U R E I N C R E A S E D ? 9
TABLE 3
Changes in Medicare Advantage Penetration between 2009 and 2017 by Census Region
Region 2009 (%) 2017 (%) Percentage-point growth
New England 16.3 22.7 6.4 Middle Atlantic 28.7 36.5 7.8 East North Central 19.7 30.8 11.0 West North Central 19.0 30.9 11.9 South Atlantic 18.8 31.1 12.3 East South Central 17.1 30.9 13.8 West South Central 17.6 30.2 12.6 Mountain 30.0 34.3 4.3 Pacific 33.2 38.5 5.3
Total 23.3 33.5 10.2
Source: 2009 and 2017 Centers for Medicare & Medicaid Services Medicare Advantage penetration files.
Note: Table A.1 lists the states in each region.
In addition to variation in overall MA growth, we also found regional variation in growth by plan
types (table 4). PPO plans, employer plans, and SNPs fueled growth in the South Atlantic, but HMO
plans in the region grew slower than average. East South Central had the highest growth in PPO plans
nationally, from 2.8 percent of Medicare beneficiaries in 2009 to 9.2 percent in 2017. In contrast, in the
East North Central region, employer plans grew substantially, from enrolling 5.4 percent of Medicare
beneficiaries in 2009 to 9.7 percent in 2017. This region generally includes the “rust belt” states, and
growth in employer plans may partially reflect large employers’ attempts to reduce the costs of their
retirement packages.10 For example, table A.2 shows that 16.6 percent of all Medicare beneficiaries in
Michigan had an employer plan in 2017, compared with a national average of 6.5 percent.
The West North Central region, in which MA penetration grew 11.9 percentage points between
2009 and 2017, is unique. Most of the growth in this region occurred in cost plans, which grew from 2.6
percent of Medicare beneficiaries in 2009 to 10.5 percent in 2017 (table 4). Cost plans are not
technically part of the MA program, making this region sometimes appear to have low MA penetration if
these plans are excluded from analyses, despite high overall private plan penetration. Cost plan growth
is prominent in Minnesota and South Dakota, which had 36.6 percent and 15.4 percent of their
Medicare populations enrolled in a cost plan in 2017, respectively, far greater than the national average
of 1.0 percent (table A.2).

W H Y D I D M A E N R O L L M E N T G R O W A S P A Y M E N T P R E S S U R E I N C R E A S E D ? 1 0
TABLE 4
Medicare Advantage Penetration for Selected Plan Types by Region, 2009 and 2017
Overall HMO PPO Cost SNP EGHP
Region 2009
(%) 2017
(%)
Percentage- point change
2009 (%)
2017 (%)
2009 (%)
2017 (%)
2009 (%)
2017 (%)
2009 (%)
2017 (%)
2009 (%)
2017 (%)
New England
16.3 22.7 6.4 9.6 13.9 0.4 2.8 0.0 0.0 1.6 2.6 3.1 3.1
Middle Atlantic
28.7 36.5 7.8 14.3 15.6 2.7 6.6 0.3 0.0 3.2 5.2 6.8 8.6
East North Central
19.7 30.8 11.0 5.4 11.8 2.1 7.3 0.7 0.6 0.6 1.0 5.4 9.7
West North Central
19.0 30.9 11.9 5.2 9.9 2.1 4.7 2.6 10.5 1.7 1.8 2.4 3.6
South Atlantic
18.8 31.1 12.3 8.1 12.4 2.0 8.0 0.4 0.4 2.2 4.8 1.9 5.2
East South Central
17.1 30.9 13.8 6.2 10.9 2.8 9.2 0.2 0.0 2.5 4.4 2.0 6.3
West South Central
17.6 30.2 12.6 9.1 14.8 1.4 5.4 0.6 0.5 2.2 4.1 1.6 4.7
Mountain 30.0 34.3 4.3 15.3 21.9 2.8 4.1 0.9 0.5 3.0 3.9 3.9 3.7
Pacific 33.2 38.5 5.3 16.5 24.7 2.4 2.4 0.6 0.0 3.7 3.2 7.9 8.1
US average
23.3 33.5 10.2 10.1 15.3 2.1 5.9 0.6 1.0 2.3 3.6 4.2 6.5
Source: 2009 and 2017 Centers for Medicare & Medicaid Services enrollment files.
Notes: HMO = health maintenance organization. PPO = preferred provider organization. SNP = special needs plan. EGHP = employer group health plan.

1 1 W H Y D I D M A E N R O L L M E N T G R O W A S P A Y M E N T P R E S S U R E I N C R E A S E D ?
Between 2009 and 2017, MA penetration growth varied widely across states (figure 3). MA
penetration grew by 10 percentage points or more in 21 states, many of which were in the Midwest and
South. Penetration grew only modestly, by less than 5 percentage points, in 13 states, largely
concentrated in the West. Finally, penetration fell in only two states, Alaska and Wyoming, between
2009 and 2017.
FIGURE 3
Change in Medicare Advantage Penetration by State, 2009–17
Source: 2009 and 2017 Centers for Medicare & Medicaid Services Medicare Advantage penetration files.
Note: For point estimates, see table A.2.
Plans selected by MA enrollees also varied across states (table A.2). For example, as noted above,
Minnesota had the highest MA penetration in 2017 (57.0 percent), driven by enrollment in cost plans,
which accounted for 36.6 percent of all Medicare beneficiaries in Minnesota, far above the national
average of 1.0 percent. Hawaii had the second-highest MA penetration in 2017 (45.5 percent) and the
highest share of Medicare beneficiaries enrolled in a PPO (17.4 percent, compared with a national
average of 5.9 percent). Rhode Island also had high MA penetration in 2017 (42.5 percent), and the
Change in Medicare Advantage Penetration

1 2 W H Y D I D M A E N R O L L M E N T G R O W A S P A Y M E N T P R E S S U R E I N C R E A S E D ?
highest share of Medicare beneficiaries enrolled in an HMO (31.7 percent, compared with a national
average of 15.3 percent). Arizona had above average MA penetration (38.5 percent) and the highest
share of Medicare beneficiaries enrolled in SNP nationally in 2017 (8.2 percent, compared with a
national average of 3.6 percent). Finally, Michigan had above average MA penetration (36.4 percent)
and the highest share of Medicare beneficiaries enrolled in employer plans in the country (16.6 percent
compared with a national average of 6.5 percent), perhaps reflecting the high prevalence of union
retirees in the state.
What Explains Differences in MA Enrollment Growth across Counties?
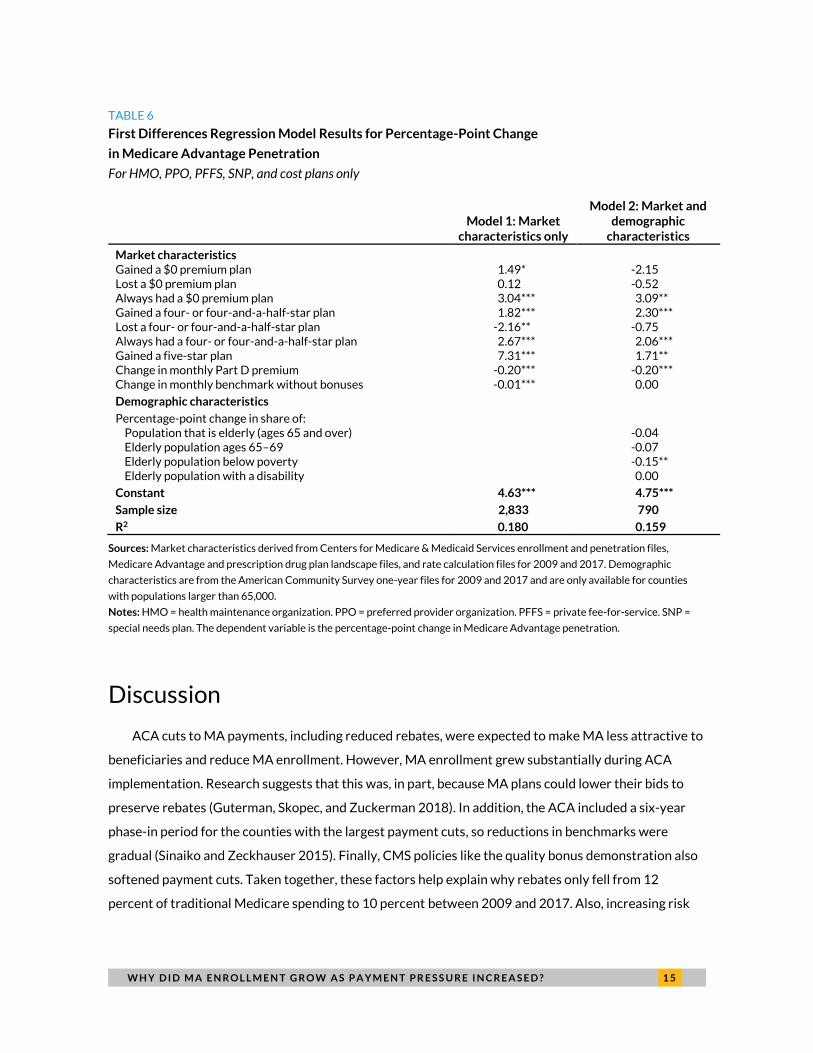
Turning to the county-level analysis, as shown in tables 5 and 6, Model 1 explored how changes in MA
market characteristics affected MA penetration for 2,833 counties. Access to a $0 premium plan was
significantly associated of MA penetration growth, explaining 22.6 percent of the average MA
penetration change (derived from tables 5 and 6).11 Counties that always had access to a $0 premium
plan saw MA penetration increases 3.04 percentage points larger than those counties that never had
access to a $0 premium plan, and counties gaining access to a $0 premium plan saw MA penetration
increases 1.49 percentage points larger than those counties that never had access to a $0 premium plan
(table 6). Star ratings were also significantly associated with MA penetration growth, explaining 18.4
percent of the average MA penetration change (derived from tables 5 and 6).12 Counties gaining a five-
star plan had MA penetration growth 7.31 percentage points larger than those counties that never had
a five-star plan.13 Gaining or maintaining access to a four- or four-and-a-half-star plan was also
associated with an increase in MA penetration relative to never having access to a four- or four-and-a-
half-star plan (1.8 and 2.7 percentage points, respectively). Counterintuitively, increases in Part D
premiums and monthly benchmarks were associated with slightly lower MA penetration growth (a -0.2
percentage-point per dollar increase in monthly Part D premiums and -0.01 percentage-point per dollar
increase in monthly benchmarks). This may suggest that counties where MA is more popular largely saw
benchmark decreases, and that popular MA markets may also have more Part D competition and
therefore lower Part D premium growth.
Model 2 incorporated demographic characteristics and included 790 large counties. The counties in
this model had a 7.45 percentage point increase in MA penetration over the 2009 to 2017 period on
average (table 5). Among demographic characteristics, only the change in the share of the elderly below
poverty was significantly associated with MA penetration and had a negative coefficient (-.15
percentage points), suggesting that poverty rate growth was associated with lower MA penetration
growth. Though poverty fell an average of 0.2 percentage points between 2009 and 2017 in the 790

W H Y D I D M A E N R O L L M E N T G R O W A S P A Y M E N T P R E S S U R E I N C R E A S E D ? 1 3
counties included in Model 2 (table 5), poverty rates grew in 380 of the 790 counties included in our
sample, and these counties tended to have slower MA penetration growth (data not shown).
Model 2, based on fewer counties, showed similar results for MA market characteristics compared
to Model 1, though the magnitude of coefficients varied for some measures. For example, gaining access
to a four- or four-and-a half star plan was associated with a 2.3 percentage-point increase in
penetration in Model 2 relative to never having access to a four- or four-and-a-half-star plan, compared
with 1.8 percentage points in Model 1. The largest coefficient change was for gaining access to a five-
star plan, which was associated with a 1.7 percentage-point increase in penetration in Model 2 relative
to never having a five-star plan, but a 7.3 percentage-point increase in penetration in Model 1. These
differences in coefficients across our models may reflect that the 790 counties included in Model 2
were more likely to gain or maintain access to four- or four-and-a-half-star plans than the 2,833
counties included in Model 1 (86 percent of counties in Model 2, compared to 64 percent in Model 1)
(Table 5), making the introduction of five-star plans less important.
Finally, in both models, the constant was large and significant, so much of the change in MA
penetration was unexplained by the variables included in the models. For example, in Model 1, the
constant was 4.63, meaning 4.63 percentage points of the average 7.18 percentage point change in MA
penetration was unexplained by the model (64.5 percent). Similarly, in Model 2, the constant was 4.75,
meaning 4.75 percentage points of the 7.45 percentage point average change in MA penetration in
those 790 counties was not explained by the model (63.8 percent).

1 4 W H Y D I D M A E N R O L L M E N T G R O W A S P A Y M E N T P R E S S U R E I N C R E A S E D ?
TABLE 5
Average Changes in MA Market Characteristics and Demographic Characteristics across Counties,
2009 to 2017
For HMO, PPO, PFFS, SNP, and cost plans only
Model 1: Market characteristics only
Model 2: Market and demographic
characteristics
Average percentage point change in MA penetration 7.18 7.45
Market characteristics Share of counties gaining a $0 premium plan 0.04 0.04 Share of counties losing a $0 premium plan 0.40 0.23 Share of counties that always had a $0 premium plan 0.51 0.71 Share of counties that never had a $0 premium plan (reference group for regression analyses)
0.05 0.02
Share of counties gaining a four- or four-and-a-half-star plan 0.46 0.56 Share of counties losing a four- or four-and-a-half-star plan 0.02 0.02 Share of counties that always had a four- or four-and-a-half-star plan
0.18 0.30
Share of counties that never had a four- or four-and-a-half-star plan (reference group for regression analyses)
0.34 0.12
Share of counties gaining a five-star plan 0.06 0.08 Share of counties that never had a five-star plan (reference group for regression analyses
0.94 0.92
Change in monthly Part D premium $3.21 $5.16 Change in monthly benchmark without bonuses $26.76 -$4.65
Demographic characteristics
Percentage-point change in share of:
Population that is elderly (ages 65 and over) 3.00 Elderly population ages 65–69 3.13 Elderly population below poverty -0.19 Elderly population with a disability -2.48
Sources: Market characteristics derived from Centers for Medicare & Medicaid Services enrollment and penetration files,
Medicare Advantage and prescription drug plan landscape files, and rate calculation files for 2009 and 2017. Demographic
characteristics are from the American Community Survey one-year files for 2009 and 2017 and are only available for counties
with populations larger than 65,000.
Notes: HMO = health maintenance organization. PPO = preferred provider organization. PFFS = private fee-for-service. SNP =
special needs plan.
W H Y D I D M A E N R O L L M E N T G R O W A S P A Y M E N T P R E S S U R E I N C R E A S E D ? 1 5
TABLE 6
First Differences Regression Model Results for Percentage-Point Change
in Medicare Advantage Penetration
For HMO, PPO, PFFS, SNP, and cost plans only
Model 1: Market characteristics only
Model 2: Market and demographic
characteristics
Market characteristics Gained a $0 premium plan 1.49* -2.15 Lost a $0 premium plan 0.12 -0.52 Always had a $0 premium plan 3.04*** 3.09** Gained a four- or four-and-a-half-star plan 1.82*** 2.30*** Lost a four- or four-and-a-half-star plan -2.16** -0.75 Always had a four- or four-and-a-half-star plan 2.67*** 2.06*** Gained a five-star plan 7.31*** 1.71** Change in monthly Part D premium -0.20*** -0.20*** Change in monthly benchmark without bonuses -0.01*** 0.00
Demographic characteristics
Percentage-point change in share of:
Population that is elderly (ages 65 and over) -0.04 Elderly population ages 65–69 -0.07 Elderly population below poverty -0.15** Elderly population with a disability 0.00
Constant 4.63*** 4.75***
Sample size 2,833 790
R2 0.180 0.159
Sources: Market characteristics derived from Centers for Medicare & Medicaid Services enrollment and penetration files,
Medicare Advantage and prescription drug plan landscape files, and rate calculation files for 2009 and 2017. Demographic
characteristics are from the American Community Survey one-year files for 2009 and 2017 and are only available for counties
with populations larger than 65,000.
Notes: HMO = health maintenance organization. PPO = preferred provider organization. PFFS = private fee-for-service. SNP =
special needs plan. The dependent variable is the percentage-point change in Medicare Advantage penetration.
Discussion
ACA cuts to MA payments, including reduced rebates, were expected to make MA less attractive to
beneficiaries and reduce MA enrollment. However, MA enrollment grew substantially during ACA
implementation. Research suggests that this was, in part, because MA plans could lower their bids to
preserve rebates (Guterman, Skopec, and Zuckerman 2018). In addition, the ACA included a six-year
phase-in period for the counties with the largest payment cuts, so reductions in benchmarks were
gradual (Sinaiko and Zeckhauser 2015). Finally, CMS policies like the quality bonus demonstration also
softened payment cuts. Taken together, these factors help explain why rebates only fell from 12
percent of traditional Medicare spending to 10 percent between 2009 and 2017. Also, increasing risk

1 6 W H Y D I D M A E N R O L L M E N T G R O W A S P A Y M E N T P R E S S U R E I N C R E A S E D ?
adjustment payments through more complete diagnosis coding in MA plans may have offset payment
cuts, helping preserve revenue (Guterman, Skopec, and Zuckerman 2018).
Though these explanations partly explain MA growth, they suggest stable or modest growth in MA
enrollment, not the doubling in MA enrollment that occurred. Our descriptive analyses showed that MA
growth was not evenly distributed across regions or by plan types, suggesting no single, national
explanation for MA enrollment growth. For example, evidence suggests that sponsoring an MA plan for
retirees saves employers money relative to other retiree health coverage options.14 Employer plans
were associated with one-fifth of MA growth between 2009 and 2017, suggesting that employer
choice, not just beneficiary choice, is an important factor in MA growth.
Our multivariate analyses found that county-level MA penetration growth was related to access to
$0 premium and four- or five-star plans, implying that beneficiaries choose MA more frequently where
MA plans are more generous or higher quality. MA plans with a four-star rating or higher have higher
benchmarks to bid against and a higher rebate percentage to pass on to beneficiaries through extra
benefits, and five-star plans can offer year-round open enrollment. Research shows that $0 premiums
and extra benefits feature prominently in MA plan advertising (Cai et al. 2008), suggesting that plans
see generosity as a major selling point. Though not a causal analysis, our findings imply that MA is
particularly popular where it offers a benefit package that compares favorably with the premiums and
benefits of traditional Medicare with supplemental coverage. We found no relationship between MA
penetration growth and the age distribution of beneficiaries, making it unlikely that growth is driven
primarily by the influx of younger beneficiaries, who may be more comfortable with managed care, as
suggested in prior studies (Sinaiko and Zuckhauser 2015).
Our multivariate models only explained about a third of the increase in MA penetration, however,
suggesting other factors may contribute to MA’s increasing popularity but are difficult to quantify. As
MA grows, more beneficiaries have friends or family enrolled in MA, and most MA enrollees report
positive experiences with the program, suggesting that word of mouth may drive some enrollment.15
Similarly, some health systems now sponsor MA plans and may encourage seniors who use those
providers to enroll (Jacobson et al. 2014). The MA benefit structure also includes an out-of-pocket
maximum and nearly always includes integrated Part D coverage, making the benefit package simpler to
manage than a combination of traditional Medicare, Part D, and supplemental coverage. Also, though
many MediGap plans provide more generous cost-sharing protection than MA plans,16 the coverage is
generally far more expensive to purchase than an MA plan.17

W H Y D I D M A E N R O L L M E N T G R O W A S P A Y M E N T P R E S S U R E I N C R E A S E D ? 1 7
Finally, the MA market is profitable for insurers,18 and insurers advertise directly to seniors to
attract enrollees. MA plans also work with insurance brokers to sell both MA and MediGap plans.
Qualitative research has shown that brokers are an important source of information for seniors when
choosing a plan (Jacobson et al. 2014), but it is currently unclear whether brokers have financial or
other incentives to recommend MA enrollment over traditional Medicare with supplemental coverage.

1 8 A P P E N D I X
Appendix TABLE A.1
States in Each Census Region
Region States
New England Connecticut, Maine, Massachusetts, New Hampshire, Rhode Island, Vermont
Middle Atlantic New Jersey, New York, Pennsylvania
East North Central Illinois, Indiana, Michigan, Ohio, Wisconsin
West North Central Iowa, Kansas, Minnesota, Missouri, Nebraska, North Dakota, South Dakota
South Atlantic Delaware, District of Columbia, Florida, Georgia, Maryland, North Carolina, South Carolina, Virginia, West Virginia
East South Central Alabama, Kentucky, Mississippi, Tennessee
West South Central Arkansas, Louisiana, Oklahoma, Texas
Mountain Arizona, Colorado, Idaho, Montana, Nevada, New Mexico, Utah, Wyoming
Pacific Alaska, California, Hawaii, Oregon, Washington

A P P E N D I X 1 9
TABLE A.2
Medicare Advantage Penetration for Selected Plan Types by State, 2009 and 2017
Overall HMO PPO Cost SNP EGHP
State 2009
(%) 2017
(%)
Percentage- point
change 2009
(%) 2017
(%) 2009
(%) 2017
(%) 2009
(%) 2017
(%) 2009
(%) 2017
(%) 2009
(%) 2017
(%)
Alabama 21.3 36.3 15.0 7.8 10.9 5.4 9.2 0.1 0.0 3.2 5.1 2.2 10.4 Alaska 1.1 1.1 0.0 0.0 0.0 0.0 0.0 0.0 0.0 0.0 0.0 0.2 1.1 Arizona 36.9 38.5 1.7 20.8 24.7 2.1 1.4 0.0 0.0 7.1 8.2 4.6 4.1 Arkansas 13.5 21.9 8.4 1.7 7.8 1.1 4.7 0.1 0.0 1.5 4.6 0.5 1.3 California 34.8 41.8 7.0 19.0 27.2 0.8 0.1 0.2 0.0 4.5 3.1 8.9 9.2 Colorado 33.4 37.3 3.8 15.7 24.6 0.5 1.6 3.7 2.2 2.1 1.6 6.8 6.0 Connecticut 16.2 28.0 11.8 11.4 20.4 0.2 1.1 0.0 0.0 1.7 3.8 2.6 2.5 Delaware 4.7 11.1 6.4 0.5 4.4 0.4 1.3 0.0 0.0 1.0 1.2 1.0 4.2 District of Columbia 10.6 15.4 4.8 1.0 1.2 0.1 0.4 2.6 3.6 2.2 6.1 3.8 4.0 Florida 28.7 42.5 13.8 19.1 21.7 3.4 9.4 0.1 0.0 3.5 7.9 1.6 3.4 Georgia 14.8 34.9 20.1 1.7 8.1 1.9 10.2 0.0 0.0 2.3 6.6 1.6 9.1 Hawaii 38.4 45.5 7.2 5.0 8.7 4.1 17.4 16.6 0.0 1.3 8.2 9.6 10.9 Idaho 27.3 31.7 4.4 9.0 17.6 3.4 11.7 0.6 0.0 0.8 0.7 1.5 1.1 Illinois 9.9 24.1 14.3 3.6 8.4 1.6 2.8 0.4 0.1 0.6 0.7 1.2 9.1 Indiana 14.7 26.6 11.8 0.5 6.8 3.7 13.0 0.8 0.0 0.2 0.5 1.8 5.5 Iowa 12.6 18.0 5.4 1.7 5.6 1.2 6.7 1.4 1.6 0.4 0.0 1.1 3.5 Kansas 10.4 15.7 5.3 2.3 5.6 2.7 6.2 0.5 0.0 0.4 0.2 0.7 2.1 Kentucky 15.0 28.7 13.7 1.3 5.2 3.8 10.1 0.7 0.0 1.3 1.1 3.8 11.1 Louisiana 22.3 33.2 10.9 15.7 22.1 0.4 3.0 0.0 0.0 0.7 4.7 1.5 2.9 Maine 9.6 27.8 18.2 2.0 15.4 0.5 5.1 0.0 0.0 0.7 1.2 3.6 4.7 Maryland 7.5 11.1 3.6 1.6 1.9 0.4 0.9 1.3 2.9 1.4 1.4 1.8 3.9 Massachusetts 19.1 22.5 3.4 10.4 10.4 0.6 3.7 0.0 0.0 1.9 3.4 3.6 3.3 Michigan 24.3 36.4 12.0 3.2 8.7 0.7 7.7 0.0 0.0 0.2 0.7 11.4 16.6 Minnesota 36.6 57.0 20.4 7.0 8.0 2.0 3.1 9.1 36.6 4.9 4.1 4.6 4.7 Mississippi 9.2 16.7 7.4 1.3 5.7 0.9 6.6 0.0 0.0 1.1 2.8 0.2 0.8 Missouri 19.8 31.8 12.0 8.8 18.5 3.0 5.7 0.1 0.0 1.3 2.3 3.0 4.6 Montana 16.8 20.6 3.8 0.0 1.6 1.7 16.9 0.0 0.0 0.0 0.1 0.4 0.8 Nebraska 11.6 13.1 1.5 3.2 7.6 0.7 1.5 0.7 0.0 0.2 0.0 1.5 1.9 Nevada 30.8 35.4 4.6 25.1 27.7 1.6 3.0 0.1 0.0 0.1 2.2 2.1 2.2 New Hampshire 6.0 10.3 4.3 0.0 5.4 0.0 0.9 0.0 0.0 0.0 0.1 1.5 2.8 New Jersey 11.9 21.3 9.4 7.8 8.5 0.6 3.4 0.0 0.0 0.4 1.6 2.8 7.7 New Mexico 24.3 33.6 9.3 13.8 15.9 2.7 6.5 0.1 0.0 0.7 4.6 3.0 5.7 New York 28.7 38.7 10.0 14.5 16.3 2.4 6.8 0.3 0.0 3.5 7.2 6.1 7.2

2 0 A P P E N D I X
Overall HMO PPO Cost SNP EGHP
State 2009
(%) 2017
(%)
Percentage- point
change 2009
(%) 2017
(%) 2009
(%) 2017
(%) 2009
(%) 2017
(%) 2009
(%) 2017
(%) 2009
(%) 2017
(%)
North Carolina 17.3 32.0 14.7 4.3 12.0 0.9 9.8 0.0 0.0 2.1 1.3 1.6 8.2 North Dakota 7.7 18.2 10.5 0.0 0.0 0.0 1.2 1.0 15.7 0.0 0.0 0.2 0.3 Ohio 26.8 39.0 12.2 11.0 17.9 2.4 7.0 0.9 0.0 0.8 1.0 8.0 9.1 Oklahoma 14.4 18.1 3.7 8.2 10.6 1.4 4.4 0.0 0.0 0.2 0.0 6.7 2.1 Oregon 41.7 44.8 3.1 13.3 21.1 13.3 13.2 0.1 0.0 3.2 3.4 7.0 6.7 Pennsylvania 38.2 41.1 2.9 17.8 18.8 4.4 8.1 0.3 0.0 4.5 4.8 10.1 11.0 Rhode Island 36.3 42.5 6.2 27.1 31.7 0.4 0.7 0.0 0.0 3.8 1.2 3.7 3.1 South Carolina 14.7 25.6 10.9 0.8 6.0 1.5 8.9 0.0 0.0 2.3 6.9 0.6 2.2 South Dakota 7.2 21.1 13.9 0.0 0.1 0.7 4.0 0.0 15.4 0.0 0.0 0.2 0.5 Tennessee 22.1 36.7 14.6 10.9 17.2 0.9 9.8 0.1 0.0 3.5 6.9 1.3 2.3 Texas 18.2 34.9 16.7 9.1 15.1 1.7 6.3 0.9 0.7 3.1 4.7 0.7 6.1 Utah 30.6 35.6 5.0 5.2 26.5 13.1 5.1 0.6 0.0 1.9 2.2 4.0 1.4 Vermont 3.7 8.9 5.2 0.0 1.5 0.2 4.4 0.0 0.0 0.0 0.0 0.8 1.4 Virginia 13.7 19.6 5.9 0.7 6.6 1.0 4.4 0.9 1.0 0.1 0.4 1.2 3.0 Washington 23.8 30.6 6.9 9.9 20.7 2.8 3.3 0.0 0.0 0.8 2.5 4.0 3.9 West Virginia 23.1 29.6 6.6 1.2 2.2 2.6 8.1 3.3 0.0 0.0 0.2 10.3 13.5 Wisconsin 26.8 39.8 13.1 6.6 17.4 2.7 9.5 1.8 4.7 1.2 2.6 2.0 4.3 Wyoming 5.8 3.8 -2.0 0.1 0.2 0.0 0.0 1.0 0.0 0.0 0.0 0.9 1.4
United States 23.3 33.5 10.2 10.1 15.3 2.1 5.9 0.6 1.0 2.3 3.6 4.2 6.5
Source: 2009 and 2017 Centers for Medicare & Medicaid Services enrollment files.
Notes: HMO = health maintenance organization. PPO = preferred provider organization. SNP = special needs plan. EGHP = employer group health plan.

N O T E S 2 1
Notes1 “Medicare and You: The Official US Government Medicare Handbook,” the Centers for Medicare & Medicaid
Services, accessed February 20, 2019, https://www.medicare.gov/pubs/pdf/10050-Medicare-and-You.pdf.
Medicare beneficiaries can also choose a private Medicare cost plan, which is administered by a private
insurance company but has no enrollment and disenrollment restrictions, is available to beneficiaries who only
have Part B coverage, and allows enrollees to retain traditional Medicare coverage for out-of-network benefits.
2 “Medicare and You: The Official US Government Medicare Handbook,” the Centers for Medicare & Medicaid
Services.
3 “Comparison of Projected Enrollment in Medicare Advantage Plans and Subsidies for Extra Benefits Not Covered
by Medicare under Current Law and under Reconciliation Legislation Combined with H.R. 3590 As Passed by the
Senate,” Congressional Budget Office, accessed February 20, 2019,
https://www.cbo.gov/sites/default/files/111th-congress-2009-2010/costestimate/macomparisons.pdf.
4 “Medicare – Congressional Budget Office’s January 2017 Baseline.” Congressional Budget Office, accessed
March 20, 2019, https://www.cbo.gov/sites/default/files/recurringdata/51302-2017-01-medicare.pdf.
5 For more on MA penetration and plan- and county-level enrollment, see “Medicare Advantage/Part D Contract
and Enrollment Data,” the Centers for Medicare & Medicaid Services, accessed February 20, 2019,
https://www.cms.gov/Research-Statistics-Data-and-Systems/Statistics-Trends-and-
Reports/MCRAdvPartDEnrolData/index.html. For more on MA benchmarks, see “Ratebooks and Supporting
Data,” the Centers for Medicare & Medicaid Services, accessed February 20, 2019,
https://www.cms.gov/Medicare/Health-Plans/MedicareAdvtgSpecRateStats/Ratebooks-and-Supporting-
Data.html. For more on contract-level data on star ratings, see “Part C and D Performance Data,” the Centers for
Medicare & Medicaid Services, accessed November 27, 2018, https://www.cms.gov/Medicare/Prescription-
Drug-Coverage/PrescriptionDrugCovGenIn/PerformanceData.html. For more on both MA and prescription
drug plan premiums, see “2018 Medicare Advantage and Part D Prescription Drug Program Landscape,” the
Centers for Medicare & Medicaid Services, accessed February 20, 2019, https://www.cms.gov/newsroom/fact-
sheets/2018-medicare-advantage-and-part-d-prescription-drug-program-landscape.
6 “American Community Survey,” United States Census Bureau, accessed February 20, 2019,
https://factfinder.census.gov/faces/nav/jsf/pages/programs.xhtml?program=acs.
7 For example, see “Medicare Enrollment Dashboard,” the Centers for Medicare & Medicaid Services, accessed
March 4, 2019, https://www.cms.gov/Research-Statistics-Data-and-Systems/Statistics-Trends-and-
Reports/Dashboard/Medicare-Enrollment/Enrollment%20Dashboard.html.
8 SNPs and employer plans can be either PPO or HMO. To avoid doublecounting, we present SNPs and employer
plans separately.
9 Table A.1 lists states included in each region.
10 Large employers are more likely to offer MA plans than small employers (Claxton et al. 2018). And MA plans save
employers money; see “The Future of Medicare Advantage Employer Group Waiver Plan Market,” Aetna,
accessed February 20, 2019, https://news.aetna.com/wp-content/uploads/2018/02/20170129-
Aetna_EGWP_FINAL.pdf.
11 This estimate is calculated by multiplying the regression coefficients in table 6 for gaining or maintaining a $0
premium plan by the respective share of counties in each of those groups from table 5, then adding the two
estimates together. This gives an estimate of the percentage point change in MA penetration explained by

2 2 N O T E S
having access to a $0 premium plan. We then divided by the average percentage point change in MA penetration
to estimate the share of MA penetration change explained by access to $0 premium plans.
12 See methods described in note 11.
13 No counties had five-star plans in 2009.
14 “The Future of Medicare Advantage Employer Group Waiver Plan Market,” Aetna.
15 “2015 Medicare Current Beneficiary Survey Chartbook and Slides,” the Centers for Medicare & Medicaid
Services, accessed March 4, 2019, https://www.cms.gov/Research-Statistics-Data-and-
Systems/Research/MCBS/Data-Tables-Items/2015Chartbook.html. Also, the Kaiser Family Foundation notes
that beneficiaries account for friend recommendations when selecting plans (Jacobson et al. 2014).
16 For example, the most popular MediGap plans are Plans C and F, which both cover Part A deductibles;
coinsurance; hospital costs in full, including hospital stays up to 365 days beyond that covered by Medicare
benefits; and Part B coinsurance, copayments, and deductibles in full. See Tamera Jackson, “Medicare
Supplement Plan F,” Medicare.com, September 16, 2018, https://medicare.com/medicare-
supplement/medicare-supplement-plan-f/. MA plans, in contrast, often have coinsurance and copays for
Medicare-covered services; see Danielle Kunkle Roberts, “The Hidden Costs in Medicare Advantage Plans,”
Forbes, July 25, 2017, https://www.forbes.com/sites/forbesfinancecouncil/2017/07/25/the-hidden-costs-in-
medicare-advantage-plans/#c375550429af.
17 Danielle Kunkle Roberts, “The Hidden Costs in Medicare Advantage Plans.”
18 John Gorman, “Takeaways from the Gorman Health Group 2018 Client Forum,” Gorman Health Group (blog),
May 2, 2018, https://www.gormanhealthgroup.com/blog/takeaways-from-the-gorman-health-group-2018-
client-forum/.

R E F E R E N C E S 2 3
References Berenson, Robert A. 2004. “Medicare Disadvantaged and the Search for the Elusive ‘Level Playing Field.’” Health
Affairs 23(1): w572-w585.
Berenson, Robert A., and Bryan E. Dowd. 2009. “Medicare Advantage Plans at a Crossroads—Yet Again.” Health
Affairs 28 (1): w29–w40.
Better Medicare Alliance. 2017. “Medicare Advantage Special Needs Plans.” Washington, DC: Better Medicare
Alliance.
Biles, Brian, Giselle Casillas, Grace Arnold, and Stuart Guterman. 2012. “Realizing Health Reform’s Potential.”
Washington, DC: The Commonwealth Fund.
Cai, Xiaomei, Gary Kreps, Jim McAuley, Xiaoquan Zhao, Michelle Kitchman Strollo, Tricia Neuman, et al. 2008.
“Pitching Private Plans: An Analysis of Medicare Advantage and Prescription Drug Plan Advertising.” San
Francisco: Henry J. Kaiser Family Foundation.
CBO (Congressional Budget Office). 2018. Exploring the Growth of Medicaid Managed Care. Washington, DC:
Congressional Budget Office.
Claxton, Gary, Matthew Rae, Michelle Long, Anthony Damico, and Heidi Whitmore. 2018. Employer Health Benefits:
2018 Annual Survey. San Francisco: Henry J. Kaiser Family Foundation.
Foster, Richard S. 2010. “Estimated Financial Effects of the Patient Protection and Affordable Care Act, As
Amended.” Baltimore: the Centers for Medicare & Medicaid Services.
Guterman, Stuart, Laura Skopec, and Stephen Zuckerman. 2018. “Do Medicare Advantage Plans Respond to
Payment Changes? A Look at the Data from 2009 to 2014.” Washington, DC: The Commonwealth Fund.
Hayes, Tara O’Neill. 2015. “Primer: The Medicare Advantage Star Rating System.” Washington, DC: American
Action Forum.
Jacobson, Gretchen, Christina Swoope, Michael Perry, and Mary C. Slosar. 2014. How Are Seniors Choosing and
Changing Health Insurance Plans? Findings from Focus Groups with Medicare Beneficiaries. San Francisco: Henry J.
Kaiser Family Foundation.
Kronick, Richard. 2017. “Projected Coding Intensity in Medicare Advantage Could Increase Medicare Spending by
$200 Billion over Ten Years.” Health Affairs (36) 2: 808–19.
L&M Policy Research. 2016. Evaluation of the Medicare Quality Bonus Payment Demonstration. Report prepared for
the Centers for Medicare & Medicaid Services. Washington, DC: L&M Policy Research.
MedPAC (Medicare Payment Advisory Committee). 2009a. Report to Congress: Improving Incentives in the Medicare
Program. Washington, DC: Medicare Payment Advisory Committee.
———. 2009b. “Chapter 3: The Medicare Advantage Program.” In Report to the Congress: Medicare Payment Policy,
251–69. Washington, DC: Medicare Payment Advisory Committee.
———. 2017. “Chapter 13: Status Report on the Medicare Advantage Program.” In Report to the Congress: Medicare
Payment Policy, 345–79. Washington, DC: Medicare Payment Advisory Committee.
———. 2018a. Health Care Spending and the Medicare Program: A Data Book. Washington, DC: Medicare Payment
Advisory Committee.
———. 2018b. Report to the Congress: Medicare Payment Policy. Washington, DC: Medicare Payment Advisory
Committee.

2 4 R E F E R E N C E S
MedPAC and MACPAC (Medicare Payment Advisory Committee and Medicaid and CHIP Payment and Access
Commission). 2018. Data Book: Beneficiaries Dually Eligible for Medicare and Medicaid. Washington, DC: Medicare
Payment Advisory Committee and Medicaid CHIP Payment and Access.
Nicholas, Lauren Hersch. 2014. “Will Medicare Advantage Benchmark Reforms Impact Plan Rebates and
Enrollment?” American Journal of Managed Care 20 (11): 917–24.
Patel, Yash M., and Stuart Guterman. 2017. “The Evolution of Private Plans in Medicare.” Washington, DC: The
Commonwealth Fund.
Pelech, Daria. 2017. “Dropped out or Pushed out? Insurance Market Exit and Provider Market Power in Medicare
Advantage.” Journal of Health Economics January (51): 98–112.
Sinaiko, Anna D., and Richard Zeckhauser. 2015. “Medicare Advantage: What Explains Its Robust Health?”
American Journal of Managed Care 21 (11): 804–6.
Skopec, Laura, Stephen Zuckerman, and Joshua Aarons. Forthcoming. “Did Medicare Advantage Payment Cuts
Affect Beneficiary Access and Affordability?” Washington, DC: Urban Institute.
Song, Zirui, and Daria M. Pelech. 2018. “Payments to Medicare Advantage Plans and Plan Generosity before and
after the Affordable Care Act.” Paper presented at Seventh Conference of the American Society for Health
Economists, Washington, DC, June 10–13.
Zarabozo, Carlos, and Scott Harrison. 2009. “Payment Policy and the Growth of Medicare Advantage.” Health
Affairs (28) 1: w55–w67.

A B O U T T H E A U T H O R S 2 5
About the Authors Laura Skopec is a senior research associate in the Urban Institute’s Health Policy
Center, where her research focuses on health insurance coverage, health care access,
and health care affordability, with a particular focus on the effects of the Affordable
Care Act. Before joining Urban, she worked on Affordable Care Act implementation at
the Office of the Assistant Secretary for Planning and Evaluation in the US Department
of Health and Human Services, and on transparency in health insurance and health care
at the American Cancer Society Cancer Action Network.
Skopec holds a BS in biopsychology and cognitive science from the University of
Michigan and an MS in public policy and management from Carnegie Mellon
University.
Stephen Zuckerman is a senior fellow and vice president for health policy. He has
studied health economics and health policy for 30 years and is a national expert on
Medicare and Medicaid physician payment, including how payments affect enrollee
access to care and the volume of services they receive. He is currently examining how
payment and delivery system reforms can affect the availability of primary care
services and studying the implementation and impact of the Affordable Care Act.
Zuckerman has published extensively on many topics, including the determinants of
geographic differences in Medicare spending, Medicaid managed care, state coverage
expansions for adults, changes in Medicare benefit design that could protect the most
vulnerable beneficiaries, hospital rate setting, and the impact of undocumented
immigrants on the US health care system. Other issues he has worked on include
Medicaid financing arrangements used by states, crowd-out of private coverage by
SCHIP, the health care safety net, and survey approaches for measuring insurance
coverage. Zuckerman also codirected the development of the Geographic Practice
Cost Indices used in the Medicare physician fee schedule.
Before joining Urban, Zuckerman worked at the American Medical Association’s
Center for Health Policy Research. He received his PhD in economics from Columbia
University.

2 6 A B O U T T H E A U T H O R S
Eva Allen is a research associate in the Health Policy Center, where she studies
initiatives targeting vulnerable populations. She has been involved in several long-term
federal evaluations, assessing design, operation, and outcomes of innovative delivery
and payment system models aimed at improving care for Medicaid beneficiaries with
chronic conditions and pregnant women. Recent work includes a cross-center project
to identify promising models of collaboration between health care and housing
providers to better address health and psychosocial needs of low-income populations.
In an earlier project, Allen examined the state use of the Medicaid health home model
to serve people with opioid use disorder.
Before her current position, Allen worked as a project associate in the center. Allen
holds a BA in sociology and an MPP from George Mason University.
Joshua Aarons is a research assistant in the Health Policy Center. He received his BA in
economics from Carleton College, where he received distinction for his senior thesis,
which presented evidence and discussed repercussions of referee discrimination in
European club soccer.

ST A T E M E N T O F I N D E P E N D E N C E
The Urban Institute strives to meet the highest standards of integrity and quality in its research and analyses and in
the evidence-based policy recommendations offered by its researchers and experts. We believe that operating
consistent with the values of independence, rigor, and transparency is essential to maintaining those standards. As
an organization, the Urban Institute does not take positions on issues, but it does empower and support its experts
in sharing their own evidence-based views and policy recommendations that have been shaped by scholarship.
Funders do not determine our research findings or the insights and recommendations of our experts. Urban
scholars and experts are expected to be objective and follow the evidence wherever it may lead.

500 L’Enfant Plaza SW
Washington, DC 20024
www.urban.org