Embed Size (px)
Citation preview

[16:28 7/1/2014 RFS-hht077.tex] Page: 404 404–453
Why Did Holdings of Highly RatedSecuritization Tranches Differ So Muchacross Banks?
Isil ErelFisher College of Business, The Ohio State University
Taylor NadauldBrigham Young University
René M. StulzFisher College of Business, The Ohio State University, NBER, and ECGI
We provide estimates of holdings of highly rated securitization tranches of U.S. bank holdingcompanies before the credit crisis and evaluate hypotheses that have been advanced toexplain them. Whereas holdings exceeded Tier 1 capital for some large banks, they wereeconomically trivial for the typical bank. Banks with high holdings were not riskier beforethe crisis using conventional measures, but they performed poorly during the crisis. Wefind that holdings of highly rated tranches were correlated with a bank’s securitizationactivity. Theories unrelated to the securitization activity, such as “bad incentives” or “badrisk management,” are not supported in the data. (JEL G01, G21)
Holdings of highly rated tranches of securitizations held by U.S. banks were atthe heart of the financial crisis of 2007–2008. At least in the early phases of thecrisis, the bulk of the assets that were considered to have become toxic by manyobservers were these securities with subprime and alt-A mortgage collateral.Losses in value led banks to have low capital and forced them to raise morecapital, cut back on new loans, and engage in fire sales (see Brunnermeier2009). The most visible and controversial policy initiative of the U.S. Treasuryto deal with the crisis, the Troubled Asset Relief Program (TARP), started asan attempt to fund the purchase of these assets from banks.
We are grateful to John Sedunov for research assistance and to two anonymous referees. For useful comments, weare thankful to Viral Acharya, Andrew Ellul, Sam Hanson, David Hirshleifer, George Pennachi, Andrei Shleifer,Philip Strahan, Michael Weisbach, participants at the NBER Summer Institute and the Federal Bank of ChicagoAnnual Banking Conference, and seminar participants at Babson College, Duke University, the Federal ReserveBoard, the University of Alberta, the University of Arizona, and the University of Texas at Austin. We wouldlike to thank Andrew Ellul and Vijay Yerramilli for sharing their Risk Management Index (RMI) data with us.Send correspondence to Taylor Nadauld, Brigham Young University, office: 681 TNRB, Provo, UT 84602-3113,USA; telephone: (801) 422-6033. E-mail: [email protected].
© The Author 2013. Published by Oxford University Press on behalf of The Society for Financial Studies.All rights reserved. For Permissions, please e-mail: [email protected]:10.1093/rfs/hht077 Advance Access publication December 6, 2013
at Brigham
Young U
niversity on August 4, 2014
http://rfs.oxfordjournals.org/D
ownloaded from
[16:28 7/1/2014 RFS-hht077.tex] Page: 405 404–453
Holdings of Highly Rated Securitization Tranches
Many observers thought that banks used securitization to move assets fromtheir balance sheets and were surprised that some banks held large amountsof highly rated tranches.1 Though a vigorous debate has been taking place onwhy banks held these assets, to our knowledge, there are no rigorous estimatesof the holdings of these assets across banks before the crisis, and there is nosystematic investigation of the various theories that have been advanced toexplain these holdings. In this paper, we estimate holdings of highly ratedtranches of securitizations by U.S. bank holding companies and investigatewhich of the various theories proposed to explain these holdings are consistentwith the empirical evidence. We find that there was substantial cross-sectionalvariation in such holdings across banks and that this variation is explained bythe securitization activities of banks.
Highly rated securities include AAA, AA, and A tranches of mortgage-backed securities (MBSs), collateralized debt obligations (CDOs), and otherasset-backed securities (ABSs). During the financial crisis, banks made varioustypes of losses; for example, they made losses on nonprime mortgages andhighly levered loans held on their books. However, early on, the largest bankwritedowns came from mark-to-market losses on highly rated securitizationtranches. For instance, in Q4 2007, Citibank had writedowns of $18 billion.Bloomberg reports that all but $1 billion of these writedowns came directly orindirectly from highly rated tranches of securitizations. Because banks, suchas Citibank, also made losses on their off-balance-sheet vehicles that held suchtranches, our broadest measure includes holdings in the structured investmentvehicles sponsored by banks.
We are able to provide estimates of holdings of highly rated tranches from2002 to 2008 for U.S. bank holding companies.2 The median holdings of highlyrated tranches normalized by total assets were less than 0.2%. Obviously, forthe typical bank, these holdings were not material. The mean across banks wasabout 1.3% in 2006. But banks with large trading portfolios (more than $1billion of trading assets and trading assets representing more than 10% of totalassets) had higher holdings. The average on-balance-sheet holdings representedabout 5% of assets as of 2006 for these banks. Adding off-balance-sheetholdings increases the holdings of banks with large trading portfolios to 6.6%of their total assets. However, holdings varied substantially across large banks.Citigroup recorded the largest amount of writedowns among bank holdingcompanies and its holdings of highly rated tranches, including off-balance-sheet
1 In particular, the chairman of the Federal Reserve Board, Alan Greenspan (2004), delivered a widely noticedspeech in which he stated that “The new instruments of risk dispersion have enabled the largest and mostsophisticated banks in their credit-granting role to divest themselves of much credit risk by passing it to institutionswith far less leverage.”
2 Though investment banks eventually reported information on their holdings of highly rated tranches, they didnot have reporting requirements that make consistently identifying such holdings possible before the crisis.Consequently, investment banks are not included in the analyses of the paper.
405
at Brigham
Young U
niversity on August 4, 2014
http://rfs.oxfordjournals.org/D
ownloaded from

[16:28 7/1/2014 RFS-hht077.tex] Page: 406 404–453
The Review of Financial Studies / v 27 n 2 2014
holdings, amounted to 10.7% of assets, or roughly $201 billion, at the end of2006.
We explore whether investments in highly rated tranches were correlated withrisk taking by banks before the crisis. Using common risk measures, such asleverage and distance-to-default, we investigate whether banks that had highholdings of highly rated tranches were riskier ahead of the crisis than wereother banks. We find no evidence that holdings were correlated with bank riskbefore the crisis when we control for bank characteristics. However, banks withlarger holdings of highly rated tranches performed worse during the crisis, sothat banks in the top quintile of highly rated tranches holdings had about 14%lower buy-and-hold excess returns, on average.
To understand why holdings of highly rated tranches varied so much acrossbanks, we identify a number of possible determinants of the holdings of highlyrated tranches from the ongoing debate as to why banks held these tranches.These determinants are not mutually exclusive. The first theory we investigateis the securitization by-product explanation. There are several reasons whybanks that engaged in securitization would hold highly rated tranches. First,though most of the literature focuses on the benefits to issuers from havingskin in the game by holding the riskiest tranche of a securitization (DeMarzo2005; Shleifer and Vishny 2010; Gennaioli, Shleifer, and Vishny 2012), weargue that such benefits can also arise from holding highly rated tranches.Furthermore, banks engaged in securitization would have inventories of thesesecurities from the process of creating, marketing, and making a market forthem. Banks with securitization activities would also be better placed to assessthe expected return and risk of highly rated tranches and therefore would bemore comfortable with holding them for investment. Finally, commentatorshave argued that some banks were stuck with securities they could notsell in 2007. We find strong evidence that banks engaged in securitizationsheld more highly rated tranches before the crisis and that their holdings ofthese tranches increased with their securitization activities in the years beforethe crisis.
The second theory of holdings of securitization tranches we consider is theregulatory arbitrage theory. Everything else equal, banks faced lower capitalrequirements for holding these highest-rated tranches than they would havefaced for holding the loans that backed these tranches directly (see Acharyaand Richardson (2009), among others). They could also hold these tranchesin off-balance sheet conduits and structured investment vehicles (SIVs), wherethe capital requirements were even lower (Acharya, Schnabl, and Suarez 2013).Finally, highly rated tranches had high yields compared with other securitieswith similar capital requirements (Coval, Jurek, and Stafford 2009). In itsmost naïve form, the regulatory-arbitrage hypothesis predicts that if holdingregulatory capital is costly, banks would systematically hold highly ratedtranches of securitizations instead of corporate bonds (which had higher capitalrequirements but lower yields for similar ratings) and instead of loans that
406
at Brigham
Young U
niversity on August 4, 2014
http://rfs.oxfordjournals.org/D
ownloaded from
[16:28 7/1/2014 RFS-hht077.tex] Page: 407 404–453
Holdings of Highly Rated Securitization Tranches
could be securitized. Further, large banks for which regulatory capital wascostly would all have sponsored SIVs because these vehicles enabled themto hold assets with low capital requirements. This naïve regulatory arbitragehypothesis does not hold in the data because there is too much variation acrossbanks in the holdings of highly rated tranches. However, if the banks thatengaged in securitizations were the ones for which regulatory arbitrage wasmost valuable, then our findings on the positive relation between holdingsand securitization activity are consistent with a more sophisticated view ofregulatory arbitrage.
The third possible explanation for holdings of highly rated tranches is thatbanks which were too-big-to-fail had incentives to hold them because theycould invest in them at a low cost and not bear the full consequences of therisks associated with them (Carbo-Valverde, Kane, and Rodriguez-Fernandez2010). Because of how they are engineered, these highly rated tranches pay offfully in most states of the world but pay poorly in states of the world in whichpublic support of financial institutions is most likely, namely, in systemic crises.Bank size could explain holdings of highly rated securities for other reasons,however. For instance, one would expect that there are economies of scale ininvesting in these securities or in setting up asset-backed commercial paper(ABCP) programs and SIVs. We find that large banks invested more in highlyrated tranches than small banks did. Yet, holdings of these tranches did notincrease with bank size for large banks but did increase with securitizationactivity. Finally, there is wide variation in holdings of highly rated tranchesamong the largest banks, which is inconsistent with a simple view that too-big-to-fail led large banks to accumulate holdings of highly rated tranchesuniformly.
Lastly, we explore other possible explanations for variation in securitizationtranche holdings. Many observers have argued that inappropriate incentivesystems made taking excessive risks, such as investing in assets thatsubsequently performed poorly, advantageous for managers and/or traders(e.g., Rajan 2010; UBS 2008). Blinder sums up this argument as follows:“Give smart people go-for-broke incentives and they will go for broke. Duh.”3
Compensation data are not available for traders who are not top executivesof banks, so that the incentives of these traders cannot be examined directly.However, using data for top executives, we find no evidence that banks withlarger holdings of highly rated tranches had executives with poorer incentives tomaximize shareholder wealth or greater incentives to take risks.Another relatedmotive is summarized by the Financial Crisis Inquiry Commission’s conclusionthat “dramatic failures of corporate governance and risk management at many
3 See Alan S. Blinder, “Crazy compensation and the crisis,” Wall Street Journal, May 28, 2009. Fahlenbrachand Stulz (2011) show, however, that banks whose CEOs had incentives better aligned with those of the othershareholders did not perform better during the crisis.
407
at Brigham
Young U
niversity on August 4, 2014
http://rfs.oxfordjournals.org/D
ownloaded from
[16:28 7/1/2014 RFS-hht077.tex] Page: 408 404–453
The Review of Financial Studies / v 27 n 2 2014
systematically important financial institutions were a key cause of this crisis.”4
Based on this reasoning, had banks properly understood their risk, bankswould not have held highly rated tranches in the amounts they did.5 But expost adverse outcomes are not evidence of risk management failures (Stulz2008), so that one cannot logically conclude that poor performance of thehighly rated tranches was the result of risk management failure. Consequently,measuring the quality of risk management is a notoriously difficult task becauseone needed proprietary information on the risk management process at thetime the decisions to hold these securities were made. However, using anindex constructed by Ellul and Yerramilli (2013), we find no relation betweenholdings of highly rated tranches and the centrality and independence of riskmanagement.
The paper is organized as follows. In the next section we develop possibleexplanations for banks’ holdings of highly rated tranches and present thetestable implications of each theory. In Section 2, we explain how weconstruct our estimates of holdings of highly rated tranches for depositorybanks and summarize these estimates. In Section 3, we investigate whetherthe banks with greater investments in highly rated tranches were riskierbefore the crisis and whether their performance differed during the crisis.We test the implications of the various theories in Section 4 and concludein Section 5.
1. Theories of Holdings of Highly Rated Tranches
In Fama (1985), banks’cost of funding is a market cost of funding, but they facea cost of doing business, the cost of the reserves they have to maintain. So, toremain in business, banks have to charge an above-market rate to their lenders.This well-known result poses a paradox when considering banks’ holdings ofhighly rated tranches. If banks pay a market rate of return on their sources offinance and earn a market rate of return on their investments in securities, howcan holding securities be a positive NPV project for banks? Furthermore, as abank’s portfolio of securities grows large enough, holdings cannot be explainedby the need to have a buffer to address unexpected liquidity demands fromdepositors and borrowers or to have inventory when acting as a market maker.Intuitively, a bank might monitor borrowers and this monitoring could createvalue. But it is not intuitive that these highly-rated securities are more efficientlyheld by banks.
4 Financial Crisis Inquiry Commission (2011, xvii). See also Bernanke (2010).
5 For instance, Krishnamurthy states that “There are risk control checks and balances in any firm, starting with asenior risk management committee and going down to the head trader in a particular asset class. In every one ofthese steps there was an under-pricing and under-appreciation of the risk.” (See Kellogg Insight, “Debt marketsduring the crisis,” April 2011.)
408
at Brigham
Young U
niversity on August 4, 2014
http://rfs.oxfordjournals.org/D
ownloaded from

[16:28 7/1/2014 RFS-hht077.tex] Page: 409 404–453
Holdings of Highly Rated Securitization Tranches
We now consider the determinants of holdings of highly rated tranchesdiscussed previously and derive testable hypotheses. For ease of presentation,we classify these determinants into four groups.
1.1 Securitization by-productBefore the financial crisis, securitization markets were very active in the UnitedStates.6 The theoretical literature on securitization has shown that if there isinformation asymmetry between the issuer (or underwriter) and investors, theissuer has incentives to signal the quality of the collateral through retentionof the riskiest tranche, the equity tranche, of the securitization.7 Even in thatliterature, however, the issuer can retain higher-rated tranches in addition tothe equity tranche to the extent that the demand curve for these tranches isdownward-sloping and the issuer maximizes the proceeds from the sale ofsecurities (DeMarzo and Duffie 1999). The securitization literature dealingwith moral hazard issues also provides theoretical arguments for retention bythe issuer. However, this literature is more ambiguous about which tranchesthe issuer will retain. Fender and Mitchell (2009) show that if, for example,a downturn is likely, the issuer may screen the underlying collateral morecarefully if it retains a mezzanine tranche or a vertical slice of the securitizationthan if it retains the equity tranche.
The theoretical literature has not paid attention to three importantconsiderations that are likely to affect a bank’s holdings of highly rated tranchesand make it more likely that banks would have viewed it as beneficial to holdhighly-rated tranches for skin-in-the-game reasons. First, as we will discuss indetail later, the regulatory capital required to hold a dollar of equity tranche canbe more than fifty times the regulatory capital required to hold a highly ratedtranche. Even if holding a highly rated tranche is a less efficient signalingmechanism than is holding a lower-rated tranche, an issuer might chooseto signal through holding more senior tranches than equity tranches to saveregulatory capital. This benefit might have been magnified before the crisis bythe fact that a bank could use highly rated tranches as collateral for securedlending, while it could not do so with equity tranches. The second importantconsideration is that typically the value of the equity tranche of a securitizationincreases in value as the correlation among the assets securitized increases,whereas the value of the highly rated tranches falls (e.g., Gibson 2004).Consequently, retention of the equity tranche is not suitable to communicateconfidence to the market that the highly rated tranches have low risk because
6 See Gorton and Metrick (2013) for a review essay on securitization. See Greenbaum and Thakor (1987) foran early study of a bank’s choice between retaining loans and securitizing them. In that model, banks offerinsurance to borrowers whose loans are securitized, which is equivalent to retaining a stake in the securitization.See Duffie and Garleanu (2001) for a description of CDOs and Gorton and Souleles (2006) for special purposevehicles (SPVs). See also Pennacchi (1988) and Gorton and Pennacchi (1989, 1995) as early examples of arelated literature on loan sales.
7 See Gorton and Metrick (2013) for a survey of the literature.
409
at Brigham
Young U
niversity on August 4, 2014
http://rfs.oxfordjournals.org/D
ownloaded from
[16:28 7/1/2014 RFS-hht077.tex] Page: 410 404–453
The Review of Financial Studies / v 27 n 2 2014
the equity tranche would be more valuable if the correlation is higher than theinvestors believe it to be. Finally, investors in highly rated tranches viewed themas extremely low risk. They wanted comfort that the tranches would remainunaffected even if the equity tranche were to be wiped out. Having banks investalongside the outside investors in the highly rated tranches could give investorssuch comfort in a way that holding the equity tranche could not. Of course, thiscertification required investors to believe that the banks would keep holdinghighly rated tranches. The issue of continued retention is not, however, specificto this argument for holding highly rated tranches as it applies more generallyto models that show that retaining some of the securitization is optimal for theissuer (Duffie 2008).
Though the literature focuses on a deal-level skin-in-the-game hypothesis,it is important to note that banks engaged in securitization could benefit fromholding highly rated tranches even if they were not issued by them. These banksbenefited from the success of securitization in general and therefore derivedbenefits from signaling that highly rated tranches in general had low risk andwere liquid.
Securitization activity could be associated with higher holdings for severalother important reasons. First, a securitization-active bank would be in a betterposition to assess these tranches as potential investments for itself as it haspersonnel familiar with these tranches and could better evaluate their risk andexpected return. Consequently, we would expect these banks to invest morein these tranches as they would be more familiar with them (see, for instance,Huberman (2001) for evidence of the role of familiarity on investment). Second,a bank that is active in the securitization market as an issuer has a pipeline ofdeals. If it produces CDOs, it will have an inventory of ABSs. As it issuesCDOs and other ABSs, it may take time to make a market for some tranches.Consequently, we would expect holdings of highly rated tranches to increaseover time as the securitization activity increases. However, banks were possiblystuck with highly rated tranches that they could not sell as the market turnedin 2007. We call this hypothesis the “hung deals” hypothesis, in that the banksfailed to stop their production quickly enough and could not sell these securitieswithout making a loss, leading them to hold on to the securities.
In summary, this subsection presents the following predictions for the relationbetween securitization and holdings of highly rated tranches:
Securitization H1: Activity. Holdings of highly rated tranches as a fractionof a bank’s assets were higher for banks engaged in securitization activity.
Securitization H2: Cumulative activity. Holdings of highly rated tranchesfor banks active in securitization increased over time as each securitizationwould require skin in the game.
Securitization H3: Hung deals. To the extent that securitization activity didnot slow down fast enough and banks were stuck with highly rated tranchesthat they intended to sell, holdings of highly rated tranches for firms active insecuritization increased in 2007.
410
at Brigham
Young U
niversity on August 4, 2014
http://rfs.oxfordjournals.org/D
ownloaded from

[16:28 7/1/2014 RFS-hht077.tex] Page: 411 404–453
Holdings of Highly Rated Securitization Tranches
1.2 Regulatory arbitrageBanks that view holding regulatory capital to be costly will, everything elseequal, choose activities that consume the least amount of regulatory capital.With an amendment to risk-based capital requirements in November 2001, theFederal Reserve allowed bank holding companies (BHCs) to incorporate creditratings in calculating regulatory capital for holdings of securities issued throughsecuritizations.8 Prior to the rule change, capital charges on such securitieswere dictated by asset type rather than credit quality. For example, mortgage-backed securities issued or guaranteed by Fannie Mae carried a 20% risk weight(so that the required capital for holding these securities was 20% of 8%, or1.6%, in comparison with 8% for corporate loans), but non-agency mortgage-backed securities that were viewed as having similar risk carried a 50% or largerregulatory risk weight.9 Following the rule change, the regulatory capital chargebecame a function of the securities’ credit rating rather than of asset class.AAA-rated and AA-rated securitizations received a 20% risk weighting; A-rated securitizations received a 50% risk weighting; BBB-rated securitizationsreceived a 100% risk weighting; BB-rated securitizations received a 150%risk weighting, and a dollar-for-dollar charge on residual interests or equitytranches, amounting to a risk weight of 1,250%.
After the regulatory changes of November 2001, a bank that made subprimeloans was better off holding them on its books as securities backed by these loansthan holding the loans directly.10 Further, a bank was better off holding anAAA-rated securitization tranche than an AAA-rated corporate bond because thecorporate bond still required 8% of the investment as regulatory capital, whereasthe AAA-rated securitization tranche only required 1.6% of the investmentas regulatory capital. In addition, the highly rated tranches had higher yieldsthan did other securities with similar ratings (see Coval, Jurek, and Stafford2009; Iannotta and Pennacchi 2011), so that banks could hold AAA-ratedsecuritization tranches and both earn a higher yield and need less regulatorycapital than if they held a corporate bond of similar rating.
Banks benefit from regulatory arbitrage as their regulatory capital becomesmore of a binding constraint. However, regulatory arbitrage brings morescrutiny to the bank as well. Poorly performing banks and banks that arealmost insufficiently capitalized are more likely to be scrutinized. Furthermore,regulatory arbitrage would be more costly for small banks to the extent thatregulatory-arbitrage transactions have fixed costs. With these considerations,we would expect banks with considerable regulatory capital slack not to findregulatory arbitrage profitable. However, we have no direct prediction for bankswith little regulatory capital slack because for such banks both the cost and
8 For details of the amendment, see www.fdic.gov/news/news/financial/2001/fil0199.html.
9 With the Basel I regulatory regime, a bank had to hold at least 8% of risk-weighted assets in regulatory capitalbefore the crisis.
10 As an example, see Goldman Sachs, Global Markets Institute, Effective Regulation: Part 1, March 2009.
411
at Brigham
Young U
niversity on August 4, 2014
http://rfs.oxfordjournals.org/D
ownloaded from

[16:28 7/1/2014 RFS-hht077.tex] Page: 412 404–453
The Review of Financial Studies / v 27 n 2 2014
benefits of regulatory arbitrage could be high. We would expect banks forwhich regulatory arbitrage was particularly advantageous to have grown theirbalance sheet after capital requirements for highly rated tranches decreased in2001. Then we can develop the following testable predictions:
Regulatory Arbitrage H1. Holdings of highly rated tranches increased witha bank’s cost of regulatory capital and fell with a bank’s cost of regulatoryscrutiny.
Regulatory Arbitrage H2. Large banks and those that engaged in moreregulatory arbitrage activities had more highly rated tranches.
1.3 Too big to failTo the extent that a bank is viewed as too-big-to-fail, everything else equal, itscost of funds does not reflect the full extent of the risks it takes. The proponentsof the too-big-to-fail view argue that, because a too-big-to-fail bank does notpay for some of the risks it takes, the bank has incentives to take more of theserisks. If a bank is expected to be bailed out whenever it makes large losses, thebank can increase its value by generally taking more total risk. Highly ratedtranches of securitizations would not serve this purpose because these securitieswere designed to pay off fully in most states of the world. If, instead, a too-big-to-fail bank is likely to be bailed out only in systemic crises, it would haveincentives to take on more risks that have poor payoffs in systemic crises. Sucha bank would have incentives to hold highly rated tranches. With this view, wehave the following testable hypothesis:
Too-big-to-fail H1. Banks deemed too-big-to-fail invested more in highlyrated tranches of securitizations than other banks did.
The too-big-to-fail explanation for holding highly rated tranches ignores thepotential costs associated with being too-big-to-fail. For instance, it can bringmore regulatory scrutiny. As discussed in Section 1.2, more regulatory scrutinycould have decreased holdings of highly-rated tranches.
1.4 Other possible explanationsOther highly discussed explanations for holdings of highly rated tranchesinclude incentives of traders and/or managers, and poor risk management. Rajan(2006) raised concerns about the incentives in place in the financial industryand how they might lead to excessive risk taking even before the crisis. A keycharacteristic of highly rated tranches before the financial crisis is that theyhad a higher yield than similar highly rated assets. Such a difference can arisein efficient markets simply because some assets have more systematic riskthan others (see, for example, Coval, Jurek, and Stafford 2009). If incentivesare set properly, executives or traders should not benefit from investing incorrectly priced assets that have a higher return only because they have moresystematic risk. However, incentives could be set improperly. For example,traders whose performance was judged on profit and loss (P&L), taking into
412
at Brigham
Young U
niversity on August 4, 2014
http://rfs.oxfordjournals.org/D
ownloaded from
[16:28 7/1/2014 RFS-hht077.tex] Page: 413 404–453
Holdings of Highly Rated Securitization Tranches
account regulatory capital, would have had incentives to invest in highly-ratedtranches. Banks’P&L increased by the positive carry of these assets and chargesfor regulatory capital were low. Alternatively, executives whose performancewas assessed by the return on equity (ROE) of their bank would also havebenefited from investing in highly rated tranches as long as the yield on thesesecurities exceeded the cost of holding them.
There are at least two different arguments related to risk-managementfailures. One argument is that bank risk management failed to correctly assessthe risks of the highly rated tranches, perhaps because of risk model mistakes.Another argument is that the risk management function at certain banks didnot have enough influence to limit the holdings of highly rated tranches at thelevel thought to be appropriate given their assessed risk. Whereas the wrong-model argument cannot be investigated with publicly available data, the latterargument about the role of risk management can be evaluated if it is the casethat a more independent and more central role for risk management gives itmore influence. With this argument, we would expect banks in which the risk-management function was less central and less independent to have fared worseas a result of having larger holdings of highly rated tranches. Unfortunately,this simple view of risk management is problematic. It is possible for a lessindependent and less central risk management function to be more influentialbecause it is more integrated in the decision processes of the firm’s businesses.
To summarize, this subsection develops the following predictions:
Bad incentives H1. Banks with trading operations and poor incentivesinvested more in highly rated tranches.
Bad incentives H2. Banks more focused on ROE held more highly ratedtranches.
Poor risk management H1. Banks in which risk management was lesscentral and less independent held more highly rated tranches.
2. Estimated Holdings of Highly Rated Tranches
In this section, we explain first how holdings of highly rated tranches areestimated and then provide data on our estimates.
2.1 Methods to estimate holdings of highly rated tranchesOur primary data source is the Consolidated Financial Statements for bankholding companies, form FR Y-9C, published quarterly by the Board ofGovernors of the Federal Reserve System. We focus on the cross-sectionof BHCs that are publicly traded in the United States and have data as ofDecember 31, 2006. We drop all BHCs with missing data on total assets orwith total assets less than $1 billion. And we end with a final sample of 231banks as of December 31, 2006, the date we focus on in the majority of our
413
at Brigham
Young U
niversity on August 4, 2014
http://rfs.oxfordjournals.org/D
ownloaded from

[16:28 7/1/2014 RFS-hht077.tex] Page: 414 404–453
The Review of Financial Studies / v 27 n 2 2014
estimations.11 The total sample period over which we calculate holdings ofhighly rated tranches covers March 2002 through December 2008. It starts in2002 because this is the first year that bank holding companies had to reportholdings of securitization tranches by credit rating.
Our variable of interest is designed to measure holdings of what wecall highly rated tranches, which are highly rated nongovernment andnonagency securities issued in securitizations and held on BHC balance sheets.Examples include highly rated tranches of subprime residential mortgage-backed securities (RMBSs), commercial mortgage-backed securities (CMBSs),collateralized loan obligations (CLOs), collateralized bond obligations (CBOs),and collateralized debt obligations (CDOs). Bank holding companies did notexplicitly report holdings of these securities in their consolidated financialstatements during our sample period. Our approach is to “back out” the amountof highly rated tranches banks held on their balance sheets using data from theregulatory-capital portion of the consolidated financial statements (scheduleHC-R of the form FR Y-9C). Under risk-based capital guidelines, each assetis assigned a weighting that depends on the type of the asset and its riskiness.BHCs are then required to hold capital corresponding to 8% of their risk-weighted assets. For example, government securities usually have a zero riskweight, whereas agency-sponsored securities are generally assigned a 20%risk weight by virtue of their implicit government guarantees. Securitizationtranches with a credit rating of AA or AAA are assigned a 20% risk weight,whereas tranches with credit ratings of A require a 50% risk weight.
Our approach is to identify the amount of securities in the 20% and 50%risk weight categories that are not government- or agency-affiliated. Reportingguidelines name the specific types of securities that are to be included in eachrisk weight category and instruct BHCs to account for securities at historicalcost, as opposed to fair value. For example, the total amount of held-to-maturity securities (line item 35 in Schedule HC-R) in the 20% risk weightcategory contains various securities issued or guaranteed by the government orgovernment-sponsored agencies and reported in Schedule HC-B.12 The key toour measure of highly rated tranches is that BHCs are instructed to also include“all other residential MBS,” “commercial mortgage pass-through securities,”“other commercial MBS,” “asset-backed securities,” and “structured financialproducts” that represent the amortized cost of securities rated AAA or AA inthis 20% risk category. Thus, the residual amount of securities included in the
11 We drop BHCs that are not in the top tier of the multitiered BHCs to avoid double counting. To mitigate theinfluence of outliers and focus on the depository BHCs, we additionally drop eight BHCs from our sample: threeinsurance companies, two mortgage brokers, two credit card companies, and one asset management BHC.
12 These securities are those issued by government-sponsored agencies (line item 2b), residential mortgagepass-through securities issued by FNMA and FHLMC (line item 4a2), securities issued by states or politicalsubdivisions in the U.S. (item 3), and other MBSs (collateralized by MBSs) issued or guaranteed by agencies(line items 4b1 and 4b2).
414
at Brigham
Young U
niversity on August 4, 2014
http://rfs.oxfordjournals.org/D
ownloaded from

[16:28 7/1/2014 RFS-hht077.tex] Page: 415 404–453
Holdings of Highly Rated Securitization Tranches
20% risk category that are not affiliated with the government or government-sponsored agencies represent the amount of AAA- or AA-rated private-labelstructured debt held by BHCs. The instructions for assets to be included in the50% risk category are similar but are for A-rated securities. Taken together,the 20% and 50% risk-weighted residuals represent the portion of highly rated(AAA-, AA-, or A-rated) nongovernment, nonagency securities held on BHCbalance sheets. In other words, they represent the holdings of highly ratedtranches that we seek to measure. We provide the details of the construction ofthe residual measures, including the relevant FR Y9-C codes, in the Appendix.It is important to note that corporate bonds, regardless of the credit ratings ofthe issuers, belong to the 100% risk weight category, and therefore holdingsof corporate bonds cannot be mistaken for holdings of highly rated tranches.However, our measure does include highly rated asset-backed securities thatperformed relatively well during the crisis (e.g., highly rated tranches fromcredit card and car loan securitizations). We cannot separate these types ofhighly rated tranches from highly rated tranches from subprime and Alt-Asecuritizations.
Many of the highly rated tranches with 20% or 50% risk weights areaccounted for as available-for-sale (AFS) or held-to-maturity (HTM) securities.However, some highly rated tranches, especially in the case of the largest banks,are held separately in a BHC’s trading account. The reporting requirementsfor securities held in trading accounts are different because banks withlarge trading operations do not have to report holdings of trading assetsby risk weight category. Instead, regulatory capital for the entire tradingbook is obtained from a value-at-risk measure. Therefore, for the banks thatare subject to the market risk capital guidelines, we are unable to use theresidual approach to back out holdings of highly rated tranches in tradingbooks. To capture holdings of securitization tranches in trading books, weuse the total amount of line items that are recorded as trading assets (inSchedule HC-D) and represent nongovernment, nonagency mortgage-backedsecurities. This approach captures the private-label securitization tranches withmortgage collateral in a BHC’s trading account but without differentiating thecredit quality of these securitization tranches.13 Adding the mortgage-backedsecuritization tranches from the trading account to the 20% and 50% AFS andHTM residual results in our primary (first) measure of highly rated tranches,referred to hereafter as the Highly rated residual. This measure overstatesholdings of highly rated tranches of MBSs because it includes lower-ratedtranches held in the trading book, but it understates holdings of highly rated
13 Nadauld and Sherlund (2013) show that over 80% of the value-weighted bonds in subprime RMBS deals receiveda AAA rating, with close to 90% rated at least A. Although we cannot use the residual approach to identify theholdings of highly rated tranches in trading assets, these securities were very likely highly rated. This is especiallytrue in light of the fact that correlation traders in hedge funds were frequent purchasers of the lowest rated (residual)tranches in securitization deals.
415
at Brigham
Young U
niversity on August 4, 2014
http://rfs.oxfordjournals.org/D
ownloaded from

[16:28 7/1/2014 RFS-hht077.tex] Page: 416 404–453
The Review of Financial Studies / v 27 n 2 2014
tranches of CDOs because the data available from the trading book containonly MBSs.
Our primary analysis investigates the holdings of highly rated tranchesbefore the crisis started. We therefore focus on holdings as of December 31,2006. Beginning in June 2008, BHCs have been required to explicitly reportthe amount of CDOs held in their trading accounts if the BHC reported aquarterly average for trading assets of $1 billion or more in any of the fourpreceding quarterly reports. Four banks reported CDO holdings at that time.We supplement our December 2006 estimates of highly rated tranches byadding the amount of CDOs reported in June 2008 to our first measure, Highlyrated residual, as of December 2006. The June 2008 values of CDOs likelyunderreport the value of CDOs held on BHCs’balance sheets as of 2006 becauseCDO values were written down in the fall of 2007 and early 2008. To accountfor this possibility, we create our third measure by adding the amount of CDOwritedowns (downloaded from Bloomberg) for the time period (December 31,2006 through the June 30, 2008) to the June 2008 CDO holdings of the relevantbanks. Though accounting for CDO writedowns improves our third measure,it still suffers from the fact that banks might have acquired or sold CDOs after2006. As far as we know, there is no way to adjust our measure for tradingsubsequent to 2006. The measure also understates CDO holdings as it ignoresholdings of less than $1 billion.
Banks held highly rated tranches not only on their balance sheets but also inoff-balance-sheet conduits and structured investment vehicles. There are elevenbanks with conduits and SIVs in our estimation sample. As the crisis evolved,banks had to take some of the securities held by SIVs back on their balancesheet. Thus, our fourth measure of highly rated tranches also adds assets held inthese conduits and SIVs, utilizing the data set provided by Acharya, Schnabl,and Suarez (2013). It is well-known that conduits held a variety of assets besideshighly rated tranches. To the extent that conduits and SIVs held other securitiesbesides highly rated tranches, adding the holdings of conduits and SIVs to ouron-balance sheet measure of highly rated tranches represents an upper boundof a bank’s total highly rated tranches holdings.
In summary, our residual approach yields four separate measures of highlyrated tranches. The first is the Highly rated residual, which includes 20%and 50% risk-weighted residuals and MBS trading. The second measure,constructed to account for the CDOs held in trading assets, adds 2008 CDOs toour first measure (highly rated residual + CDOs, hereafter). The third also addsCDO writedowns and is named hereafter as highly rated residual + CDOs andwritedowns. Finally, the fourth residual-based measure is called highly-ratedresidual + CDOs and writedowns + conduits and SIVs because it also adds theholdings that are not on the balance sheet.
Deviating from the residual-based approach above, we also compute a fifthmeasure of highly rated tranches holdings, which we call the bottom-up highlyrated tranches measure, borrowed from Cheng, Hong, and Scheinkman (2010).
416
at Brigham
Young U
niversity on August 4, 2014
http://rfs.oxfordjournals.org/D
ownloaded from

[16:28 7/1/2014 RFS-hht077.tex] Page: 417 404–453
Holdings of Highly Rated Securitization Tranches
This measure is basically the sum of each line item from the AFS, HTM,and trading asset accounts that correspond to nongovernment, nonagencysponsored securities. It includes other mortgage-backed securities and asset-backed securities from the AFS and HTM securities (Schedule HC-B).Nongovernment, nonagency mortgage-backed securities from trading assets(Schedule HC-D) are also added to the measure. The Appendix provides thedetailed data fields associated with the construction of this bottom-up measure.Although the measure explicitly assesses the amount of nongovernment,nonagency securities held on BHCs’ balance sheets, it does not capture thecredit quality of these assets. Like our first measure, the bottom-up measureis constructed using data reported at the end of 2006 and therefore does notinclude CDO holdings in trading accounts. It does not include off-balance-sheetexposures either.
A concern is that banks might have taken positions in highly rated tranchesthrough credit derivatives or might have hedged cash positions through creditderivatives. This concern does not affect our measure of highly rated tranches,as hedged tranches would still be assets for the bank, but it could affect theeconomic implications of these holdings. The data on credit derivatives doesnot distinguish between credit derivatives on corporate names versus creditderivatives on RMBSs and CDOs. The extent of the potential problem is limitedbecause in 2006 only twenty bank holding companies bought protection, andonly fifteen bank holding companies sold protection. With the caveat that thebanks with the largest holdings of highly rated tranches are also the ones thatwere active in the CDS market, in total, fifteen bank holding companies werenet buyers of protection. Among the top three banks, Citigroup and JP MorganChase were net buyers of protection, whereas Bank of America was a net seller.The 10-Ks suggest that banks that bought protection were heavily focused onhedging their corporate loan book.
2.2 Estimates of holdings of highly rated tranchesFigure 1 shows the evolution of total dollar holdings of highly rated tranchesusing our primary Highly rated residual measure. At the end of 2006, thelast year before the crisis, the banks in our sample held $228 billion ofhighly rated tranches. The holdings of these tranches increased dramaticallysince the start of our sample in 2002. In 2002, the total dollar holdingsof highly rated tranches were $64 billion. The total dollar holdings keepincreasing after the end of 2006, experiencing an especially sharp increaseduring 2007.
The December 2006 estimate of $228 billion arising from our primary Highlyrated residual approach should be viewed as a lower bound, given that thesample only includes bank holding companies that are publicly traded in theUnited States. Relaxing some filters, including the publicly traded requirement,increases the sample size from the 231 banks employed in our regressions toa sample of 439 banks. The Highly rated residual in December 2006 measure
417
at Brigham
Young U
niversity on August 4, 2014
http://rfs.oxfordjournals.org/D
ownloaded from

[16:28 7/1/2014 RFS-hht077.tex] Page: 418 404–453
The Review of Financial Studies / v 27 n 2 2014
Figure 1Dollar amounts of holdings of highly rated tranchesThis figure plots the aggregate, nominal U.S. dollar amount of holdings of highly rated tranches through time.Our sample runs from 2002–2008 and includes all U.S. publicly traded bank holding companies (BHCs). The plotis created using the highly rated residual measure of highly rated holdings. See Appendix A.1, for a descriptionof this variable.
totals $349 billion in the larger sample of 439 banks.14 Lehman Brothersconstructed an estimate of holdings of private label MBS by banks and thriftsthat has been widely cited.According to that estimate, the banks and thrifts in thetop fifty in terms of nonagency MBS holdings held $314 billion in nonagencyMBSs in mid-2007.15 Finally, when we consider the highly rated holdings inoff-balance-sheet conduits and SIVs, an estimated $255.7 billion for fourteenbanks, we arrive at an upper-bound estimate that totals $604.7 billion.16
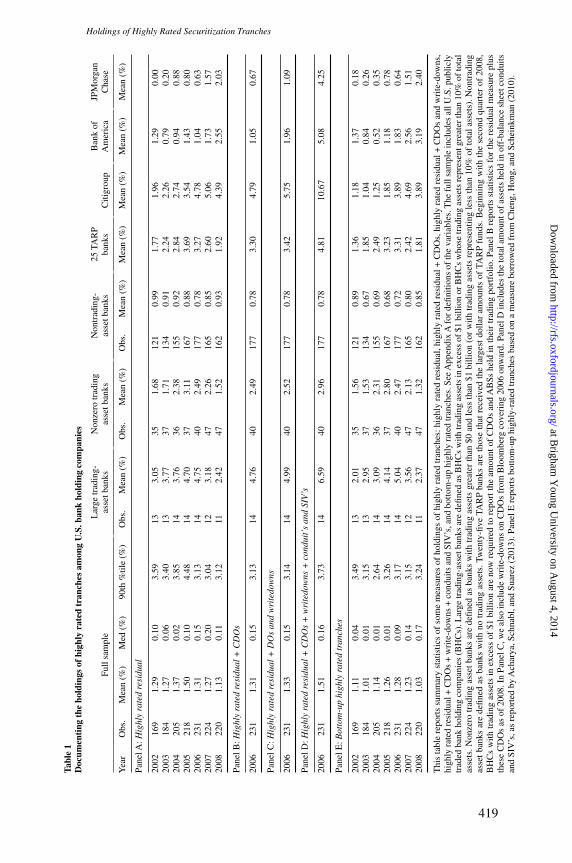
Table 1 shows data on our estimates of holdings of highly rated tranchesby BHCs. We always normalize the holdings by bank assets. Panel A showssummary statistics for our primary Highly rated residual measure. In contrastto our other measures (except for the bottom-up measure), this measure isavailable consistently from 2002. In 2006, the median holdings of highlyrated tranches (as a ratio of total assets) are 0.15%. Such holdings are oftrivial importance for a bank. So, for the typical bank, holdings of highlyrated tranches were not a material concern.17 However, the mean holdingsof highly rated tranches are 1.13%, almost ten times the median. Such a resultimplies that some banks have large holdings of highly rated tranches compared
14 The larger sample of 439 also includes some financial intermediaries not included in the final sample of 231that are more comparable to asset management firms than standard depository bank holding companies. Thesenonstandard intermediaries that appear in the FR Y-9C data report large amounts of highly rated holdings andare largely responsible for the increase in holdings to $349 billion for the full sample as compared with holdingsof $228 in our final sample of 231.
15 Lehman Brothers, Fixed Income U.S. Securitized Products Research, “Who owns residential credit risk,”September 7, 2007.
16 Acharya, Schnabl, and Suarez (2013) provide information on conduits for a sample of banks with larger than$50 billion in assets. Out of twenty banks in our sample that meet the same size filter, only fourteen reportedconduits.
17 Note that the typical bank does not have a trading book. Consequently, for the typical bank, our estimate ofhighly rated tranches is unbiased.
418
at Brigham
Young U
niversity on August 4, 2014
http://rfs.oxfordjournals.org/D
ownloaded from
[16:28 7/1/2014 RFS-hht077.tex] Page: 419 404–453
Holdings of Highly Rated Securitization Tranches
Tabl
e1
Doc
umen
ting
the
hold
ings
ofhi
ghly
rate
dtr
anch
esam
ong
U.S
.ban
kho
ldin
gco
mpa
nies
Lar
getr
adin
g-N
onze
rotr
adin
gN
ontr
adin
g-25
TAR
PB
ank
ofJP
Mor
gan
Full
sam
ple
asse
tban
ksas
setb
anks
asse
tban
ksba
nks
Citi
grou
pA
mer
ica
Cha
se
Yea
rO
bs.
Mea
n(%
)M
ed(%
)90
th%
tile
(%)
Obs
.M
ean
(%)
Obs
.M
ean
(%)
Obs
.M
ean
(%)
Mea
n(%
)M
ean
(%)
Mea
n(%
)M
ean
(%)
Pane
lA:H
ighl
yra
ted
resi
dual
2002
169
1.29
0.10
3.59
133.
0535
1.68
121
0.99
1.77
1.96
1.29
0.00
2003
184
1.27
0.06
3.40
133.
7737
1.71
134
0.91
2.24
2.26
0.79
0.20
2004
205
1.37
0.02
3.85
143.
7636
2.38
155
0.92
2.84
2.74
0.94
0.88
2005
218
1.50
0.10
4.48
144.
7037
3.11
167
0.88
3.69
3.54
1.43
0.80
2006
231
1.31
0.15
3.13
144.
7540
2.49
177
0.78
3.27
4.78
1.04
0.63
2007
224
1.27
0.20
3.04
123.
1847
2.26
165
0.85
2.60
5.06
1.73
1.57
2008
220
1.13
0.11
3.12
112.
4247
1.52
162
0.93
1.92
4.39
2.55
2.03
Pane
lB:H
ighl
yra
ted
resi
dual
+C
DO
s
2006
231
1.31
0.15
3.13
144.
7640
2.49
177
0.78
3.30
4.79
1.05
0.67
Pane
lC:H
ighl
yra
ted
resi
dual
+D
Os
and
wri
tedo
wns
2006
231
1.33
0.15
3.14
144.
9940
2.52
177
0.78
3.42
5.75
1.96
1.09
Pane
lD:H
ighl
yra
ted
resi
dual
+C
DO
s+
wri
tedo
wns
+co
ndui
t’s
and
SIV
’s
2006
231
1.51
0.16
3.73
146.
5940
2.96
177
0.78
4.81
10.6
75.
084.
25
Pane
lE:B
otto
m-u
phi
ghly
rate
dtr
anch
es
2002
169
1.11
0.04
3.49
132.
0135
1.56
121
0.89
1.36
1.18
1.37
0.18
2003
184
1.01
0.01
3.15
132.
9537
1.53
134
0.67
1.85
1.04
0.84
0.26
2004
205
1.14
0.01
2.64
143.
0936
2.31
155
0.69
2.49
1.25
0.52
0.35
2005
218
1.26
0.01
3.26
144.
1437
2.80
167
0.68
3.23
1.85
1.18
0.78
2006
231
1.28
0.09
3.17
145.
0440
2.47
177
0.72
3.31
3.89
1.83
0.64
2007
224
1.23
0.14
3.15
123.
5647
2.13
165
0.80
2.42
4.69
2.56
1.51
2008
220
1.03
0.17
3.24
112.
3747
1.32
162
0.85
1.81
3.89
3.19
2.40
Thi
sta
ble
repo
rts
sum
mar
yst
atis
tics
ofso
me
mea
sure
sof
hold
ings
ofhi
ghly
rate
dtr
anch
es:h
ighl
yra
ted
resi
dual
,hig
hly
rate
dre
sidu
al+
CD
Os,
high
lyra
ted
resi
dual
+C
DO
san
dw
rite
-dow
ns,
high
lyra
ted
resi
dual
+C
DO
s+
wri
te-d
owns
+co
ndui
tsan
dSI
V’s
,and
botto
m-u
phi
ghly
rate
dtr
anch
es.S
eeA
ppen
dix
Afo
rde
finiti
ons
ofth
eva
riab
les.
The
full
sam
ple
incl
udes
allU
.S.p
ublic
lytr
aded
bank
hold
ing
com
pani
es(B
HC
s).L
arge
trad
ing-
asse
tban
ksar
ede
fined
asB
HC
sw
ithtr
adin
gas
sets
inex
cess
of$1
billi
onor
BH
Cs
who
setr
adin
gas
sets
repr
esen
tgre
ater
than
10%
ofto
tal
asse
ts.N
onze
rotr
adin
gas
setb
anks
are
defin
edas
bank
sw
ithtr
adin
gas
sets
grea
ter
than
$0an
dle
ssth
an$1
billi
on(o
rw
ithtr
adin
gas
sets
repr
esen
ting
less
than
10%
ofto
tala
sset
s).N
ontr
adin
gas
set
bank
sar
ede
fined
asba
nks
with
notr
adin
gas
sets
.Tw
enty
-five
TAR
Pba
nks
are
thos
eth
atre
ceiv
edth
ela
rges
tdo
llar
amou
nts
ofTA
RP
fund
s.B
egin
ning
with
the
seco
ndqu
arte
rof
2008
,B
HC
sw
ithtr
adin
gas
sets
inex
cess
of$1
billi
onar
eno
wre
quir
edto
repo
rtth
eam
ount
ofC
DO
san
dA
BSs
held
inth
eir
trad
ing
port
folio
.Pan
elB
repo
rts
stat
istic
sfo
rth
ere
sidu
alm
easu
repl
usth
ese
CD
Os
asof
2008
.In
Pane
lC,w
eal
soin
clud
ew
rite
-dow
nson
CD
Os
from
Blo
ombe
rgco
veri
ng20
06on
war
d.Pa
nelD
incl
udes
the
tota
lam
ount
ofas
sets
held
inof
f-ba
lanc
esh
eetc
ondu
itsan
dSI
V’s
,as
repo
rted
byA
char
ya,S
chna
bl,a
ndSu
arez
(201
3).P
anel
Ere
port
sbo
ttom
-up
high
ly-r
ated
tran
ches
base
don
am
easu
rebo
rrow
edfr
omC
heng
,Hon
g,an
dSc
hein
kman
(201
0).
419
at Brigham
Young U
niversity on August 4, 2014
http://rfs.oxfordjournals.org/D
ownloaded from

[16:28 7/1/2014 RFS-hht077.tex] Page: 420 404–453
The Review of Financial Studies / v 27 n 2 2014
to the typical bank. The 90th percentile of holdings of highly rated tranchesis 3.13%.
In 2006, only fifty-four of the BHCs in our sample reported trading assets.Of these banks, fourteen had trading assets in excess of $1 billion and in excessof 10% of the bank’s assets. These “large trading banks” had holdings of highlyrated tranches using our narrowest measure averaging to 4.75%. One wayto understand the economic importance of such holdings is that the Basel Iaccord required banks to have capital equal to 8% of risk-weighted assets,half of it in Tier 1 capital. Banks usually hold more regulatory capital thanis required. But if a large trading bank has an average risk weight of 50%,a 50% loss on highly rated tranches would be enough to wipe out its Tier 1required capital.18 In contrast, the mean of the holdings of highly rated tranchesfor the banks that did not report trading assets was 0.78%. In Table 1, wealso show the holdings of the twenty-five banks receiving the largest dollaramounts of TARP funds. At the end of 2006, the average holdings of thesebanks were 3.27%, so that these banks on average held more than the 90thpercentile of highly rated holdings. Table 1 also presents the holdings of thethree largest banks. Although these holdings are large for Citigroup at 4.78%,they are below the mean for both Bank of America (1.04%) and JP MorganChase (0.63%).
Table 1, Panel A, reports information on holdings of highly rated tranchesusing our narrowest measure for other years, from 2002 to 2008. Neither themean nor the median changes noticeably during that period of time. The meanincreases from 1.29% in 2002 to 1.50% in 2005. After 2005, the mean falls,reaching 1.13% in 2008. For the large trading banks, the mean increases morenoticeably and drops more sharply after peaking in 2006. However, there areonly fourteen large trading banks in 2006. The number of large trading banksfalls to twelve by the end of 2007. The large decrease in highly rated tranchesfor large trading banks in 2007 is due to the merger of the Bank of New Yorkand Mellon. Both of these banks have high holdings, but the resulting entityis not in our sample for 2007 as we keep only the banks that are alive at theend of 2006, the year we focus on in most of our tests. If we look instead atthe holdings of banks alive, both at the end of 2006 and of 2007, the meanholdings of highly rated tranches is 2.94% at the end of 2006 and 3.07% at theend of 2007. The three largest banks have each a different pattern. In particular,Citibank’s holdings more than double over time (peaking in 2007), whereasneither Bank of America nor JP Morgan Chase exhibit much of an increase inholdings until 2007 and 2008. The holdings of JP Morgan Chase increase from1.06% in 2006 to 2.55% in 2008. We are unable to ascertain the extent to whichthis increase results from the acquisitions of Bear Stearns and WashingtonMutual in 2008.
18 If a bank has an average risk weight of 50%, it holds Tier 1 capital corresponding to 2% of assets. Hence, if thebank holds 4.57% of assets in highly rated tranches, a 50% loss is 2.27% of assets, which exceeds Tier 1 capital.
420
at Brigham
Young U
niversity on August 4, 2014
http://rfs.oxfordjournals.org/D
ownloaded from
[16:28 7/1/2014 RFS-hht077.tex] Page: 421 404–453
Holdings of Highly Rated Securitization Tranches
Table 1, Panel B, uses information on CDO holdings. Although adding thisinformation to our measure of highly rated tranches at the end of 2006 isreasonable, doing so to earlier years would make little sense as banks werein the process of increasing their holdings of CDOs before the end of 2006.CDO holdings do not affect the median and have a trivial effect on the meanbecause only four banks report holdings of CDOs in excess of $1 billion, thereporting threshold. The holdings of highly rated tranches for the banks withlarge trading books increase only by 0.01%. Table 1, Panel C, adds informationon writedowns. Taking into account writedowns has no impact on most banks.However, the holdings of highly rated tranches for Citibank increase furtherto 5.75%. The holdings of Bank of America increase to 1.96%. Finally, theholdings of JP Morgan Chase are 1.09%.
Table 1, Panel D, further adds assets held in conduits and SIVs, a total valueof $214.1 billion for eleven banks. This measure is only available for the endof 2006. Mean holdings for the full sample increase slightly, from 1.33% to1.51%. The increase is much larger for large trading-asset banks (from 4.99%to 6.59%), especially for Citigroup (from 5.75% to 10.67%), Bank of America(1.96% to 5.08%), and JP Morgan Chase (from 1.09% to 4.25%). To put thesenumbers in perspective, note that Citi had a ratio of common stockholders’equity to assets of 6.30% at the end of 2006 (Citigroup’s 10-K for 2007).Consequently, a loss of 60% on the highly rated tranches would have wipedout Citi’s common equity.
Finally, Table 1, Panel D, shows our estimates using the bottom-up approach.There is no meaningful difference between these estimates and the estimatesusing our preferred measure of Highly rated residual for most banks. When weturn to the large trading banks, the bottom-up measure has a mean that is higherby 0.29% in 2006. The two methods yield different estimates for Citibank andBank of America. For Citibank, the bottom-up method has an estimate thatis lower by 0.89%. For Bank of America, the difference of 0.79% is in theopposite direction.
The dollar holdings of highly rated tranches were highly concentrated.This concentration may not be surprising because bank assets are highlyconcentrated as well. Using our narrow measure, we find that half of theholdings of the banking sector in our sample were held by the three bankswith the largest assets, and these banks also held half of the assets ofthe banking sector. Further, the top five banks by assets held 60% of theholdings.
In summary, for most banks, holdings of highly rated tranches as a proportionof assets were less than 1% of assets. These holdings were small for some largebanks, such as JP Morgan. But the average holdings of highly rated tranchesby the banks with large trading assets were more than three times greaterthan the average holdings of these tranches by all banks. The average totalsecurities holdings of banks with large trading assets were only 24% higherthan the average securities holdings of the banks without large trading assets.
421
at Brigham
Young U
niversity on August 4, 2014
http://rfs.oxfordjournals.org/D
ownloaded from
[16:28 7/1/2014 RFS-hht077.tex] Page: 422 404–453
The Review of Financial Studies / v 27 n 2 2014
Consequently, banks with large trading assets quite clearly allocated much moreof their securities holdings to highly rated tranches.
3. Bank Risk and Holdings of Highly Rated Tranches
In this section, using traditional measures of bank risk, we first examine whetherthe banks with higher holdings of highly rated tranches were riskier before thecrisis. We then turn to an assessment of whether the banks with higher holdingsperformed worse during the crisis.
3.1 Holdings of highly rated tranches and bank risk before the crisisWe investigate whether holdings of highly rated tranches were correlated withcommon proxies of bank risk before the crisis. If holdings were a reflectionof a bank’s willingness to take more risk, we would expect a bank with largerholdings to be riskier along a number of different dimensions. Note that we arenot arguing that the holdings themselves would increase the risk measures ofbanks. At the time, highly rated tranches of securitizations were considered tobe assets with extremely low risk, so that they would not have impacted riskmeasures in a meaningful way. However, if banks that were willing to takemore risk held these highly rated tranches, then we should expect banks withmore highly rated tranches to be more risky.
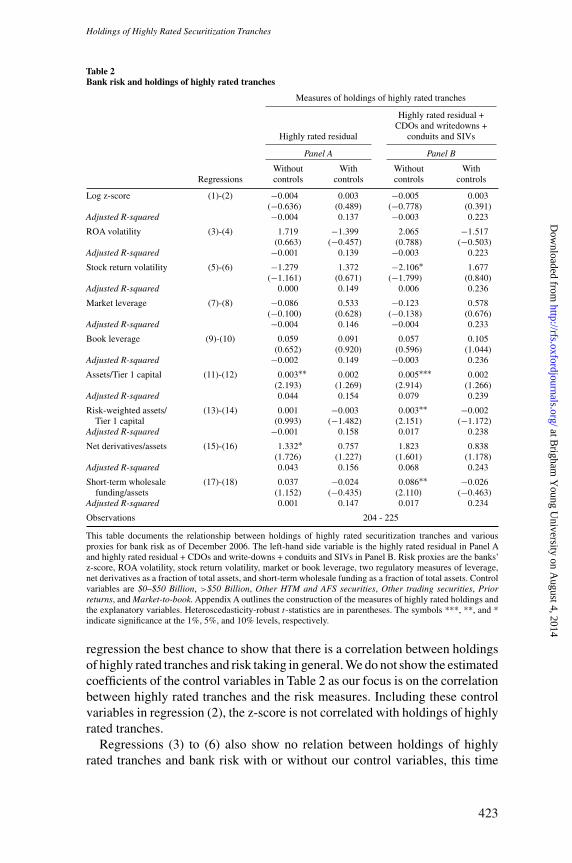
In Panel A of Table 2, we present results using the Highly rated residualmeasure of highly rated tranches as of 2006 year-end. Our first measure of riskis the bank z-score. The bank z-score (see Boyd, Graham, and Hewitt (1993)and Laeven and Levine (2009)) is measured as the ratio of the return on assetsplus the capital-asset ratio divided by the standard deviation of the return onassets. In other words, it is a measure of distance-to-default. The numerator ismeasured as of the end of 2006, whereas the volatility in the denominator iscalculated using the prior six years’return on assets.Ahigher distance-to-defaultmeans that a larger negative return is required to render the bank insolvent.Regression (1) shows that there is no relation between the z-score and holdingsof highly rated tranches. Regression (2) adds several control variables to theregression. We control for bank attributes, such as the bank’s stock returnsover the previous year, the market-to-book ratio, “other” holdings of held-to-maturity and available-for-sale securities, and “other” trading securities.19 Wealso include two control variables for bank size. We allow the slope in therelation between highly rated holdings and bank asset size to differ for assetsabove $50 billion as a simple way to capture the effect of being too-big-to-failon holdings.20 These controls are admittedly limited, but we want to give the
19 The term “other” securities generally refers to holdings of government, agency, and non-highly-rated private-label securities. The Appendix contains a precise description of securities included in our measures of “other”H.T.M. and A.F.S. securities and “other” trading securities.
20 Banks with assets greater than $50 billion are treated differently under the Dodd-Frank Wall Street Reform andConsumer Protection Act.
422
at Brigham
Young U
niversity on August 4, 2014
http://rfs.oxfordjournals.org/D
ownloaded from
[16:28 7/1/2014 RFS-hht077.tex] Page: 423 404–453
Holdings of Highly Rated Securitization Tranches
Table 2Bank risk and holdings of highly rated tranches
Measures of holdings of highly rated tranches
Highly rated residual +CDOs and writedowns +
Highly rated residual conduits and SIVs
Panel A Panel B
Without With Without WithRegressions controls controls controls controls
Log z-score (1)-(2) −0.004 0.003 −0.005 0.003(−0.636) (0.489) (−0.778) (0.391)
Adjusted R-squared −0.004 0.137 −0.003 0.223
ROA volatility (3)-(4) 1.719 −1.399 2.065 −1.517(0.663) (−0.457) (0.788) (−0.503)
Adjusted R-squared −0.001 0.139 −0.003 0.223
Stock return volatility (5)-(6) −1.279 1.372 −2.106∗ 1.677(−1.161) (0.671) (−1.799) (0.840)
Adjusted R-squared 0.000 0.149 0.006 0.236
Market leverage (7)-(8) −0.086 0.533 −0.123 0.578(−0.100) (0.628) (−0.138) (0.676)
Adjusted R-squared −0.004 0.146 −0.004 0.233
Book leverage (9)-(10) 0.059 0.091 0.057 0.105(0.652) (0.920) (0.596) (1.044)
Adjusted R-squared −0.002 0.149 −0.003 0.236
Assets/Tier 1 capital (11)-(12) 0.003∗∗ 0.002 0.005∗∗∗ 0.002(2.193) (1.269) (2.914) (1.266)
Adjusted R-squared 0.044 0.154 0.079 0.239
Risk-weighted assets/ (13)-(14) 0.001 −0.003 0.003∗∗ −0.002Tier 1 capital (0.993) (−1.482) (2.151) (−1.172)
Adjusted R-squared −0.001 0.158 0.017 0.238
Net derivatives/assets (15)-(16) 1.332∗ 0.757 1.823 0.838(1.726) (1.227) (1.601) (1.178)
Adjusted R-squared 0.043 0.156 0.068 0.243
Short-term wholesale (17)-(18) 0.037 −0.024 0.086∗∗ −0.026funding/assets (1.152) (−0.435) (2.110) (−0.463)
Adjusted R-squared 0.001 0.147 0.017 0.234
Observations 204 - 225
This table documents the relationship between holdings of highly rated securitization tranches and variousproxies for bank risk as of December 2006. The left-hand side variable is the highly rated residual in Panel Aand highly rated residual + CDOs and write-downs + conduits and SIVs in Panel B. Risk proxies are the banks’z-score, ROA volatility, stock return volatility, market or book leverage, two regulatory measures of leverage,net derivatives as a fraction of total assets, and short-term wholesale funding as a fraction of total assets. Controlvariables are $0–$50 Billion, >$50 Billion, Other HTM and AFS securities, Other trading securities, Priorreturns, and Market-to-book. Appendix A outlines the construction of the measures of highly rated holdings andthe explanatory variables. Heteroscedasticity-robust t-statistics are in parentheses. The symbols ***, **, and *indicate significance at the 1%, 5%, and 10% levels, respectively.
regression the best chance to show that there is a correlation between holdingsof highly rated tranches and risk taking in general. We do not show the estimatedcoefficients of the control variables in Table 2 as our focus is on the correlationbetween highly rated tranches and the risk measures. Including these controlvariables in regression (2), the z-score is not correlated with holdings of highlyrated tranches.
Regressions (3) to (6) also show no relation between holdings of highlyrated tranches and bank risk with or without our control variables, this time
423
at Brigham
Young U
niversity on August 4, 2014
http://rfs.oxfordjournals.org/D
ownloaded from

[16:28 7/1/2014 RFS-hht077.tex] Page: 424 404–453
The Review of Financial Studies / v 27 n 2 2014
using the standard deviations of the return on assets or the stock return duringthe year 2006 as proxies. We turn next to measures of leverage. Again, wefind no significance whether we use market leverage or book leverage (seeregressions (7)–(10)). When we use a version of the regulatory leverage ratio,defined as the ratio of assets to Tier 1 capital, we find a positive relation withholdings of highly rated tranches (see regression (11)). But this relation becomesinsignificant when we add our controls in regression (12). In regressions (13)and (14), we use another regulatory measure of risk, namely, the ratio of risk-weighted assets to Tier 1 capital. For a given asset size and regulatory capital,a bank that holds riskier assets with higher regulatory weights would have alarger amount of risk-weighted assets. The coefficient for this risk proxy is notsignificantly different from zero, and its sign is even negative when we includecontrol variables.
So far, we have seen no significant relation between bank risk and holdingsof highly rated tranches before the crisis. Next, we use a measure of creditderivatives because these derivatives can be used by banks to hedge theircredit exposures. Using the measure we discussed in Section 2.1, namely, thedifference between protection bought and protection sold divided by assets,we find that banks that bought more protection in the credit derivativesmarkets had larger holdings of highly rated tranches (see regression (15)).The coefficient becomes insignificant when we add our control variables inregression (16). Lastly, we use the ratio of short-term wholesale funding asa fraction of total assets as another measure of risk and do not find anysignificant correlation with holdings (see regressions (17) and (18) of Table 2,Panel A).
In Panel B of Table 2, we present results for the set of risk proxiesusing our broadest measure of highly rated tranches, Highly rated residual+ CDOs and writedowns + conduits and SIVs, as the left-hand side variable.In specifications without control variables, both measures of regulatory capital(Assets/Tier 1 capital and Risk-weighted assets/Tier 1 capital) and short-termwholesale funding/assets have positive and significant coefficients, whereasthe Stock return volatility variable has a negative and significant coefficient. Inspecifications including control variables, we find no significance.
A concern with our size variables is that they themselves might reflect risktaking because, for a given amount of equity, banks with more leverage willhave more assets. To alleviate this concern, we re-estimate our regressions withonly the number of employees as a control variable. The number of employeescontrols for size, but it is unlikely to reflect a bank’s risk taking. We find thatour results remain similar. Overall, there is no systematic evidence that banksthat held more highly rated tranches were riskier ahead of the crisis. Withoutcontrolling for other bank characteristics, there is some evidence that thesebanks had more regulatory leverage and more short-term funding. However,this evidence no longer holds as soon as we control for a small set of bankcharacteristics.
424
at Brigham
Young U
niversity on August 4, 2014
http://rfs.oxfordjournals.org/D
ownloaded from

[16:28 7/1/2014 RFS-hht077.tex] Page: 425 404–453
Holdings of Highly Rated Securitization Tranches
3.2 Holdings of highly rated tranches and bank stock returns duringthe crisis
Banks with higher holdings of highly rated tranches did not appear to havehigher risk before the crisis. We now turn to whether they had higher risk ex post,in that they performed worse during the crisis. We do not investigate whetherhigher holdings caused worse performance; rather we look at whether or notbanks that had higher holdings also performed worse ex post. We calculate eachbank’s buy-and-hold excess return over the equally weighted market return forthe time period of July 1, 2007 through December 31, 2008. We then regressthese buy-and-hold stock returns on the five different BHC-specific measures ofhighly rated tranches holdings as of December 31, 2006.To account for potentialnonlinearities in the relation between these holdings and stock returns, we sortfirms into quintiles based on their holdings and construct dummy variables forbanks in each quintile. The quintile with the lowest amount of highly ratedholdings serves as the base group. We expect banks in the highest quintilesof highly rated tranches holdings as of December 2006 to be associated withlower stock returns during the subsequent financial crisis.
We control for bank attributes, such as the bank’s market capitalization, priorstock returns, market-to-book, and a regulatory-capital leverage measure (theratio of assets to Tier 1 capital), that are likely to influence stock returns. Again,we control for “other” securities’ holdings of held-to-maturity and available-for-sale securities and “other” trading securities in all regressions. We include asindependent variables measures of a bank’s real estate as well as commercialand industrial (C&I) loan exposure in the form of mortgage and C&I loans,scaled by total assets. Banks also had unused commitments to make residentialand commercial real-estate loans. Following Loutskina and Strahan (2011), wecontrol explicitly for such unused loan commitments.
We present the results in Table 3. Firms in the top quintile of highly ratedtranches holdings are associated with about 14% lower buy-and-hold excessstock returns during the crisis, on average. For banks in the top quintile, theaverage of the ratio of holdings of highly rated tranches to equity marketcapitalization at the end of 2006 is 29.63% (the median is 17.02%). Thelower stock returns we document are therefore consistent with the size of theholdings and the magnitude of losses on highly rated tranches that have beendocumented. For instance, the on-the-run ABX index for AAA tranches fellby more than 50% during that period of time, so that a bank holding 29.63%of its capitalization in highly rated tranches would have lost at least 15% ofits equity market capitalization. However, it is important to remember thatour measures include holdings of nonsubprime ABS, which performed betterduring the crisis, and we cannot tell how important these holdings were. Thenegative coefficient on the top quintile is statistically significant for all measuresof highly rated tranches, except for the bottom-up measure. The impact ofhighly rated tranches holdings on stock returns is lower for banks that have lowholdings. Banks in the second highest quintile of holdings experienced 2% to
425
at Brigham
Young U
niversity on August 4, 2014
http://rfs.oxfordjournals.org/D
ownloaded from

[16:28 7/1/2014 RFS-hht077.tex] Page: 426 404–453
The Review of Financial Studies / v 27 n 2 2014
Table 3Holdings of highly rated tranches and bank holding company stock returns
Measures of holdings of highly rated tranches
HighlyHighly rated residual +
Highly rated CDOs and Bottom-UpHighly rated residual + writedowns + highlyrated residual CDOs and conduits rated
residual + CDOs writedowns and SIVs tranches
(1) (2) (3) (4) (5)
80th %tile - 100th%tile highly −0.134∗∗ −0.134∗∗ −0.138∗∗ −0.143∗∗ −0.080rated tranche holdings indicator (−2.249) (−2.249) (−2.301) (−2.338) (−1.227)
60th %tile - 80th%tile highly −0.107 −0.107 −0.114 −0.127∗ −0.064rated tranche holdings indicator (−1.439) (−1.439) (−1.535) (−1.738) (−0.912)
40th %tile - 60th%tile highly −0.096 −0.096 −0.088 −0.075 −0.010rated tranche holdings indicator (−1.467) (−1.467) (−1.354) (−1.174) (−0.165)
20th %tile - 40th%tile highly −0.095 −0.095 −0.095 −0.095 0.086rated tranche holdings indicator (−0.999) (−0.999) (−0.992) (−0.996) (0.862)
Unused loan commitments −1.363∗∗ −1.363∗∗ −1.362∗∗ −1.357∗∗ −1.268∗∗(−2.396) (−2.396) (−2.383) (−2.378) (−2.191)
Mortgage loans as % of total assets −0.786∗∗ −0.786∗∗ −0.784∗∗ −0.789∗∗ −0.805∗∗(−2.266) (−2.266) (−2.283) (−2.284) (−2.243)
C&I loans as % of total assets −0.808∗ −0.808∗ −0.818∗ −0.838∗∗ −0.851∗∗(−1.921) (−1.921) (−1.970) (−2.031) (−2.065)
“Other” H.T.M. and A.F.S. securities 0.604 0.604 0.609 0.599 0.616(1.441) (1.441) (1.459) (1.421) (1.413)
“Other” trading securities −2.645∗ −2.645∗ −2.616∗ −2.598∗ −2.558∗(−1.764) (−1.764) (−1.766) (−1.706) (−1.712)
Log market cap −0.005 −0.005 −0.004 −0.002 −0.008(−0.227) (−0.227) (−0.190) (−0.104) (−0.397)
Prior returns 0.149 0.149 0.150 0.151 0.156(0.960) (0.960) (0.968) (0.975) (1.008)
Market-to-book 0.116∗∗∗ 0.116∗∗∗ 0.115∗∗∗ 0.115∗∗∗ 0.110∗∗∗(3.223) (3.223) (3.217) (3.226) (3.046)
Assets/ Tier 1 capital 0.002 0.002 0.002 0.002 0.001(0.151) (0.151) (0.166) (0.149) (0.0926)
Constant 0.437 0.437 0.420 0.394 0.485(0.745) (0.745) (0.716) (0.677) (0.785)
Observations 218 218 218 218 218Adjusted R-squared 0.235 0.235 0.236 0.237 0.225
This table documents the relationship between BHC stock returns and holdings of highly rated tranches as ofDecember 2006. The dependent variable is buy-and-hold excess return over the equally weighted market returnfrom July 1, 2007 through December 31, 2008. Each regression uses a different measure of highly rated +holdings.Appendix A outlines the construction of the measures of highly rated holdings, as well as the definitions of themain explanatory variables and control variables. Heteroscedasticity-robust t-statistics are in parentheses. Thesymbols ***, **, and * indicate significance at the 1%, 5%, and 10% levels, respectively.
3% higher stock returns than did the banks in the top quintile. The coefficient onthese banks is not statistically different from zero for all measures, except for themeasure that includes holdings in conduits and SIVs as the dependent variable(in Column 4). The coefficients on the lower quintiles are never statisticallysignificant.
As in Loutskina and Strahan (2011), unused loan commitments have asignificantly negative impact on stock returns. As expected, banks with higherexposures to real estate through mortgage and C&I loans had significantly morenegative stock returns. Other HTM andAFS securities are associated with larger
426
at Brigham
Young U
niversity on August 4, 2014
http://rfs.oxfordjournals.org/D
ownloaded from
[16:28 7/1/2014 RFS-hht077.tex] Page: 427 404–453
Holdings of Highly Rated Securitization Tranches
stock returns, as are firms with higher market-to-book ratios. Prior stock returns,market capitalization, and assets over Tier 1 capital do not have significantcoefficients explaining stock returns. Taken together, these results provideevidence that our constructed measures of highly rated tranches holdings areassociated with bank stock return performance. Such a result would follow ifthe performance of these highly rated tranches was unexpected. It would alsofollow if holdings of highly rated tranches were associated with bank attributesthat were generally correlated with poor crisis performance.
4. Why Did Banks Hold Highly Rated Tranches?
In this section, we investigate to what extent the cross-sectional variation inholdings of highly rated tranches is consistent with the hypotheses developedin Section 1 using the estimates of highly rated tranches presented in Section 2.Our typical approach is to estimate regressions in which the dependent variableis highly rated tranches held by a bank, normalized by its assets. When wecan, we address the relevant endogeneity issues. We also are able to presentfalsification tests in some cases. However, not all sources of endogeneity canbe addressed, so that our regressions do not establish causality. Rather, theydocument correlations. If a relevant correlation is consistent with a hypothesisdeveloped in Section 2, this hypothesis gains credibility. If it is not, the burdenof proof should shift to those who favor that hypothesis to show why itshould be taken seriously despite our finding. Notably, a further limitationof our regression analysis is that, as we discussed extensively, our measures ofholdings of highly rated tranches are approximations. Therefore, there mightbe measurement error in our dependent variable. Measurement error shouldnot bias the coefficients in the regression but, everything else equal, it couldreduce the significance of the coefficients.
In all regressions, we control for the return of the bank in 2005–2006, themarket-to-book ratio, assets over Tier 1 capital, and the holdings of othersecurities as of 2006. For the holdings of other securities, we consider separatelyother securities held to maturity and available for sale as well as other tradingsecurities. Because these holdings exclude the highly rated tranches, there isno mechanical relation between these holdings and holdings of highly ratedtranches. Table A2 provides the details of the construction of the explanatoryvariables used in this section.
4.1 Bank size and holdings of highly rated tranchesSeveral hypotheses presented in Section 1 predict a relation between banksize and holdings of highly rated tranches. In particular, the too-big-to-failhypothesis predicts that banks above a given size would hold more highly ratedtranches. Further, banks need a minimum scale to engage in securitization.Therefore, we begin by investigating the relation between bank size andholdings of highly rated tranches. Table 4 shows the medians of highly rated
427
at Brigham
Young U
niversity on August 4, 2014
http://rfs.oxfordjournals.org/D
ownloaded from

[16:28 7/1/2014 RFS-hht077.tex] Page: 428 404–453
The Review of Financial Studies / v 27 n 2 2014
Table 4Median holdings of highly rated tranches by size vigintiles
Median holdings of highly rated tranches by size vigintile (%)
Highly ratedHighly residual +
Highly rated CDOs and Bottom-Up Ratio ofHighly rated residual + writedowns + highly total agencyrated residual CDOs and conduits rated holdings
Size vigintile residual + CDOs writedowns and SIVs tranches to assets
(1) (2) (3) (4) (5) (6)
1 0.00 0.00 0.00 0.00 0.00 10.632 0.00 0.00 0.00 0.00 0.00 11.233 0.76 0.76 0.76 0.76 0.47 12.564 0.00 0.00 0.00 0.00 0.07 11.995 0.03 0.03 0.03 0.03 0.00 12.186 0.18 0.18 0.18 0.18 0.11 15.977 0.05 0.05 0.05 0.05 0.00 8.058 0.05 0.05 0.05 0.05 0.00 12.189 0.00 0.00 0.00 0.00 0.00 12.9010 0.01 0.01 0.01 0.01 0.00 14.4411 0.00 0.00 0.00 0.00 0.00 10.5012 0.10 0.10 0.10 0.10 0.01 8.5013 0.31 0.31 0.31 0.31 0.12 13.5814 0.82 0.82 0.82 0.82 0.33 12.6915 0.72 0.72 0.72 0.72 0.59 13.1516 0.01 0.01 0.01 0.01 0.00 17.6217 0.34 0.34 0.34 0.34 0.45 13.8418 1.54 1.54 1.54 1.54 1.52 11.9619 0.87 0.87 1.34 1.61 0.85 9.0720 1.82 1.82 1.91 4.67 1.98 10.03
This table reports how median holdings of highly rated tranches (in percentages) change across size vigintilesas of December 2006. Each column uses a different measure of holdings: highly rated residual, highly ratedresidual + CDOs, highly rated residual + CDOs and write-downs, highly-rated residual + CDOs + write-downs+ conduits and SIV’s, and bottom-up highly-rated tranches. See Appendix A for the definition of the variables.
tranches holdings for vigintiles. We focus on medians because a few banks areclearly outliers in some vigintiles and influence the mean. Although the medianholdings do not increase monotonically with size across vigintiles, the highestmedian is for the banks in the twentieth vigintile, corresponding to the largestbanks, for all measures. Median holdings exceed 1% only among the threelargest vigintiles. The difference in median holdings between the largest banksand the next largest banks is most dramatic for our broadest measure, whichincludes holdings in conduits and SIVs. For that measure, the median for thelargest banks is 4.67%, whereas it is 1.61% for the next largest banks. The lastcolumn of Table 4 shows the holdings of agency mortgage-backed securities.These holdings are much higher than the holdings of highly rated private-labeltranches for each vigintile. Further, there is no consistent relation between sizeand holdings across size vigintiles for agency securities.
Table 5 presents the results of regressions of holdings of highly rated trancheson various measures of size. We do not show the estimates for the controlvariables. Panel A of Table 5 reports estimates for all measures using thepiecewise nonlinear approach used in Section 3.1. The first variable, named$0–$50 billion, captures the relation between holdings of highly rated tranches
428
at Brigham
Young U
niversity on August 4, 2014
http://rfs.oxfordjournals.org/D
ownloaded from
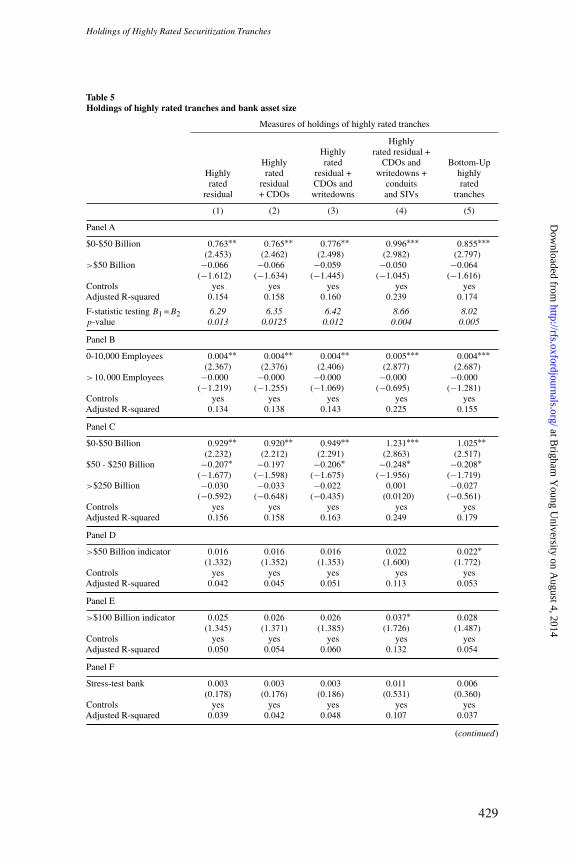
[16:28 7/1/2014 RFS-hht077.tex] Page: 429 404–453
Holdings of Highly Rated Securitization Tranches
Table 5Holdings of highly rated tranches and bank asset size
Measures of holdings of highly rated tranches
HighlyHighly rated residual +
Highly rated CDOs and Bottom-UpHighly rated residual + writedowns + highlyrated residual CDOs and conduits rated
residual + CDOs writedowns and SIVs tranches
(1) (2) (3) (4) (5)
Panel A
$0-$50 Billion 0.763∗∗ 0.765∗∗ 0.776∗∗ 0.996∗∗∗ 0.855∗∗∗(2.453) (2.462) (2.498) (2.982) (2.797)
>$50 Billion −0.066 −0.066 −0.059 −0.050 −0.064(−1.612) (−1.634) (−1.445) (−1.045) (−1.616)
Controls yes yes yes yes yesAdjusted R-squared 0.154 0.158 0.160 0.239 0.174
F-statistic testing B1 =B2 6.29 6.35 6.42 8.66 8.02p-value 0.013 0.0125 0.012 0.004 0.005
Panel B
0-10,000 Employees 0.004∗∗ 0.004∗∗ 0.004∗∗ 0.005∗∗∗ 0.004∗∗∗(2.367) (2.376) (2.406) (2.877) (2.687)
>10,000 Employees −0.000 −0.000 −0.000 −0.000 −0.000(−1.219) (−1.255) (−1.069) (−0.695) (−1.281)
Controls yes yes yes yes yesAdjusted R-squared 0.134 0.138 0.143 0.225 0.155
Panel C
$0-$50 Billion 0.929∗∗ 0.920∗∗ 0.949∗∗ 1.231∗∗∗ 1.025∗∗(2.232) (2.212) (2.291) (2.863) (2.517)
$50 - $250 Billion −0.207∗ −0.197 −0.206∗ −0.248∗ −0.208∗(−1.677) (−1.598) (−1.675) (−1.956) (−1.719)
>$250 Billion −0.030 −0.033 −0.022 0.001 −0.027(−0.592) (−0.648) (−0.435) (0.0120) (−0.561)
Controls yes yes yes yes yesAdjusted R-squared 0.156 0.158 0.163 0.249 0.179
Panel D
>$50 Billion indicator 0.016 0.016 0.016 0.022 0.022∗(1.332) (1.352) (1.353) (1.600) (1.772)
Controls yes yes yes yes yesAdjusted R-squared 0.042 0.045 0.051 0.113 0.053
Panel E
>$100 Billion indicator 0.025 0.026 0.026 0.037∗ 0.028(1.345) (1.371) (1.385) (1.726) (1.487)
Controls yes yes yes yes yesAdjusted R-squared 0.050 0.054 0.060 0.132 0.054
Panel F
Stress-test bank 0.003 0.003 0.003 0.011 0.006(0.178) (0.176) (0.186) (0.531) (0.360)
Controls yes yes yes yes yesAdjusted R-squared 0.039 0.042 0.048 0.107 0.037
(continued)
429
at Brigham
Young U
niversity on August 4, 2014
http://rfs.oxfordjournals.org/D
ownloaded from
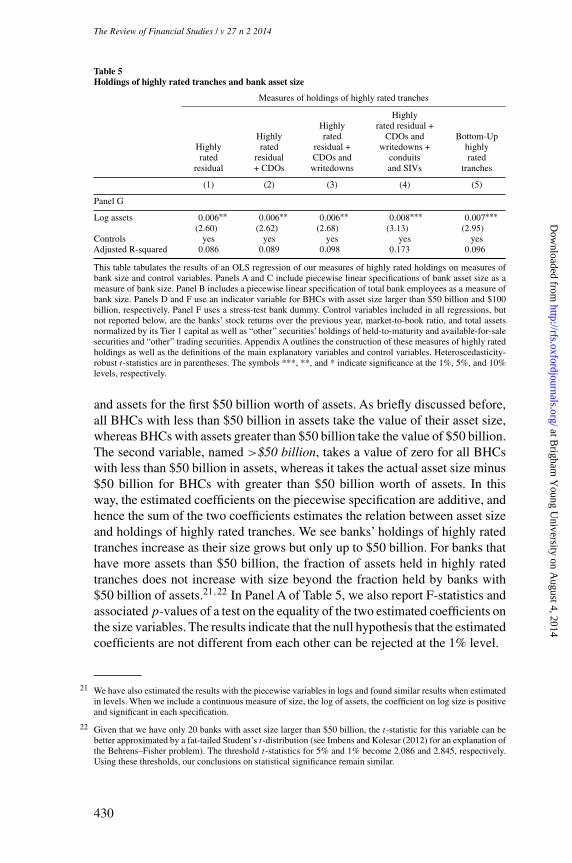
[16:28 7/1/2014 RFS-hht077.tex] Page: 430 404–453
The Review of Financial Studies / v 27 n 2 2014
Table 5Holdings of highly rated tranches and bank asset size
Measures of holdings of highly rated tranches
HighlyHighly rated residual +
Highly rated CDOs and Bottom-UpHighly rated residual + writedowns + highlyrated residual CDOs and conduits rated
residual + CDOs writedowns and SIVs tranches
(1) (2) (3) (4) (5)
Panel G
Log assets 0.006∗∗ 0.006∗∗ 0.006∗∗ 0.008∗∗∗ 0.007∗∗∗(2.60) (2.62) (2.68) (3.13) (2.95)
Controls yes yes yes yes yesAdjusted R-squared 0.086 0.089 0.098 0.173 0.096
This table tabulates the results of an OLS regression of our measures of highly rated holdings on measures ofbank size and control variables. Panels A and C include piecewise linear specifications of bank asset size as ameasure of bank size. Panel B includes a piecewise linear specification of total bank employees as a measure ofbank size. Panels D and F use an indicator variable for BHCs with asset size larger than $50 billion and $100billion, respectively. Panel F uses a stress-test bank dummy. Control variables included in all regressions, butnot reported below, are the banks’ stock returns over the previous year, market-to-book ratio, and total assetsnormalized by its Tier 1 capital as well as “other” securities’ holdings of held-to-maturity and available-for-salesecurities and “other” trading securities. Appendix A outlines the construction of these measures of highly ratedholdings as well as the definitions of the main explanatory variables and control variables. Heteroscedasticity-robust t-statistics are in parentheses. The symbols ***, **, and * indicate significance at the 1%, 5%, and 10%levels, respectively.
and assets for the first $50 billion worth of assets. As briefly discussed before,all BHCs with less than $50 billion in assets take the value of their asset size,whereas BHCs with assets greater than $50 billion take the value of $50 billion.The second variable, named >$50 billion, takes a value of zero for all BHCswith less than $50 billion in assets, whereas it takes the actual asset size minus$50 billion for BHCs with greater than $50 billion worth of assets. In thisway, the estimated coefficients on the piecewise specification are additive, andhence the sum of the two coefficients estimates the relation between asset sizeand holdings of highly rated tranches. We see banks’ holdings of highly ratedtranches increase as their size grows but only up to $50 billion. For banks thathave more assets than $50 billion, the fraction of assets held in highly ratedtranches does not increase with size beyond the fraction held by banks with$50 billion of assets.21,22 In Panel A of Table 5, we also report F-statistics andassociated p-values of a test on the equality of the two estimated coefficients onthe size variables. The results indicate that the null hypothesis that the estimatedcoefficients are not different from each other can be rejected at the 1% level.
21 We have also estimated the results with the piecewise variables in logs and found similar results when estimatedin levels. When we include a continuous measure of size, the log of assets, the coefficient on log size is positiveand significant in each specification.
22 Given that we have only 20 banks with asset size larger than $50 billion, the t-statistic for this variable can bebetter approximated by a fat-tailed Student’s t-distribution (see Imbens and Kolesar (2012) for an explanation ofthe Behrens–Fisher problem). The threshold t-statistics for 5% and 1% become 2.086 and 2.845, respectively.Using these thresholds, our conclusions on statistical significance remain similar.
430
at Brigham
Young U
niversity on August 4, 2014
http://rfs.oxfordjournals.org/D
ownloaded from

[16:28 7/1/2014 RFS-hht077.tex] Page: 431 404–453
Holdings of Highly Rated Securitization Tranches
An obvious concern is that asset size could be endogenous.As a bank switchesfrom corporate bonds to highly rated tranches, its asset size increases if itmakes full use of its existing regulatory capital. In Panel B of Table 5, we usethe number of employees as our measure of size because none of the theorieswe discussed in Section 2 imply that holding more highly rated tranches isassociated with having more employees. We see that holdings of highly ratedtranches increase with the number of employees but do not increase more forbanks with more than 10,000 employees.
With any attempt to estimate a nonlinear relation, one has to be concernedabout whether the results are sensitive to the formulation. We do not tabulate theresult, but when we use $100 billion as the inflexion point, we find that holdingsincrease with asset size less than $100 billion, but not with assets larger than$100 billion. Next, in Panel C of Table 5, we allow for a formulation with twoinflexion points, one at $50 billion and one at $250 billion. We see no evidencethat holdings increase more with assets for banks with holdings in excess of$250 billion. Further, we find that holdings decrease significantly when assetsrange between $50 billion and $250 billion for four of our measures. A finalexercise using asset size is to use an indicator variable for banks with assets inexcess of $50 billion or of $100 billion. When we use the indicator variable at$50 billion, our results show a positive and weakly significant relationship withour “bottom-up” measure of holdings, but not for the other measures of holdings(results presented in Panel D of Table 5). When we use the indicator variable forbanks with assets in excess of $100 billion, we find that the coefficient on ourbroadest measure of holdings is positive and statistically significant at the 10%level, but the coefficients for the other measures are not significantly differentfrom zero. Results are presented in Panel E of Table 5. A final approach toidentify too-big-to-fail banks is to use the banks that were required to performstress tests at the beginning of 2009. Panel F of Table 5 shows that these banksdid not hold more highly rated tranches than did other banks.
Banks hold securities for liquidity purposes. We would expect large banksto hold fewer securities relative to assets than smaller banks do because thereare economies of scale in the optimal size of liquidity buffers. Because of theseeconomies of scale, increases in size beyond some level might not be associatedwith increases in the liquidity buffers. We find evidence consistent with thisexplanation. When we estimate our regressions using U.S. Treasuries insteadof highly rated tranches (in untabulated results), we find the same relation.Hence, the demand for securities viewed as safe securities before the crisisexhibited the same pattern with respect to size, whether these securities wereU.S. Treasuries or highly rated tranches of securitizations.
In summary, there is a relation between size and holdings of highly ratedtranches. However, that relation is nonlinear, and there is no evidence that it isstronger for the largest banks. For most regressions, the results are insensitiveto the measure of holdings we use. Therefore, for most measures, there is noevidence that more systemically important or so-called too-big-to-fail banks
431
at Brigham
Young U
niversity on August 4, 2014
http://rfs.oxfordjournals.org/D
ownloaded from

[16:28 7/1/2014 RFS-hht077.tex] Page: 432 404–453
The Review of Financial Studies / v 27 n 2 2014
held more highly rated tranches as a fraction of their assets. In regressionsusing indicator variables for assets in excess of $50 billion or in excess of $100billion, these indicator variables are not significant for most of our measures.There is, however, some evidence that banks with more than $100 billionof assets held more highly rated tranches when we use the broader measurethat treats SIVs as holdings of highly rated tranches. This evidence suggeststhat off-balance sheet vehicles may have played a unique role in holdings ofhighly rated tranches for the largest banks. Though holdings of these tranchesthrough SIVs were undoubtedly a form of regulatory arbitrage, how theycould have been the result of the incentives created by too-big-to-fail is notat all clear.
4.2 Securitization by-product hypothesisWe estimate the relation between holdings of the highly rated tranches as ofDecember 31, 2006, and banks’ securitization activity. We define a BHC asbeing securitization-active if the outstanding principal balance of assets soldand securitized with servicing retained or with recourse or other seller-providedcredit enhancements is nonzero in any of the years 2003, 2004, 2005, or 2006.According to this definition, forty-nine BHCs in our sample are active insecuritization as of December 31, 2006. Regressions, including the piecewisesize variables and the standard set of controls employed in previous tables,are presented in Table 6. An important issue with these regressions is thatsome of our hypotheses apply more directly to holdings of tranches of its ownsecuritizations by a given bank. Available data do not allow us to separateholdings of highly rated tranches issued by the bank from tranches purchasedby the bank. Therefore, for some of our securitization hypotheses, our tests aresubject to an additional measurement error in the left-hand side variable.
We estimate regressions of holdings of highly rated tranches on bankcharacteristics and an indicator variable for securitization-active banks. InTable 6, we report estimates in Columns (1) and (2), where we use the Highlyrated residual and the Highly rated residual + CDOs and writedowns + conduitsand SIVs measures of highly rated tranches. The securitization-active indicatorvariable has a significant positive coefficient in both regressions. The coefficienton the indicator variable is 0.015 in the first specification, so that these bankshold 1.5% more of their assets in the form of highly rated tranches. Suchan effect is economically significant because the standard deviation of highlyrated tranches holdings is 3.1%. The estimated coefficients on the stepwisesize variables are diminished, but not wholly subsumed, by the presence of thesecuritization-active indicator, suggesting that securitization activity is not amanifestation of asset size alone. The results in the second specification, wherethe dependent variable includes CDOs, writedowns, and off-balance sheetconduits, are similar to those reported in Column (1). The regression estimatesfor other measures of highly rated tranches—that are not reported—are verysimilar to those reported in Columns (1) and (2).
432
at Brigham
Young U
niversity on August 4, 2014
http://rfs.oxfordjournals.org/D
ownloaded from
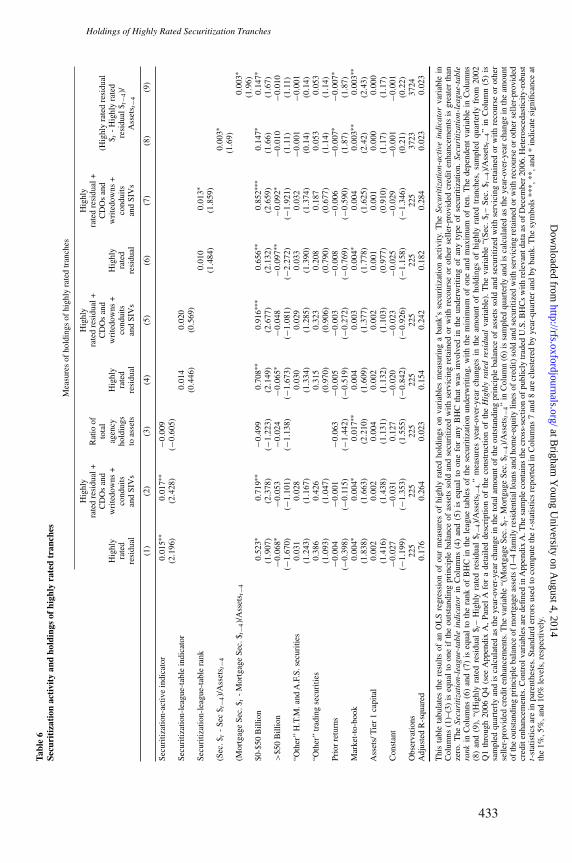
[16:28 7/1/2014 RFS-hht077.tex] Page: 433 404–453
Holdings of Highly Rated Securitization TranchesTa
ble
6Se
curi
tiza
tion
acti
vity
and
hold
ings
ofhi
ghly
rate
dtr
anch
es
Mea
sure
sof
hold
ings
ofhi
ghly
rate
dtr
anch
es
Hig
hly
Hig
hly
Hig
hly
rate
dre
sidu
al+
Rat
ioof
rate
dre
sidu
al+
rate
dre
sidu
al+
CD
Os
and
tota
lC
DO
san
dC
DO
san
d(H
ighl
yra
ted
resi
dual
Hig
hly
wri
tedo
wns
+ag
ency
Hig
hly
wri
tedo
wns
+H
ighl
yw
rite
dow
ns+
$ t-
Hig
hly
rate
dra
ted
cond
uits
hold
ings
rate
dco
ndui
tsra
ted
cond
uits
resi
dual
$ t−4
)/re
sidu
alan
dSI
Vs
toas
sets
resi
dual
and
SIV
sre
sidu
alan
dSI
Vs
Ass
ets t
−4(1
)(2
)(3
)(4
)(5
)(6
)(7
)(8
)(9
)
Secu
ritiz
atio
n-ac
tive
indi
cato
r0.
015∗
∗0.
017∗
∗−0
.009
(2.1
96)
(2.4
28)
(−0.
605)
Secu
ritiz
atio
n-le
ague
-tab
lein
dica
tor
0.01
40.
020
(0.4
46)
(0.5
69)
Secu
ritiz
atio
n-le
ague
-tab
lera
nk0.
010
0.01
3∗(1
.484
)(1
.859
)(S
ec.$
t-
Sec
$ t−4
)/A
sset
s t−4
0.00
3∗(1
.69)
(Mor
tgag
eSe
c.$ t
-M
ortg
age
Sec.
$ t−4
)/A
sset
s t−4
0.00
3∗(1
.96)
$0-$
50B
illio
n0.
523∗
0.71
9∗∗
−0.4
990.
708∗
∗0.
916∗
∗∗0.
656∗
∗0.
852∗
∗∗0.
147∗
0.14
7∗(1
.907
)(2
.378
)(−
1.22
3)(2
.149
)(2
.677
)(2
.132
)(2
.659
)(1
.66)
(1.6
7)>
$50
Bill
ion
−0.0
68∗
−0.0
53−0
.024
−0.0
65∗
−0.0
48−0
.097
∗∗−0
.092
∗−0
.010
−0.0
10(−
1.67
0)(−
1.10
1)(−
1.13
8)(−
1.67
3)(−
1.08
1)(−
2.27
2)(−
1.92
1)(1
.11)
(1.1
1)“O
ther
”H
.T.M
.and
A.F
.S.s
ecur
ities
0.03
10.
028
0.03
00.
029
0.03
30.
032
−0.0
01−0
.001
(1.2
43)
(1.1
67)
(1.3
34)
(1.2
85)
(1.3
90)
(1.3
74)
(0.1
4)(0
.14)
“Oth
er”
trad
ing
secu
ritie
s0.
386
0.42
60.
315
0.32
30.
208
0.18
70.
053
0.05
3(1
.093
)(1
.047
)(0
.970
)(0
.906
)(0
.790
)(0
.677
)(1
.14)
(1.1
4)Pr
ior
retu
rns
−0.0
04−0
.001
−0.0
63−0
.005
−0.0
03−0
.008
−0.0
06−0
.007
∗−0
.007
∗(−
0.39
8)(−
0.11
5)(−
1.44
2)(−
0.51
9)(−
0.27
2)(−
0.76
9)(−
0.59
0)(1
.87)
(1.8
7)M
arke
t-to
-boo
k0.
004∗
0.00
4∗0.
017∗
∗0.
004
0.00
30.
004∗
0.00
40.
003∗
∗0.
003∗
∗(1
.838
)(1
.663
)(2
.210
)(1
.609
)(1
.377
)(1
.778
)(1
.625
)(2
.42)
(2.4
3)A
sset
s/T
ier
1ca
pita
l0.
002
0.00
20.
004
0.00
20.
002
0.00
10.
001
0.00
00.
000
(1.4
16)
(1.4
38)
(1.1
31)
(1.1
32)
(1.1
03)
(0.9
77)
(0.9
10)
(1.1
7)(1
.17)
Con
stan
t−0
.027
−0.0
310.
127
−0.0
20−0
.023
−0.0
25−0
.029
−0.0
01−0
.001
(−1.
199)
(−1.
353)
(1.5
55)
(−0.
842)
(−0.
926)
(−1.
158)
(−1.
346)
(0.2
1)(0
.22)
Obs
erva
tions
225
225
225
225
225
225
225
3723
3724
Adj
uste
dR
-squ
ared
0.17
60.
264
0.02
30.
154
0.24
20.
182
0.28
40.
023
0.02
3
Thi
sta
ble
tabu
late
sth
ere
sults
ofan
OL
Sre
gres
sion
ofou
rm
easu
res
ofhi
ghly
rate
dho
ldin
gson
vari
able
sm
easu
ring
aba
nk’s
secu
ritiz
atio
nac
tivit
y.T
heSe
curi
tiza
tion
-act
ive
indi
cato
rva
riab
lein
Col
umns
(1)–
(3)
iseq
ual
toon
eif
the
outs
tand
ing
prin
cipl
eba
lanc
eof
asse
tsso
ldan
dse
curi
tized
with
serv
icin
gre
tain
edor
with
reco
urse
orot
her
selle
r-pr
ovid
edcr
edit
enha
ncem
ents
isgr
eate
rth
anze
ro.
The
Secu
riti
zati
on-l
eagu
e-ta
ble
indi
cato
rin
Col
umns
(4)
and
(5)
iseq
ual
toon
efo
ran
yB
HC
that
was
invo
lved
inth
eun
derw
ritin
gof
any
type
ofse
curi
tizat
ion.
Secu
riti
zati
on-l
eagu
e-ta
ble
rank
inC
olum
ns(6
)an
d(7
)is
equa
lto
the
rank
ofB
HC
inth
ele
ague
tabl
esof
the
secu
ritiz
atio
nun
derw
ritin
g,w
ithth
em
inim
umof
one
and
max
imum
ofte
n.T
hede
pend
ent
vari
able
inC
olum
ns(8
)an
d(9
),“(
Hig
hly
rate
dre
sidu
al$ t
–H
ighl
yra
ted
resi
dual
$ t−4
)/A
sset
s t−4
,”m
easu
res
year
-ove
r-ye
arch
ange
sin
the
amou
ntof
hold
ings
ofhi
ghly
rate
dtr
anch
es,
sam
pled
quar
terl
yfr
om20
02Q
1th
roug
h20
06Q
4(s
eeA
ppen
dix
A,
Pane
lA
for
ade
taile
dde
scri
ptio
nof
the
cons
truc
tion
ofth
eH
ighl
yra
ted
resi
dual
vari
able
).T
heva
riab
le“(
Sec.
$ t–
Sec.
$ t−4
)/A
sset
s t−4
”in
Col
umn
(5)
issa
mpl
edqu
arte
rly
and
isca
lcul
ated
asth
eye
ar-o
ver-
year
chan
gein
the
tota
lam
ount
ofth
eou
tsta
ndin
gpr
inci
ple
bala
nce
ofas
sets
sold
and
secu
riti
zed
with
serv
icin
gre
tain
edor
with
reco
urse
orot
her
selle
r-pr
ovid
edcr
edit
enha
ncem
ents
.The
vari
able
“(M
ortg
age
Sec.
$ t-
Mor
tgag
eSe
c.$ t
−4)/
Ass
ets t
−4”
inC
olum
n(6
)is
sam
pled
quar
terl
yan
dis
calc
ulat
edas
the
year
-ove
r-ye
arch
ange
inth
eam
ount
ofth
eou
tsta
ndin
gpr
inci
ple
bala
nce
ofm
ortg
age
asse
ts(1
–4fa
mily
resi
dent
iall
oans
and
hom
e-eq
uity
lines
ofcr
edit)
sold
and
secu
ritiz
edw
ithse
rvic
ing
reta
ined
orw
ithre
cour
seor
othe
rse
ller-
prov
ided
cred
iten
hanc
emen
ts.C
ontr
olva
riab
les
are
defin
edin
App
endi
xA
.The
sam
ple
cont
ains
the
cros
s-se
ctio
nof
publ
icly
trad
edU
.S.B
HC
sw
ithre
leva
ntda
taas
ofD
ecem
ber
2006
.Het
eros
ceda
stic
ity-r
obus
tt-
stat
istic
sar
ein
pare
nthe
ses.
Stan
dard
erro
rsus
edto
com
pute
the
t-st
atis
tics
repo
rted
inC
olum
ns7
and
8ar
ecl
uste
red
byye
ar-q
uart
eran
dby
bank
.The
sym
bols
***,
**,a
nd*
indi
cate
sign
ifica
nce
atth
e1%
,5%
,and
10%
leve
ls,r
espe
ctiv
ely.
433
at Brigham
Young U
niversity on August 4, 2014
http://rfs.oxfordjournals.org/D
ownloaded from

[16:28 7/1/2014 RFS-hht077.tex] Page: 434 404–453
The Review of Financial Studies / v 27 n 2 2014
In Regression (3) of Table 6, we provide a falsification test. The securitizationhypothesis does not predict a relation between securitization activity andholdings of agency mortgage-backed securities.We therefore regress the ratio oftotal agency holdings to assets on the control variables and on the securitization-active indicator. The coefficient on the securitization active indicator is notstatistically significantly different from zero in explaining holdings of agencysecurities.
The measure of securitization we use is a measure based on a bank’sown securitization activities. Alternatively, we could use a measure of theparticipation of banks in the underwriting of securitizations. To do so, wecreate an indicator variable for any BHC that shows up in the underwriter leaguetables of any type of securitizations, including subprime RMBSs, CLOs, CBOs,and CDOs (“Securitization-league-table indicator”).23 Out of 231 banks in ourDecember 2006 sample, ten banks meet the criterion. We show the regressionestimates with this measure in Columns (4) and (5) of Table 6. We find that theseestimates are positive, but not statistically significant. In regressions (6) and(7), we use the rank of the underwriter in the league tables, with the minimumof one and maximum of ten. Banks not in the securitization league tables takea value of zero. The coefficient is positive in both specifications, and it isstatistically significant when we use our broadest measure of holdings on theleft-hand side.
One concern with the securitization results presented thus far is thatthe securitization-active indicator variable could be correlated with bankcharacteristics that are not controlled for in regressions (1) and (2). To addressthis possibility, we estimate regressions of changes in holdings of highly ratedtranches on changes in the level of securitization activity since 2002. The use ofchanges has the advantage of helping account for the possibility of an omittedvariable bias in the estimates on the securitization-active indicator reported inColumns (1) and (2) of Table 6. Pervasive unobserved attributes at the banklevel are less likely to be correlated with time-series changes in the variablesof interest. Consequently, we expect the relation between the changes to be amore precise estimate of the true relationship between securitization activityand holdings of highly rated tranches.
For the regressions using changes in holdings of highly rated tranches, wecan only use our narrow measure as the other measures are not availableconsistently over time (except for the bottom-up measure). For that purpose,we estimate regressions of the year-over-year change in holdings of thesetranches on the year-over-year changes in the outstanding principal balanceof assets sold or securitized (with servicing retained or with recourse). Weuse quarterly data from the first quarter of 2002 to the last quarter of 2006and normalize the change in holdings of highly rated tranches or outstanding
23 Data source is Moody’s eMaxx Data Services.
434
at Brigham
Young U
niversity on August 4, 2014
http://rfs.oxfordjournals.org/D
ownloaded from

[16:28 7/1/2014 RFS-hht077.tex] Page: 435 404–453
Holdings of Highly Rated Securitization Tranches
balance of securitizations from time t −4 to t, using assets as of t −4. Results arereported in Column (8) of Table 6. Standard errors are corrected for clusteringof observations at the bank and quarter level. The coefficient on the ratio ofthe change in securitization over lagged assets is positive and significant at the10% level. In regression (9), the last regression of the Table 6, we focus on theoutstanding principal balance of only mortgages sold or securitized and findsimilar results.
Figure 1 shows that the aggregate dollar holdings of highly rated tranchesexperienced an especially sharp increase from the last quarter of 2006 to thelast quarter of 2007. This increase is supportive of the hypothesis that banksaccumulated highly rated tranches rapidly as the market turned because theyhad trouble selling these tranches. However, even though the aggregate amountof highly rated tranches increased the most from 2006 to 2007, total assetsincreased as well, so that the large dollar increase is not accompanied bya noticeable increase in percentage holdings. Consequently, the evidence onpercentage holdings does not support the view that banks accumulated holdingsat a rapid pace in 2007. Their behavior is consistent with having kept theirallocation to highly rated tranches roughly constant.
Finally, given our results, the increase in holdings of highly rated tranchesshould be concentrated among securitization-active banks. In Figure 2, we plotthe holdings of highly rated tranches through time separately for securitization-active banks and nonsecuritization active banks. In 2006, securitization activebanks had highly rated tranches holdings of 3.1% in comparison to holdings of0.8% for other banks. For the securitization-active banks, holdings of highlyrated tranches increased from 2.1% of total assets in Q1 2002 to 3.3% in Q12007, whereas highly rated holdings for the nonactive banks remained virtuallyunchanged over the same period. A formal test of the 1.2% difference in highlyrated holdings between Q1 2002 and Q1 2007 for securitization-active banksyields a t-statistic of 1.30.
As discussed in Section 1, the traditional skin-in-the-game hypothesis wouldsuggest that banks engaged in securitization would hold the most junior tranchesof their securitizations. We used the BHC data to try to estimate the holdingsof lower-rated tranches. The estimates we obtain suffer from a number ofdrawbacks that lead us to not present them. However, no matter which choiceswe make in constructing these estimates, holdings of lower-rated tranches wereeconomically trivial for banks—they could have lost all their investment andnot be meaningfully affected—and holdings of highly rated tranches dwarfholdings of lower-rated tranches.
Our analysis is strongly supportive of the hypothesis that banks engagedin securitization held more highly rated tranches (Securitization H1) and thehypothesis that holdings of highly rated tranches increased over time withsecuritization activity (Securitization H2). We find at best weak evidence thatholdings of highly rated tranches for firms active in securitization increasedmore in 2007 (Securitization H3).
435
at Brigham
Young U
niversity on August 4, 2014
http://rfs.oxfordjournals.org/D
ownloaded from

[16:28 7/1/2014 RFS-hht077.tex] Page: 436 404–453
The Review of Financial Studies / v 27 n 2 2014
Figure 2Time-series plot of holdings of highly rated tranches as a percent of total assetsThis figure plots the holdings of highly rated tranches as a percent of total assets through time. The sampleincludes all U.S. publicly traded bank holding companies (BHCs). Banks are deemed “securitization active” ifthe outstanding principle balance of assets sold and securitized with servicing retained or with recourse or otherseller-provided credit enhancements is greater than zero in any quarter within the years 2003–2006. Forty-sixbanks meet this criterion as of January 2002. The remaining banks are characterized as “nonsecuritization active.”
4.3 Regulatory arbitrageAcharya and Richardson (2009) argue that BHCs find holding highly ratedassets advantageous as a form of regulatory capital arbitrage. Regulatoryarbitrage occurs because banks have to hold less regulatory capital if, forexample, mortgage loans on the balance sheet are transformed into AAA-ratedbonds via securitization. Also, as discussed earlier, regulatory arbitrage mighthave favored holdings of highly rated tranches simply because they had higheryields than other securities with similar capital requirements. With this view,we could see the type of relation between securitization and holdings of highlyrated tranches documented in the previous section. Transforming mortgagesinto highly rated securities can also result in a cheaper source of funding forBHCs through asset-backed commercial paper programs, where commercialpaper is issued at a lower cost because it is collateralized by highly ratedsecurities (see Acharya, Schnabl, and Suarez 2013). Finally, Acharya, Schnabl,and Suarez (2013) show that structured investment vehicles were a form ofregulatory arbitrage that enabled banks to hold various assets, including highlyrated tranches, with almost no regulatory capital. To implement this regulatoryarbitrage, banks did not have to hold highly rated tranches on their balancesheet. However, banks that engaged in regulatory arbitrage through SIVs mighthave held more highly rated tranches on their balance sheets as an inventoryavailable for their SIVs.
We find that eleven bank holding companies sponsored conduits or SIVsin our estimation sample.24 To investigate the regulatory-arbitrage hypothesis,
24 Out of eleven BHCs that sponsored off-balance sheet conduits in general, only one, Citigroup, was affiliatedwith SIVs as a specific type of conduit.
436
at Brigham
Young U
niversity on August 4, 2014
http://rfs.oxfordjournals.org/D
ownloaded from

[16:28 7/1/2014 RFS-hht077.tex] Page: 437 404–453
Holdings of Highly Rated Securitization Tranches
we first test whether a Conduit dummy identifying these banks is correlatedwith holdings of highly rated tranches. As shown in Column (1) of Table 7,the coefficient on the indicator variable for conduits is not statistically differentfrom zero when we use the Highly rated residual measure of holdings andhave the same controls as in our previous regressions. Not surprisingly, giventhe result in Column (1), the coefficient is significant in regression (2), whenwe use our broadest measure, which adds the holdings of off-balance-sheetconduits to on-balance-sheet holdings of highly rated tranches. In other words,holdings of highly rated tranches through conduits did not substitute for on-balance-sheet holdings but were incremental. Notably, however, our measureof holdings through conduits is an upper bound as not all conduit assets werehighly rated tranches of securitizations.
We examine next whether BHCs’ issuance or sponsoring of asset-backedcommercial paper is related to their holdings of highly rated tranches. Weconstruct an indicator variable for all BHCs engaged in any ABCP activity inyears 2003–2006, either through direct issuance or through sponsoring creditenhancements in ABCP issuance. In our sample, there are fifteen BHCs in2006 for which ABCP activity indicator is equal to one. Because banks withconduits have ABCP programs, there is considerable overlap between theABCP indicator variable and the conduit indicator variable. Regressions (3) and(4) show that the coefficients on the ABCP indicator variable are insignificantand are of small economic magnitude. The coefficients on the control variablesare mostly consistent with results in previous tables. Estimates of the coefficienton asset size for the first $50 billion of asset size remain quantitatively similarto previous tables, but are not significant in the ABCP specification. If theexistence of an ABCP program is a good proxy for a bank’s propensity toengage in regulatory arbitrage, that propensity does not seem to be correlatedwith holdings of highly rated tranches.
We develop an alternative measure of a BHC’s propensity to engage inregulatory arbitrage that does not rely on ABCP activity. The rule change of2001 for capital requirements for tranches of securitizations discussed earlierprovides an opportunity to identify BHCs with a propensity to engage inregulatory arbitrage. Although the final rule took effect in January 2002, bankswere allowed to delay the application of the rule until December 2002. Weconsider whether a BHC’s use of regulatory-capital arbitrage opportunitiesarising from the ratings-based capital requirements has any power in predictingits holdings of highly rated tranches in subsequent years. To do so, we calculatethe change in leverage, namely, the change in assets over Tier 1 capital, for eachBHC in our sample from the fourth quarter of 2000 to the fourth quarter of 2002and hypothesize that BHCs with the largest change in leverage surroundingthe event are those with a higher propensity to engage in regulatory capitalarbitrage. This test assumes that banks took active steps to increase theirleverage as a result of lower capital requirements, with the caveat that otherfactors might have affected the change in leverage in this time period. An
437
at Brigham
Young U
niversity on August 4, 2014
http://rfs.oxfordjournals.org/D
ownloaded from

[16:28 7/1/2014 RFS-hht077.tex] Page: 438 404–453
The Review of Financial Studies / v 27 n 2 2014
Tabl
e7
Reg
ulat
ory
capi
tala
rbit
rage
and
hold
ings
ofhi
ghly
rate
dtr
anch
es
Mea
sure
sof
hold
ings
ofhi
ghly
rate
dtr
anch
es
Hig
hly
Hig
hly
Hig
hly
Hig
hly
rate
dre
sidu
al+
rate
dre
sidu
al+
rate
dre
sidu
al+
rate
dre
sidu
al+
CD
Os
and
CD
Os
and
CD
Os
and
CD
Os
and
Hig
hly
wri
tedo
wns
+H
ighl
yw
rite
dow
ns+
Hig
hly
wri
tedo
wns
+H
ighl
yw
rite
dow
ns+
rate
dco
ndui
tsra
ted
cond
uits
rate
dco
ndui
tsra
ted
cond
uits
resi
dual
and
SIV
sre
sidu
alan
dSI
Vs
resi
dual
and
SIV
sre
sidu
alan
dSI
Vs
(1)
(2)
(3)
(4)
(5)
(6)
(7)
(8)
Con
duit
indi
cato
r0.
012
0.05
2∗(0
.446
)(1
.911
)A
BC
Pac
tivity
indi
cato
r0.
008
0.03
6(0
.349
)(1
.401
)C
hang
ein
leve
rage
,200
0Q
4–
2002
Q4
0.00
20.
001
(1.3
42)
(0.8
17)
Mar
ketr
isk
equi
vale
ntba
nkin
dica
tor
0.01
50.
010
(0.5
76)
(0.3
54)
$0-$
50B
illio
n0.
694∗
∗0.
692∗
0.68
4∗0.
662
0.74
7∗1.
009∗
∗0.
632
0.90
9∗∗
(1.9
76)
(1.9
60)
(1.6
79)
(1.6
14)
(1.9
49)
(2.4
82)
(1.5
82)
(2.2
08)
>$5
0B
illio
n−0
.068
∗−0
.060
−0.0
65−0
.046
−0.0
65−0
.049
−0.0
66∗
−0.0
50(−
1.67
5)(−
1.44
0)(−
1.64
8)(−
1.05
6)(−
1.62
2)(−
1.05
2)(−
1.66
7)(−
1.06
1)“O
ther
”H
.T.M
.and
A.F
.S.s
ecur
ities
0.02
90.
030
0.02
80.
026
−0.0
01−0
.002
0.02
80.
026
(1.2
27)
(1.2
43)
(1.1
51)
(1.0
65)
(−0.
0331
)(−
0.06
04)
(1.1
63)
(1.0
66)
“Oth
er”
trad
ing
secu
ritie
s0.
359
0.31
20.
349
0.27
50.
356
0.39
30.
322
0.38
3(1
.079
)(0
.924
)(1
.069
)(0
.815
)(1
.023
)(0
.980
)(1
.047
)(1
.030
)Pr
ior
retu
rns
−0.0
05−0
.006
−0.0
05−0
.005
−0.0
11−0
.003
−0.0
05−0
.002
(−0.
515)
(−0.
611)
(−0.
490)
(−0.
499)
(−0.
806)
(−0.
246)
(−0.
460)
(−0.
145)
Mar
ket-
to-b
ook
0.00
40.
004
0.00
30.
003
0.00
70.
006
0.00
30.
003
(1.6
07)
(1.6
13)
(1.5
00)
(1.2
57)
(1.4
08)
(1.1
13)
(1.4
93)
(1.2
25)
Ass
ets/
Tie
r1
capi
tal
0.00
20.
002
0.00
20.
002
0.00
20.
002
0.00
20.
002
(1.2
12)
(1.1
59)
(1.3
20)
(1.3
95)
(0.8
18)
(0.9
23)
(1.2
90)
(1.2
81)
Con
stan
t−0
.020
−0.0
18−0
.020
−0.0
20−0
.017
−0.0
27−0
.020
−0.0
25(−
0.86
1)(−
0.78
3)(−
0.85
8)(−
0.82
5)(−
0.49
1)(−
0.75
4)(−
0.87
4)(−
1.01
2)O
bser
vatio
ns22
522
522
522
514
014
022
522
5A
djus
ted
R-s
quar
ed0.
153
0.29
00.
152
0.26
50.
141
0.22
70.
156
0.23
8
Thi
sta
ble
tabu
late
sth
ere
sults
ofan
OL
Sre
gres
sion
ofou
rm
easu
res
ofhi
ghly
rate
dho
ldin
gson
prox
ies
iden
tifyi
ngba
nks
that
are
likel
yto
enga
gein
regu
lato
ry-c
apita
larb
itrag
eac
tiviti
es.
The
sepr
oxie
sar
ean
off-
bala
nce
shee
tco
ndui
tin
dica
tor,
anas
set-
back
edco
mm
erci
alpa
per
(AB
CP)
activ
ityin
dica
tor,
chan
gein
leve
rage
arou
ndth
ere
gula
tion
chan
gein
2001
,and
anin
dica
tor
vari
able
for
bank
sth
atar
esu
bjec
tto
mar
ket-
risk
-equ
ival
entc
apita
lrul
es.T
heco
nstr
uctio
nof
each
ofth
ese
vari
able
s,de
pend
entv
aria
bles
,and
cont
rols
are
deta
iled
inA
ppen
dix
A.T
hesa
mpl
eco
ntai
nsth
ecr
oss-
sect
ion
ofpu
blic
lytr
aded
U.S
.BH
Cs
with
rele
vant
data
asof
Dec
embe
r20
06.H
eter
osce
dast
icity
-rob
ustt
-sta
tistic
sar
ein
pare
nthe
ses.
The
sym
bols
***,
**,a
nd*
indi
cate
sign
ifica
nce
atth
e1%
,5%
,and
10%
leve
ls,r
espe
ctiv
ely.
438
at Brigham
Young U
niversity on August 4, 2014
http://rfs.oxfordjournals.org/D
ownloaded from

[16:28 7/1/2014 RFS-hht077.tex] Page: 439 404–453
Holdings of Highly Rated Securitization Tranches
obvious concern with this test is that there are many reasons why leveragemight have increased around the regulatory change, so that our proxy is noisy.
Columns (5) and (6) of Table 7 regress the holdings of highly rated tranchesin December 2006 as a function of the change in leverage from 2000 Q4 to2002 Q4. If banks that took advantage of the change to increase their leverageare those that engage in regulatory arbitrage, we should see a positive relationbetween holdings of highly rated tranches and the change in leverage aroundthe regulatory change. The change-in-leverage variable is positively relatedto holdings of highly rated tranches, but the coefficient is not statisticallysignificant.
There has been much discussion that the market risk amendment to the BaselAccord allows banks to hold highly rated tranches in their trading book with verylittle regulatory capital compared with banks that can only hold the tranches intheir banking book. However, as discussed earlier, banks with a trading bookmight have been holding more highly rated tranches to have an inventory formarket-making purposes. The final two regressions of Table 7 use an indicatorvariable (Market risk equivalent bank indicator) for banks that had the rightto use their own value-at-risk model to satisfy capital requirements on theirtrading book.25 We find no evidence that these banks held more highly ratedtranches. We estimate (but do not tabulate) the same regression without the sizevariables. Without the size variables, the indicator variable is significant, butthe R2 of the regression drops by half. The significance of the size variables isnot affected by the presence of the market risk indicator, and the inclusion ofthe market risk indicator has only a trivial impact on the R2.
As discussed in Section 2, we would expect banks for which regulatory capitalis considered to be more expensive to engage in regulatory arbitrage. Further, wewould expect banks that are expected to be subject to more regulatory scrutinyto engage in less regulatory arbitrage. These considerations suggest that bankswith large amounts of regulatory capital are unlikely to engage in regulatoryarbitrage, whereas banks with smaller amounts would do so as long as theirregulatory capital is not so low that it attracts regulatory scrutiny. As seen inTables 2, 6, and 7, assets/Tier 1 capital do not have a significant coefficientwhen we include other explanatory variables, implying that banks that aremore constrained in regulatory capital do not seem to be holding more highlyrated tranches (Regulatory Arbitrage H1).26 Admittedly, assets/Tier 1 capitalis a noisy measure of the extent to which a bank is constrained with respect
25 A BHC is subject to the market risk capital guidelines and is thus able to use its own estimates of value-at-riskin calculating capital requirements, if its consolidated trading activity, defined as the sum of trading assets andliabilities for the previous quarter, equals (1) 10% or more of the BHCs total assets for the previous quarter or(2) $1 billion or more. The Federal Reserve may include or exempt a BHC as it feels appropriate. Our December2006 sample of 231 BHCs includes fourteen BHCs that meet the market risk capital guidelines.
26 As a simple test to allow for the possibility that banks with low regulatory capital are subject to more regulatoryscrutiny, we re-estimate our regressions eliminating the banks with low Assets/Tier 1 ratios. The coefficient onregulatory capital is unchanged.
439
at Brigham
Young U
niversity on August 4, 2014
http://rfs.oxfordjournals.org/D
ownloaded from
[16:28 7/1/2014 RFS-hht077.tex] Page: 440 404–453
The Review of Financial Studies / v 27 n 2 2014
to regulatory capital. First, regulators could require some BHCs to hold morethan 4% of Tier 1 capital. Hence, if the BHCs engaged in securitization tendto have higher capital requirements imposed on them by the regulators, theymight have a lower cushion. Second, there are multiple capital requirements,so that the one we focus on might not be the binding one for a BHC in oursample, giving the illusion that the BHC has a large cushion when it does not.
Finally, we consider the possibility of BHCs having engaged in regulatoryarbitrage through the securitization channel itself. From a regulatory capitalstandpoint, holding a portfolio of mortgages in the form of highly ratedsecuritizations is cheaper for banks than for them to hold an unsecuritizedportfolio of mortgages. This is becauseAAA-rated securitizations, for example,carry a 20% risk-weighting, whereas unsecuritized subprime mortgages carrya 50% risk weight. As such, securitization activity could be an efficientmechanism to transform an expensive portfolio from a regulatory standpointinto a cheaper portfolio.
We provide two pieces of evidence that indicate that banks engaged insecuritization did not engage more aggressively in regulatory arbitrage ontheir balance sheets than did other banks (as opposed to the off-balance-sheet mechanisms documented by Acharya, Schnabl, and Suarez (2013)).First, we examine whether levels of regulatory capital were overly aggressiveamong securitization-active banks. For each BHC, we calculate the regulatory“cushion,” which is the ratio of Tier 1 capital to risk-weighted assets, minusthe regulatory Tier 1 requirement of 4%. This measure is subject to the caveatsdiscussed previously about measuring regulatory capital constraints for banks.We plot the results in Figure 3. Although securitization-active BHCs do, onaverage, exhibit a lower regulatory capital cushion, the cushion is neither closeto the regulatory boundary nor does it change through time as would be expectedof a BHC wanting to push the boundaries of regulatory capital through increasedsecuritization activity.
A second piece of evidence comes from examining the ratio of total assets torisk-weighted assets. To control for bank size, we create a size-based matchedsample of securitization-active and non-securitization-active banks and plotthe ratio of total assets to risk-weighted assets in Figure 4. A securitization-driven regulatory arbitrage hypothesis predicts that securitization-active bankswould amass more total assets for a given level of risk-weighted assets thannon-securitization-active banks. Figure 4 demonstrates that the data do notsupport this view. Rather, securitization-active banks have a lower ratio of totalassets to risk-weighted assets than do their counterparts of roughly equal size.Taken together, we interpret the results as being consistent with the view thatsecuritization activity itself, without associated off-balance sheet activity, wasnot the primary mechanism facilitating regulatory capital arbitrage.
Overall, our evidence provides little support for the hypothesis that banksthat engaged more in regulatory arbitrage activities had larger holdings ofhighly rated tranches on their balance sheet (Regulatory Arbitrage H2). But
440
at Brigham
Young U
niversity on August 4, 2014
http://rfs.oxfordjournals.org/D
ownloaded from
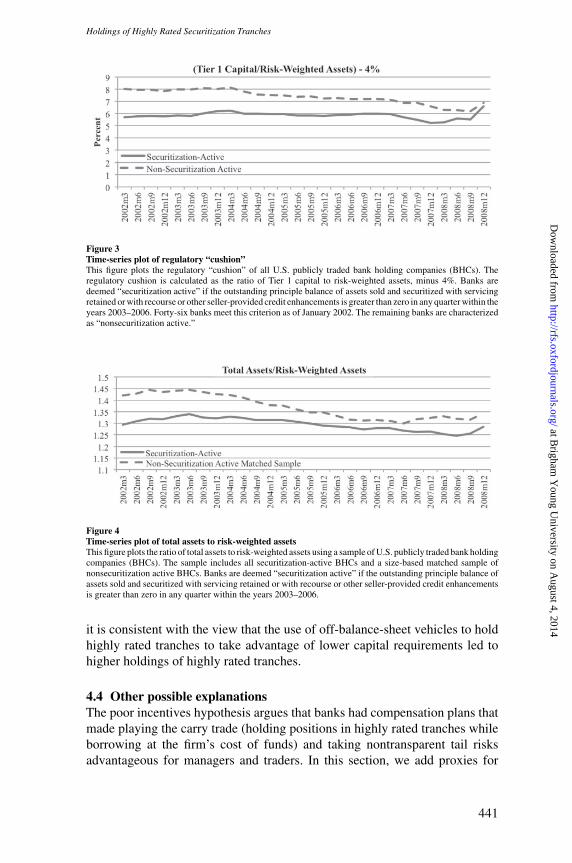
[16:28 7/1/2014 RFS-hht077.tex] Page: 441 404–453
Holdings of Highly Rated Securitization Tranches
Figure 3Time-series plot of regulatory “cushion”This figure plots the regulatory “cushion” of all U.S. publicly traded bank holding companies (BHCs). Theregulatory cushion is calculated as the ratio of Tier 1 capital to risk-weighted assets, minus 4%. Banks aredeemed “securitization active” if the outstanding principle balance of assets sold and securitized with servicingretained or with recourse or other seller-provided credit enhancements is greater than zero in any quarter within theyears 2003–2006. Forty-six banks meet this criterion as of January 2002. The remaining banks are characterizedas “nonsecuritization active.”
Figure 4Time-series plot of total assets to risk-weighted assetsThis figure plots the ratio of total assets to risk-weighted assets using a sample of U.S. publicly traded bank holdingcompanies (BHCs). The sample includes all securitization-active BHCs and a size-based matched sample ofnonsecuritization active BHCs. Banks are deemed “securitization active” if the outstanding principle balance ofassets sold and securitized with servicing retained or with recourse or other seller-provided credit enhancementsis greater than zero in any quarter within the years 2003–2006.
it is consistent with the view that the use of off-balance-sheet vehicles to holdhighly rated tranches to take advantage of lower capital requirements led tohigher holdings of highly rated tranches.
4.4 Other possible explanationsThe poor incentives hypothesis argues that banks had compensation plans thatmade playing the carry trade (holding positions in highly rated tranches whileborrowing at the firm’s cost of funds) and taking nontransparent tail risksadvantageous for managers and traders. In this section, we add proxies for
441
at Brigham
Young U
niversity on August 4, 2014
http://rfs.oxfordjournals.org/D
ownloaded from

[16:28 7/1/2014 RFS-hht077.tex] Page: 442 404–453
The Review of Financial Studies / v 27 n 2 2014
poor incentives to our regressions. Notably, however, endogeneity problems arepervasive through these regressions, so that one should be wary of interpretingthem as explaining causal relations. The key issue is that holdings of highlyrated tranches and incentives might be determined simultaneously or they mightbe determined by other variables that we do not include in our regressions. Forinstance, a bank that has chosen to invest heavily in highly rated tranches mayrequire different governance or different risk management than does a bankthat has chosen not to invest in these tranches. This issue could mean that thecoefficients on our proxies for incentives are biased. Another source of bias forthe coefficients on the incentive proxies is that these proxies are measured witherror.
We would expect that poor incentives are more likely to exist in banks withpoor governance. To test whether there is a correlation between firm-levelgovernance and holdings of highly rated tranches, we use a Governance indexthat increases with the protection of minority shareholders (see Aggarwal et al.(2011) for a detailed explanation of the index). We find no relation betweenholdings of highly rated tranches and a bank’s governance index as of 2006(see the first regression of Table 8).
These poor incentives could be at lower levels of a bank—say at the traderlevel—or at the top level. The data on compensation contracts below the topfive officers of banks is not available. However, we would expect the incentiveproblems due to traders’ compensation to arise in banks that have tradingoperations. Regressions (7) and (8) of Table 7 show that there is no evidencethat banks with larger trading portfolios have more highly rated tranches. Inuntabulated results, we also re-estimate the regressions of Table 7 with anindicator variable for any bank with nonzero trading assets and still find nosignificance for the trading-asset indicator variable.
We construct several measures of properties of the CEO’s compensationand test whether these measures can explain differences in holdings of highlyrated tranches (see Table A2 for a detailed description of the managerial-compensation measures). Results are presented in Table 8. Our first measurecalculates the elasticity of total managerial compensation to a BHC’s return onequity, where the ROE is calculated as net income divided by total commonequity as of the fiscal year-end.27 ROE is a performance measure that is not riskadjusted, and it does not account for the cost of equity. Therefore, a bank’s ROEcan be increased through carry-trade positions and with leverage. Highly ratedtranches had higher yields than did other similarly rated securities. Hence, to theextent that these tranches bolster non-risk-adjusted firm performance, managerswith a higher elasticity of compensation to non-risk-adjusted performancewould find holding more highly rated tranches advantageous. The second
27 The numerator of the compensation-ROE elasticity is calculated as the change in compensation from 2001–2006divided by 2001 levels of compensation. The denominator is calculated as the change in ROE from 2001–2006divided by 2001. ROE details are provided in the Appendix.
442
at Brigham
Young U
niversity on August 4, 2014
http://rfs.oxfordjournals.org/D
ownloaded from
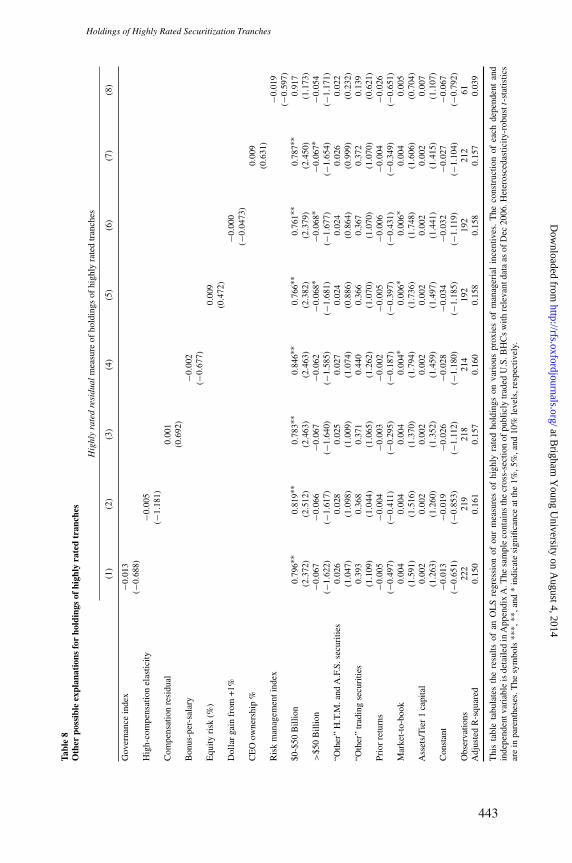
[16:28 7/1/2014 RFS-hht077.tex] Page: 443 404–453
Holdings of Highly Rated Securitization Tranches
Tabl
e8
Oth
erpo
ssib
leex
plan
atio
nsfo
rho
ldin
gsof
high
lyra
ted
tran
ches
Hig
hly
rate
dre
sidu
alm
easu
reof
hold
ings
ofhi
ghly
rate
dtr
anch
es
(1)
(2)
(3)
(4)
(5)
(6)
(7)
(8)
Gov
erna
nce
inde
x−0
.013
(−0.
688)
Hig
h-co
mpe
nsat
ion
elas
ticity
−0.0
05(−
1.18
1)C
ompe
nsat
ion
resi
dual
0.00
1(0
.692
)B
onus
-per
-sal
ary
−0.0
02(−
0.67
7)E
quity
risk
(%)
0.00
9(0
.472
)D
olla
rga
infr
om+
1%−0
.000
(−0.
0473
)C
EO
owne
rshi
p%
0.00
9(0
.631
)R
isk
man
agem
enti
ndex
−0.0
19(−
0.59
7)$0
-$50
Bill
ion
0.79
6∗∗
0.81
9∗∗
0.78
3∗∗
0.84
6∗∗
0.76
6∗∗
0.76
1∗∗
0.78
7∗∗
0.91
7(2
.372
)(2
.512
)(2
.463
)(2
.463
)(2
.382
)(2
.379
)(2
.450
)(1
.173
)>
$50
Bill
ion
−0.0
67−0
.066
−0.0
67−0
.062
−0.0
68∗
−0.0
68∗
−0.0
67∗
−0.0
54(−
1.62
2)(−
1.61
7)(−
1.64
0)(−
1.58
5)(−
1.68
1)(−
1.67
7)(−
1.65
4)(−
1.17
1)“O
ther
”H
.T.M
.and
A.F
.S.s
ecur
ities
0.02
60.
028
0.02
50.
027
0.02
40.
024
0.02
60.
022
(1.0
47)
(1.0
98)
(1.0
09)
(1.0
74)
(0.8
86)
(0.8
64)
(0.9
99)
(0.2
32)
“Oth
er”
trad
ing
secu
ritie
s0.
393
0.36
80.
371
0.44
00.
366
0.36
70.
372
0.13
9(1
.109
)(1
.044
)(1
.065
)(1
.262
)(1
.070
)(1
.070
)(1
.070
)(0
.621
)Pr
ior
retu
rns
−0.0
05−0
.004
−0.0
03−0
.002
−0.0
05−0
.006
−0.0
04−0
.026
(−0.
497)
(−0.
411)
(−0.
295)
(−0.
187)
(−0.
397)
(−0.
431)
(−0.
349)
(−0.
651)
Mar
ket-
to-b
ook
0.00
40.
004
0.00
40.
004∗
0.00
6∗0.
006∗
0.00
40.
005
(1.5
91)
(1.5
16)
(1.3
70)
(1.7
94)
(1.7
36)
(1.7
48)
(1.6
06)
(0.7
04)
Ass
ets/
Tie
r1
capi
tal
0.00
20.
002
0.00
20.
002
0.00
20.
002
0.00
20.
007
(1.2
63)
(1.2
60)
(1.3
52)
(1.4
59)
(1.4
97)
(1.4
41)
(1.4
15)
(1.1
07)
Con
stan
t−0
.013
−0.0
19−0
.026
−0.0
28−0
.034
−0.0
32−0
.027
−0.0
67(−
0.65
1)(−
0.85
3)(−
1.11
2)(−
1.18
0)(−
1.18
5)(−
1.11
9)(−
1.10
4)(−
0.79
2)O
bser
vatio
ns22
221
921
821
419
219
221
261
Adj
uste
dR
-squ
ared
0.15
00.
161
0.15
70.
160
0.15
80.
158
0.15
70.
039
Thi
sta
ble
tabu
late
sth
ere
sults
ofan
OL
Sre
gres
sion
ofou
rm
easu
res
ofhi
ghly
rate
dho
ldin
gson
vari
ous
prox
ies
ofm
anag
eria
lin
cent
ives
.T
heco
nstr
uctio
nof
each
depe
nden
tan
din
depe
nden
tvar
iabl
eis
deta
iled
inA
ppen
dix
A.T
hesa
mpl
eco
ntai
nsth
ecr
oss-
sect
ion
ofpu
blic
lytr
aded
U.S
.BH
Cs
with
rele
vant
data
asof
Dec
2006
.Het
eros
ceda
stic
ity-r
obus
tt-s
tatis
tics
are
inpa
rent
hese
s.T
hesy
mbo
ls**
*,**
,and
*in
dica
tesi
gnifi
canc
eat
the
1%,5
%,a
nd10
%le
vels
,res
pect
ivel
y.
443
at Brigham
Young U
niversity on August 4, 2014
http://rfs.oxfordjournals.org/D
ownloaded from
[16:28 7/1/2014 RFS-hht077.tex] Page: 444 404–453
The Review of Financial Studies / v 27 n 2 2014
regression of Table 8 reports the relation between holdings of highly ratedtranches and our elasticity measure. The elasticity variable named High-compensation elasticity is equal to one for firms with above-median elasticity ofthe CEO’s total compensation to changes in bank ROE. The relation betweenholdings and this compensation elasticity is negative, and it lacks statisticalsignificance.
We also consider alternative measures or characteristics of managerialcompensation in Columns (3) to (5) of Table 8. First, we examine whetherhighly rated tranches are larger in banks in which the CEO earns more thanCEOs at other banks of similar size. Compensation residual (see Cheng, Hong,and Scheinkman 2010) is constructed by computing the natural logarithm(log) of average total compensation from 2003 to 2006. This log averagecompensation is then regressed on the log of the firm’s 2006 market cap. Theresidual from this regression, estimated in 2006, serves as the compensationresidual variable in our cross-sectional regressions of highly rated holdings in2006. Second, many observers have argued that the so-called bonus cultureled to excessive risk taking. The Bonus-per-salary variable is calculated asthe ratio of the CEO’s total bonus to his base salary. Lastly, to test thecorrelation with option-like features, Equity Risk measures the sensitivity ofCEO’s compensation to volatility.28 Results indicate virtually no statisticallysignificant relationship between these compensation variables and holdings ofhighly rated tranches. The standard set of control variables exhibits their usualsigns, magnitudes, and significance.
Regressions (6) and (7) of Table 8 investigate the relation between holdingsof highly rated tranches and equity incentives of CEOs. The coefficients on ourestimates of equity incentives of CEOs are insignificant. In other words, thebanks of CEOs with more incentives to maximize shareholder wealth did nothold more or fewer highly rated tranches than did other banks.
In summary, our results are not supportive of the “incentives” hypotheses.One concern is that, given possible errors of measurement in incentivemeasures, our approach does not have enough power to find a role for incentives.However, for our sample, we find in untabulated regressions that there is asignificant negative relation between leverage and managerial ownership orthe sensitivity of managerial wealth to the stock price. Given that managerialownership seems to have a relation with a proxy for risk taking for our samplebanks, our results on incentives cannot be wholly attributed to our proxiesbeing inadequate. Further, these proxies have been widely used in the literatureand found to be significantly related to a variety of firm policies and to firmvaluation.
To investigate whether there is evidence supporting the risk managementfailure hypothesis, we use the index developed by Ellul and Yerramilli (2013) to
28 See, for example, Bebchuk and Spamann (2010) for the impact of options on risk-taking incentives.
444
at Brigham
Young U
niversity on August 4, 2014
http://rfs.oxfordjournals.org/D
ownloaded from

[16:28 7/1/2014 RFS-hht077.tex] Page: 445 404–453
Holdings of Highly Rated Securitization Tranches
measure the centrality and independence of risk management within banks. TheRisk Management Index (RMI) is available for sixty-one banks in our sample;therefore, the power of our tests is reduced. Smaller banks typically do not havedisclosures on the risk management function. The index is a function of whethera bank has a chief risk officer (CRO), whether the CRO is an officer, whetherthe CRO is one of the top five most highly paid executives, the ratio of the payof the CRO to the pay of the CEO, the bank’s board has an experienced riskcommittee, the frequency of meetings of the risk committee, and whether thekey management-level risk committee reports directly to the board. As the RMIincreases, the authors conclude that risk management is more central and moreindependent in a bank. The last regression presented in Table 8 shows that theindex has a negative coefficient, but it is not significant. The interpretation of thisresult, in our admittedly small sample, is that there is no evidence that the orga-nization of risk management was related to holdings of highly rated tranches.
5. Conclusion
In this paper, we estimate holdings of highly rated tranches of U.S. commercialbanks at the end of 2006. We use five different approaches to estimate theseholdings on balance sheet as well as off balance sheet and the differentapproaches lead to similar conclusions. Using a sample of 231 publicly tradedU.S. bank holding companies, we find that there is considerable cross-sectionalvariation in holdings of highly rated tranches of securitizations and that the bulkof the dollar holdings was held by some large banks. The fact that the dollarholdings were concentrated among a handful of banks and that most banksheld only an economically trivial amount of highly rated tranches inherentlylimits the extent of our econometric investigation and what we can learn fromour dataset about the determinants of the holdings of the largest banks. Theaverage of the holdings across the banking sector was only 1.3% of assets, butthe average of the holdings for the banks with large trading positions was almost5% or even 10% when we include holdings in off-balance-sheet conduits andSIVs. Yet, even among these banks, there was wide dispersion in holdings. Forinstance, our estimate of holdings that ignores off-balance-sheet holdings forJP Morgan Chase is less than 1% of assets, but Citigroup had holdings in excessof 5%. When we take into account off-balance-sheet holdings, Citigroup’sholdings increase to 11%, whereas JP Morgan Chase holds 4%.
We find that the variation in holdings of highly rated tranches is correlatedwith the securitization activities of banks. We provide a number of reasonswhy banks engaged in securitization would have invested more in highly ratedtranches. For such banks, holding highly rated tranches could be a way toshow that they had skin in the game. Also, banks engaged in securitizationshad to hold highly rated tranches as a part of the securitization activities, asthese banks made markets in highly rated tranches or held these tranches asinventories. Furthermore, banks that were involved in securitization were better
445
at Brigham
Young U
niversity on August 4, 2014
http://rfs.oxfordjournals.org/D
ownloaded from
[16:28 7/1/2014 RFS-hht077.tex] Page: 446 404–453
The Review of Financial Studies / v 27 n 2 2014
placed to assess the pricing and risk of highly rated tranches, so that investingin these securities was likely cheaper and easier for them. Consistent with thehypothesis that banks engaged in securitization held more highly rated tranches,we find that banks that were active in securitization between 2003 and 2006,through either origination or providing credit enhancements, held 1.5% largeramounts of highly rated tranches as a fraction of total assets as of December31, 2006 than the other banks did. Further, we find that holdings of highlyrated tranches increased over time for banks as their securitization activitiesincreased. Although our empirical evidence strongly supports the hypothesisthat banks engaged in securitizations held more highly rated tranches, becauseof data limitations, we cannot distinguish among the various reasons whysecuritization-active banks held more highly rated tranches.
We investigate many of the other hypotheses that have been advanced toexplain holdings of highly rated tranches by banks. In regressions, we findthat the fraction of a bank’s assets invested in highly rated tranches increaseswith asset size up to some threshold. For the largest banks, this fraction doesnot increase with asset size. This evidence suggests that the most systemicallyimportant banks did not invest a larger fraction of their assets in highly ratedtranches than the other large banks did. We find similar results using the numberof employees instead of bank assets.
To the extent that regulatory arbitrage motivates banks to securitize, therelation we find between securitization and holdings of highly rated tranchescould be evidence of the role of regulatory arbitrage in holdings of highly ratedtranches. Although we find that banks engaged in regulatory arbitrage throughSIVs held more highly rated tranches when we assume that SIVs and conduitsinvested only in highly rated tranches, we do not find support for other implica-tions of the regulatory arbitrage hypothesis. In particular, there is no significantcorrelation between banks’ABCP programs and their holdings of highly ratedtranches. If banks that engage the most in regulatory arbitrage are banks thathave less slack in terms of regulatory capital than other banks, we show thatbanks that engaged in securitization do not meet that criterion. It is often arguedthat banks used the more advantageous capital requirements of the tradingbook for the purpose of regulatory arbitrage. However, controlling for size, wedo not find that these banks with large trading books held more highly ratedtranches of securitizations. Lastly, we explore the “bad incentives” and “riskmanagement failure” explanations for holdings of highly rated tranches. Noneof our evidence supports the hypothesis that banks with worse incentives heldmore highly rated tranches or the hypothesis that holdings of these tranches wererelated to observable characteristics of the organization of risk management.
We find that there is a strong correlation between a bank’s securitizationactivity and its holdings of highly rated tranches. This correlation holds both incross-sectional regressions and in panel regressions. Our investigation provideslittle support for explanations for the holdings of highly rated tranches that donot use securitization activity as a motivation for these holdings.
446
at Brigham
Young U
niversity on August 4, 2014
http://rfs.oxfordjournals.org/D
ownloaded from

[16:28 7/1/2014 RFS-hht077.tex] Page: 447 404–453
Holdings of Highly Rated Securitization Tranches
App
endi
x
Tabl
eA
1D
epen
dent
vari
able
s
Var
iabl
ena
me
Sche
dule
Dat
am
nem
onic
Hig
hly
rate
dre
sidu
al:S
umof
nong
over
nmen
tor
nona
genc
ym
ortg
age-
back
edse
curi
ties
(MB
Ss)
asw
ella
sas
set-
back
edse
curi
ties
(AB
Ss)
that
are
rate
din
the
high
est
thre
ein
vest
men
t-gr
ade
(e.g
.,A
AA
,AA
,orA
)ca
tego
ries
and
nong
over
nmen
t,no
nage
ncy
MB
Ssin
trad
ing
secu
ritie
s.T
hem
easu
rein
clud
eshe
ld-t
o-m
atur
ity(H
TM
)an
dav
aila
ble-
for-
sale
(AFS
)se
curi
ties
with
20%
or50
%ri
skw
eigh
tmin
usse
curi
ties
in20
%or
50%
risk
-wei
ghtc
ateg
ory
that
are
issu
edor
guar
ante
edby
the
gove
rnm
ento
rgo
vern
men
t-sp
onso
red
agen
cies
.All
valu
esar
eat
amor
tized
cost
s,ex
cept
for
MB
Ss,
from
trad
ing
asse
tsth
atar
ere
cord
edat
fair
valu
es.
Sche
dule
sfr
omFo
rmFR
Y-9
Cas
ofD
ecem
ber
2006
:H
C-R
Item
35(C
olum
nD
)+
Item
35(C
olum
nE
)+
Item
36(C
olum
nD
)+
Item
36(C
olum
nE
)–
HC
-BIt
em2b
(Col
umns
A+
C)
–It
em4a
2(C
olum
nsA
+C
)–
Item
4b1
(Col
umns
A+
C)
–It
em4b
2(C
olum
nsA
+C
)–
Item
3(C
olum
nsA
+C
)+
HC
-DIt
em4c
bhc2
1754
+bh
c517
54bh
c217
73+
bhc5
1773
-bhc
k129
4-bh
ck12
97-b
hck1
703-
bhck
1706
-bhc
k171
4-bh
ck17
16-b
hck1
718-
bhck
1731
-bhc
k849
6-bh
ck84
98+
bhck
3536
Hig
hly
rate
dre
sidu
al+
CD
Os:
Sum
ofth
e“H
ighl
yra
ted
resi
dual
”an
dth
eC
DO
amou
nts
repo
rted
unde
rtr
adin
gas
sets
inJu
ne20
08.
Hig
hly
rate
dre
sidu
al+
Sche
dule
HC
-D(f
rom
Form
FRY
-9C
asof
June
2008
)It
em5a
+It
em5b
Hig
hly
rate
dre
sidu
al+
bhck
f649
+bh
ckf6
50
Hig
hly
rate
dre
sidu
al+
CD
Os
and
wri
tedo
wns
:Su
mof
“Hig
hly
rate
dre
sidu
al+
CD
Os”
and
the
wri
tedo
wns
onC
DO
sbe
twee
nD
ecem
ber
2006
and
June
2008
.H
ighl
yra
ted
resi
dual
+C
DO
s+
CD
Ow
rite
dow
nsfr
omB
loom
berg
Hig
hly
rate
dre
sidu
al+
CD
Os
+C
DO
wri
tedo
wns
from
Blo
ombe
rg
Hig
hly
rate
dre
sidu
al+
CD
Os
and
wri
tedo
wns
:+
cond
uits
and
SIV
s:Su
mof
“Hig
hly
rate
dre
sidu
al+
CD
Os
and
wri
tedo
wns
”an
dth
eho
ldin
gsin
off-
bala
nce-
shee
tco
ndui
tsan
dSI
Vs.
Hig
hly
rate
dre
sidu
al+
CD
Os
and
wri
tedo
wns
+ho
ldin
gsin
cond
uits
and
SIV
sfr
omA
char
ya,S
chna
bl,
and
Suar
ez(2
013)
Hig
hly
rate
dre
sidu
al+
CD
Os
and
wri
tedo
wns
+ho
ldin
gsin
cond
uits
and
SIV
sfr
omA
char
ya,
Schn
abl,
and
Suar
ez(2
013)
Bot
tom
-up
high
lyra
ted
tran
ches
:Tot
alva
lue
ofM
BSs
that
are
noti
ssue
dor
guar
ante
edby
the
gove
rnm
ento
rgo
vern
men
t-sp
onso
red
agen
cies
plus
AB
Ss,u
sing
HT
Mse
curi
ties
atam
ortiz
edco
sts
and
AFS
and
trad
ing
secu
ritie
sat
fair
valu
es.N
ote
that
ther
eis
noA
BS
data
for
trad
ing
secu
ritie
sso
the
AB
Spa
rtin
clud
eson
lyH
TM
and
AFS
secu
ritie
s.
Sche
dule
sfr
omFo
rmFR
Y-9
Cas
ofD
ecem
ber
2006
:H
C-B
Item
s4a
3(C
olum
nsA
+D
)+
4b3
(Col
umns
A+
D)
+It
em5
(Col
umn
A+
D)
+H
C-D
Item
4c
bhck
1709
+bh
ck17
13+
bhck
1733
+bh
ck17
36+
bhck
C02
6+bh
ckC
027
+bh
ck35
36
Our
mai
nda
taso
urce
isth
eC
onso
lidat
edFi
nanc
ial
Stat
emen
tsfo
rB
ank
Hol
ding
Com
pani
es,t
hefo
rmFR
Y-9
C.W
efo
cus
onSc
hedu
les
HC
-B(S
ecur
ities
),H
C-D
(Tra
ding
Ass
ets)
,and
HC
-R(R
egul
ator
yC
apita
l)to
cons
truc
tour
mai
nva
riab
les
ofin
tere
st.B
elow
we
listt
heir
defin
ition
sw
ithre
fere
nces
tosc
hedu
les
and
data
mne
mon
ics
inth
efo
rmFR
Y-9
C.
447
at Brigham
Young U
niversity on August 4, 2014
http://rfs.oxfordjournals.org/D
ownloaded from
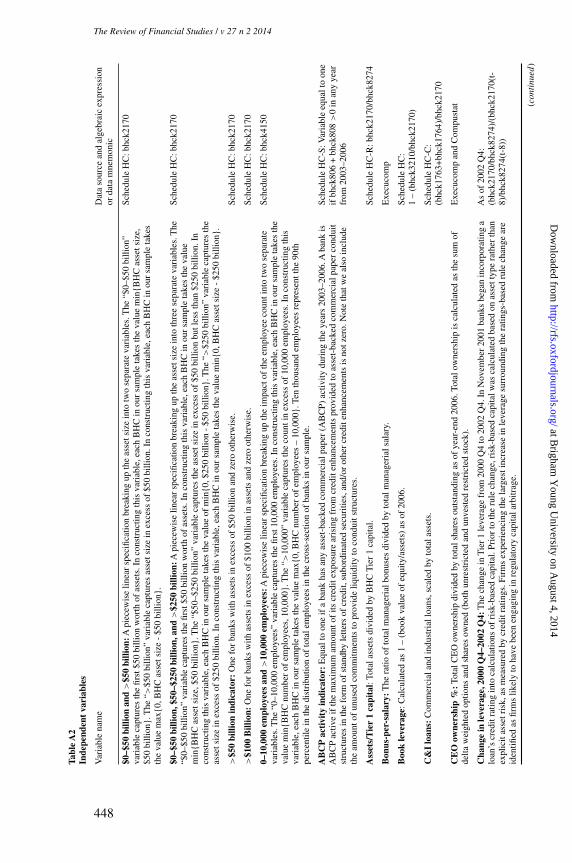
[16:28 7/1/2014 RFS-hht077.tex] Page: 448 404–453
The Review of Financial Studies / v 27 n 2 2014
Tabl
eA
2In
depe
nden
tva
riab
les
Var
iabl
ena
me
Dat
aso
urce
and
alge
brai
cex
pres
sion
orda
tam
nem
onic
$0–$
50bi
llion
and
>$5
0bi
llion
:Api
ecew
ise
linea
rsp
ecifi
catio
nbr
eaki
ngup
the
asse
tsiz
ein
totw
ose
para
teva
riab
les.
The
“$0–
$50
billi
on”
vari
able
capt
ures
the
first
$50
billi
onw
orth
ofas
sets
.In
cons
truc
ting
this
vari
able
,eac
hB
HC
inou
rsa
mpl
eta
kes
the
valu
em
in{B
HC
asse
tsiz
e,$5
0bi
llion
}.T
he“>
$50
billi
on”
vari
able
capt
ures
asse
tsiz
ein
exce
ssof
$50
billi
on.I
nco
nstr
uctin
gth
isva
riab
le,e
ach
BH
Cin
our
sam
ple
take
sth
eva
lue
max
{0,B
HC
asse
tsiz
e-
$50
billi
on}.
Sche
dule
HC
:bhc
k217
0
$0–$
50bi
llion
,$50
–$25
0bi
llion
,and
>$2
50bi
llion
:Api
ecew
ise
linea
rsp
ecifi
catio
nbr
eaki
ngup
the
asse
tsiz
ein
toth
ree
sepa
rate
vari
able
s.T
he“$
0–$5
0bi
llion
”va
riab
leca
ptur
esth
efir
st$5
0bi
llion
wor
thof
asse
ts.I
nco
nstr
uctin
gth
isva
riab
le,e
ach
BH
Cin
our
sam
ple
take
sth
eva
lue
min
{BH
Cas
sets
ize,
$50
billi
on}.
The
“$50
–$25
0bi
llion
”va
riab
leca
ptur
esth
eas
sets
ize
inex
cess
of$5
0bi
llion
butl
ess
than
$250
billi
on.I
nco
nstr
uctin
gth
isva
riab
le,e
ach
BH
Cin
our
sam
ple
take
sth
eva
lue
ofm
in{0
,$25
0bi
llion
-$5
0bi
llion
}.T
he“>
$250
billi
on”
vari
able
capt
ures
the
asse
tsiz
ein
exce
ssof
$250
billi
on.I
nco
nstr
uctin
gth
isva
riab
le,e
ach
BH
Cin
our
sam
ple
take
sth
eva
lue
min
{0,B
HC
asse
tsiz
e-
$250
billi
on}.
Sche
dule
HC
:bhc
k217
0
>$5
0bi
llion
indi
cato
r:O
nefo
rba
nks
with
asse
tsin
exce
ssof
$50
billi
onan
dze
root
herw
ise.
Sche
dule
HC
:bhc
k217
0
>$1
00B
illio
n:O
nefo
rba
nks
with
asse
tsin
exce
ssof
$100
billi
onin
asse
tsan
dze
root
herw
ise.
Sche
dule
HC
:bhc
k217
0
0–10
,000
empl
oyee
san
d>
10,0
00em
ploy
ees:
Api
ecew
ise
linea
rsp
ecifi
catio
nbr
eaki
ngup
the
impa
ctof
the
empl
oyee
coun
tint
otw
ose
para
teva
riab
les.
The
“0–1
0,00
0em
ploy
ees”
vari
able
capt
ures
the
first
10,0
00em
ploy
ees.
Inco
nstr
uctin
gth
isva
riab
le,e
ach
BH
Cin
our
sam
ple
take
sth
eva
lue
min
{BH
Cnu
mbe
rof
empl
oyee
s,10
,000
}.T
he“>
10,0
00”
vari
able
capt
ures
the
coun
tin
exce
ssof
10,0
00em
ploy
ees.
Inco
nstr
uctin
gth
isva
riab
le,e
ach
BH
Cin
our
sam
ple
take
sth
eva
lue
max
{0,B
HC
num
ber
ofem
ploy
ees
–10
,000
}.Te
nth
ousa
ndem
ploy
ees
repr
esen
tthe
90th
perc
entil
ein
the
dist
ribu
tion
ofto
tale
mpl
oyee
sin
the
cros
s-se
ctio
nof
bank
sin
our
sam
ple.
Sche
dule
HC
:bhc
k415
0
AB
CP
acti
vity
indi
cato
r:E
qual
toon
eif
aba
nkha
san
yas
set-
back
edco
mm
erci
alpa
per
(AB
CP)
activ
itydu
ring
the
year
s20
03–2
006.
Aba
nkis
AB
CP
activ
eif
the
max
imum
amou
ntof
itscr
edit
expo
sure
aris
ing
from
cred
iten
hanc
emen
tspr
ovid
edto
asse
t-ba
cked
com
mer
cial
pape
rco
ndui
tst
ruct
ures
inth
efo
rmof
stan
dby
lette
rsof
cred
it,su
bord
inat
edse
curi
ties,
and/
orot
her
cred
iten
hanc
emen
tsis
notz
ero.
Not
eth
atw
eal
soin
clud
eth
eam
ount
ofun
used
com
mitm
ents
topr
ovid
eliq
uidi
tyto
cond
uits
truc
ture
s.
Sche
dule
HC
-S:V
aria
ble
equa
lto
one
ifbh
ck80
6+
bhck
808
>0
inan
yye
arfr
om20
03–2
006
Ass
ets/
Tie
r1
capi
tal:
Tota
lass
ets
divi
ded
byB
HC
Tie
r1
capi
tal.
Sche
dule
HC
-R:b
hck2
170/
bhck
8274
Bon
us-p
er-s
alar
y:T
hera
tioof
tota
lman
ager
ialb
onus
esdi
vide
dby
tota
lman
ager
ials
alar
y.E
xecu
com
p
Boo
kle
vera
ge:C
alcu
late
das
1–
(boo
kva
lue
ofeq
uity
/ass
ets)
asof
2006
.Sc
hedu
leH
C:
1–
(bhc
k321
0/bh
ck21
70)
C&
Ilo
ans:
Com
mer
cial
and
indu
stri
allo
ans,
scal
edby
tota
lass
ets.
Sche
dule
HC
-C:
(bhc
k176
3+bh
ck17
64)/
bhck
2170
CE
Oow
ners
hip
%:T
otal
CE
Oow
ners
hip
divi
ded
byto
tals
hare
sou
tsta
ndin
gas
ofye
ar-e
nd20
06.T
otal
owne
rshi
pis
calc
ulat
edas
the
sum
ofde
ltaw
eigh
ted
optio
nsan
dsh
ares
owne
d(b
oth
unre
stri
cted
and
unve
sted
rest
rict
edst
ock)
.E
xecu
com
pan
dC
ompu
stat
Cha
nge
inle
vera
ge,2
000
Q4–
2002
Q4:
The
chan
gein
Tie
r1
leve
rage
from
2000
Q4
to20
02Q
4.In
Nov
embe
r20
01ba
nks
bega
nin
corp
orat
ing
alo
an’s
cred
itra
ting
into
calc
ulat
ions
ofri
sk-b
ased
capi
tal.
Prio
rto
the
rule
chan
ge,r
isk-
base
dca
pita
lwas
calc
ulat
edba
sed
onas
sett
ype
rath
erth
anex
plic
itas
setr
isk,
asm
easu
red
bycr
edit
ratin
gs.F
irm
sex
peri
enci
ngth
ela
rges
tinc
reas
ein
leve
rage
surr
ound
ing
the
ratin
gs-b
ased
rule
chan
gear
eid
entifi
edas
firm
slik
ely
toha
vebe
enen
gagi
ngin
regu
lato
ryca
pita
larb
itrag
e.
As
of20
02Q
4:(b
hck2
170/
bhck
8274
)/(b
hck2
170(
t-8)
/bhc
k827
4(t-
8))
(con
tinu
ed)
448
at Brigham
Young U
niversity on August 4, 2014
http://rfs.oxfordjournals.org/D
ownloaded from

[16:28 7/1/2014 RFS-hht077.tex] Page: 449 404–453
Holdings of Highly Rated Securitization Tranches
Tabl
eA
2C
onti
nued
Var
iabl
ena
me
Dat
aso
urce
and
alge
brai
cex
pres
sion
orda
tam
nem
onic
Com
pens
atio
nre
sidu
al:T
his
vari
able
isco
nstr
ucte
dby
com
putin
gth
elo
gof
aver
age
tota
lexe
cutiv
eco
mpe
nsat
ion
from
2003
–200
6,w
hich
isre
gres
sed
onth
elo
gof
firm
s’20
06m
arke
tcap
.The
resi
dual
from
this
regr
essi
on,e
stim
ated
in20
06,s
erve
sas
the
com
pens
atio
nre
sidu
alva
riab
lein
the
cros
s-se
ctio
nalr
egre
ssio
nses
timat
edin
2006
.
Exe
cuco
mp
and
Com
pust
atFo
rth
eba
nks
that
are
notc
over
edin
Exe
cuco
mp,
we
hand
-col
lect
edda
tafr
omth
eir
prox
yst
atem
ents
.
Con
duit
indi
cato
r:O
neif
the
BH
Cis
iden
tified
asha
ving
spon
sore
da
cond
uita
ndze
root
herw
ise.
Ach
arya
,Sch
nabl
,and
Suar
ez(2
013)
.
Dol
lar
gain
from
+1%
:The
chan
gein
CE
Ow
ealth
per
1%in
crea
sein
shar
ehol
der
wea
lth.I
tis
calc
ulat
edas
mar
ketc
ap*
0.01
*de
lta-w
eigh
ted
owne
rshi
p.E
xecu
com
pan
dC
ompu
stat
For
the
bank
sth
atar
eno
tcov
ered
inE
xecu
com
p,w
eha
nd-c
olle
cted
data
from
thei
rpr
oxy
stat
emen
ts.
Equ
ity
risk
(%):
The
perc
entc
hang
ein
CE
Ow
ealth
that
resu
ltsgi
ven
ach
ange
invo
latil
ityof
1%.T
heva
riab
leis
crea
ted
byca
lcul
atin
gth
ech
ange
inop
tion
valu
egi
ven
a1%
chan
gein
vola
tility
.The
chan
gein
optio
nva
lue
for
agi
ven
chan
gein
vola
tility
isth
endi
vide
dby
the
sum
ofth
eva
lue
ofth
ede
lta-w
eigh
ted
optio
npo
rtfo
lio,s
tock
hold
ings
,and
pref
erre
dsh
are
hold
ings
ofth
eC
EO
.
Exe
cuco
mp
and
Com
pust
atFo
rth
eba
nks
that
are
notc
over
edin
Exe
cuco
mp,
we
hand
-col
lect
edda
tafr
omth
eir
prox
yst
atem
ents
.
Gov
erna
nce
inde
x:In
dex
offo
rty-
one
firm
-lev
elat
trib
utes
from
Ris
kMet
rics
.The
inde
xin
crea
ses
with
the
prot
ectio
nof
min
ority
shar
ehol
ders
and
inco
rpor
ates
mea
sure
sof
boar
dst
ruct
ure,
antit
akeo
ver
prov
isio
ns,a
udito
rse
lect
ion,
and
com
pens
atio
nan
dow
ners
hip
stru
ctur
e.R
iskM
etri
cs:G
over
nanc
ein
dex
from
Agg
arw
alet
al.(
2011
)
Hig
h-co
mpe
nsat
ion
elas
tici
ty:T
heel
astic
ityof
the
CE
O’s
tota
lcom
pens
atio
nto
chan
ges
inba
nkR
OE
.Tot
alco
mpe
nsat
ion
com
pris
edof
the
follo
win
g:sa
lary
,bon
us,o
ther
annu
al,t
otal
valu
eof
rest
rict
edst
ock
gran
ted,
tota
lval
ueof
stoc
kop
tions
gran
ted
(usi
ngB
lack
-Sch
oles
),lo
ng-t
erm
ince
ntiv
epa
yout
s,an
dal
loth
erto
tal.
Ret
urn
oneq
uity
isca
lcul
ated
as:n
etin
com
e/co
mm
oneq
uity
tota
las
offis
caly
ear-
end.
Bon
usel
astic
ityis
com
pute
dus
ing
only
the
tota
ldol
lar
amou
ntof
bonu
ses
paid
toth
eC
EO
.In
our
regr
essi
onfr
amew
ork,
we
crea
tean
indi
cato
rva
riab
leeq
ualt
oon
efo
rB
HC
sw
ithab
ove-
med
ian
leve
lsof
com
p/R
OE
elas
ticity
.
Exe
cuco
mp
and
Com
pust
atFo
rth
eba
nks
that
are
notc
over
edin
Exe
cuco
mp,
we
hand
-col
lect
edda
tafr
omth
eir
prox
yst
atem
ents
.
Log
mar
ket
cap:
Log
ofD
ecem
ber
2006
mar
ketc
apita
lizat
ion.
CR
SP:M
arke
tpri
ce*
shar
esou
tsta
ndin
g
Log
mar
ket-
to-b
ook:
Log
ofth
era
tioof
Dec
embe
r20
06m
arke
tcap
italiz
atio
nto
2006
fisca
lyea
r-en
dbo
okva
lue
ofeq
uity
.C
RSP
and
Com
pust
at:(
Mar
ket
pric
e*sh
ares
outs
tand
ing)
/boo
kva
lue
ofeq
uity
,fisc
alye
ar-e
nd
Log
z-sc
ore:
Log
[(R
OA
+ca
pita
lrat
io)/
sigm
a(R
OA
)].R
OA
and
capi
talr
atio
inth
enu
mer
ator
are
calc
ulat
edas
of20
06.S
igm
aR
OA
isca
lcul
ated
usin
gqu
arte
rly
data
from
2000
–200
5.R
OA
:(bh
ck43
40/b
hck2
170)
Cap
.ra
tio:(
Mar
ketC
ap20
06/b
hck2
170)
Mar
ket
Lev
erag
e:C
alcu
late
das
1–
[mar
ketv
alue
ofeq
uity
/(m
arke
tval
ueof
equi
ty+
book
valu
eof
liabi
litie
s)]
asof
2006
.Mar
ketv
alue
ofeq
uity
isca
lcul
ated
as20
06ye
ar-e
ndst
ock
pric
e*sh
ares
outs
tand
ing.
CR
SP:M
arke
tpri
ce*
shar
esou
tsta
ndin
gB
ook
liabi
litie
s:Sc
hedu
leH
C:b
hck2
948
for
book
valu
eof
liabi
litie
s.
(con
tinu
ed)
449
at Brigham
Young U
niversity on August 4, 2014
http://rfs.oxfordjournals.org/D
ownloaded from

[16:28 7/1/2014 RFS-hht077.tex] Page: 450 404–453
The Review of Financial Studies / v 27 n 2 2014
Tabl
eA
2C
onti
nued
Var
iabl
ena
me
Dat
aso
urce
and
alge
brai
cex
pres
sion
orda
tam
nem
onic
Mar
ket
risk
equi
vale
ntba
nkin
dica
tor:
Equ
alto
one
for
any
BH
Cth
atis
subj
ectt
oth
em
arke
tris
kca
pita
lgui
delin
es.A
BH
Cis
subj
ectt
oth
em
arke
tris
kca
pita
lgui
delin
esan
dth
usab
leto
use
estim
ates
ofva
lue
atri
skin
calc
ulat
ing
capi
talr
equi
rem
ents
,if
itis
cons
olid
ated
trad
ing
acti
vity
,de
fined
asth
esu
mof
trad
ing
asse
tsan
dlia
bilit
ies
for
the
prev
ious
quar
ter,
equa
ls(1
)10
%or
mor
eof
the
BH
Cs
tota
lass
ets
for
the
prev
ious
quar
ter
or(2
)$1
billi
onor
mor
e.
Sche
dule
HC
-R:V
aria
ble
equa
lto
one
ifbh
ck16
51>
0as
ofD
ecem
ber
31,
2006
(Mor
tgag
ese
c.$ t
-M
ortg
age
sec.
$ t−4
)/A
sset
s t−4
:Yea
r-ov
er-y
ear
chan
ge(s
ampl
edqu
arte
rly)
inth
eto
tala
mou
ntof
the
outs
tand
ing
prin
cipl
eba
lanc
eof
1–4
fam
ilyre
side
ntia
lloa
nsan
dho
me
equi
tylo
ans
sold
and
secu
ritiz
edw
ithse
rvic
ing
reta
ined
orw
ithre
cour
seor
othe
rse
ller-
prov
ided
cred
iten
hanc
emen
ts.
Sche
dule
HC
-S:T
he$
amou
ntof
mor
tgag
ese
curi
tizat
ion
activ
ityis
calc
ulat
edas
(bhc
kb70
5+
bhck
b706
)
Mor
tgag
elo
ans:
Sum
ofal
lloa
nsse
cure
dby
real
esta
te,s
cale
dby
tota
lass
ets.
Sche
dule
HC
-C:b
hck1
410/
bhck
2170
Net
deri
vati
ves/
asse
ts:T
hesu
mof
bene
ficia
rycr
edit
deri
vativ
es–
guar
anto
rcr
edit
deri
vativ
es(a
llin
notio
nala
mou
nts)
,sca
led
byto
tala
sset
s.B
enefi
ciar
yan
dgu
aran
tor
cred
itde
riva
tives
are
calc
ulat
edas
the
sum
ofC
DS,
tota
lret
urn
swap
s,cr
edit
optio
ns,a
nd“o
ther
.”Sc
hedu
leH
C-L
:[(b
hckc
969
+bh
ckc9
71+
bhck
c973
+bh
ckc9
75)
-(b
hckc
968
+bh
ckc9
70+
bhck
c972
+bh
ckc9
74)]
/bhc
k217
0Sc
hedu
leH
C:(
bhdm
b993
+bh
ckb9
95+
bhck
3548
)/bh
ck21
70
“Oth
er”
H.T
.M.a
ndA
.F.S
.sec
urit
ies
(gov
.,ag
ency
,and
low
er-r
ated
priv
ate-
labe
lH.T
.M.a
ndA
.F.S
.sec
urit
ies)
:The
port
ion
ofhe
ld-t
o-m
atur
ityan
dav
aila
ble-
for-
sale
secu
ritie
she
ldon
BH
Cba
lanc
esh
eets
that
are
gove
rnm
ento
rag
ency
secu
ritie
s.T
his
vari
able
also
capt
ures
the
port
ion
ofno
n-hi
ghly
-rat
edno
nage
ncy,
nong
over
nmen
t(pr
ivat
e-la
bel)
secu
ritie
s.It
isca
lcul
ated
asth
edi
ffer
ence
betw
een
the
tota
lHT
Man
dA
FSse
curi
ties
onB
HC
sba
lanc
esh
eeta
ndth
eto
tal“
high
lyra
ted
resi
dual
”H
TM
and
AFS
secu
ritie
son
BH
Cs
bala
nce
shee
t.
HC
-Bite
m8
(Col
umns
Aan
dD
)–
Hig
hly
rate
dre
sidu
al(s
eeco
nstr
uctio
nin
Tabl
eA
1)+
HC
-Dite
m4c
:(b
hck1
754+
bhck
1773
)–
Hig
hly
rate
dre
sidu
al(s
eeTa
ble
A1)
–bh
ck35
36
“Oth
er”
trad
ing
secu
riti
es(g
ov.,
agen
cy,a
ndlo
wer
-rat
edpr
ivat
ela
belt
radi
ngse
curi
ties
):T
hepo
rtio
nof
trad
ing
asse
tson
BH
Cs
bala
nce
shee
ttha
tare
noti
nclu
ded
inth
ehi
ghly
-rat
edre
sidu
al.T
his
incl
udes
allg
over
nmen
tand
agen
cyse
curi
ties
asw
ella
sno
n-hi
ghly
-rat
edpr
ivat
e-la
bel
secu
ritie
she
ldon
the
trad
ing
book
.Iti
sca
lcul
ated
asth
edi
ffer
ence
betw
een
tota
lBH
Ctr
adin
gas
sets
and
the
“all
othe
rM
BS”
port
ion
oftr
adin
gas
sets
.
HC
-Dite
m12
(Col
umn
A)
–ite
m4c
(Col
umn
A):
bhck
3545
–bh
ck35
36.
Pri
orR
etur
ns:
BH
Cbu
y-an
d-ho
ldre
turn
sca
lcul
ated
from
Janu
ary
2005
–Jan
uary
2006
.C
RSP
Rat
ioof
tota
lage
ncy
hold
ings
toas
sets
:The
sum
ofal
lage
ncy-
issu
edse
curi
ties
held
asH
.T.M
.,A
.F.S
.,an
din
the
trad
ing
book
,sca
led
byto
tal
asse
ts.
Sche
dule
HC
:(bh
ck12
89+
bhck
1293
+bh
ck12
94+
bhck
1298
+bh
ck16
98+
bhck
1703
+bh
ck17
09+
bhck
1714
+bh
ck17
18+
bhck
1702
+bh
ck17
07+
bhck
1713
+bh
ck17
17+
bhck
1732
+bh
ck35
32+
bhck
3534
+bh
ck35
35)/
bhck
2170
RO
Avo
lati
lity:
Stan
dard
devi
atio
nin
RO
Aus
ing
quar
terl
yda
tafr
om20
00–2
005.
RO
A:(
bhck
4340
/bhc
k217
0) (con
tinu
ed)
450
at Brigham
Young U
niversity on August 4, 2014
http://rfs.oxfordjournals.org/D
ownloaded from

[16:28 7/1/2014 RFS-hht077.tex] Page: 451 404–453
Holdings of Highly Rated Securitization Tranches
Tabl
eA
2C
onti
nued
Var
iabl
ena
me
Dat
aso
urce
and
alge
brai
cex
pres
sion
orda
tam
nem
onic
Ris
km
anag
emen
tin
dex
(RM
I):
Itis
anin
dex
that
mea
sure
sth
est
reng
thof
oper
atio
nalr
isk
man
agem
enta
tthe
larg
estp
ublic
lylis
ted
bank
hold
ing
com
pani
es(B
HC
s)in
the
Uni
ted
Stat
es.I
tis
cons
truc
ted
byta
king
the
first
prin
cipa
lcom
pone
ntof
the
five
key
risk
man
agem
entv
aria
bles
:a
dum
my
vari
able
that
iden
tifies
whe
ther
orno
tthe
chie
fri
skof
ficer
(CR
O)
isan
exec
utiv
eof
ficer
atth
eB
HC
;adu
mm
yva
riab
leth
atid
entifi
esw
heth
eror
nott
heC
RO
isam
ong
the
top
five
high
estp
aid
exec
utiv
esat
the
BH
C;t
hera
tioof
the
CR
O’s
tota
lcom
pens
atio
nto
the
CE
O’s
tota
lco
mpe
nsat
ion;
adu
mm
yva
riab
leth
atid
entifi
esw
heth
erat
leas
tone
ofth
egr
eyor
inde
pend
entd
irec
tors
serv
ing
onth
ebo
ard’
sri
skco
mm
ittee
has
bank
ing
expe
rien
ce;a
nda
dum
my
vari
able
iden
tifyi
ngif
the
BH
C’s
boar
dri
skco
mm
ittee
met
mor
efr
eque
ntly
duri
ngth
eye
arco
mpa
red
toth
eav
erag
ebo
ard
risk
com
mitt
eeac
ross
allB
HC
s.Se
eE
llula
ndY
erra
mill
i(20
13)
for
ade
taile
dde
scri
ptio
nof
thes
eva
riab
les.
Ellu
land
Yer
ram
illi(
2013
)
Ris
k-w
eigh
ted
asse
ts/T
ier
1ca
pita
l:R
isk-
wei
ghte
das
sets
divi
ded
byB
HC
Tie
r1
capi
tal.
Sche
dule
HC
-R:b
hckA
223/
bhck
8274
(Sec
.$t
–se
c.$ t
−4)/
asse
tst−
4:Y
ear-
over
-yea
r(s
ampl
edqu
arte
rly)
chan
gein
the
tota
lam
ount
ofth
eou
tsta
ndin
gpr
inci
ple
bala
nce
ofas
sets
sold
and
secu
ritiz
edw
ithse
rvic
ing
reta
ined
orw
ithre
cour
seor
othe
rse
ller-
prov
ided
cred
iten
hanc
emen
ts.
Sche
dule
HC
-S:T
he$
amou
ntof
secu
ritiz
atio
nac
tivity
isca
lcul
ated
as(b
hckb
705
+bh
ckb7
06+
bhck
b707
+bh
ckb7
08+
bhck
b709
+bh
ckb7
10+
bhck
b711
)
Secu
riti
zati
on-a
ctiv
ein
dica
tor:
Tota
lout
stan
ding
prin
cipa
lbal
ance
ofas
sets
sold
and
secu
ritiz
edw
ithse
rvic
ing
reta
ined
orw
ithre
cour
seor
othe
rse
ller-
prov
ided
cred
iten
hanc
emen
ts.T
hese
curi
tizat
ion
activ
edu
mm
yva
riab
leis
equa
lto
one
for
bank
sth
atha
vean
ypo
sitiv
eam
ount
ofse
curi
tizat
ion
activ
ityin
the
year
s20
03–2
006.
Sche
dule
HC
-S:V
aria
ble
equa
lto
one
if(b
hckb
705
+bh
ckb7
06+
bhck
b707
+bh
ckb7
08+
bhck
b709
+bh
ckb7
10+
bhck
b711
)>
0in
any
year
2003
–200
6
Secu
riti
zati
on-l
eagu
e-ta
ble
indi
cato
r:E
qual
toon
efo
ran
yB
HC
that
was
invo
lved
inth
eun
derw
ritin
gof
any
type
ofse
curi
tizat
ion,
incl
udin
gsu
bpri
me
RM
BS,
CL
Os,
CB
Os,
and
CD
Os.
Moo
dy’s
eMax
xD
ata
Serv
ices
Secu
riti
zati
on-l
eagu
e-ta
ble
rank
:Equ
alto
zero
for
allb
anks
inth
esa
mpl
e,ex
cept
the
top-
ten
bank
sin
the
secu
ritiz
atio
nle
ague
tabl
e,w
hich
take
the
valu
eof
thei
rle
ague
-tab
lera
nk,i
nre
vers
eor
der.
(e.g
.,C
itigr
oup,
the
top
secu
ritiz
atio
n-pr
oduc
ing
bank
inth
esa
mpl
eta
kes
the
valu
e10
,Ban
kof
Am
eric
ais
9,JP
Mor
gan
is8,
etc.
)
Moo
dy’s
eMax
xD
ata
Serv
ices
Shor
t-te
rmw
hole
sale
fund
ing/
asse
ts:T
hesu
mof
time
depo
sits
of$1
00,0
00or
mor
e+
com
mer
cial
pape
r+fe
dera
lfun
dspu
rcha
sed
and
secu
ritie
sso
ldun
der
agre
emen
tsto
repu
rcha
se+
othe
rbo
rrow
edm
oney
with
are
mai
ning
mat
urity
of1
year
orle
ss+
trad
ing
liabi
litie
s,sc
aled
byto
tala
sset
s.Sc
hedu
leH
C:(
bhcb
2604
+bh
ck23
09+
bhdm
b993
+bh
ckb9
95+
bhck
2322
+bh
ck35
48)/
bhck
2170
Stoc
kre
turn
vola
tilit
y:V
olat
ility
ofw
eekl
yst
ock
retu
rns
calc
ulat
edus
ing
Janu
ary–
Dec
embe
r20
06sa
mpl
e.C
RSP
Unu
sed
loan
com
mit
men
ts:
Unu
sed
port
ion
ofre
side
ntia
land
com
mer
cial
real
esta
telo
anco
mm
itmen
ts.
Sche
dule
HC
-L:
(bhc
k381
4+bh
ck38
16)/
bhck
2170
451
at Brigham
Young U
niversity on August 4, 2014
http://rfs.oxfordjournals.org/D
ownloaded from

[16:28 7/1/2014 RFS-hht077.tex] Page: 452 404–453
The Review of Financial Studies / v 27 n 2 2014
References
Acharya, V. V., and M. Richardson. 2009. Causes of the financial crisis. Critical Review 21:195–210.
Acharya, V., P. Schnabl, and G. Suarez. 2013. Securitization without risk transfer. Journal of Financial Economics107:515–536.
Aggarwal, R., I. Erel, M. Ferreira, and P. Matos. 2011. Does governance travel around the world? Evidence frominstitutional investors. Journal of Financial Economics 100:54–181.
Bebchuk, L., and H. Spamann. 2010. Regulating bankers pay. Georgetown Law Journal 98:247–87.
Bernanke, B. S. 2010. Statement before the Financial Crisis Inquiry Commission. Washington, DC.
Boyd, J., S. Graham, and S. Hewitt. 1993. Bank holding company mergers with nonbank financial firms: Effectsof the risk of failure. Journal of Banking and Finance 17:43–63.
Brunnermeier, M. 2009. Deciphering the liquidity and credit crunch 2007–2008. Journal of EconomicPerspectives 23:77–100.
Carbo-Valverde, S., E. J. Kane, and F. Rodriguez-Fernandez. 2010. Safety-net benefits conferred on difficult-to-fail-and-unwind banks in the US and Europe before and during the Great Recession. NBER WorkingPaper.
Cheng, I., H. Hong, and J. Scheinkman. 2010. Yesterday’s heroes: Compensation and creative risk-taking. NBERWorking Paper.
Coval, J., J. Jurek, and E. Stafford. 2009. The economics of structured finance. Journal of Economic Perspectives23:3–25.
DeMarzo, P. 2005. The pooling and tranching of securities: A model of informed intermediation. Review ofFinancial Studies 18:1–35.
DeMarzo, P., and D. Duffie. 1999. A liquidity-based model of security design. Econometrica 67:65–99.
Duffie, D. 2008. Innovations in credit risk transfer: implications for financial stability. Working Paper, BIS.
Duffie, D., and N. Garleanu. 2001. Risk and valuation of collateralized debt obligations. Financial AnalystsJournal 57:41–59.
Ellul, A., and V. Yerramilli. 2013. Stronger risk controls, lower risk: Evidence from U.S. bank holding companiesJournal of Finance Advance Access published. 10.1111/jofi.12057
Fahlenbrach, R., and R. Stulz. 2011. Bank CEO incentives and the credit crisis. Journal of Financial Economics99:11–26.
Fama, E. 1985. What’s different about banks? Journal of Monetary Economics 15:29–40.
Fender, I., and J. Mitchell. 2009. Incentives and tranche retention in securitization: a screening model. WorkingPaper, Bank for International Settlements.
Financial Crisis Inquiry Commission. 2011. The Final Crisis Inquiry Report, GPO, Washington DC.
Gennaioli, N., A. Shleifer, and R. Vishny. 2012. Neglected risks, financial innovation, and financial fragility.Journal of Financial Economics 104:452–68.
Gibson, M. S. 2004. Understanding the risk of synthetic CDOs. Working Paper, Federal Reserve Board.
Gorton, G., and A. Metrick. 2013. Securitization. In The handbook of the economics of finance, 2A. Ed.G. Constantinides, M. Harris, and R. Stulz. Amsterdam: Elsevier.
Gorton, G., and G. Pennacchi. 1989. Are loan sales really off-balance sheet? Journal of Accounting, Auditing andFinance 4:125–45.
———. 1995. Banks and loan sales: Marketing non-marketable assets. Journal of Monetary Economics35:389–411.
452
at Brigham
Young U
niversity on August 4, 2014
http://rfs.oxfordjournals.org/D
ownloaded from

[16:28 7/1/2014 RFS-hht077.tex] Page: 453 404–453
Holdings of Highly Rated Securitization Tranches
Gorton, G., and N. Souleles. 2006. Special purpose vehicles and securitization. In The risks of financial institutions.Ed. R. Stulz and M. Carey. Chicago: University of Chicago Press.
Greenbaum, S. I., and A. V. Thakor. 1987. Bank funding modes. Journal of Banking and Finance 11:379–401.
Greenspan, A. 2004. Economic flexibility, speech to HM Treasury Enterprise Conference. London, U.K.
Huberman, G. 2001. Familiarity breeds investment. Review of Financial Studies 14:659–80.
Iannotta, G., and G. Pennacchi. 2011. Bank regulation, credit ratings, and systematic risk. Unpublished WorkingPaper, University of Illinois.
Imbens, G., and M. Kolesár. 2012. Robust standard errors in small samples: Some practical advice. WorkingPaper, NBER.
Laeven, L., and R. Levine. 2009. Bank governance, regulation, and risk-taking. Journal of Financial Economics93:259–75.
Loutskina, E., and Philip E. Strahan. 2011. Informed and uninformed investment in housing: The downside ofdiversification. Review of Financial Studies 24:1447–80.
Nadauld, T., and S. Sherlund. 2013. The impact of securitization on the extension of subprime credit. Journal ofFinancial Economics 107:454–76.
Pennacchi, G. 1988. Loan sales and the cost of bank capital. Journal of Finance 43:375–96.
Rajan, R. 2006. Has finance made the world riskier? European Financial Management 12:499–533.
———. 2010. Fault lines. Princeton: Princeton University Press.
Shleifer, A., and R. Vishny. 2010. Unstable banking. Journal of Financial Economics 97:306–18.
Stulz, R. M. 2008. Risk management failures: What are they and when do they happen? Journal of AppliedCorporate Finance 20:39–48.
UBS. 2008. Shareholder report on UBS’s write-downs. Available at: www.ubs.com.
453
at Brigham
Young U
niversity on August 4, 2014
http://rfs.oxfordjournals.org/D
ownloaded from