Embed Size (px)
Citation preview
Why did financial institutions sell RMBS at fire sale prices during the
financial crisis?
by
Craig B. Merrill, Taylor D. Nadauld, René M. Stulz, and Shane M. Sherlund*
February 2012
Abstract
Much attention has been paid to the large decreases in value of non-agency residential mortgage-backed
securities (RMBS) during the financial crisis. Many observers have argued that the fall in prices was
partly caused by fire sales. We use capital requirements and accounting rules to identify circumstances
where financial institutions had incentives to engage in fire sales and then examine whether such sales
occurred. For financial institutions subject to credit-sensitive capital requirements, capital requirements
increase as an asset’s credit becomes impaired. When accounting rules require such an asset’s value to be
marked-to-market and the fair value loss to be recognized in earnings, a capital-constrained firm can
improve its capital position by selling the credit-impaired asset even if it has to accept a liquidity discount
to do so. In contrast, a financial firm whose fair value losses are not recognized in earnings for the
purpose of calculating capital requirements is more likely to satisfy capital requirements by selling liquid
assets whose value has not fallen and hence would be unlikely to engage in fire sales. Using a sample of
5,000 repeat transactions of non-agency RMBS by insurance companies from 2006 to 2009, we show that
insurance companies that became more capital-constrained because of operating losses (uncorrelated with
RMBS credit quality) and also recognized fair value losses sold comparable RMBS at much lower prices
than other insurance companies during the crisis.
* Merrill and Nadauld are at the Marriott School of Management, Brigham Young University, Sherlund is
at the Federal Reserve Board, and Stulz is at the Fisher College of Business, Ohio State University, ECGI,
and NBER. We are grateful to David Babbel, Richard Herring, Jan Jindra, Christian Leuz, and to seminar
participants at Brigham Young University, the Ohio State University, and the University of Chicago for
helpful comments. The analysis and conclusions contained in this paper are those of the authors and do
not necessarily reflect the views of the Board of Governors of the Federal Reserve System, its members,
or its staff.
1
A key fact of the financial crisis is the dramatic drop in value of structured finance securities. Many
observers have argued that the drop in transaction prices for the more senior tranches exceeded the
adverse change in the fundamental value of these securities and that the magnitude of the drop is partly
explained by loss of liquidity and fire sales.1 As many of these securities were held by financial
institutions, reductions in their value led to lower levels of capital, potentially forcing financial
institutions to raise fresh equity capital or sell low credit quality assets (Brunnermeier (2009), Shleifer and
Vishny (2011)). The forced selling of assets into a market where the most natural buyers of the assets are
themselves constrained can result in fire sale prices (Shleifer and Vishny (1992)).
In this paper we investigate whether there is evidence of fire sale prices in subprime structured
finance securities using a database of trades by insurance companies. We focus on insurance companies
because, in contrast to banks, the accounting treatment of assets differed across different types of
companies while capital requirements did not, and companies had to disclose their trades in RMBS to
their regulators. For a fire sale to take place, the seller has to be in a situation where selling a security in
an illiquid market is optimal. We show that capital requirements and accounting rules for some types of
insurance companies created situations such that they were better off selling an asset below its
fundamental value, i.e., at a fire sale price. Our empirical work shows that these types of companies did
sell subprime structured finance securities at lower prices than other insurance companies when
controlling for determinants of fundamental value.
Financial institutions are required by regulators to hold a minimum level of capital against risky
assets, a means by which regulators protect the customers of financial institutions and/or the insurance
funds that insure the liabilities of these financial institutions. In the U.S., life insurance and property and
casualty (P&C) insurance companies are subject to credit-sensitive capital requirements. Banks and
broker dealers are also subject to credit-sensitive capital requirements for structured finance securities.2
1 See, for instance, Bank of England (2008).
2 See Erel, Nadauld, and Stulz (2012) for a discussion of the capital requirements for U.S. banks concerning
structured finance securities. Outside the U.S., banks subject to Basel II have capital requirements that are sensitive
2
The amount of capital an institution has to hold is a function of the riskiness of the institution’s assets. As
a result, costly capital requirements on credit-impaired securities can create an incentive for financial
intermediaries to sell such securities. However, the incentive to sell credit-impaired securities is
substantially heightened when firms subject to capital requirements also have to adhere to fair value
(often called mark-to-market) accounting practices.
Capital requirements, together with fair value accounting, may trigger the forced sale of a financial
asset for the following reason. A systematic shock to the credit quality of a portion of an institution’s
assets, as occurred during the massive credit downgrades of residential mortgage-backed securities
(RMBS) in 2007-2008, has two important potential effects. First, losses in the value of securities may
reduce an institution’s capital through the impact of losses on earnings either through fair value changes
for assets held for sale or through other-than-temporary impairment (OTTI) statutory accounting rules for
assets available for sale. Second, the decreased credit quality of assets increases the regulatory capital
charge that must be applied to the assets if the financial institution is subject to credit-sensitive capital
requirements. The increased regulatory charge has the effect of lowering the ratio of capital to company
action level risk-based capital (RBC) for the financial institution. If the ratio of capital to company action
level RBC (a.k.a. RBC ratio) threatens to fall below regulatory levels, institutions face one of three
choices: go out of business, raise new capital, or sell risky assets and replace them with safer assets.3
Given that the market for raising new capital can be limited due to the very market conditions that led to
the lowering of an institution’s asset quality, selling risky assets can be a capital-constrained firm’s only
choice, especially in the presence of accounting rules that may have already forced the recognition of
losses. The “sell low credit-quality assets” strategy is viable as long as fire sale discounts do not cause the
resultant RBC ratio to fall relative to pre-sale levels. If, however, fair value accounting does not apply to
to the credit risk of their assets. U.S. banks are subject to Basel I except for market risk and structured finance
securities. Under Basel I, changes in bond ratings have no impact on capital requirements. 3 Throughout the paper we will use the term “capital” to represent assets minus liabilities, which is the numerator in
an RBC ratio calculation. The denominator of the RBC ratio is referred to as “company action level RBC”.
Company action level RBC incorporates adjustments to asset values based on a variety of risks, one of which is
asset credit risk. A detailed example of these calculations is described in Section 1.3 and presented in Figure 1.
3
an asset, then the recognition of the fair value loss upon the sale of the asset may make the financial
institution more capital-constrained if it sells the asset than if it keeps it.4 Thus, the combination of capital
requirements and fair value accounting rules creates an economic incentive for constrained institutions to
sell low credit-quality assets, even at fire sale prices. The preceding argument gives rise to our proposed
capital-requirement-OTTI-fire-sale hypothesis.
Fire sales can be defined as forced transactions which result in prices which are dislocated from
fundamentals. While intuitive, the identification of capital requirements and/or accounting rules as causal
factors in a fire sale transaction presents an empirical challenge for at least two reasons. First, it is
difficult to measure the urgency of an observed transaction (i.e., determining that the transaction is
“forced”), and more importantly, whether the urgency of the sale is on account of capital requirements or
due to other factors. Second, it is difficult to clearly determine a transaction price that incorporates a fire
sale discount. Private label RMBS did not trade on exchanges and dealers had no obligation to report
trade prices. As a result, little information is available about prices and transactions. Further, observed
transaction prices can be low, but may very well be justified by a security’s fundamentals. While we
control for observables using the best available data, it may be the case that unobserved fundamentals of a
security influence the observed price of a transaction.
We propose an identification strategy that exploits the unique features of our data to address these
challenges. First, we focus on the securities transactions of insurance companies. Insurance companies
are required to report their securities holdings, including, importantly, the transaction price for each
security trade, and whether a trade was a purchase or a sale. This allows for the identification of
transactions as “buys” or “sells” from the perspective of the insurance company, a feature we exploit in
determining the sell component of forced sales. There is no comparable requirement for banks, so that
our study cannot be done for banks based on publicly available data. Aside from being required to
disclose information on securities transactions, insurance companies are subject to regulatory capital
4 This argument is made in Boyson, Helwege, and Jindra (2011) to argue against the economic importance of fire
sales.
4
requirements. When the investment portfolio of an insurance company experiences a decline in credit
quality sufficient to raise concerns about risk-based capital ratios, regulation requires action be taken to
increase the quantity of capital or the credit quality of assets, or both. In the face of a shock to credit
quality, insurance companies can take one of two steps to improve their situation. Firms can either raise
new capital or quickly dispose of poor credit quality assets and reinvest the funds in higher credit-quality
assets to decrease the risk charges associated with those assets, thereby increasing their RBC ratio. In this
way, capital requirements can trigger fire sales in that they can force capital-constrained firms to sell low
quality assets into a market where potential buyers, other intermediaries, are themselves constrained.
In addressing the challenge of measuring a security’s fundamentals, we focus our analysis on the
transactions of non-agency (subprime and alt-a) residential mortgage-backed securities (RMBS) that are
held on the balance sheets of insurance companies. We use loan-level data on the mortgage collateral of
RMBS to control for changes in the fundamental value of the RMBS. Our data also provides
observations from multiple transactions of the same RMBS, which allows for the creation of a repeat
sales sample. Estimating changes in RMBS prices over multiple transactions on the same RMBS allows
us to control for unobservable characteristics of the RMBS that could influence the observed transaction
prices.
Testing a capital-requirement-OTTI-fire-sale hypothesis presents at least one additional empirical
challenge. The level of the RBC ratio at an insurance company is determined partly by the value of the
assets as well as the credit quality of the assets themselves. This makes it difficult to disentangle whether
an observed sell transaction that appears to be at a discounted, fire-sale price can be uniquely attributed to
the urgency arising from a low RBC ratio, or a decline in the credit quality of the asset itself. To
disentangle the impact of capital requirements from fundamental asset quality, we focus on a variable
which is correlated with an insurance company’s level of capital that is not correlated with the
fundamental quality of its RMBS portfolio. We classify insurance companies as being more likely to be
capital constrained, and thus more likely to be forced to sell low credit-quality RMBS, if they report
negative operating cash flow in a given year. Operating cash flow essentially represents the insurance
5
company’s underwriting income. Thus, negative operating cash flows most likely occur on account of a
shock to liabilities, and should not capture any capital distress that might occur on account of a decline in
the value of the RMBS held by the insurance company.
The use of negative operating cash flows as an exogenous factor affecting a firm’s capital position
raises several concerns. The first concern is that it is possible that an omitted factor jointly influences
operating cash flow and RMBS performance. For example, an adverse shock to a regional housing market
could jointly affect the operating income of an insurance company that writes P&C policies in the region
and the credit-quality of RMBS. We address this concern by estimating a model designed to rule out this
type of concern. We test whether fire sale discounts are larger for negative operating cash flow firms
selling RMBS which have experienced the largest declines in credit quality. While a regional insurance
company might be subject to negative operating cash flow shocks on account of an adverse housing
market, given the broadly diversified nature of RMBS collateral, it should not be the case that a regional
insurance company is holding RMBS that are exposed differently to the regional housing market shock
than an otherwise comparable insurance company. Further still, our tests include explicit housing market
controls.
A second concern is that poor operating cash flow could be a symptom of poor management and
poorly managed firms might be more likely to make losses due to poor portfolio decisions in asset
management. To address this possibility, we exploit one additional feature of our data for identification.
P&C insurance companies were subject to different statutory accounting rules than life insurance
companies during the bulk of our sample period. P&C firms were required to use fair value OTTI
statutory accounting while life firms were not before 2009, when the National Association of Insurance
Commissioners (NAIC) revised the standard for life firms, forcing them towards OTTI accounting for
regulatory purposes. The differences in accounting practices motivate a test of the capital-requirement-
OTTI-fire-sale hypothesis on the transactions of P&C firms relative to those of life firms for the years
2006-2008. The subsequent change in statutory accounting rules for life firms leads us to explore whether
the transactions of life firms take on fire-sale characteristics in 2009. Time series patterns in fire sales
6
that are correlated with adherence to statutory OTTI treatment are not consistent with a time-invariant
“poor management” explanation of observed pricing discounts for negative cash flow shock firms with
poor RMBS performance.
We find the following results using a sample of 5,014 repeat transactions of non-agency RMBS
between the years 2006-2009. First, P&C firms are significantly more likely than life firms to sell
RMBS, conditional on an observed prior purchase. The likelihood of selling RMBS is also associated
with the RBC ratio of P&C firms. P&C firms with RBC ratios that are closer to the regulatory boundary
are more likely to sell RMBS compared to P&C firms with RBC ratios substantially above the regulatory
boundary. In contrast, prior to the accounting rule change in 2009, life insurance firms exhibit no
significant relationship between RBC ratios and the propensity to sell RMBS. Our second key result is
that, after controlling for observed and unobserved bond fundamentals (by virtue of the repeat sales
sample), the sell transactions of negative operating cash flow insurance companies (our instrument for
capital distress in the pricing analysis) are associated with price discounts relative to the sell transactions
of positive-operating cash flow insurance companies. For P&C firms, a one standard deviation decline in
operating cash flow, conditional on the operating cash flow being negative, is associated with an
estimated 6.5% larger decline in price than otherwise comparable transactions, depending on the
specification.
Our last result distinguishes a fire-sale hypothesis from other possible explanations of the observed
empirical patterns. RMBS which have experienced large credit quality declines require more capital to be
held. As such, a capital-requirement-OTTI-fire-sale hypothesis suggests that the greatest urgency to sell,
and thus the largest price discounts, should be associated with the sale of the lowest credit-quality RMBS.
We provide evidence consistent with this prediction. The sales of constrained insurance companies reveal
larger price discounts for bonds that have experienced the largest declines in credit quality. Fire sale
estimates are as large as 20% for sales of high-default rate RMBS by P&C firms which experienced
negative operating cash flows, when compared against otherwise similar transactions.
7
This paper is related to two recent papers also investigating capital requirements and fire sales. Ellul,
Jotikasthira, and Lundblad (2011) document forced sales of corporate bonds by insurance companies
because of the downgrading of bonds to non-investment grade ratings between 2001 and 2005. They
show that such forced sales have an adverse transitory impact when made by firms that have weaker
capital positions. Our dataset is not rich enough to allow us to conduct a meaningful analysis of whether
trade prices rebound from fire sale prices. A second paper by Ellul, Jotikasthira, Lundblad, and Wang
(2012) investigates the differences between the accounting practices of P&C firms relative to life
insurance companies. The authors document that fair value accounting motivates higher rates of selling
of ABS among P&C firms, whereas historical cost accounting for life insurance firms (hereafter called
‘life firms’) motivates them to hold downgraded asset-backed securities, selling corporate bonds instead.
The “gains trading” of corporate bonds can induce fire sales in the corporate bond market. While similar
in motivation to these papers, our evidence focuses directly on whether capital requirements and
accounting rules led to fire sales of non-agency RMBS, the value of which played a critical role in the
recent financial crisis. Our work also uses a substantially different empirical strategy in identifying the
effects of capital requirements and accounting rules on fire sales. One key difference in empirical
strategies is our focus on the specific transaction prices of individual securities.
Other related papers examining the investment behavior of insurance companies include Ambrose,
Cai, and Helwege (2011) and Becker and Ivashina (2012). Ambrose et. al. (2011) examine regulatory-
induced trades of insurance companies and conclude that a widespread selling of bonds does not
necessarily lead to pressure on prices. Rather, observed price declines occur on account of information
effects. Becker and Ivashina (2012) find that capital requirements provide incentives for insurance
companies to “reach for yield” in their security selection.
A separate stream of literature proposes collateralized lending as having contributed to fire sales in
the market for real assets and financial securities. Brunnermeier and Pedersen (2009) demonstrate
theoretically that a decline in funding liquidity makes arbitrageurs unable to play their role in driving
mispriced assets back to their fundamental values. Mitchell and Pulvino (2012) provide empirical
8
evidence of this mechanism at play. Unable to finance their positions during the 2008 financial crisis,
hedge funds were precluded from performing their traditional role of taking advantage of mispricing
through relative value trades.
Finally, our paper contributes to a growing literature focused on the costs and benefits of fair value
accounting and of how fair value accounting contributed to the crisis. An early theoretical paper in this
literature, by Plantin, Sapra, and Shin (2008), shows how fair value accounting can lead to a vicious cycle
of sales for levered institutions. Heaton, Lucas, and McDonald (2010) build a model showing that the
interaction between fair value accounting and capital requirements can lead to inefficient bank
liquidations because of time variation in aggregate discount rates. Laux and Leuz (2009) and Laux (2012)
review much of the literature on the topic. Laux (2012) concludes that “there is still no evidence that fair
value accounting caused widespread fire sales of assets or contagion.” Some papers (e.g., Shaffer (2010))
focus on the link between fair value and bank regulatory capital. However, these papers are more
concerned about the impact of fair value losses on bank capital rather than about how capital-constrained
banks are pushed into fire sales. Badertscher et al. (2012) provide evidence of OTTI charges for the
largest bank holding companies and show that, for 2007-2008, the bulk of these charges were incurred in
the last two quarters of 2008. They also show that sales of RMBS are correlated with OTTI charges, but
Laux (2012) argues that such a correlation can have multiple causes. One paper, Boyson, Helwege, and
Jindra (2012), argues that, on net, banks did not engage in fire sales. However, in contrast to our analysis,
the paper does not have transactions for individual securities.
The paper proceeds as follows. In Section 1, we develop our hypotheses further and review the
related literature in more detail. In Section 2, we present our data. In Section 3, we estimate the propensity
to sell RMBS in our sample and show how it relates to a firm’s capital position and accounting regime. In
Section 4, we investigate our fire-sale predictions. We conclude in Section 5.
9
Section 1: Hypothesis development and review of the literature
Section 1.1 Theories of Fire Sales
Theories of fire sales describe the conditions under which forced sales occur and commonly contain
two important elements: the mechanism(s) by which a forced sale is triggered and the mechanism(s)
which leads to a dislocation in prices. To date, the literature has argued that leverage in general and more
specifically collateralized lending can lead to the forced sale of assets (Shleifer and Vishny (1992, 1997)).
When debt is collateralized by a physical asset and the asset fails to generate the expected cash flows, the
optimal contract calls for the sale of the asset.5 Consistent with this theory, empirical papers have
documented the forced sale of collateralized, physical assets. For example, Pulvino (1998) documents that
distressed airlines sold airplanes at substantially discounted prices. Collateralized lending also plays a
substantial role in the forced sale of financial assets (see Brunnermeier and Pedersen (2009)). As the
value of an asset financed through collateralized lending falls, margin calls force the borrower to provide
more equity or to sell some of the holdings of the asset. Throughout the crisis, margin requirements
increased (see Gorton and Metrick (2012)), forcing borrowers to sell assets to meet margin requirements
or provide more equity. As shown by Coval and Stafford (2007), forced sales of assets can also occur
when investors in an investment vehicle redeem their holdings.
The existence of a forced sale itself need not, however, result in dislocated prices. In well-
functioning, liquid markets, physical or financial assets should sell at prices which reflect their best use.
However, in periods of distress for the most natural purchasers of a class of assets, fire sale prices can
occur because the assets have to be bought by investors who are not natural purchasers of these assets
(Shleifer and Vishny (1993)). For instance, these investors may lack the knowledge of these assets that
natural buyers would have or may find the payoffs of these assets riskier within their portfolios than
natural buyers would. In the case of physical assets, the most natural buyers of an asset might be defined
as industry specialists. Industry specialists operate in the same industry as the asset-selling institution and
5 This will be the case when the debt contract is a combination of short-term and long-term debt, with the long-term
debt creating a debt overhang.

10
are thus in a position to adequately value and utilize the asset being offered. Industry specialists can put
the asset to its first-best use, and pay prices accordingly. However, if potential buyers who are industry
specialists are constrained on account of financial distress, then the first-best use of the asset is not an
option. Eventual purchasers of the asset will pay prices below those reflecting the asset’s first-best use.
Liquidity concerns can also lead to fire sales as the urgent need for liquidity can force the distressed firm
to sell the asset at a discount.6 In the case of financial assets, traditional models in finance rely on
arbitrageurs to keep asset prices closely aligned with fundamentals. Thus, when arbitrageurs themselves
become constrained, rendering them unable to correct mispricing, prices can become more dislocated
from fundamentals.7 Typically, arbitrageurs use collateralized lending. As this lending becomes harder to
obtain, they become less able to provide liquidity and correct mispricing. During the crisis, as discussed
earlier, collateralized lending became harder to obtain and many securities that were initially considered
to be low risk became much riskier as the crisis evolved.
Capital requirements perform a role that is similar to the role of margin in the analyses described at
the beginning of this section: capital requirements also force a firm to put up its own capital to own assets
in the same way that margin requirements force an investor to put up capital to hold assets financed
through repos or securities lending. With capital requirements, forced sales occur as financial institutions
seek to alleviate low RBC ratios through the sale of low credit quality assets. Natural buyers of the
downgraded securities, many of which are themselves financial institutions, face similar regulatory capital
constraints. Given the urgent need for capital, sellers rationally accept liquidity discounts on securities
given that the benefit of an improved regulatory capital position outweighs the cost associated with the
liquidity discount. Pricing discounts are also driven by the fact that buyers of downgraded securities find
them to be positive NPV investments, but only at a sufficiently low price.
6 See Benmelech and Bergman (2009) for empirical evidence regarding the role of distress in fire sales of physical
assets. 7 See Shleifer and Vishny (2007) for a theoretical discussion of this point and Mitchell, Pederson, and Pulvino
(2007) and Mitchell and Pulvino (2010) for empirical evidence of this phenomenon.
11
Section 1.2 Regulatory Capital Requirements and Other-Than-Temporary Impairment Accounting
We now examine how regulatory capital requirements and OTTI accounting can lead to fire sales.
The extent to which capital requirements can lead to fire sales depends very much on how changes in the
value of assets affects a firm’s capital requirements. If assets are not written down as they lose value or
become impaired, a firm’s capital is not affected by fair value losses and hence the firm keeps meeting its
capital requirements even if the true value of the assets falls. In such a situation, selling assets whose fair
market value has plummeted can be costly because the sale forces the firm to recognize losses that
accrued earlier but were not recognized when they accrued. However, if assets are written down as their
fair value falls, an institution that had enough capital before the write-downs may not have enough capital
after the write-downs and hence may be forced to take actions to become compliant with capital
requirements. With U.S. regulations, whether securities held for sale are marked down for the purpose of
the computation of RBC ratios depends crucially on the other-than-temporary-impairment (OTTI)
guidelines in the relevant statutory accounting rules governing a financial institution.
If assets are not valued on the balance sheet at fair value and if fair value losses have not passed
through earnings, selling assets that have lost considerable value is extremely costly for a financial
institution in terms of its RBC ratio as the loss realized upon the sale relative to the value at which the
asset is on the balance sheet goes through earnings and comes as a deduction of capital. Insurance
companies held their assets on the balance sheet at amortized cost. However, under some circumstances
assets held at amortized cost must be marked down to fair value when they suffer from an OTTI and the
loss has to pass through earnings. With OTTI statutory accounting treatment, a financial institution does
not postpone the realization of losses by postponing the sale of an asset that has suffered fair value losses
of a nature requiring OTTI treatment. Having recognized the fair value loss through OTTI treatment, the
sale decision of the financial institution simply depends on the comparison of the increased risk charge
associated with holding the security in comparison to the possible fire sale discount from selling the
security. Absent the OTTI treatment, any reduction in risk charge associated with the sale of a
12
downgraded RMBS must be larger than the capital loss from that sale in order for there to be an incentive
to sell the asset.
During the crisis, fair value accounting rules were relaxed and the evidence is that the stock market
reacted favorably to that relaxation (see Laux (2012)). However, in the insurance industry, there was also
a change towards broadening the implementation of fair value statutory accounting rules. This change
creates another opportunity to identify the factors influencing RMBS sales by insurance companies. Prior
to 2009, P&C companies were required to use fair value accounting for downgraded RMBS. In contrast,
life companies were allowed to use historical cost accounting for downgraded RMBS and were only
required to use mark-to-market accounting for defaulted securities. Effective in 2009, the National
Association of Insurance Commissioners (NAIC) modified SSAP 43 and issued SSAP 43R requiring
OTTI treatment of asset-backed securities for all insurance companies. Thus, we would expect the
difference in accounting rules to manifest itself in the observed selling behavior of the two types of firms
before 2009. In contrast, during 2009, we expect both life and P&C insurance companies to behave
consistently with a capital-requirement-OTTI-fire-sale hypothesis.
Section 1.3 Capital Requirements for Insurance Companies: A Numerical Example
Capital regulations for insurance companies are based on a system of risk-based capital ratio
calculations where capital is compared to an authorized control level risk-based capital to determine
adequacy. If the ratio of capital to authorized control level risk-based capital (RBC ratio) falls below two,
regulatory intervention is required. This is analogous to the regulatory regimes for other financial firms.
Comparisons of capital regulations between banking, securities firms, and insurance capital adequacy
calculations are provided by Herring and Schuermann (2005). We focus on capital requirements for
insurance companies in this paper. A detailed numerical example can help to illustrate the capital
requirements and accounting mechanism at play.
In Figure 1 we provide key aspects of a hypothetical risk-based capital (RBC) calculation for an
insurance company. There are four categories of risks that are explicitly considered in an RBC
13
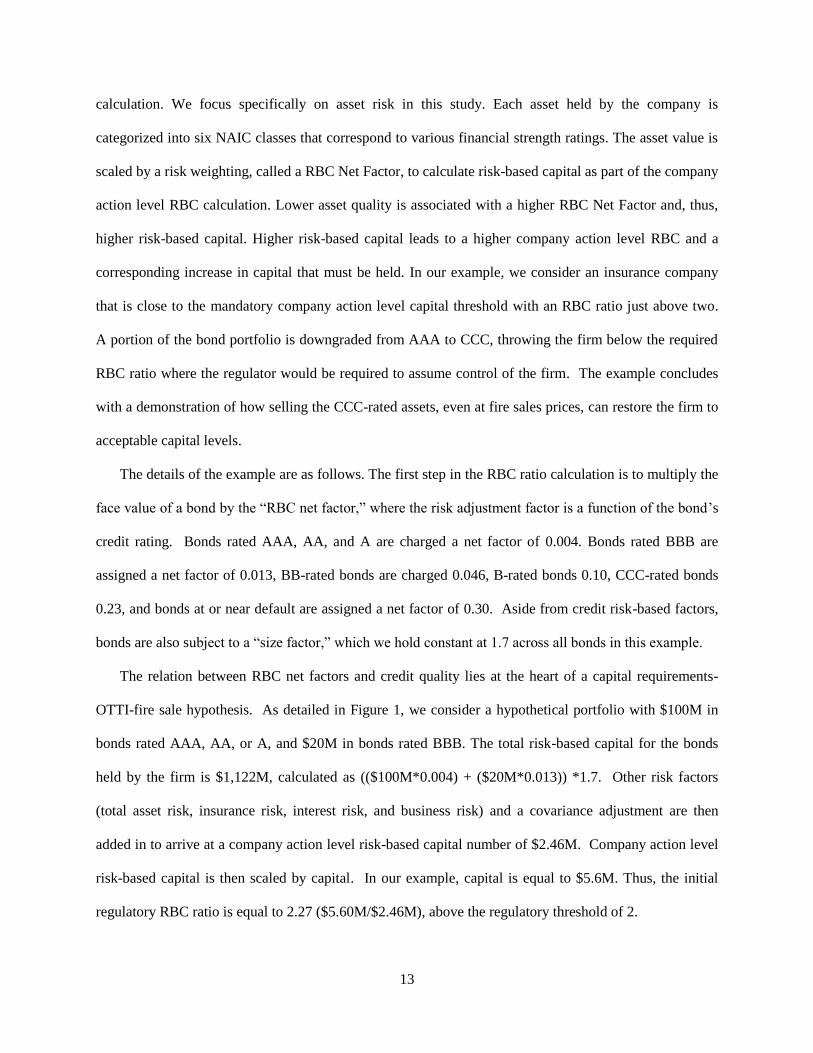
calculation. We focus specifically on asset risk in this study. Each asset held by the company is
categorized into six NAIC classes that correspond to various financial strength ratings. The asset value is
scaled by a risk weighting, called a RBC Net Factor, to calculate risk-based capital as part of the company
action level RBC calculation. Lower asset quality is associated with a higher RBC Net Factor and, thus,
higher risk-based capital. Higher risk-based capital leads to a higher company action level RBC and a
corresponding increase in capital that must be held. In our example, we consider an insurance company
that is close to the mandatory company action level capital threshold with an RBC ratio just above two.
A portion of the bond portfolio is downgraded from AAA to CCC, throwing the firm below the required
RBC ratio where the regulator would be required to assume control of the firm. The example concludes
with a demonstration of how selling the CCC-rated assets, even at fire sales prices, can restore the firm to
acceptable capital levels.
The details of the example are as follows. The first step in the RBC ratio calculation is to multiply the
face value of a bond by the “RBC net factor,” where the risk adjustment factor is a function of the bond’s
credit rating. Bonds rated AAA, AA, and A are charged a net factor of 0.004. Bonds rated BBB are
assigned a net factor of 0.013, BB-rated bonds are charged 0.046, B-rated bonds 0.10, CCC-rated bonds
0.23, and bonds at or near default are assigned a net factor of 0.30. Aside from credit risk-based factors,
bonds are also subject to a “size factor,” which we hold constant at 1.7 across all bonds in this example.
The relation between RBC net factors and credit quality lies at the heart of a capital requirements-
OTTI-fire sale hypothesis. As detailed in Figure 1, we consider a hypothetical portfolio with $100M in
bonds rated AAA, AA, or A, and $20M in bonds rated BBB. The total risk-based capital for the bonds
held by the firm is $1,122M, calculated as (($100M*0.004) + ($20M*0.013)) *1.7. Other risk factors
(total asset risk, insurance risk, interest risk, and business risk) and a covariance adjustment are then
added in to arrive at a company action level risk-based capital number of $2.46M. Company action level
risk-based capital is then scaled by capital. In our example, capital is equal to $5.6M. Thus, the initial
regulatory RBC ratio is equal to 2.27 ($5.60M/$2.46M), above the regulatory threshold of 2.
14
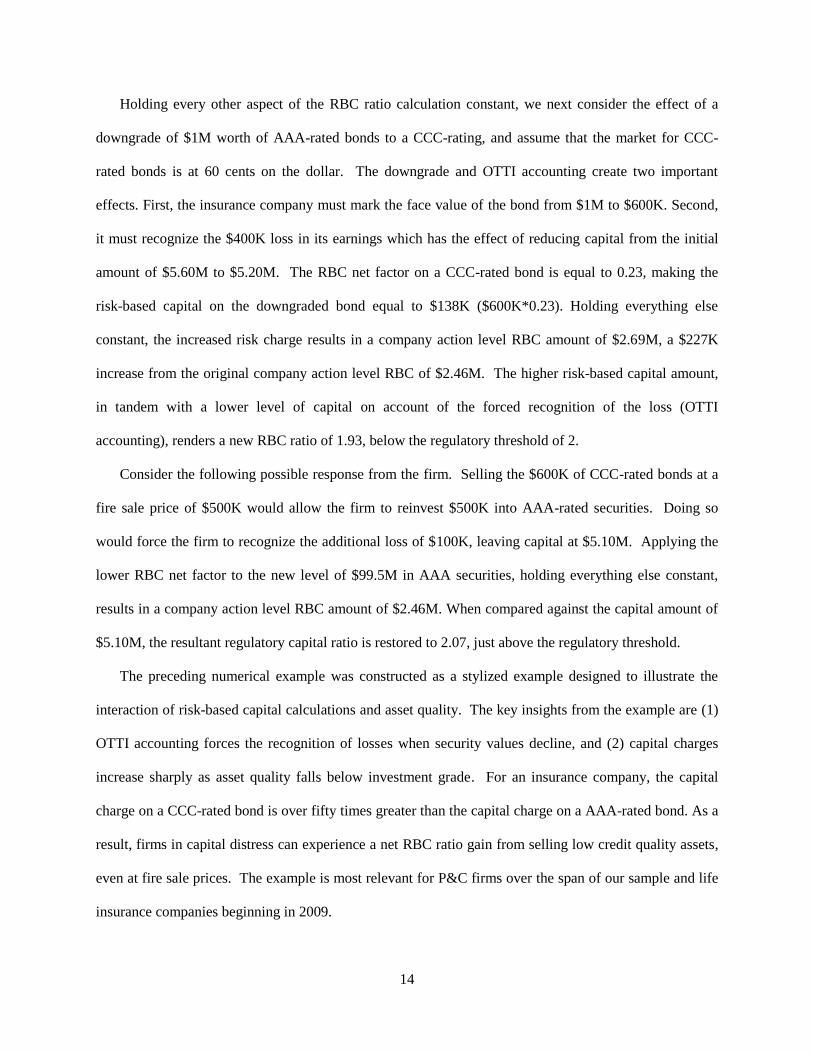
Holding every other aspect of the RBC ratio calculation constant, we next consider the effect of a
downgrade of $1M worth of AAA-rated bonds to a CCC-rating, and assume that the market for CCC-
rated bonds is at 60 cents on the dollar. The downgrade and OTTI accounting create two important
effects. First, the insurance company must mark the face value of the bond from $1M to $600K. Second,
it must recognize the $400K loss in its earnings which has the effect of reducing capital from the initial
amount of $5.60M to $5.20M. The RBC net factor on a CCC-rated bond is equal to 0.23, making the
risk-based capital on the downgraded bond equal to $138K ($600K*0.23). Holding everything else
constant, the increased risk charge results in a company action level RBC amount of $2.69M, a $227K
increase from the original company action level RBC of $2.46M. The higher risk-based capital amount,
in tandem with a lower level of capital on account of the forced recognition of the loss (OTTI
accounting), renders a new RBC ratio of 1.93, below the regulatory threshold of 2.
Consider the following possible response from the firm. Selling the $600K of CCC-rated bonds at a
fire sale price of $500K would allow the firm to reinvest $500K into AAA-rated securities. Doing so
would force the firm to recognize the additional loss of $100K, leaving capital at $5.10M. Applying the
lower RBC net factor to the new level of $99.5M in AAA securities, holding everything else constant,
results in a company action level RBC amount of $2.46M. When compared against the capital amount of
$5.10M, the resultant regulatory capital ratio is restored to 2.07, just above the regulatory threshold.
The preceding numerical example was constructed as a stylized example designed to illustrate the
interaction of risk-based capital calculations and asset quality. The key insights from the example are (1)
OTTI accounting forces the recognition of losses when security values decline, and (2) capital charges
increase sharply as asset quality falls below investment grade. For an insurance company, the capital
charge on a CCC-rated bond is over fifty times greater than the capital charge on a AAA-rated bond. As a
result, firms in capital distress can experience a net RBC ratio gain from selling low credit quality assets,
even at fire sale prices. The example is most relevant for P&C firms over the span of our sample and life
insurance companies beginning in 2009.
15
Section 1.4 Fire Sale Hypotheses
Existing theories of fire sales, in combination with the mechanics of capital requirements and OTTI
accounting practices, give rise to the following four hypotheses. First, for fire sales to occur in any type
of security, we should observe a dearth of liquidity in the market for that security. A lack of liquidity is
ultimately what leads to pricing discounts being accepted by motivated sellers. Second, all else equal,
capital-constrained P&C firms are more likely than life insurance companies to sell downgraded
securities in an illiquid market. Third, the RMBS sales of constrained firms that occur in an illiquid
market should occur at a discount in price relative to the RMBS sales of non-constrained firms because
capital-constrained sellers forced to recognize losses should be more likely to accept a liquidity discount
than otherwise comparable transactions. This result should be concentrated in P&C firms over our full
sample period and in life firms during 2009. Finally, fire sale discounts should be most severe for the
most credit-impaired securities. Differentiating the magnitude of fire sale discounts as a function of credit
quality uniquely identifies the role of capital requirements in the fire sale transaction, as opposed to
alternative explanations of observed discounts in prices.
Section 2: Data
Section 2.1 Sample Construction
Our sample construction begins with the universe of publicly available non-agency RMBS
transactions of insurance companies. Thomson Reuters EMaxx services compiles all of the publicly
reported transactions of P&C and life insurance companies from regulatory filings and produces a
standardized bond transaction file. Data fields include transaction date, transaction price, bond CUSIP,
whether the transaction was a purchase or sale, the name of the insurance company involved in the
transaction, the transaction broker, transaction volume (more than one investor can own a portion of the
bond), and the bond credit rating at the time of the transaction. The sample includes bonds with at least
two transactions, where the second transaction occurred between January 2006 and September 2009.
16
We match the universe of insurance company RMBS transactions to a database of mortgage collateral
attributes produced by CoreLogic. A non-agency RMBS is collateralized by over 5,000 individual non-
agency loans, on average.8 Loan-level attribute data are rolled up to the deal-level using loan sizes as
weights. For example, when controlling for deal-level FICO scores, the deal-level measure represents the
loan-weighted FICO score of the 5,000 underlying mortgages. Importantly, our collateral attribute data is
dynamic, allowing for the real-time measurement of the mortgage attributes at the time of each
transaction, including the cumulative default rate on the pool of mortgages at the time of the transaction.
Other real-time collateral attributes aggregated to the deal level include mortgage rates, FICOs, and
combined loan-to-value ratios (LTVs). We also calculate the percentage of collateral with adjustable rates
(ARMs), mortgages supporting owner-occupied homes, no or low documentation loans, and the percent
that represent refinancing mortgages. We control for deal-level rates of cumulative house price
appreciation by matching ZIP-code level house price indexes to the ZIP code of each mortgage.9
To account for unobserved features of each RMBS (e.g., seniority in the capital structure of a deal,
performance triggers, differences in pre-payment treatment, and other unobserved contractual features),
we limit the sample to repeat-sales transactions of the same RMBS and estimate changes in RMBS prices
from the first transaction to the second. A repeat-sale sample has the virtue of implicitly controlling for
unobserved features that could impact the price of a RMBS.
Our sample period is dictated by insurance company data availability because we require data from
the income statement, balance sheet, and regulatory capital filings for each insurance company in the
sample. AM Best, a firm which specializes in the production of insurance company analytics, provides
income statement and balance sheet data, including data on annual levels of operating cash flow from
2006 through 2009. The National Association of Insurance Commissioners (NAIC) provides data on
regulatory capital filings.
8 It is important to note that the typical securitization deal produces 17 unique bonds on average. Individual
mortgages do not provide cash flows for individual bonds. Rather, the entire mortgage pool generates monthly
principal and interest payments which provide interest payments to bond holders. Bond coupon payments are
generated from the mortgage collateral pool according to pre-specified, prioritized cash flow rules. 9 We use MSA- and state-level indexes when ZIP-code indexes are unavailable.
17
The matching of insurance company data from AM Best and the NAIC to the bond transaction and
mortgage attribute data results in a sample of 10,388 unique transactions. We drop extreme outliers in
RMBS prices and in the operating cash flow of insurance companies at the 1% and 99% levels to reduce
the influence of outliers in the data.10
Implementing a repeat-transaction criterion reduces our final sample
to 5,014 repeat transactions from 385 unique life and P&C insurance companies over the period January
2006 to September 2009.
Section 2.2 Control Variables
Our empirical tests control for fundamental attributes of RMBS which should impact RMBS prices.
One of the primary determinants of RMBS performance is the default rate on the underlying pool of
mortgages. Our data allow for the calculation of real-time collateral default rates. We focus on the
reported collateral default rate in the month prior to the observed transaction so as to ensure that the
default rate used in our estimation reflects the collateral default rate observed by market participants at the
time of a transaction.
An issue that deserves special consideration is our choice to control directly for the collateral default
rate as opposed to bond credit ratings, especially given that capital requirements are tied to credit ratings.
The reasons for our approach are straightforward. First, insurance companies are concerned about what
the rating will be at the time they compute their RBC ratio, which occurs at the end of the calendar year.11
We believe that our approach, because of its greater timeliness, offers a better forecast of ratings for
insurance companies. Second, our approach allows for greater granularity in assessing the credit quality
than credit ratings allow for because we use continuous variables. Third, we are able to update our
estimates of credit quality monthly using the most up-to-date information. It is commonly known that
ratings are not designed to reflect real-time assessments as rating agencies are also concerned about the
stability of ratings. Further, for practical reasons, rating agencies could not update ratings monthly even if
10
Some of the extreme outliers appear to be obvious errors in the data, which is why we do not simply winzorize the
outliers to values at the 99th
and 1st percentiles.
11 This argument has been highlighted in conversations with three separate industry professionals.

18
they wanted the ratings to reflect the most current monthly information since doing so would involve
monitoring tens of thousands of ratings for the major credit rating agencies.
Two pieces of data show that these considerations are important. First, during our sample period,
Moody’s and S&P ratings differ, often markedly, for some deals. Such material differences could easily
arise because of differences in the timing of rating updates. Second, there is considerable variation in
prices within rating buckets during our sample period, which again is consistent with ratings being more
up-to-date for some deals than others. Because of these considerations, we believe that our approach
provides a more detailed and up-to-date assessment of credit quality than using credit ratings. We repeat
our primary tests using credit ratings. While the results using credit ratings are qualitatively similar to our
baseline results, they are not as robust.
Bond prices are also mechanically influenced by interest rates. Over 80% of the RMBS in our sample
pay a floating coupon rate, making their value immune to direct changes in interest rates. For the small set
of bonds with fixed coupon rates we control for changes in the 5-year Treasury bond rate between the first
and second transactions.12
Our results are robust to the exclusion of fixed-coupon RMBS, but we include
them in our reported tables so as to maximize our sample size. Other control variables that we include in
the regressions are variables commonly used to predict future loan defaults.13
Section 2.3 Summary Statistics
Table 1 reports summary statistics on the quarterly attributes of our estimation sample. Each
observation in the sample represents the attributes associated with the second transaction in a given
repeat-transaction pair. Over the full sample period the average bond experienced a 6.9% decline in price
from the first transaction to the second. The declines are concentrated primarily in 2008, peaking in the
fourth quarter, where the average bond, conditional on an observed transaction, was bought or sold for a
12
The expected duration of senior RMBS in our sample is about 5 years, on average. 13
The impact of specific loan attributes on loan default rates is documented by Sherlund (2008), Deng,
Quigley, and Van Order (2000), and Pennington-Cross and Ho (2006). Loans with high FICO scores, low
loan-to-value ratios, and low debt-to-income ratios default less frequently.
19
price 41.4% less than the price of the previous transaction. The variance in price changes was also
substantially larger in 2008 and 2009 than in previous years. The pattern of price declines documented in
the initial columns of Table 1 can be observed visually in Figure 2, which plots the level of non-agency
RMBS prices through time. The figure provides stunning visual evidence of the rapid decline in the
market value of RMBS throughout the financial crisis. The rapid price declines were concentrated in
RMBS that were highly rated at origination. Though not reported in Table 1, 93.3% of the rated RMBS in
our repeat sample estimation were rated AAA, AA, or A at the time of the first observed transaction.
In the full sample, 51.5% of all transactions were sales, with fewer sales during 2008-2009. One-third
(33.3%) of all life insurance transactions were associated with firms experiencing negative operating cash
flow in the year of the transaction. A lower percentage of P&C trades (15.7%) were associated with firms
experiencing negative operating cash flow in the year of the trade. The distribution of negative operating
cash flow transactions through time is lumpy. Transactions in 2007 and 2009 were more frequently
associated with negative operating cash flow insurance firms compared to transactions in 2006 and 2008.
As expected, default rates on mortgage collateral at the time of the transaction were highest during the
years 2008 and 2009, periods which represented the lowest bond prices. This fact highlights the need for
careful identification of the unique impact of capital requirements, as opposed to RMBS fundamentals, in
explaining the observed low prices paid for RMBS. Observed RMBS prices were low in 2008 and 2009,
but so was the quality of their fundamentals.
Section 3: Estimating the Propensity to Sell RMBS.
Section 3.1. Liquidity in the non-agency RMBS market.
A central feature of theories of fire sales is a lack of liquidity in the market for the asset. In this
section we document liquidity in the non-agency RMBS market amongst insurance companies between
the years 2006-September 2009. The available data is not suitable to estimate the liquidity measures that
are commonly used in the literature. These measures require bid-ask prices, and more detailed trade and
volume data. Here, we can only show the extent to which insurance companies made RMBS purchases
20
and sales and the size of the purchases and sales. We find that our rough proxies for liquidity, the number
of purchases and sales and the size of trades, dropped sharply during the crisis.
In Figure 3a we provide a plot of the three-month moving average of the total number of P&C and
life RMBS transactions. The market appeared most liquid in June 2006 where the three-month moving
average of unique trades within our sample topped 300 trades per month. Liquidity in the market
remained fairly steady from this point until taking a dramatic dive at the beginning of 2008. Liquidity fell
throughout the next nine months hitting a low in the summer of 2008 when the market transacted nearly
85 trades per month, on average. The lack of liquidity was most highly concentrated in sales transactions.
In Figure 3b we plot the number of purchases and sales separately. The majority of transactions per month
during the summer of 2008 consisted of purchases. Sales averaged less than 20 transactions per month
during the summer of 2008.
In Figures 4a and 4b we plot the average par amount of an RMBS involved in a transaction. Figure 4a
shows that average dollar volumes declined during the crisis period, also consistent with a lack of
liquidity in the RMBS market. Figure 4b separates the sample into sales and purchases of RMBS.
Average dollar volumes in insurance company purchase transactions declined during the crisis period.
Average dollar volumes of insurance company sale transactions actually increased in the second half of
2008. The increased average dollar volume of sale transactions is evidence of insurance companies selling
larger dollar amounts of capital-expensive, downgraded securities. Finally, Figures 5a and 5b plot the
monthly total dollar volume of RMBS transactions. Total dollar volumes of RMBS transactions declined
substantially beginning in the summer of 2007 through the end of the sample period. We interpret the
evidence provided in Figures 3-5 as being consistent with a lack of liquidity in the market for non-agency
RMBS, a condition which could result in securities being transacted at fire sales.
Section 3.2. Are constrained firms more likely to sell?
21
In this section, we test a second condition of the fire sales hypothesis, namely, whether capital-
constrained firms are more likely to sell securities. Under a capital-requirement-OTTI-fire-sale
hypothesis, the urgency of obtaining the capital relief that comes with selling a marked-to-market, low-
credit-quality asset outweighs the cost of the expected fire sale discount. As such, we expect that capital-
constrained firms subject to OTTI statutory accounting will be more likely to sell, all else equal.
To test this aspect of a capital-requirement-OTTI-fire-sale hypothesis we estimate a Cox proportional
hazard model using a firm-RMBS panel data set. For each unique RMBS purchase observed between
2006-2008, we construct a panel of monthly observations on the attributes of the mortgage collateral
supporting the purchased RMBS as well as the attributes of the insurance company which purchased the
RMBS. We track the attributes of the RMBS beginning at the date of purchase through time until either
we observe the selling of the RMBS by the original purchasing firm or our sample period ends. We begin
the panel in 2006 because it is the first year for which we have insurance company data. We end the
sample in 2008 so as to preserve the key difference between P&C and life firms’ adherence to mark-to-
market accounting in our estimates.
In the proportional hazard estimation, “failure” is the sale of an RMBS while the retention of a
purchased RMBS through the full sample period represents “survival.” The conditional nature of the
proportional hazard estimation allows us to control for the attributes of RMBS collateral which influence
the selling decision through time. Our baseline specification controls for several key measures of the
attributes of the RMBS collateral during each month the bond is held in the portfolio. These include the
RMBS collateral default rate in the month prior to the transaction as well as the cumulative rate of ZIP
code-level house price appreciation for the mortgage pool since origination. We control for pool-level
FICO, combined LTV, the percentage of mortgages that are ARMs, owner occupied, no/low
documentation, or refinancing mortgages. We also include calendar-time fixed effects in order to capture
unobserved macroeconomic factors which could influence RMBS transactions, though calendar-time
22
fixed effects are highly correlated with deal-level collateral default rates.14
Standard errors are clustered
by month.
Table 2 reports results of the hazard estimation. Column (1) includes both life and P&C firms in the
estimation. We create a P&C indicator variable designed to measure the difference between life and P&C
firms in the propensity to sell, conditional on the real-time attributes of the RMBS. The estimated
coefficient on the P&C indicator is positive and statistically significant, indicating that for a given set of
RMBS characteristics – including time held in portfolio – P&C firms are more likely to sell RMBS. In
terms of economic significance, the magnitude of the estimated coefficient indicates that at sample-
average collateral values, RMBS are predicted to remain in P&C portfolios 5 months less than in life
portfolios, all else equal.
The results in Column (1) are consistent with the prediction that P&C firms are more likely to sell
RMBS, but the estimation in Column (1) does not clearly identify the role of capital requirements. The
difference in selling propensity driving the positive estimate on the P&C indicator could also be attributed
to unobservable differences between the two firm types. This includes the possibilities that P&C firms
could have higher portfolio churn on account of a more frequently changing liability structure compared
to life firms or because of more frequent policy redemptions. In an effort to identify the role of capital
requirements in the selling decision more directly, we create an indicator variable for firms with below-
median RBC ratios in a given year. Under a capital-requirement-OTTI-fire-sale hypothesis, firms with
low levels of RBC ratios would feel a greater urgency to sell RMBS compared to less capital-constrained
firms.
In columns (2) and (4) we split the sample by insurance type and estimate the proportional hazard
model where the below-median RBC indicator is the independent variable of interest. Median RBC ratios
are measured within insurance company type and within each year of the sample. The results in Column
(2) suggest that below-median RBC P&C firms are significantly more likely to sell than above-median
P&C firms, conditional on a given set of RMBS characteristics. Holding RMBS attributes at the P&C
14
Deal-level default rates are statistically significant in an estimation without calendar-time fixed effects.
23
sample average, below-median P&C firms were predicted to hold RMBS 6 fewer months than above-
median P&C firms. In contrast, the results in Column (4) indicate that the RBC position of life firms has
no significant impact on their propensity to sell.
In Columns (3) and (5) we test whether the propensity for below-median RBC firms to sell is
different at a given level of collateral default. A capital-requirement-OTTI-fire-sale hypothesis predicts
that the urgency of selling would be higher for poor credit-quality RMBS held by low RBC ratio firms
subject to OTTI statutory accounting practices. In testing the poor credit-quality aspect of this prediction
we create a new variable which measures the interaction of the real-time mortgage collateral default rate
with the below-median RBC indicator for the P&C and life samples, respectively. Though the previous
estimates control for the average level of real-time credit attributes of the RMBS, the interaction term
measures the propensity to sell at a given level of collateral default. For the P&C sample, as reported in
Column (3), the estimated coefficient on the key interaction term is not statistically different from zero.
In the life sample, as reported in Column (5), the estimate on the key interaction term is also insignificant.
Measuring capital constraints using an above and below-median RBC ratio cutoff could be too
imprecise. Regulatory capital constraints will be binding as firms move close to the regulatory boundary,
which requires firms to maintain an RBC ratio above two. Empirically, few firms in our sample maintain
RBC ratios near the edge of the regulatory boundary of two, preferring instead to maintain a small
cushion. This makes it difficult to test whether maintaining an RBC ratio right at the boundary makes
firms more likely to sell compared to firms well above the boundary. We do observe some clustering of
RBC ratios around four for P&C firms, which represents roughly the 25th
percentile in the distribution of
RBC ratios. The 25th percentile in the distribution of the RBC ratio for life firms is close to six. In an
effort to test the robustness of the results in Table 2 to our above and below-median RBC cutoff, we
estimate the selling propensity of firms in the lowest 25th percentile of RBC. In untabulated results, we
find that P&C firms with RBC ratios in the lowest 25th percentile are more likely to sell RMBS as
compared to P&C firms in the upper 75th percentile. In contrast, life firms in the lowest 25
th RBC ratio
percentile are not more likely to sell.
24
The results from the Cox proportional hazard estimation support two of the key predictions of a
capital-requirement-OTTI-fire-sale hypothesis. First, P&C firms are significantly more likely to sell
RMBS than life firms. Second, the likelihood of selling is correlated with the RBC position of P&C firms
but not with the RBC position of life firms.
Section 4: Estimating Fire Sale Effects in RMBS.
Section 4.1 Do capital constrained firms sell bonds at lower prices?
While a probability-based estimation strategy has the potential to estimate the likelihood of observing
sales, probability-based estimates are not as effective at capturing the urgency to sell. Tests involving
market prices are better suited for the estimation of liquidity discounts on account of selling urgency. In
this section we document pricing patterns that exist in the data and evaluate whether the observed patterns
are consistent with the fire sales hypothesis.
Our primary hypothesis states that the combination of capital requirements and statutory accounting
rules should influence the observed transaction prices of RMBS. The effect should be pronounced in P&C
firms on account of their adherence to mark-to-market accounting practices. As a first pass approach in
evaluating the relationship between a firm’s RBC ratio and the price of RMBS transactions we calculate
the RBC ratio for each P&C firm in our sample and stratify trades into above- and below-median RBC
buckets.15
Table 3 presents P&C summary statistics on the average price change between the first and
second RMBS transactions of the same bond in a matched transaction pair. Columns (1) and (2) of Panel
A document that, on average, below-median RBC P&C firms are associated with transactions which
declined 8.0% in price compared to average 6.2% declines for above-median RBC firms.
Such a discrepancy could be attributed to more frequent sales for below-median RBC firms given the
potentially large bid-ask spreads in an illiquid market. In order to adjust for the difference between sales
and purchases, Columns (3) and (4) of Panel A document differences between the price changes of above-
15
Above- and below-median RBC ratio calculations are performed in each year of the sample for P&C and life
firms separately.
25
and below-median RBC P&C firms using a sample of only sales transactions. In the sales-only sample,
above-median RBC firms experienced average price declines of 4.7% compared to an average price
decline of 7.5% for below-median RBC firms.
Panel A adjusts for differences in purchases and sales transactions, but does not adjust for differences
in collateral credit quality. Columns (5) and (6) of Panel B document differences in price changes for
above and below-median RBC ratio firms in a sales-only sample on transactions with above-median
collateral default rates. Above-median RBC ratio P&C firms selling RMBS with above-median default
rates exhibit average price declines of 4.7% compared to 13.6% price declines for below-median RBC
ratio firms selling RMBS with above-median default rates. The almost 9 percentage point difference
between the two types of transactions is economically and statistically significant. By contrast, in a sales-
only sample of transactions with below-median collateral default rates (i.e. collateral performing
relatively better), as documented in Columns (7) and (8), the price declines are actually larger for the
above-median RBC ratio firms compared to below-median RBC ratio firms. Consistent with a capital-
requirement-OTTI-fire-sale hypothesis, the summary statistics presented in Table 3 clearly indicate that
OTTI-adhering P&C firms that are regulatory capital constrained sell low credit-quality RMBS at a
discount compared to non-regulatory capital constrained P&C firms. We repeated the analysis using RBC
ratios in the bottom 25th percentile as a measure of capital constraints. The results, which we do not
report in a table, are similar to those presented in panels A and B of Table 3, indicating that the observed
discounts in pricing are concentrated in P&C firms that are closest to the regulatory capital boundary.
In Table 4, we reproduce the results of Table 3 on a sample of repeat-RMBS transactions for life
insurance companies. Given that life insurance companies were not required to adhere to fair value
accounting practices prior to 2009 we would not expect to observe similar sensitivity of pricing to
regulatory capital positions and collateral default rates as exhibited by P&C firms in Table 3. Columns
(1) and (2) document that, on average, above-median RBC ratio life insurance companies are associated
with larger pricing declines than below-median RBC ratio firms, a result opposite to that of P&C firms.
Such a result is fully consistent with the view that accrual accounting delays sales of securities that have
26
made losses for companies with weaker capital positions. A similar pattern holds when examining the
sales-only sample as tabulated in Columns (3) and (4). Columns (5) and (6) reveal that pricing declines
are higher still for above-median RBC ratio firms transacting in RMBS with above-median collateral
default rates. This result suggests that life insurance companies are sensitive to the credit quality of
RMBS, but that the sensitivity is not related to their capital position, at least prior to 2009, as would be
predicted under a capital-requirement-OTTI-fire-sale hypothesis. We also examined the univariate pricing
results for life insurance companies using the below 25th percentile RBC ratio cutoff, but do not report the
results in a table. The results are consistent with those reported in Table 4, indicating that the RMBS
transactions of life firms that maintain capital positions closer to the regulatory boundary are not
substantially different than the transactions of life firms further from the regulatory boundary.
Section 4.2 Do lower levels of capital cause fire sales?
Broadly speaking, the simple univariate comparisons provided in Table 3 show that poorly capitalized
P&C insurance companies consistently sold RMBS at a discount relative to better capitalized insurance
companies. This pattern does not hold for life insurance companies, at least prior to 2009. The observed
pattern is potentially consistent with a capital-requirement-OTTI-fire-sale hypothesis. However, the
evidence does not rule out viable alternative explanations. For example, the differences do not control for
other important attributes of the RMBS. Poorly capitalized firms may systematically own bonds of
poorer credit quality, justifying the lower observed prices.
A more subtle explanation of the observed patterns in Tables 3 and 4, even more at odds with a
capital-requirement-OTTI-fire-sale hypothesis, is the possibility that the lower prices of the below-median
RBC ratio firms are justified by systematically lower credit quality RMBS, so that losses associated with
poor credit-quality RMBS are themselves responsible for the lower levels of capital in the firm. Under
this explanation, the below-median RBC ratio firms have lower levels of capital because they own
portfolios of RMBS that are of systematically lower credit quality and prices of RMBS of a
systematically lower credit quality are appropriately discounted by the market.
27
In this section we propose a specification designed to disentangle the endogenous relationship
between firm capital and RMBS credit quality in order to appropriately test a capital-requirement-OTTI-
fire-sales hypothesis. As a starting point, consider a simple, linear model of the following form:
,
where subscripts i and t represent RMBS i transacted at time t, subscript j represents firm j and X
represents a matrix of bond fundamentals. X includes the full set of RMBS-specific fundamentals
described in the data section. In addition to observable attributes of the collateral, a specification
explaining variation in RMBS prices must address other issues. The repeat-transaction criterion
implicitly controls for deal-specific features of each RMBS such as seniority in the deal’s capital structure
and other unobserved contractual features. Despite these sample criteria, omitted variables may still
plague the proposed pricing specification. The most obvious concern is that an unobserved attribute of
RMBS quality could itself be the cause of an intermediary’s constrained capital position. RMBS values
are not exogenous to a firm’s capital position because an otherwise healthy firm could suffer capital
distress on account of the credit attributes of the RMBS portfolio itself. Such an omitted variable bias
may make it difficult to determine whether a constrained seller’s transaction of an RMBS at a dislocated
price is on account of capital expediency or because of unobserved features of RMBS credit quality that
cause the firm to sell the RMBS and that explain the low trade price.
We propose using negative shocks to a firm’s cash from operations as an exogenous proxy for the
capital urgency of a firm. Cash from operations essentially represent an insurance company’s
underwriting income. As such, negative cash from operations represents an episode of increased
liabilities, triggered most frequently by an increase in insurance claims. Negative cash from operations
should not be influenced by recognizing losses on RMBS because, in the statutory accounting treatment
of insurance companies, investment income does not contribute to cash from operations. Because of this,
negative cash from operations should be correlated with firms experiencing capital distress; however, the
source of distress should not be correlated with the fundamentals of the RMBS we are trying to
28
evaluate.16
The size of operating losses is clearly influenced by the size of the insurance company. As
such, we scale operating losses by a firm’s 2006 level of capital so that the variable captures some portion
of the contribution or destruction of capital that is attributable to the operating loss. We use the 2006 level
of capital because levels of capital in the contemporaneous year of operating losses could be correlated
with poor RMBS fundamentals.17
In evaluating the robustness of our operating-cash-flow-to-2006-capital
variable, we also estimate results when scaling operating cash flow by the level of a firm’s assets. The
results are comparable to those we present in the tables. We use operating cash flow scaled by 2006
capital as our primary measure because it has a more relevant economic interpretation than operating cash
flow scaled by assets.
As a check on the validity of negative operating cash flow shocks as an exogenous proxy for capital
distress, we examine the empirical relationship between year-over-year changes in levels of capital at
insurance companies and episodes of negative operating cash flows. In our sample of insurance
companies, firms experiencing a negative operating cash flow shock in a given year are associated with
statistically significant 9.8% lower levels of capital compared to the previous year, on average. The result
is consistent across each of the years in our sample period. In contrast, the average firm in our sample not
exposed to a negative cash flow shock experienced a 6.1% increase in capital each year in the sample
period.
Section 4.3. RMBS pricing and operating cash flow shocks
In this section we test the pricing aspects of a capital-requirement-OTTI-fire sale hypothesis, which
argues that the sales of ‘adverse-shock-to-capital’ firms that do occur should reflect a discount in price
relative to the sales of non-capital shocked firms for RMBS of a similar credit quality. The prediction is
based on the argument that the capital relief associated with selling a credit-impaired bond outweighs the
16
We address possible objections to the claim that the source of negative operating cash flows is not correlated with
fundamentals of RMBS in the next section. 17
Ten observations in our sample are trades in 2008 and 2009 that are associated with insurance companies that do
not report capital levels for 2006. We use 2007 levels of capital for these observations.
29
cost associated with selling the credit-impaired bond, even if the expediency of selling the bond results in
a fire sale discount.
The use of a repeat sales sample in our estimation requires careful attention to the potential empirical
issues it presents. One such challenge is the handling of bid-ask spreads, particularly in an illiquid
market. Our dependent variable is calculated as the percent change in the price of an RMBS from the
previous transaction to the second transaction. We create a sale indicator variable which is equal to one if
the second transaction in a pair of transactions is a sale because we are interested in testing whether the
sales of capital constrained firms are statistically different from the sales of non-constrained firms, all else
equal. Drawing inference on fire sales from the coefficient on the sales indicator is potentially difficult
because sales are expected to be consistently lower by virtue of a bid-ask spread, particularly if the
previous transaction was a purchase. We overcome this challenge through the interaction of the sale
indicator with the operating-cash-flow-to-2006-capital ratio. The interaction term allows for a
comparison of sales transactions of firms with various levels of operating cash flow. It is not clear ex ante
why any bid-ask spread bias of sale transactions would be correlated with the ratio of operating-cash-
flow-to-2006-capital of the seller in a given year. Accordingly, we expect the estimated coefficient on the
sale, capital-constrained interaction variable to represent a reasonable estimate of the difference in sales
between capital constrained and less-constrained firms.18
A second issue of a repeat sales approach which deserves careful attention is the amount of time
between each transaction. Though we control for quarter fixed effects, changes in market conditions in
the time between two unique transactions would not be captured by simple quarter fixed effects. We
control for the number of months from the prior trade as an additional factor which could impact the
change in price between two consecutive transactions of the same RMBS. We also interact the number-
18
One remaining bid-ask spread issue to consider is whether the first transaction in a repeat transaction pair was a
purchase or sale transaction. Purchase-sale pairs would be expected to experience larger negative price changes than
an otherwise comparable purchase-purchase pair because of bid-ask spreads. While this is a concern conceptually,
we confirm in the data that price changes associated with purchase-sale paired transactions are not statistically
different than price changes in purchase-purchase pairs.
30
of-months-from-prior-trade variable with the quarterly time dummies, so as to capture any changing
dynamics in the market that could occur in the time between two transactions.
A repeat sales approach also creates the possibility of selection bias in the RMBS which are involved
in more than one transaction. We investigate whether selection exists by estimating our tests with a
sample that includes any RMBS transaction that occurred between 2006 and September 2009. Our results
are robust to this approach, and are economically very similar to those presented in the tables.
The repeat sales sample also influences the specification of our control variables. Rather than
controlling for the level of collateral attributes such as collateral default rates, rates of house price
appreciation, etc., we control for changes in the control variables from the time of the first transaction to
the second. The change in collateral attributes should more accurately capture the change in credit quality
which might influence observed pricing changes. For example, two unique pairs of repeat transactions
might be associated with the same level of collateral default rates at the time of the second transaction,
but one pair of transactions might be associated with a much larger relative change in default rates
between the first and second transactions. Fundamentally, we believe the change in the price between the
two transactions should reflect the change in collateral attributes, not just the level of attributes at the time
of the second transaction.
Finally, the relationship between price changes and the sign of operating cash flow is likely to be
asymmetric. A positive operating cash position of an insurance company in a given year should have little
bearing on the capital urgency of the firm and thus the urgency of selling an impaired RMBS. We would
expect non-capital constrained firms to be less likely to accept the price discounts associated with a
“forced” sale transaction. However, a negative operating cash flow position should be associated with an
urgent sale and the potential willingness to accept a liquidity discount to remove the capital requirement
associated with an impaired security. In order to capture the potential asymmetry in our estimates, we
split the estimation sample into transactions of firms with negative operating cash flow and positive
operating cash flow.
31
Table 5 reports the estimation results of our pricing specification. The dependent variable in each
specification is the change in price from the first transaction to the second. Control variables include
changes in collateral attributes, changes in market interest rates, the time between the two transactions,
quarterly fixed effects, and the interaction of the quarterly fixed effects with the time-between-
transactions variable. We cluster standard errors by the second transaction month and by firm. The sample
period in columns (1) and (2) is January 2006 to September 2009 given the adherence to mark-to-market
accounting practices for P&C firms over that whole period. The coefficient of interest in Column (1) is
the interaction of the operating-cash-to-2006-capital ratio with the sale indicator. The interaction term is
positive, indicating that the sales of firms with larger negative operating cash flows are associated with
larger price declines. The magnitude of the estimate indicates that a one-standard deviation decline in the
operating-cash-to-2006-capital ratio, from the mean of -0.22 to -0.52, results in a 6.5% price decline. In
contrast, the interaction of the sale indicator with the continuous measure of positive operating cash
flows, as reported in Column (2), is not significantly different from zero.
Columns (3) and (4) of Table 5 repeat the estimation for the sample of life firms using the 2006-2008
sample period in which life firms did not uniformly follow OTTI statutory accounting practices. The key
interaction term, operating-cash-to-2006-capital*sale-transaction, is not statistically different from zero in
the negative or positive operating cash flow samples. This result is consistent with a lack of selling
urgency for life firms given their ability to hold RMBS on the books at historical cost. As a means of
identifying the effect of OTTI accounting on the urgency of selling, in Columns (5) and (6) we estimate
the same specification using a sample of repeat transactions for life firms where the second transaction
occurred in 2009. Given the adoption of OTTI accounting for life firms within the year 2009, such
transactions could reflect the fire sale characteristics fueled by the combination of OTTI accounting and
capital requirements. The positive and significant estimate on the operating-cash-to-2006-capital*sale-
transaction interaction term indicates the fire sale mechanism at play in 2009. Life firms in 2009 that
experienced larger negative operating cash flow shocks were involved in RMBS sales that occurred at
significant discounts relative to the prior transaction. The estimated coefficient suggests pricing discounts
32
as large as 19.5% for life firms experiencing a one-standard deviation more severe level of negative
operating cash flow. By way of comparison, the sales of life firms with positive operating cash flow in
2009 do not demonstrate similar pricing patterns.
The results presented in Table 5 appear consistent with a capital-requirement-OTTI-fire-sale
hypothesis. All else equal, when selling an RMBS, a firm which experienced a larger negative operating
cash flow shock sold RMBS at a statistically significant greater decline in price compared to a firm with a
less negative operating cash flow shock. One concern with the use of negative operating cash flows as an
exogenous proxy for capital distress is the possibility of a “poor management” omitted variable which
could impact both operating cash flows and the selection of poor credit-quality RMBS. The documented
change in fire sale patterns for life companies consistent with the timing of their adherence to OTTI
statutory accounting, as documented in Table 5, is not consistent with a time invariant “poor
management” explanation. However, despite the consistency of the results with a capital-requirement-
OTTI-fire-sale hypothesis, the results still do not rule out other viable alternatives. Any issue besides
capital requirements which impacts an insurance company’s need for liquidity could be addressed through
the forced sale of securities. For example, life insurance firms may face higher policy redemptions,
forcing the firm to liquidate assets at potential fire sale prices to meet client’s liquidity demands. Such a
demand for liquidity would affect operating cash flow and could produce results consistent with those
documented in Tables 2-5. Another explanation of the observed empirical patterns focuses on the housing
market. RMBS pricing declines and negative cash flow shocks to insurance companies could both occur
on account of a shock to regional housing markets. In the following section we propose a specification
designed to test a unique aspect of a capital-requirement-OTTI-fire-sale hypothesis.
Section 4.4. Does the credit quality of the bond influence the magnitude of fire sale discounts?
Regulatory capital charges increase as the credit quality of assets declines. As detailed in Section 1.2,
in the case of insurance companies, assets of the highest credit-quality are assigned a 0.004 RBC net
factor while assets of poor-quality (e.g. CCC-rating) are assigned a substantially larger 0.23RBC net
factor. The inverse and non-linear relationship that exists between the credit quality of an asset and the
33
amount of capital that must be held against the asset gives rise to our final test. Price discounts associated
with urgent sales should be most severe for the most severely credit-impaired securities.
A test of this hypothesis requires objective measurement of the credit quality of RMBS. As before,
we use observable collateral default rates in the month prior to a transaction as our measure of RMBS
credit quality. We calculate collateral default rates as being above or below median at the time of the
second transaction for each repeat sample pair. The above-median default calculation uses the full sample
of default rates as of the second transaction. We then create a variable which interacts the operating cash
flow variable with the sale indicator and an above-median default indicator. The three-way interaction
should measure the marginal pricing difference between the sales of capital constrained firms on high
versus low credit-quality RMBS. As was the case in Table 5, we estimate the regression separately for
negative and positive operating cash flow firms.
Table 6 presents the results of this estimation. We control for the same set of collateral attributes as
in previous tables, with the exception of default rates. The above-median default rate indicator serves as a
proxy for the level of collateral default rates in this specification. As reported in Column (1), the
estimated coefficient on the operating cash*sale transaction*above-median defaults is positive and
statistically significant in the P&C sample. The positive coefficient indicates that sales from firms with
larger negative shocks to operating cash flow are associated with larger negative bond price changes for
high collateral default RMBS compared to low collateral default RMBS. In contrast, column (2) reports
results of the estimation in the negative operating cash sample of life firms between the years 2006-2008.
The estimated coefficient on the interaction of interest is not statistically significant, consistent with
estimates on life transactions reported in previous tables. Column (3) reports results using the sample of
life transactions in 2009. Consistent with results presented in Table 5, the results documented in Column
(3) indicate that the second transaction in a repeat-transaction pair for life firms exhibited fire sale
characteristics in 2009 and that fire sale discounts were largest on RMBS of the worst credit quality.19
19
The estimates for the 2009 life sample presented in Column 3 do not cluster standard errors by month given that
the estimation sample only includes 9 months.
34
The existence and magnitude of fire sale discounts appear to be related to the credit quality of the RMBS,
but only for firms subject to OTTI statutory accounting.
Taken together, we interpret our results to be consistent with a capital-requirement-OTTI-fire-sale
hypothesis. If an omitted variable were driving these results, such a variable would have to be uniquely
correlated with the sales of the worst credit-quality bonds of insurance companies that have experienced a
negative shock to operating cash flows but not correlated with the sales of the worst credit-quality bonds
of insurance companies with positive operating cash flow. The omitted variable would also have to be
correlated only with P&C firms through the full sample period and not life firms except during the year
2009. While it is difficult to conclusively rule out all possible alternatives, we cannot identify alternative
hypotheses that are consistent with the observed empirical patterns.
Section 5. Conclusion
The role of collateralized lending is a common theme in some of the recent influential papers on the
financial crisis (Brunnermeier and Pederson (2009), Shleifer and Vishny (2011)). These papers argue that
the liquidation of financing positions which were collateralized by financial assets led to fire sales in
financial markets. In this paper, we consider capital requirements as a second important mechanism
which may contribute to fire sales in financial markets. We describe the economics of how capital
requirements can lead to fire sales and show that mark-to-market accounting is a critical requirement for
such fire sales to occur. We propose and test hypotheses designed to identify a capital requirement
channel at play in the transactions of non-agency RMBS by insurance companies. Understanding the
economics surrounding the market valuation of non-agency RMBS during the financial crisis is important
given the critical role that RMBS played in destabilizing financial institutions’ balance sheets.20
We show that the interplay of mark-to-market accounting rules and credit-quality based capital
requirements can create an economic incentive for a capital-constrained firm to sell credit-impaired
20
See Erel, Nadauld, and Stulz (2012) for a discussion of the importance of RMBS and other structured finance
instruments on the balance sheet of financial institutions.
35
financial assets even, potentially, at fire sale prices. In particular, even for assets available for sale, OTTI
accounting rules force financial firms to mark financial assets to market prices, thereby recognizing the
loss associated with a decline in an asset’s credit quality. Declines in credit quality have a second
important effect, which is that they raise the capital costs associated with holding a credit impaired asset
on a balance sheet if the capital requirements are credit-quality sensitive. The capital costs associated
with holding a credit-impaired asset may be more onerous than a firm is willing to bear. Seeking capital
relief, capital constrained firms may have to quickly sell credit impaired assets, accepting liquidity
discounts associated with an urgent sale.
We provide empirical evidence consistent with the capital-requirement-OTTI-fire-sale hypothesis.
We find that insurance companies subject to mark-to-market statutory accounting practices with low risk-
based capital ratios are more likely to sell RMBS, all else equal. When capital-constrained insurance
companies do sell RMBS, they sell RMBS at prices lower than sales of non-capital constrained insurance
companies. We further document that the fire sale discounts of capital constrained firms increase as the
credit quality of the asset being sold declines. This result is consistent with a regulatory system which
assigns capital charges as a function of asset quality. Our analysis employs data from insurance
companies specifically although our results have broad implications for financial institutions of all types.
Though calculated differently at banks than insurance companies, capital requirements can create
incentives for banks to unload assets at fire sale prices. While capital requirements for U.S. banks were
not credit-quality sensitive for loans, they were for structured finance securities such as RMBS, so that we
would expect the issues raised in this paper to be relevant for RMBS transactions by banks as well.
We believe this work highlights a potentially unanticipated consequence of the interaction between
fair value accounting and credit-sensitive capital requirements. Capital requirements can create
incentives for firms to sell fair valued assets into an illiquid market, thereby further destabilizing the
market for a given asset class and further weakening the balance sheets of those firms least able to
withstand such weakening.
36
References
Ambrose, Brent W., Cai, Kelly Nianyun, and Jean Helwege. 2011 “Fallen Angels and Price Pressure.”
Working Paper.
Badertscher, Brad, Jeffrey J. Banks, and Peter D. Easton, 2012. “A Convenient Scapegoat: Fair Value
Accounting by Commercial Banks during the Financial Crisis.” The Accounting Review, 87(1): 59-90.
Bank of England, 2008, Financial Stability Report, April.
Becker, Bo, and Victoria Ivashina. 2012. “Reaching for Yield in the Bond Market.” Working Paper.
Benmelech, Efraim, and Nittai K. Bergman. 2009. “Liquidation Values and the Credibility of Financial
Contract Renegotiation: Evidence from U.S. Airlines.” Quarterly Journal of Economics, 123(4):
1635–77.
Boyson, Nicole, Helwege, Jean, and Jindra, Jan. 2012. “Crises, Liquidity Shocks, and Fire Sales at
Commercial Banks.” Working paper.
Brunnermeier, M. K., 2009, Deciphering the liquidity and credit crunch 2007-2008, Journal of Economic
Perspectives, 23: 77-100.
Brunnermeier, Markus, and Lasse H. Pedersen. 2009. “Market Liquidity and Funding Liquidity.” Review
of Financial Studies, 22(6): 2201–38.
Coval, Joshua D., and Erik Stafford. 2007. “Asset Fire Sales (and Purchases) in Equity Markets.” Journal
of Financial Economics, 86(2): 479–512.
Deng, Yongheng, John M. Quigley, and Robert Van Order, 2000. “Mortgage Terminations,
Heterogeneity, and the Exercise of Mortgage Options,” Econometrica 68(2): 275-307.
Ellul, Andrew, Jotikasthira, Pab and Lundblad, Christian T. 2010. “Regulatory Pressure and Fire Sales in
the Corporate Bond Market.” Journal of Financial Economics, forthcoming.
Ellul, Andrew, Jotikasthira, Pab, Lundblad, Christian T. and Yihui Wang. 2012. “Is Historical Cost
Accounting a Panacea? Market Stress, Incentive Distortions, and Gains Trading.” Working Paper.
Erel, Isil, Nadauld, Taylor, and René M. Stulz. 2012. “Why Did U.S. Banks Invest in Highly-Rated
Securitization Tranches?” NBER Working Paper.
Gorton, Gary, and Andrew Metrick. 2010. “Securitized Banking and the Run on Repo.” Journal of
Financial Economics 104 (3), 425-451.
Heaton, John C., Deborah Lucas, and Robert L. McDonald, 2010. “Is Mark-to-Market Accounting
Destabilizing? Analysis and Implications for Policy.” Journal of Monetary Economics 31 (1), 64-75.
Herring, R., and Til Schuermann, 2005. Capital Regulation for Position Risk in Banks, Securities Firms,
and Insurance Companies. In: Scott, Hal S (Ed.), Capital Adequacy Beyond Basel: Bank, Securities
and Insurance. Oxford University Press, New York, chapter 1.
37
Laux, Christian. 2012. “Financial Instruments, Financial Reporting, and Financial Stability.” Working
Paper.
Laux, Christian, and Christian Leuz. 2009. “Did Fair-Value Accounting Contribute to the Financial
Crisis?” NBER Working Paper.
Mitchell, Mark, and Todd Pulvino. 2011. “Arbitrage Crashes and the Speed of Capital.” Journal of
Financial Economics 104 (3), 469-490.
Mitchell, Mark, Lasse Pedersen, and Todd Pulvino, 2007. “Slow Moving Capital.” American Economic
Review 97, 215-220.
Pennington-Cross, A., Ho, G. 2006. “The Termination of Subprime Hybrid and Fixed Rate Mortgages,”
Working Paper, Federal Reserve Bank of St. Louis.
Plantin, Guillaume, Haresh Sapra, and Hyun Song Shin, 2008. “Marking-to-Market: Panacea or
Pandora’s Box?” Journal of Accounting Research, 46(2):435-460.
Pulvino, Todd. 1998. “Do Fire-Sales Exist? An Empirical Study of Commercial Aircraft Transactions.”
Journal of Finance, 53(3): 939–78.
Shaffer, Sanders. 2010. “Fair Value Accounting: Villain or Innocent Victim – Exploring the Links
between Fair Value Accounting, Bank Regulatory Capital and the Recent Financial Crisis,” FRB of
Boston Quantitative Analysis Unit Working Paper.
Sherlund, Shane, 2008. “The past, present, and future of subprime mortgages.” Finance and Economics
Discussion Series, Federal Reserve Board.
Shleifer, Andrei, and Robert W. Vishny. 1992. “Liquidation Values and Debt Capacity: A Market
Equilibrium Approach.” Journal of Finance, 47(4): 1343–66.
Shleifer, Andrei, and Robert W. Vishny. 1997. “The Limits of Arbitrage.” Journal of Finance, 52(1): 35–
55.
Shleifer, Andrei, and Robert Vishny. 2011. “Fire Sales in Finance and Macroeconomics" Journal of
Economic Perspectives, 25(1): 29-48.
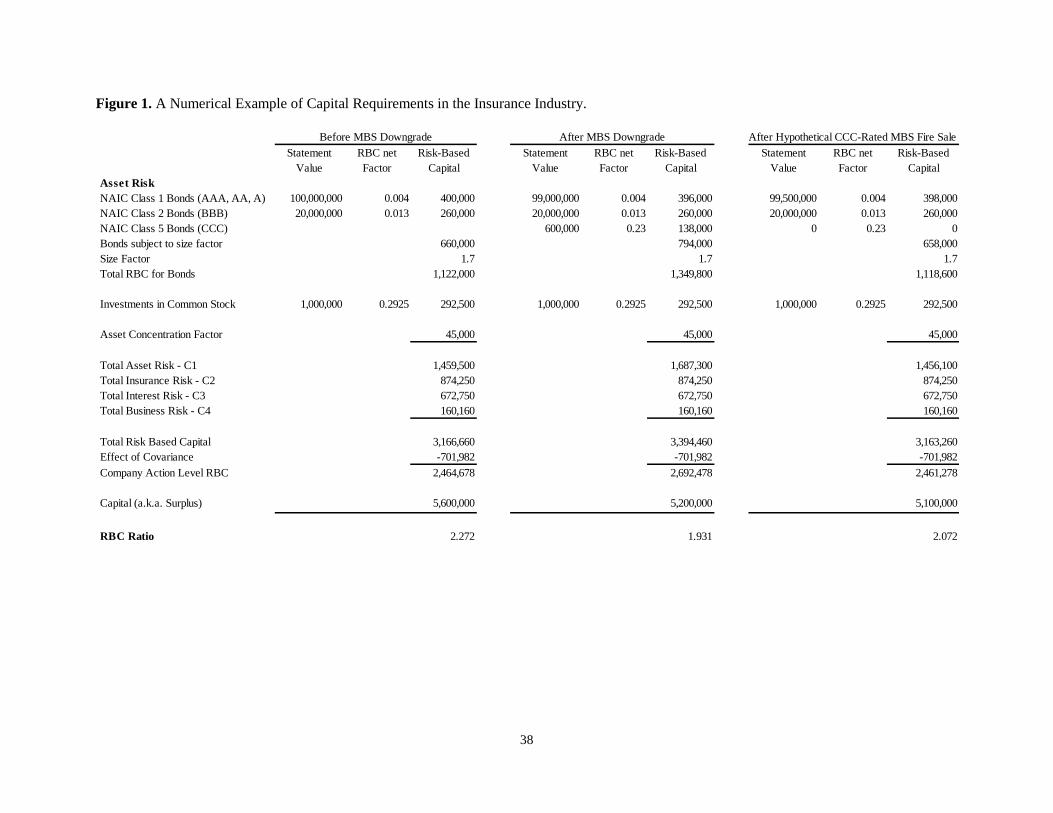
38
Figure 1. A Numerical Example of Capital Requirements in the Insurance Industry.
Statement
Value
RBC net
Factor
Risk-Based
Capital
Statement
Value
RBC net
Factor
Risk-Based
Capital
Statement
Value
RBC net
Factor
Risk-Based
Capital
Asset Risk
NAIC Class 1 Bonds (AAA, AA, A) 100,000,000 0.004 400,000 99,000,000 0.004 396,000 99,500,000 0.004 398,000
NAIC Class 2 Bonds (BBB) 20,000,000 0.013 260,000 20,000,000 0.013 260,000 20,000,000 0.013 260,000
NAIC Class 5 Bonds (CCC) 600,000 0.23 138,000 0 0.23 0
Bonds subject to size factor 660,000 794,000 658,000
Size Factor 1.7 1.7 1.7
Total RBC for Bonds 1,122,000 1,349,800 1,118,600
Investments in Common Stock 1,000,000 0.2925 292,500 1,000,000 0.2925 292,500 1,000,000 0.2925 292,500
Asset Concentration Factor 45,000 45,000 45,000
Total Asset Risk - C1 1,459,500 1,687,300 1,456,100
Total Insurance Risk - C2 874,250 874,250 874,250
Total Interest Risk - C3 672,750 672,750 672,750
Total Business Risk - C4 160,160 160,160 160,160
Total Risk Based Capital 3,166,660 3,394,460 3,163,260
Effect of Covariance -701,982 -701,982 -701,982
Company Action Level RBC 2,464,678 2,692,478 2,461,278
Capital (a.k.a. Surplus) 5,600,000 5,200,000 5,100,000
RBC Ratio 2.272 1.931 2.072
Before MBS Downgrade After MBS Downgrade After Hypothetical CCC-Rated MBS Fire Sale
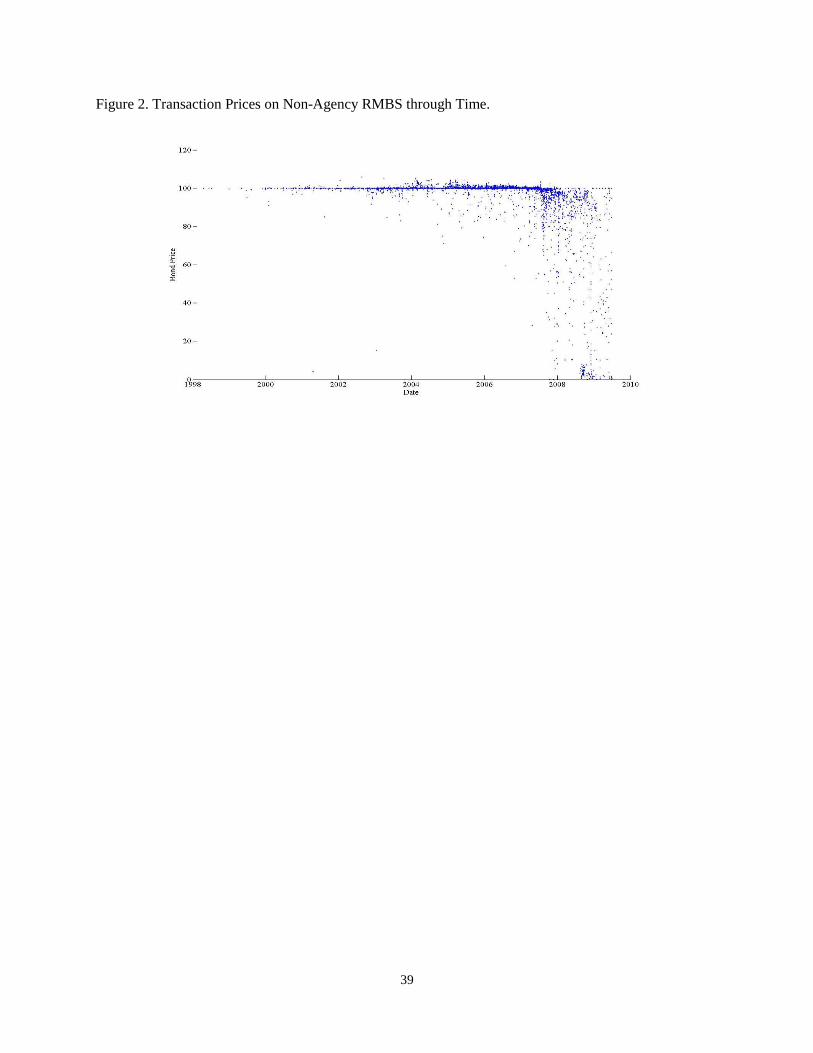
39
Figure 2. Transaction Prices on Non-Agency RMBS through Time.
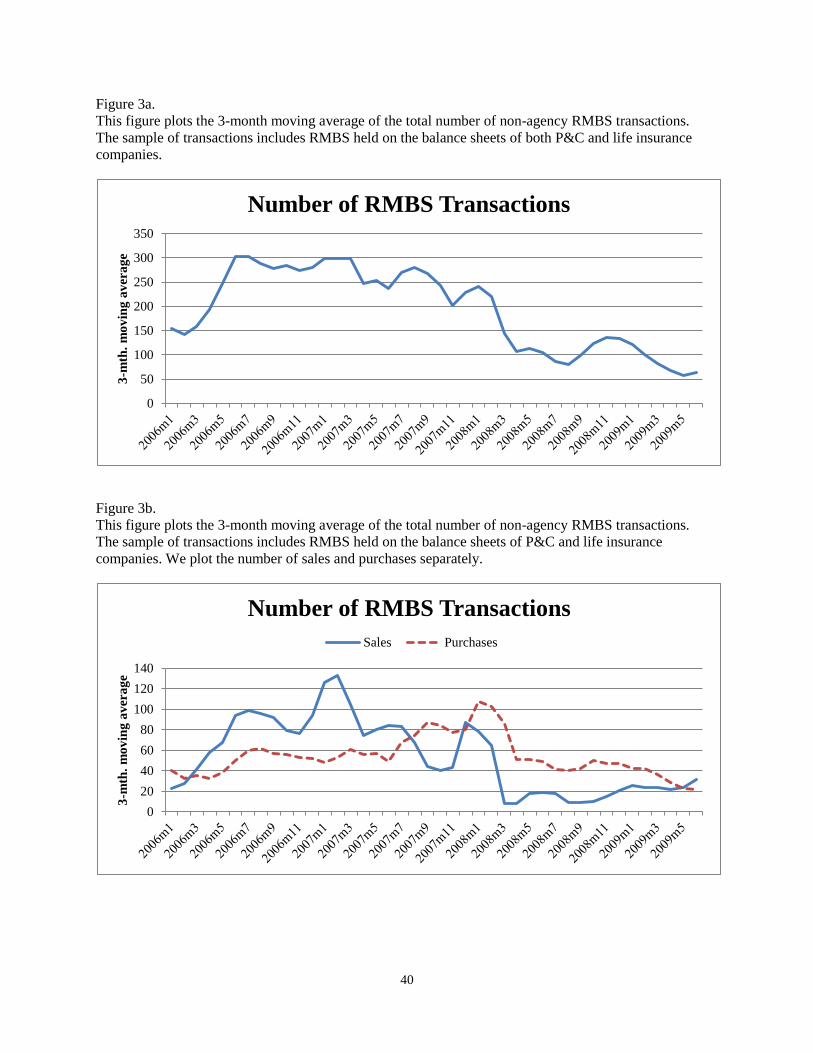
40
Figure 3a.
This figure plots the 3-month moving average of the total number of non-agency RMBS transactions.
The sample of transactions includes RMBS held on the balance sheets of both P&C and life insurance
companies.
Figure 3b.
This figure plots the 3-month moving average of the total number of non-agency RMBS transactions.
The sample of transactions includes RMBS held on the balance sheets of P&C and life insurance
companies. We plot the number of sales and purchases separately.
0
50
100
150
200
250
300
350
3-m
th.
mo
vin
g a
ver
ag
e
Number of RMBS Transactions
0
20
40
60
80
100
120
140
3-m
th.
mo
vin
g a
ver
ag
e
Number of RMBS Transactions
Sales Purchases
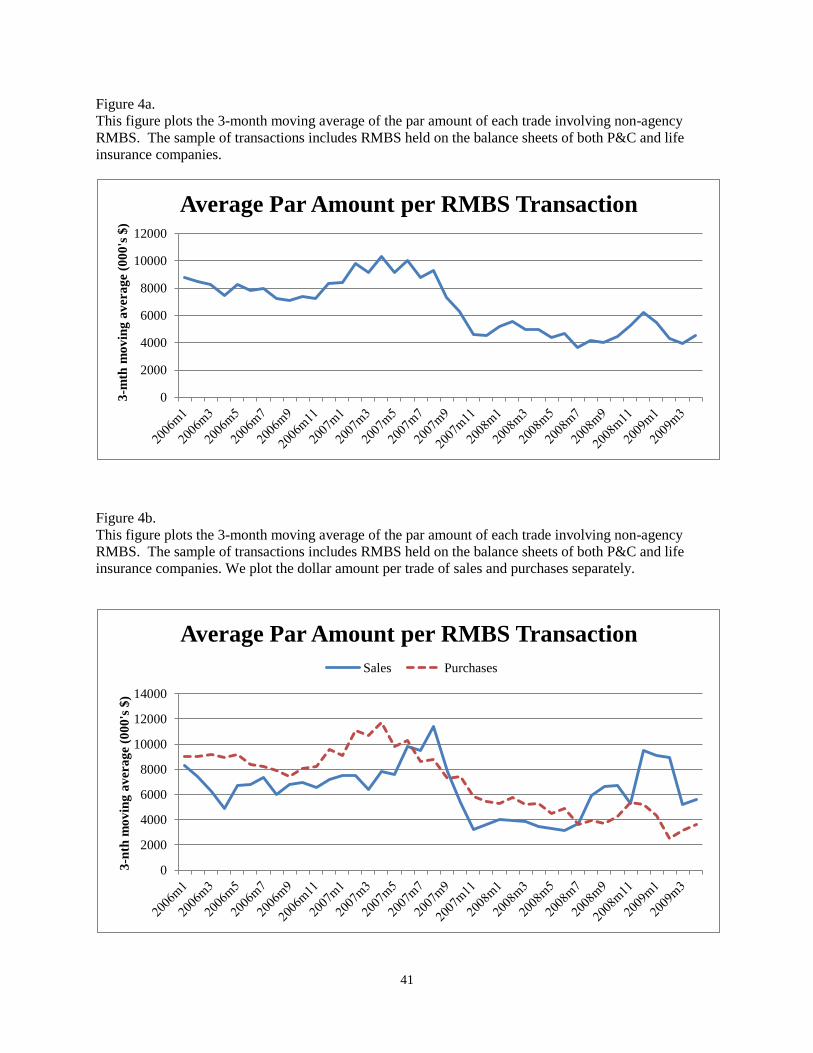
41
Figure 4a.
This figure plots the 3-month moving average of the par amount of each trade involving non-agency
RMBS. The sample of transactions includes RMBS held on the balance sheets of both P&C and life
insurance companies.
Figure 4b.
This figure plots the 3-month moving average of the par amount of each trade involving non-agency
RMBS. The sample of transactions includes RMBS held on the balance sheets of both P&C and life
insurance companies. We plot the dollar amount per trade of sales and purchases separately.
0
2000
4000
6000
8000
10000
12000
3-m
th m
ov
ing
av
era
ge
(00
0's
$)
Average Par Amount per RMBS Transaction
0
2000
4000
6000
8000
10000
12000
14000
3-n
th m
ov
ing
av
era
ge
(00
0's
$)
Average Par Amount per RMBS Transaction
Sales Purchases
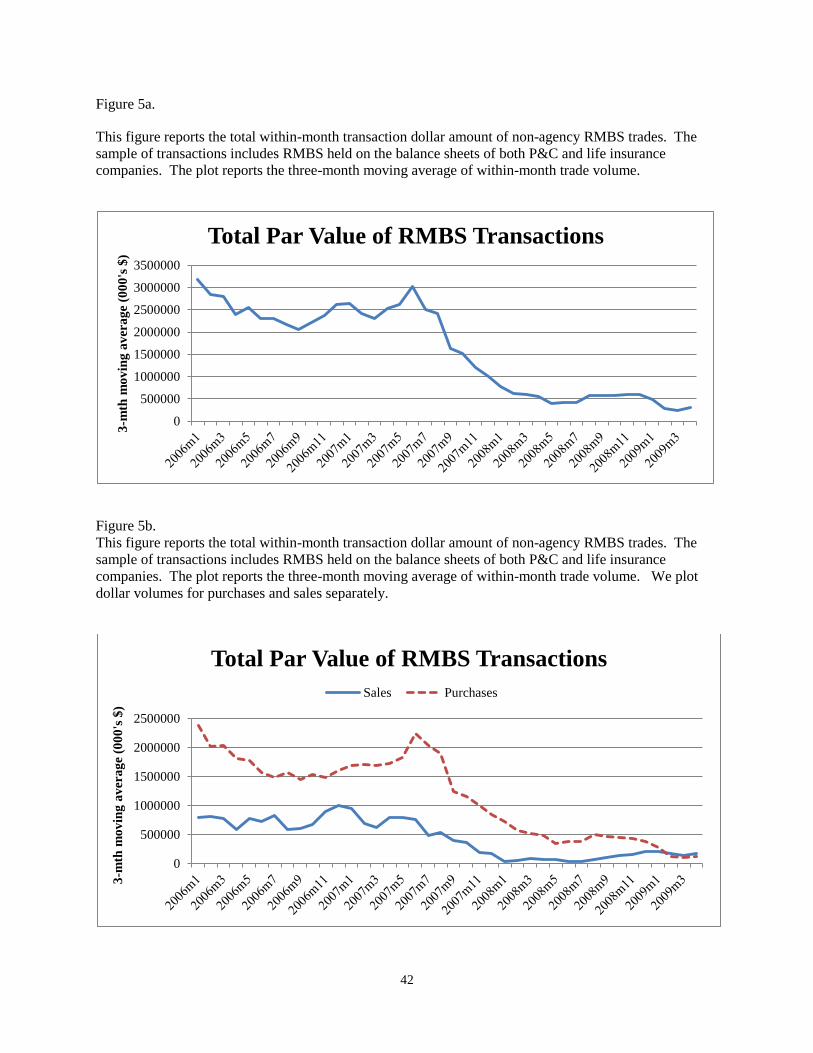
42
Figure 5a.
This figure reports the total within-month transaction dollar amount of non-agency RMBS trades. The
sample of transactions includes RMBS held on the balance sheets of both P&C and life insurance
companies. The plot reports the three-month moving average of within-month trade volume.
Figure 5b.
This figure reports the total within-month transaction dollar amount of non-agency RMBS trades. The
sample of transactions includes RMBS held on the balance sheets of both P&C and life insurance
companies. The plot reports the three-month moving average of within-month trade volume. We plot
dollar volumes for purchases and sales separately.
0
500000
1000000
1500000
2000000
2500000
3000000
3500000
3-m
th m
ov
ing
av
era
ge
(00
0's
$)
Total Par Value of RMBS Transactions
0
500000
1000000
1500000
2000000
2500000
3-m
th m
ov
ing
av
era
ge
(00
0's
$)
Total Par Value of RMBS Transactions
Sales Purchases
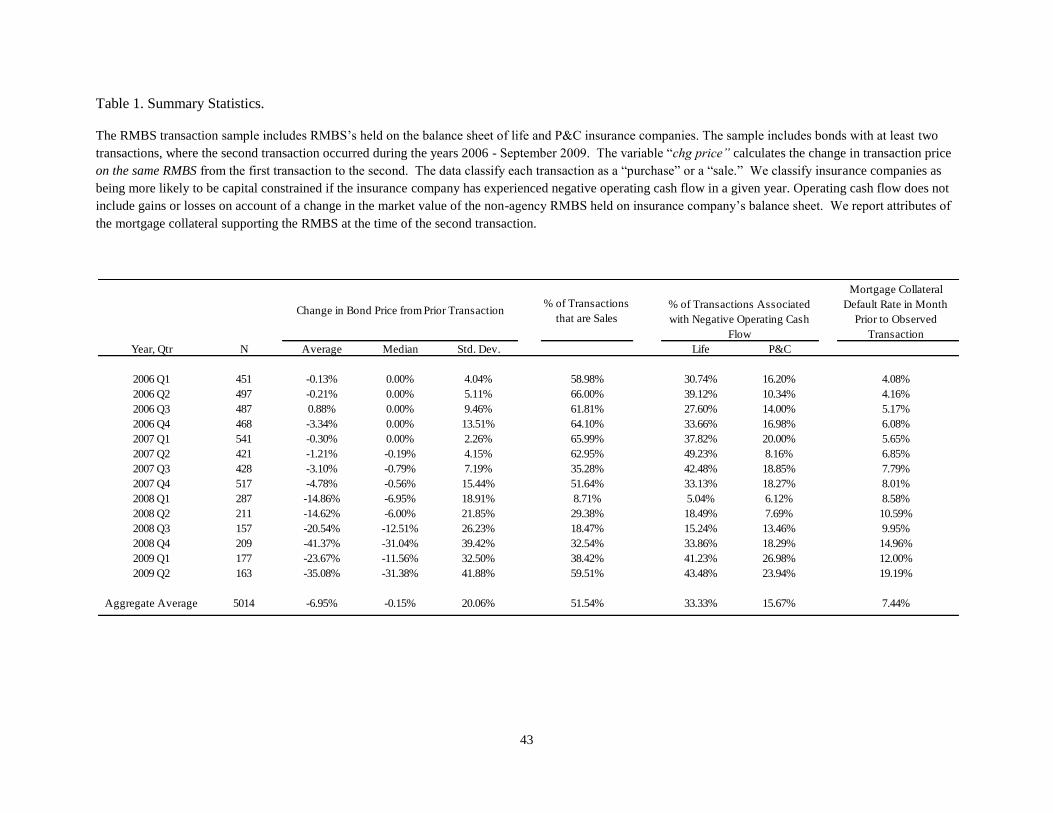
43
Table 1. Summary Statistics.
The RMBS transaction sample includes RMBS’s held on the balance sheet of life and P&C insurance companies. The sample includes bonds with at least two
transactions, where the second transaction occurred during the years 2006 - September 2009. The variable “chg price” calculates the change in transaction price
on the same RMBS from the first transaction to the second. The data classify each transaction as a “purchase” or a “sale.” We classify insurance companies as
being more likely to be capital constrained if the insurance company has experienced negative operating cash flow in a given year. Operating cash flow does not
include gains or losses on account of a change in the market value of the non-agency RMBS held on insurance company’s balance sheet. We report attributes of
the mortgage collateral supporting the RMBS at the time of the second transaction.
% of Transactions
that are Sales
Mortgage Collateral
Default Rate in Month
Prior to Observed
Transaction
Year, Qtr N Average Median Std. Dev. Life P&C
2006 Q1 451 -0.13% 0.00% 4.04% 58.98% 30.74% 16.20% 4.08%
2006 Q2 497 -0.21% 0.00% 5.11% 66.00% 39.12% 10.34% 4.16%
2006 Q3 487 0.88% 0.00% 9.46% 61.81% 27.60% 14.00% 5.17%
2006 Q4 468 -3.34% 0.00% 13.51% 64.10% 33.66% 16.98% 6.08%
2007 Q1 541 -0.30% 0.00% 2.26% 65.99% 37.82% 20.00% 5.65%
2007 Q2 421 -1.21% -0.19% 4.15% 62.95% 49.23% 8.16% 6.85%
2007 Q3 428 -3.10% -0.79% 7.19% 35.28% 42.48% 18.85% 7.79%
2007 Q4 517 -4.78% -0.56% 15.44% 51.64% 33.13% 18.27% 8.01%
2008 Q1 287 -14.86% -6.95% 18.91% 8.71% 5.04% 6.12% 8.58%
2008 Q2 211 -14.62% -6.00% 21.85% 29.38% 18.49% 7.69% 10.59%
2008 Q3 157 -20.54% -12.51% 26.23% 18.47% 15.24% 13.46% 9.95%
2008 Q4 209 -41.37% -31.04% 39.42% 32.54% 33.86% 18.29% 14.96%
2009 Q1 177 -23.67% -11.56% 32.50% 38.42% 41.23% 26.98% 12.00%
2009 Q2 163 -35.08% -31.38% 41.88% 59.51% 43.48% 23.94% 19.19%
Aggregate Average 5014 -6.95% -0.15% 20.06% 51.54% 33.33% 15.67% 7.44%
Change in Bond Price from Prior Transaction% of Transactions Associated
with Negative Operating Cash
Flow
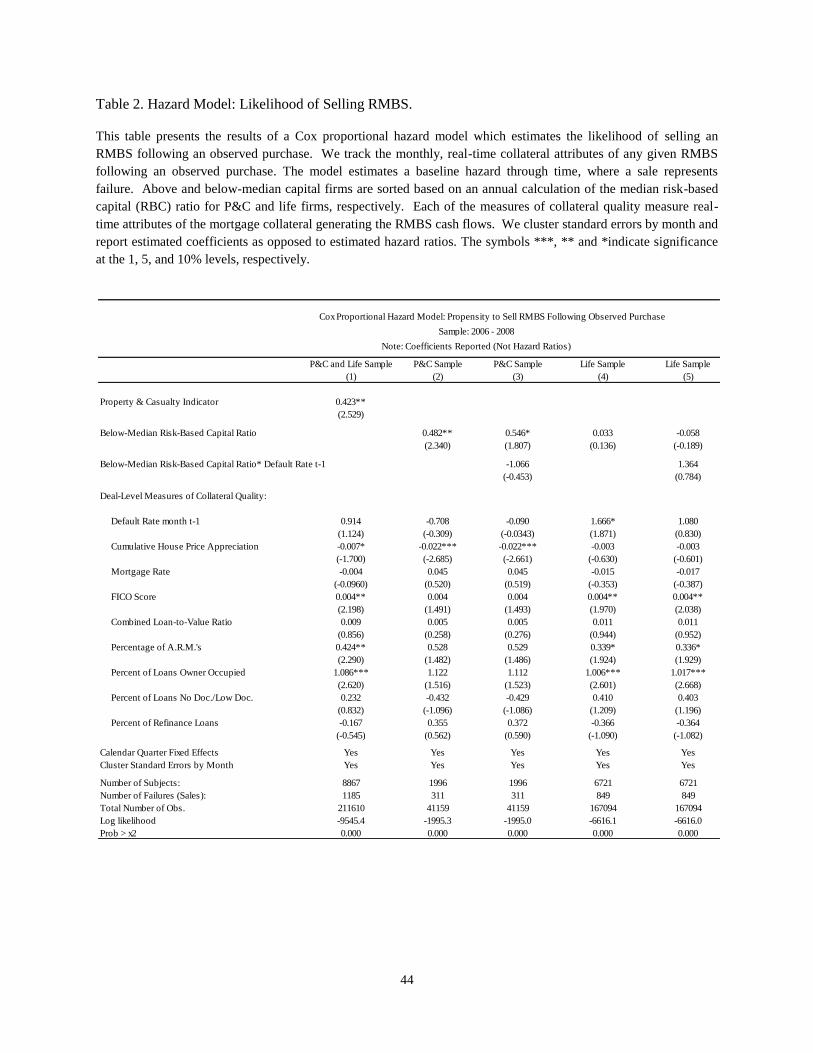
44
Table 2. Hazard Model: Likelihood of Selling RMBS.
This table presents the results of a Cox proportional hazard model which estimates the likelihood of selling an
RMBS following an observed purchase. We track the monthly, real-time collateral attributes of any given RMBS
following an observed purchase. The model estimates a baseline hazard through time, where a sale represents
failure. Above and below-median capital firms are sorted based on an annual calculation of the median risk-based
capital (RBC) ratio for P&C and life firms, respectively. Each of the measures of collateral quality measure real-
time attributes of the mortgage collateral generating the RMBS cash flows. We cluster standard errors by month and
report estimated coefficients as opposed to estimated hazard ratios. The symbols ***, ** and *indicate significance
at the 1, 5, and 10% levels, respectively.
P&C and Life Sample P&C Sample P&C Sample Life Sample Life Sample
(1) (2) (3) (4) (5)
Property & Casualty Indicator 0.423**
(2.529)
Below-Median Risk-Based Capital Ratio 0.482** 0.546* 0.033 -0.058
(2.340) (1.807) (0.136) (-0.189)
Below-Median Risk-Based Capital Ratio* Default Rate t-1 -1.066 1.364
(-0.453) (0.784)
Deal-Level Measures of Collateral Quality:
Default Rate month t-1 0.914 -0.708 -0.090 1.666* 1.080
(1.124) (-0.309) (-0.0343) (1.871) (0.830)
Cumulative House Price Appreciation -0.007* -0.022*** -0.022*** -0.003 -0.003
(-1.700) (-2.685) (-2.661) (-0.630) (-0.601)
Mortgage Rate -0.004 0.045 0.045 -0.015 -0.017
(-0.0960) (0.520) (0.519) (-0.353) (-0.387)
FICO Score 0.004** 0.004 0.004 0.004** 0.004**
(2.198) (1.491) (1.493) (1.970) (2.038)
Combined Loan-to-Value Ratio 0.009 0.005 0.005 0.011 0.011
(0.856) (0.258) (0.276) (0.944) (0.952)
Percentage of A.R.M.'s 0.424** 0.528 0.529 0.339* 0.336*
(2.290) (1.482) (1.486) (1.924) (1.929)
Percent of Loans Owner Occupied 1.086*** 1.122 1.112 1.006*** 1.017***
(2.620) (1.516) (1.523) (2.601) (2.668)
Percent of Loans No Doc./Low Doc. 0.232 -0.432 -0.429 0.410 0.403
(0.832) (-1.096) (-1.086) (1.209) (1.196)
Percent of Refinance Loans -0.167 0.355 0.372 -0.366 -0.364
(-0.545) (0.562) (0.590) (-1.090) (-1.082)
Calendar Quarter Fixed Effects Yes Yes Yes Yes Yes
Cluster Standard Errors by Month Yes Yes Yes Yes Yes
Number of Subjects: 8867 1996 1996 6721 6721
Number of Failures (Sales): 1185 311 311 849 849
Total Number of Obs. 211610 41159 41159 167094 167094
Log likelihood -9545.4 -1995.3 -1995.0 -6616.1 -6616.0
Prob > x2 0.000 0.000 0.000 0.000 0.000
Cox Proportional Hazard Model: Propensity to Sell RMBS Following Observed Purchase
Sample: 2006 - 2008
Note: Coefficients Reported (Not Hazard Ratios)
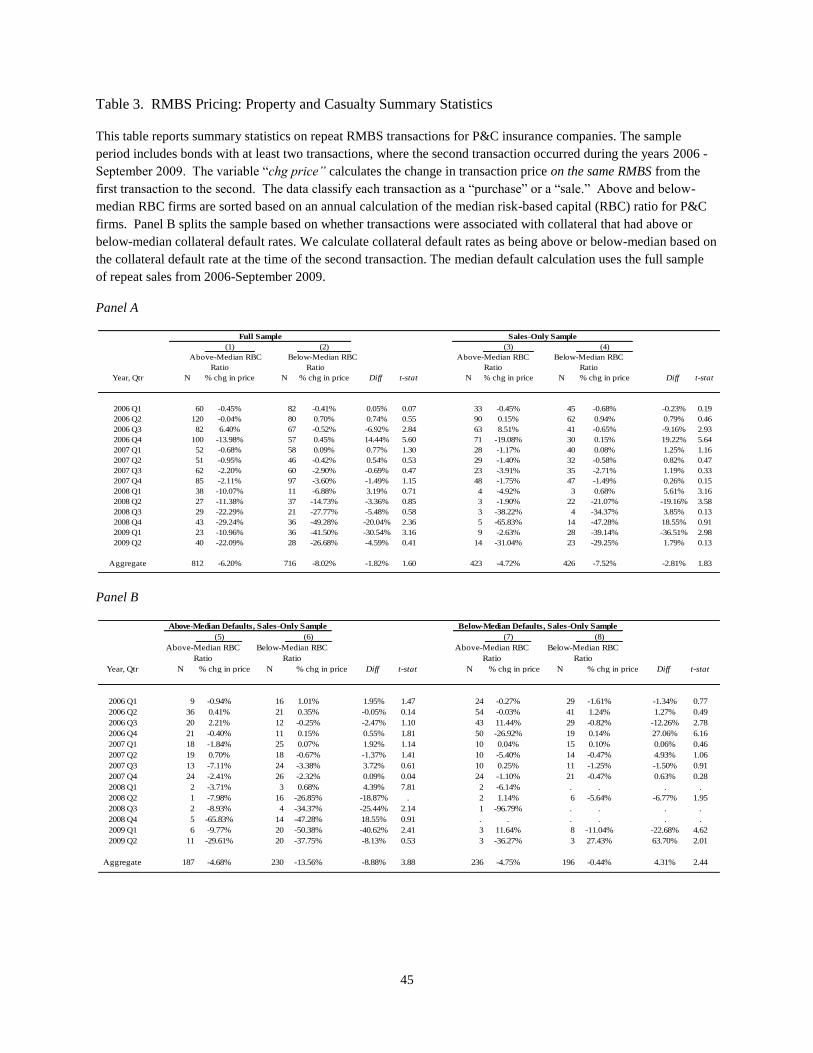
45
Table 3. RMBS Pricing: Property and Casualty Summary Statistics
This table reports summary statistics on repeat RMBS transactions for P&C insurance companies. The sample
period includes bonds with at least two transactions, where the second transaction occurred during the years 2006 -
September 2009. The variable “chg price” calculates the change in transaction price on the same RMBS from the
first transaction to the second. The data classify each transaction as a “purchase” or a “sale.” Above and below-
median RBC firms are sorted based on an annual calculation of the median risk-based capital (RBC) ratio for P&C
firms. Panel B splits the sample based on whether transactions were associated with collateral that had above or
below-median collateral default rates. We calculate collateral default rates as being above or below-median based on
the collateral default rate at the time of the second transaction. The median default calculation uses the full sample
of repeat sales from 2006-September 2009.
Panel A
Panel B
(1) (2) (3) (4)
Year, Qtr N % chg in price N % chg in price Diff t-stat N % chg in price N % chg in price Diff t-stat
2006 Q1 60 -0.45% 82 -0.41% 0.05% 0.07 33 -0.45% 45 -0.68% -0.23% 0.19
2006 Q2 120 -0.04% 80 0.70% 0.74% 0.55 90 0.15% 62 0.94% 0.79% 0.46
2006 Q3 82 6.40% 67 -0.52% -6.92% 2.84 63 8.51% 41 -0.65% -9.16% 2.93
2006 Q4 100 -13.98% 57 0.45% 14.44% 5.60 71 -19.08% 30 0.15% 19.22% 5.64
2007 Q1 52 -0.68% 58 0.09% 0.77% 1.30 28 -1.17% 40 0.08% 1.25% 1.16
2007 Q2 51 -0.95% 46 -0.42% 0.54% 0.53 29 -1.40% 32 -0.58% 0.82% 0.47
2007 Q3 62 -2.20% 60 -2.90% -0.69% 0.47 23 -3.91% 35 -2.71% 1.19% 0.33
2007 Q4 85 -2.11% 97 -3.60% -1.49% 1.15 48 -1.75% 47 -1.49% 0.26% 0.15
2008 Q1 38 -10.07% 11 -6.88% 3.19% 0.71 4 -4.92% 3 0.68% 5.61% 3.16
2008 Q2 27 -11.38% 37 -14.73% -3.36% 0.85 3 -1.90% 22 -21.07% -19.16% 3.58
2008 Q3 29 -22.29% 21 -27.77% -5.48% 0.58 3 -38.22% 4 -34.37% 3.85% 0.13
2008 Q4 43 -29.24% 36 -49.28% -20.04% 2.36 5 -65.83% 14 -47.28% 18.55% 0.91
2009 Q1 23 -10.96% 36 -41.50% -30.54% 3.16 9 -2.63% 28 -39.14% -36.51% 2.98
2009 Q2 40 -22.09% 28 -26.68% -4.59% 0.41 14 -31.04% 23 -29.25% 1.79% 0.13
Aggregate 812 -6.20% 716 -8.02% -1.82% 1.60 423 -4.72% 426 -7.52% -2.81% 1.83
Full Sample Sales-Only Sample
Above-Median RBC
Ratio
Below-Median RBC
Ratio
Above-Median RBC
Ratio
Below-Median RBC
Ratio
(5) (6) (7) (8)
Year, Qtr N N Diff t-stat N N Diff t-stat
2006 Q1 9 -0.94% 16 1.01% 1.95% 1.47 24 -0.27% 29 -1.61% -1.34% 0.77
2006 Q2 36 0.41% 21 0.35% -0.05% 0.14 54 -0.03% 41 1.24% 1.27% 0.49
2006 Q3 20 2.21% 12 -0.25% -2.47% 1.10 43 11.44% 29 -0.82% -12.26% 2.78
2006 Q4 21 -0.40% 11 0.15% 0.55% 1.81 50 -26.92% 19 0.14% 27.06% 6.16
2007 Q1 18 -1.84% 25 0.07% 1.92% 1.14 10 0.04% 15 0.10% 0.06% 0.46
2007 Q2 19 0.70% 18 -0.67% -1.37% 1.41 10 -5.40% 14 -0.47% 4.93% 1.06
2007 Q3 13 -7.11% 24 -3.38% 3.72% 0.61 10 0.25% 11 -1.25% -1.50% 0.91
2007 Q4 24 -2.41% 26 -2.32% 0.09% 0.04 24 -1.10% 21 -0.47% 0.63% 0.28
2008 Q1 2 -3.71% 3 0.68% 4.39% 7.81 2 -6.14% . . . .
2008 Q2 1 -7.98% 16 -26.85% -18.87% . 2 1.14% 6 -5.64% -6.77% 1.95
2008 Q3 2 -8.93% 4 -34.37% -25.44% 2.14 1 -96.79% . . . .
2008 Q4 5 -65.83% 14 -47.28% 18.55% 0.91 . . . . . .
2009 Q1 6 -9.77% 20 -50.38% -40.62% 2.41 3 11.64% 8 -11.04% -22.68% 4.62
2009 Q2 11 -29.61% 20 -37.75% -8.13% 0.53 3 -36.27% 3 27.43% 63.70% 2.01
Aggregate 187 -4.68% 230 -13.56% -8.88% 3.88 236 -4.75% 196 -0.44% 4.31% 2.44
Above-Median Defaults, Sales-Only Sample Below-Median Defaults, Sales-Only Sample
Above-Median RBC
Ratio
Below-Median RBC
Ratio
Above-Median RBC
Ratio
Below-Median RBC
Ratio
% chg in price % chg in price % chg in price % chg in price
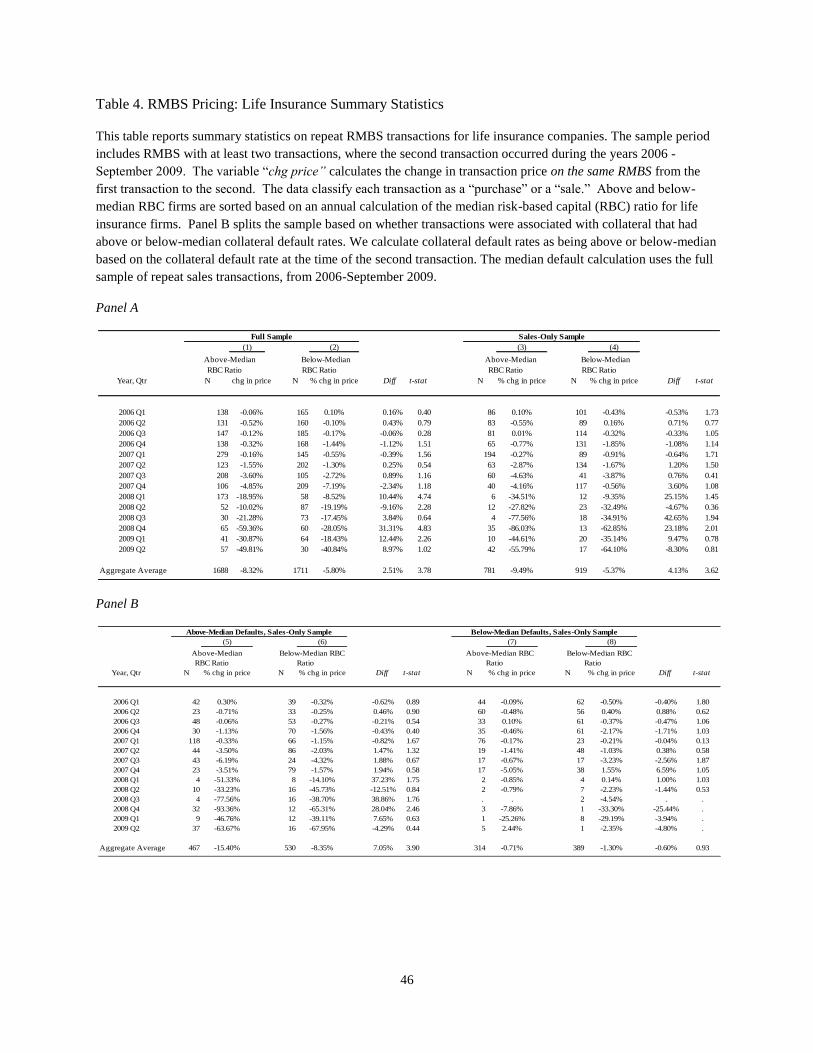
46
Table 4. RMBS Pricing: Life Insurance Summary Statistics
This table reports summary statistics on repeat RMBS transactions for life insurance companies. The sample period
includes RMBS with at least two transactions, where the second transaction occurred during the years 2006 -
September 2009. The variable “chg price” calculates the change in transaction price on the same RMBS from the
first transaction to the second. The data classify each transaction as a “purchase” or a “sale.” Above and below-
median RBC firms are sorted based on an annual calculation of the median risk-based capital (RBC) ratio for life
insurance firms. Panel B splits the sample based on whether transactions were associated with collateral that had
above or below-median collateral default rates. We calculate collateral default rates as being above or below-median
based on the collateral default rate at the time of the second transaction. The median default calculation uses the full
sample of repeat sales transactions, from 2006-September 2009.
Panel A
Panel B
(1) (2) (3) (4)
Year, Qtr N % chg in price N % chg in price Diff t-stat N % chg in price N % chg in price Diff t-stat
2006 Q1 138 -0.06% 165 0.10% 0.16% 0.40 86 0.10% 101 -0.43% -0.53% 1.73
2006 Q2 131 -0.52% 160 -0.10% 0.43% 0.79 83 -0.55% 89 0.16% 0.71% 0.77
2006 Q3 147 -0.12% 185 -0.17% -0.06% 0.28 81 0.01% 114 -0.32% -0.33% 1.05
2006 Q4 138 -0.32% 168 -1.44% -1.12% 1.51 65 -0.77% 131 -1.85% -1.08% 1.14
2007 Q1 279 -0.16% 145 -0.55% -0.39% 1.56 194 -0.27% 89 -0.91% -0.64% 1.71
2007 Q2 123 -1.55% 202 -1.30% 0.25% 0.54 63 -2.87% 134 -1.67% 1.20% 1.50
2007 Q3 208 -3.60% 105 -2.72% 0.89% 1.16 60 -4.63% 41 -3.87% 0.76% 0.41
2007 Q4 106 -4.85% 209 -7.19% -2.34% 1.18 40 -4.16% 117 -0.56% 3.60% 1.08
2008 Q1 173 -18.95% 58 -8.52% 10.44% 4.74 6 -34.51% 12 -9.35% 25.15% 1.45
2008 Q2 52 -10.02% 87 -19.19% -9.16% 2.28 12 -27.82% 23 -32.49% -4.67% 0.36
2008 Q3 30 -21.28% 73 -17.45% 3.84% 0.64 4 -77.56% 18 -34.91% 42.65% 1.94
2008 Q4 65 -59.36% 60 -28.05% 31.31% 4.83 35 -86.03% 13 -62.85% 23.18% 2.01
2009 Q1 41 -30.87% 64 -18.43% 12.44% 2.26 10 -44.61% 20 -35.14% 9.47% 0.78
2009 Q2 57 -49.81% 30 -40.84% 8.97% 1.02 42 -55.79% 17 -64.10% -8.30% 0.81
Aggregate Average 1688 -8.32% 1711 -5.80% 2.51% 3.78 781 -9.49% 919 -5.37% 4.13% 3.62
Full Sample Sales-Only Sample
Above-Median
RBC Ratio
Below-Median
RBC Ratio
Above-Median
RBC Ratio
Below-Median
RBC Ratio
(5) (6) (7) (8)
Year, Qtr N % chg in price N % chg in price Diff t-stat N % chg in price N % chg in price Diff t-stat
2006 Q1 42 0.30% 39 -0.32% -0.62% 0.89 44 -0.09% 62 -0.50% -0.40% 1.80
2006 Q2 23 -0.71% 33 -0.25% 0.46% 0.90 60 -0.48% 56 0.40% 0.88% 0.62
2006 Q3 48 -0.06% 53 -0.27% -0.21% 0.54 33 0.10% 61 -0.37% -0.47% 1.06
2006 Q4 30 -1.13% 70 -1.56% -0.43% 0.40 35 -0.46% 61 -2.17% -1.71% 1.03
2007 Q1 118 -0.33% 66 -1.15% -0.82% 1.67 76 -0.17% 23 -0.21% -0.04% 0.13
2007 Q2 44 -3.50% 86 -2.03% 1.47% 1.32 19 -1.41% 48 -1.03% 0.38% 0.58
2007 Q3 43 -6.19% 24 -4.32% 1.88% 0.67 17 -0.67% 17 -3.23% -2.56% 1.87
2007 Q4 23 -3.51% 79 -1.57% 1.94% 0.58 17 -5.05% 38 1.55% 6.59% 1.05
2008 Q1 4 -51.33% 8 -14.10% 37.23% 1.75 2 -0.85% 4 0.14% 1.00% 1.03
2008 Q2 10 -33.23% 16 -45.73% -12.51% 0.84 2 -0.79% 7 -2.23% -1.44% 0.53
2008 Q3 4 -77.56% 16 -38.70% 38.86% 1.76 . . 2 -4.54% . .
2008 Q4 32 -93.36% 12 -65.31% 28.04% 2.46 3 -7.86% 1 -33.30% -25.44% .
2009 Q1 9 -46.76% 12 -39.11% 7.65% 0.63 1 -25.26% 8 -29.19% -3.94% .
2009 Q2 37 -63.67% 16 -67.95% -4.29% 0.44 5 2.44% 1 -2.35% -4.80% .
Aggregate Average 467 -15.40% 530 -8.35% 7.05% 3.90 314 -0.71% 389 -1.30% -0.60% 0.93
Above-Median RBC
Ratio
Below-Median RBC
Ratio
Above-Median Defaults, Sales-Only Sample Below-Median Defaults, Sales-Only Sample
Above-Median
RBC Ratio
Below-Median RBC
Ratio
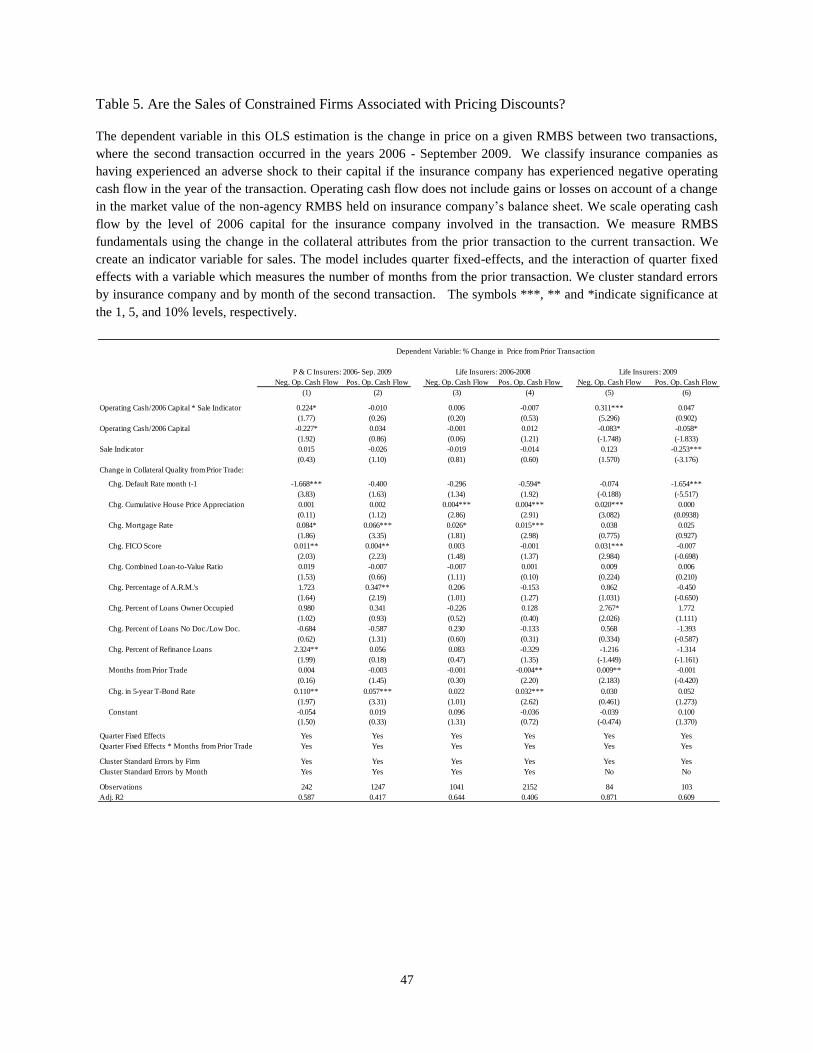
47
Table 5. Are the Sales of Constrained Firms Associated with Pricing Discounts?
The dependent variable in this OLS estimation is the change in price on a given RMBS between two transactions,
where the second transaction occurred in the years 2006 - September 2009. We classify insurance companies as
having experienced an adverse shock to their capital if the insurance company has experienced negative operating
cash flow in the year of the transaction. Operating cash flow does not include gains or losses on account of a change
in the market value of the non-agency RMBS held on insurance company’s balance sheet. We scale operating cash
flow by the level of 2006 capital for the insurance company involved in the transaction. We measure RMBS
fundamentals using the change in the collateral attributes from the prior transaction to the current transaction. We
create an indicator variable for sales. The model includes quarter fixed-effects, and the interaction of quarter fixed
effects with a variable which measures the number of months from the prior transaction. We cluster standard errors
by insurance company and by month of the second transaction. The symbols ***, ** and *indicate significance at
the 1, 5, and 10% levels, respectively.
Neg. Op. Cash Flow Pos. Op. Cash Flow Neg. Op. Cash Flow Pos. Op. Cash Flow Neg. Op. Cash Flow Pos. Op. Cash Flow
(1) (2) (3) (4) (5) (6)
Operating Cash/2006 Capital * Sale Indicator 0.224* -0.010 0.006 -0.007 0.311*** 0.047
(1.77) (0.26) (0.20) (0.53) (5.296) (0.902)
Operating Cash/2006 Capital -0.227* 0.034 -0.001 0.012 -0.083* -0.058*
(1.92) (0.86) (0.06) (1.21) (-1.748) (-1.833)
Sale Indicator 0.015 -0.026 -0.019 -0.014 0.123 -0.253***
(0.43) (1.10) (0.81) (0.60) (1.570) (-3.176)
Change in Collateral Quality from Prior Trade:
Chg. Default Rate month t-1 -1.668*** -0.400 -0.296 -0.594* -0.074 -1.654***
(3.83) (1.63) (1.34) (1.92) (-0.188) (-5.517)
Chg. Cumulative House Price Appreciation 0.001 0.002 0.004*** 0.004*** 0.020*** 0.000
(0.11) (1.12) (2.86) (2.91) (3.082) (0.0938)
Chg. Mortgage Rate 0.084* 0.066*** 0.026* 0.015*** 0.038 0.025
(1.86) (3.35) (1.81) (2.98) (0.775) (0.927)
Chg. FICO Score 0.011** 0.004** 0.003 -0.001 0.031*** -0.007
(2.03) (2.23) (1.48) (1.37) (2.984) (-0.698)
Chg. Combined Loan-to-Value Ratio 0.019 -0.007 -0.007 0.001 0.009 0.006
(1.53) (0.66) (1.11) (0.10) (0.224) (0.210)
Chg. Percentage of A.R.M.'s 1.723 0.347** 0.206 -0.153 0.862 -0.450
(1.64) (2.19) (1.01) (1.27) (1.031) (-0.650)
Chg. Percent of Loans Owner Occupied 0.980 0.341 -0.226 0.128 2.767* 1.772
(1.02) (0.93) (0.52) (0.40) (2.026) (1.111)
Chg. Percent of Loans No Doc./Low Doc. -0.684 -0.587 0.230 -0.133 0.568 -1.393
(0.62) (1.31) (0.60) (0.31) (0.334) (-0.587)
Chg. Percent of Refinance Loans 2.324** 0.056 0.083 -0.329 -1.216 -1.314
(1.99) (0.18) (0.47) (1.35) (-1.449) (-1.161)
Months from Prior Trade 0.004 -0.003 -0.001 -0.004** 0.009** -0.001
(0.16) (1.45) (0.30) (2.20) (2.183) (-0.420)
Chg. in 5-year T-Bond Rate 0.110** 0.057*** 0.022 0.032*** 0.030 0.052
(1.97) (3.31) (1.01) (2.62) (0.461) (1.273)
Constant -0.054 0.019 0.096 -0.036 -0.039 0.100
(1.50) (0.33) (1.31) (0.72) (-0.474) (1.370)
Quarter Fixed Effects Yes Yes Yes Yes Yes Yes
Quarter Fixed Effects * Months from Prior Trade Yes Yes Yes Yes Yes Yes
Cluster Standard Errors by Firm Yes Yes Yes Yes Yes Yes
Cluster Standard Errors by Month Yes Yes Yes Yes No No
Observations 242 1247 1041 2152 84 103
Adj. R2 0.587 0.417 0.644 0.406 0.871 0.609
Dependent Variable: % Change in Price from Prior Transaction
P & C Insurers: 2006- Sep. 2009 Life Insurers: 2006-2008 Life Insurers: 2009
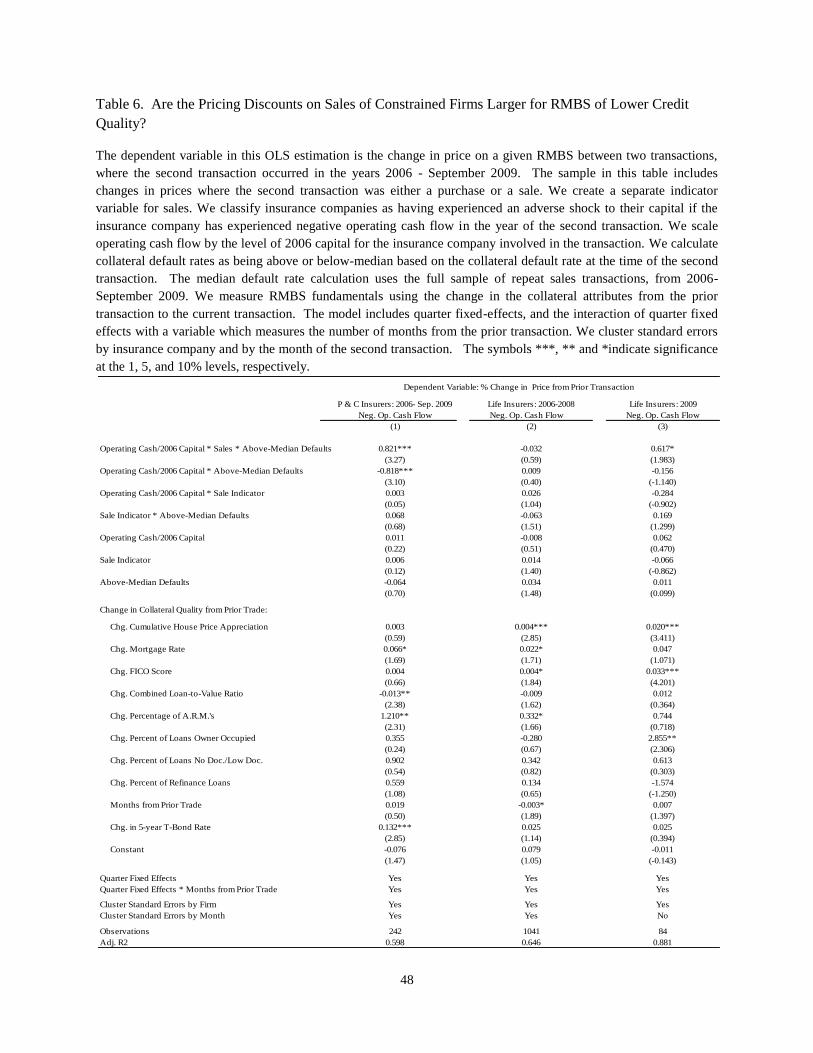
48
Table 6. Are the Pricing Discounts on Sales of Constrained Firms Larger for RMBS of Lower Credit
Quality?
The dependent variable in this OLS estimation is the change in price on a given RMBS between two transactions,
where the second transaction occurred in the years 2006 - September 2009. The sample in this table includes
changes in prices where the second transaction was either a purchase or a sale. We create a separate indicator
variable for sales. We classify insurance companies as having experienced an adverse shock to their capital if the
insurance company has experienced negative operating cash flow in the year of the second transaction. We scale
operating cash flow by the level of 2006 capital for the insurance company involved in the transaction. We calculate
collateral default rates as being above or below-median based on the collateral default rate at the time of the second
transaction. The median default rate calculation uses the full sample of repeat sales transactions, from 2006-
September 2009. We measure RMBS fundamentals using the change in the collateral attributes from the prior
transaction to the current transaction. The model includes quarter fixed-effects, and the interaction of quarter fixed
effects with a variable which measures the number of months from the prior transaction. We cluster standard errors
by insurance company and by the month of the second transaction. The symbols ***, ** and *indicate significance
at the 1, 5, and 10% levels, respectively.
Neg. Op. Cash Flow Neg. Op. Cash Flow
(1) (2) (3)
Operating Cash/2006 Capital * Sales * Above-Median Defaults 0.821*** -0.032 0.617*
(3.27) (0.59) (1.983)
Operating Cash/2006 Capital * Above-Median Defaults -0.818*** 0.009 -0.156
(3.10) (0.40) (-1.140)
Operating Cash/2006 Capital * Sale Indicator 0.003 0.026 -0.284
(0.05) (1.04) (-0.902)
Sale Indicator * Above-Median Defaults 0.068 -0.063 0.169
(0.68) (1.51) (1.299)
Operating Cash/2006 Capital 0.011 -0.008 0.062
(0.22) (0.51) (0.470)
Sale Indicator 0.006 0.014 -0.066
(0.12) (1.40) (-0.862)
Above-Median Defaults -0.064 0.034 0.011
(0.70) (1.48) (0.099)
Change in Collateral Quality from Prior Trade:
Chg. Cumulative House Price Appreciation 0.003 0.004*** 0.020***
(0.59) (2.85) (3.411)
Chg. Mortgage Rate 0.066* 0.022* 0.047
(1.69) (1.71) (1.071)
Chg. FICO Score 0.004 0.004* 0.033***
(0.66) (1.84) (4.201)
Chg. Combined Loan-to-Value Ratio -0.013** -0.009 0.012
(2.38) (1.62) (0.364)
Chg. Percentage of A.R.M.'s 1.210** 0.332* 0.744
(2.31) (1.66) (0.718)
Chg. Percent of Loans Owner Occupied 0.355 -0.280 2.855**
(0.24) (0.67) (2.306)
Chg. Percent of Loans No Doc./Low Doc. 0.902 0.342 0.613
(0.54) (0.82) (0.303)
Chg. Percent of Refinance Loans 0.559 0.134 -1.574
(1.08) (0.65) (-1.250)
Months from Prior Trade 0.019 -0.003* 0.007
(0.50) (1.89) (1.397)
Chg. in 5-year T-Bond Rate 0.132*** 0.025 0.025
(2.85) (1.14) (0.394)
Constant -0.076 0.079 -0.011
(1.47) (1.05) (-0.143)
Quarter Fixed Effects Yes Yes Yes
Quarter Fixed Effects * Months from Prior Trade Yes Yes Yes
Cluster Standard Errors by Firm Yes Yes Yes
Cluster Standard Errors by Month Yes Yes No
Observations 242 1041 84
Adj. R2 0.598 0.646 0.881
Dependent Variable: % Change in Price from Prior Transaction
P & C Insurers: 2006- Sep. 2009 Life Insurers: 2006-2008 Life Insurers: 2009
Neg. Op. Cash Flow