Embed Size (px)
Citation preview
Why Can’t People Estimate: Estimation Bias and Strategic Mis-EstimationICEAA June 2015
Daniel D. Galorath: Founder & CEO
Copyright Galorath Incorporated 2015
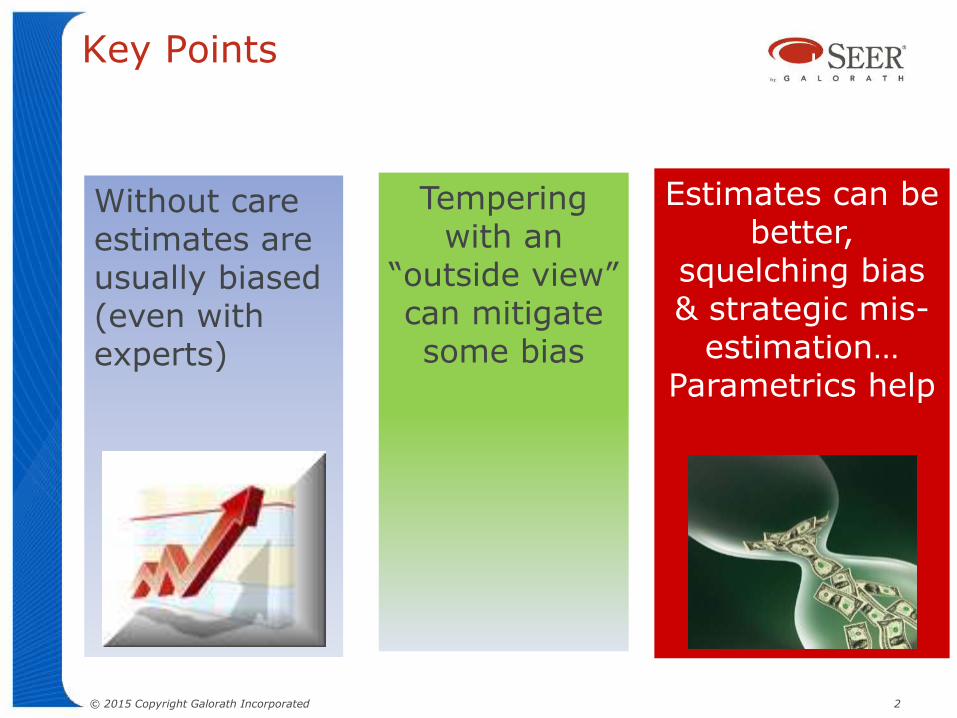
Key Points
Estimates can be better,
squelching bias & strategic mis-
estimation…Parametrics help
© 2015 Copyright Galorath Incorporated 2
Tempering with an
“outside view” can mitigate some bias
Without care estimates are usually biased (even with experts)
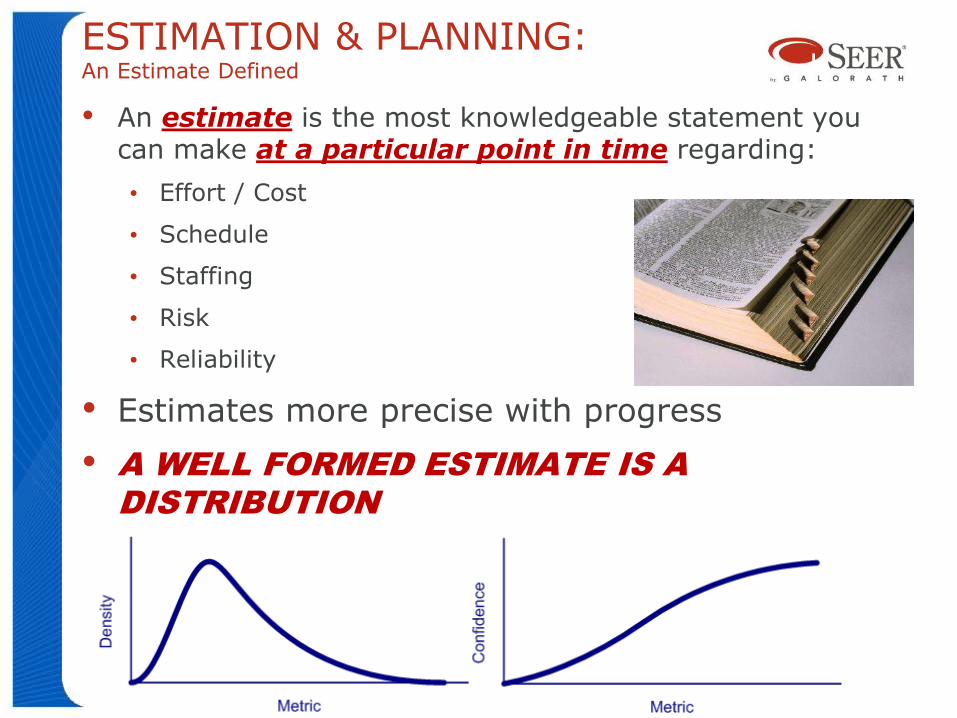
ESTIMATION & PLANNING: An Estimate Defined
• An estimate is the most knowledgeable statement you can make at a particular point in time regarding:
• Effort / Cost
• Schedule
• Staffing
• Risk
• Reliability
• Estimates more precise with progress
• A WELL FORMED ESTIMATE IS A
DISTRIBUTION
3
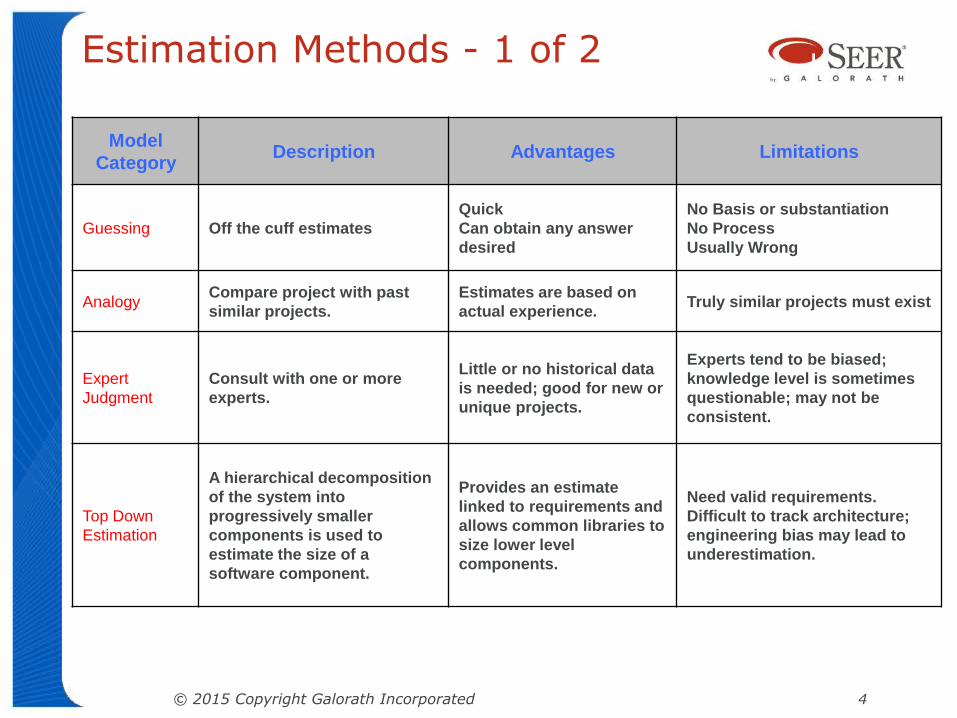
Estimation Methods - 1 of 2
Model
CategoryDescription Advantages Limitations
Guessing Off the cuff estimates
Quick
Can obtain any answer
desired
No Basis or substantiation
No Process
Usually Wrong
AnalogyCompare project with past
similar projects.
Estimates are based on
actual experience.Truly similar projects must exist
Expert
Judgment
Consult with one or more
experts.
Little or no historical data
is needed; good for new or
unique projects.
Experts tend to be biased;
knowledge level is sometimes
questionable; may not be
consistent.
Top Down
Estimation
A hierarchical decomposition
of the system into
progressively smaller
components is used to
estimate the size of a
software component.
Provides an estimate
linked to requirements and
allows common libraries to
size lower level
components.
Need valid requirements.
Difficult to track architecture;
engineering bias may lead to
underestimation.
© 2015 Copyright Galorath Incorporated 4
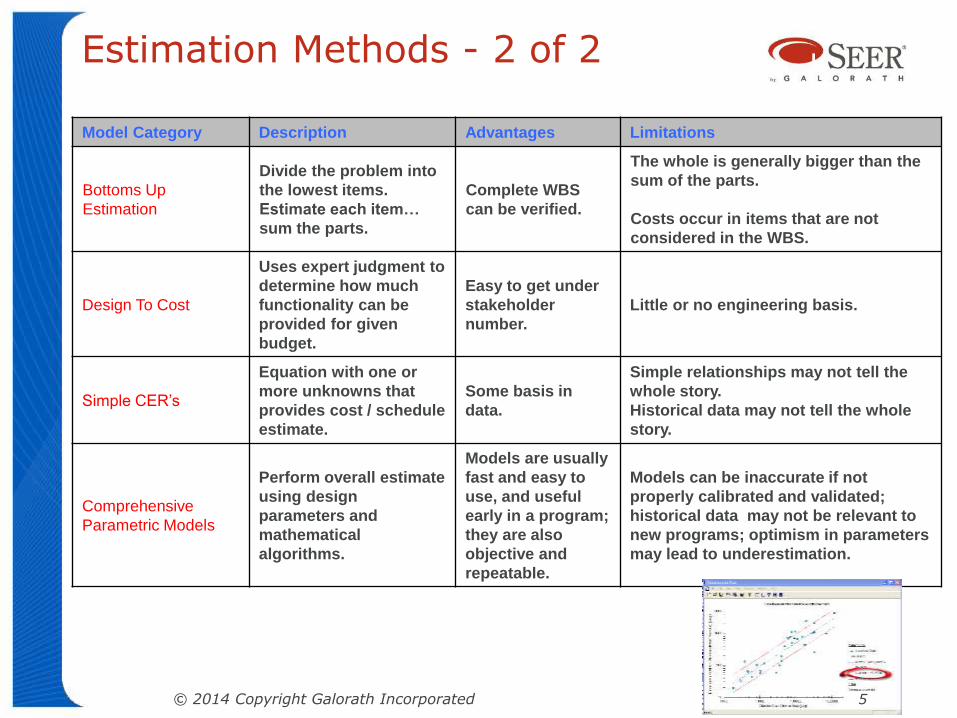
Estimation Methods - 2 of 2
Model Category Description Advantages Limitations
Bottoms Up
Estimation
Divide the problem into
the lowest items.
Estimate each item…
sum the parts.
Complete WBS
can be verified.
The whole is generally bigger than the
sum of the parts.
Costs occur in items that are not
considered in the WBS.
Design To Cost
Uses expert judgment to
determine how much
functionality can be
provided for given
budget.
Easy to get under
stakeholder
number.
Little or no engineering basis.
Simple CER’s
Equation with one or
more unknowns that
provides cost / schedule
estimate.
Some basis in
data.
Simple relationships may not tell the
whole story.
Historical data may not tell the whole
story.
Comprehensive
Parametric Models
Perform overall estimate
using design
parameters and
mathematical
algorithms.
Models are usually
fast and easy to
use, and useful
early in a program;
they are also
objective and
repeatable.
Models can be inaccurate if not
properly calibrated and validated;
historical data may not be relevant to
new programs; optimism in parameters
may lead to underestimation.
© 2014 Copyright Galorath Incorporated 5
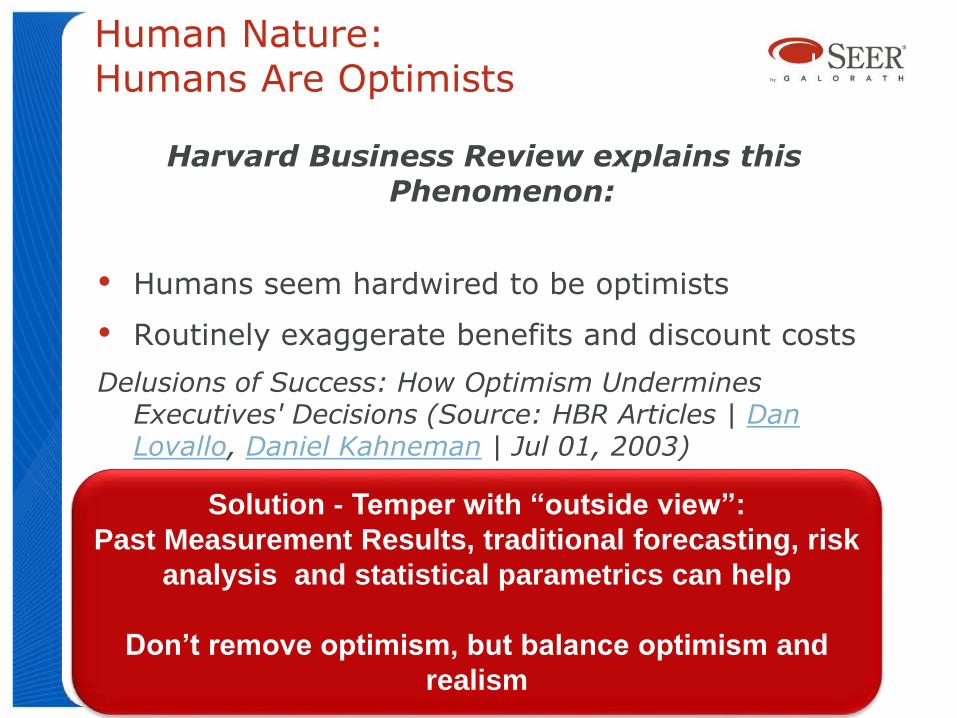
Human Nature: Humans Are Optimists
Harvard Business Review explains this Phenomenon:
• Humans seem hardwired to be optimists
• Routinely exaggerate benefits and discount costs
Delusions of Success: How Optimism Undermines Executives' Decisions (Source: HBR Articles | Dan Lovallo, Daniel Kahneman | Jul 01, 2003)
6
Solution - Temper with “outside view”:
Past Measurement Results, traditional forecasting, risk
analysis and statistical parametrics can help
Don’t remove optimism, but balance optimism and
realism
Thinking Fast & Thinking Slow (Source: Kahneman)
System 1: Thinking Fast System 2: Thinking Slow
• Operates Automatically• No effort• Quick• No voluntary control
• Allocates attention to mental activities that demand it
• Complex computations
• Coherent interpretation of what is going on
• Good at balancing probabilities but often indecisive
• Intuitive answers quickly • Takes over when System 1 can’t process the data
• If the person is willing• Can correct or override
System 1 if it determines intuition is wrong
© 2015 Copyright Galorath Incorporated 7
Cognitive Bias: How Fair Are We (Source BeingHuman.org)
• Cognitive bias: Tendency to make systematic decisions based on cognitive factors rather than evidence
• Human beings exhibit inherent errors in thinking
• Researchers theorize in the past, biases helped survival
• Our brains using shortcuts (heuristics) that sometimes provide irrational conclusions
"We usually think of ourselves as sitting the driver's seat, with ultimate control over the decisions we made and the direction our life takes; but, alas, this perception has more to do with our desires—with how we want to view ourselves—than with reality." Behavioral economist Dan Ariely
• Bias affects everything: from deciding how to handle our money, to relating to other people, to how we form memories
© 2015 Copyright Galorath Incorporated 8
Essence of the problem: Memory is unreliableand we are hard wired to ignore risk & questioning
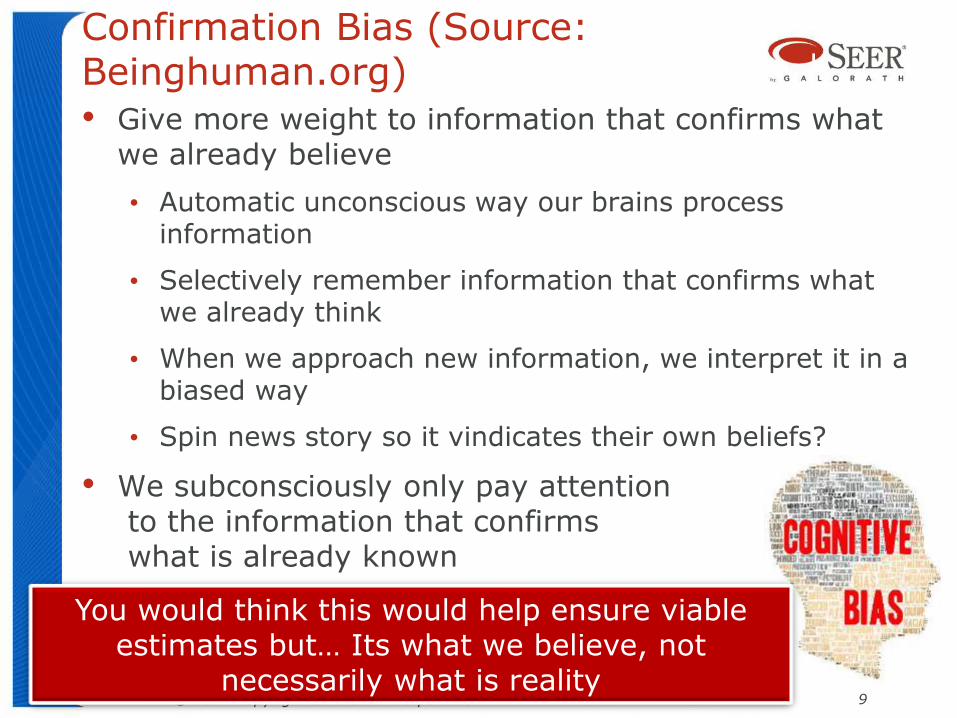
Confirmation Bias (Source: Beinghuman.org)• Give more weight to information that confirms what
we already believe
• Automatic unconscious way our brains process information
• Selectively remember information that confirms what we already think
• When we approach new information, we interpret it in a biased way
• Spin news story so it vindicates their own beliefs?
• We subconsciously only pay attentionto the information that confirmswhat is already known
• Even if what we know is wrong
© 2014 Copyright Galorath Incorporated 9
You would think this would help ensure viable estimates but… Its what we believe, not
necessarily what is reality
Negativity Bias (Being Human.org)
• Unconsciously pay give more weight to negative experiences than positive ones
• Brains react powerfully to negative information than they do to positive information
• Daniel Kahneman explained:
• “The brains of humans and other animals contain a mechanism that is designed to give priority to bad news. By shaving a few hundredths of a second from the time needed to detect a predator, this circuit improves the animal’s odds of living”
• More important for our ancestors to be able to avoid a threat quickly than to gain a reward
© 2015 Copyright Galorath Incorporated 10
Again, this should yield viable estimates but is usually overridden
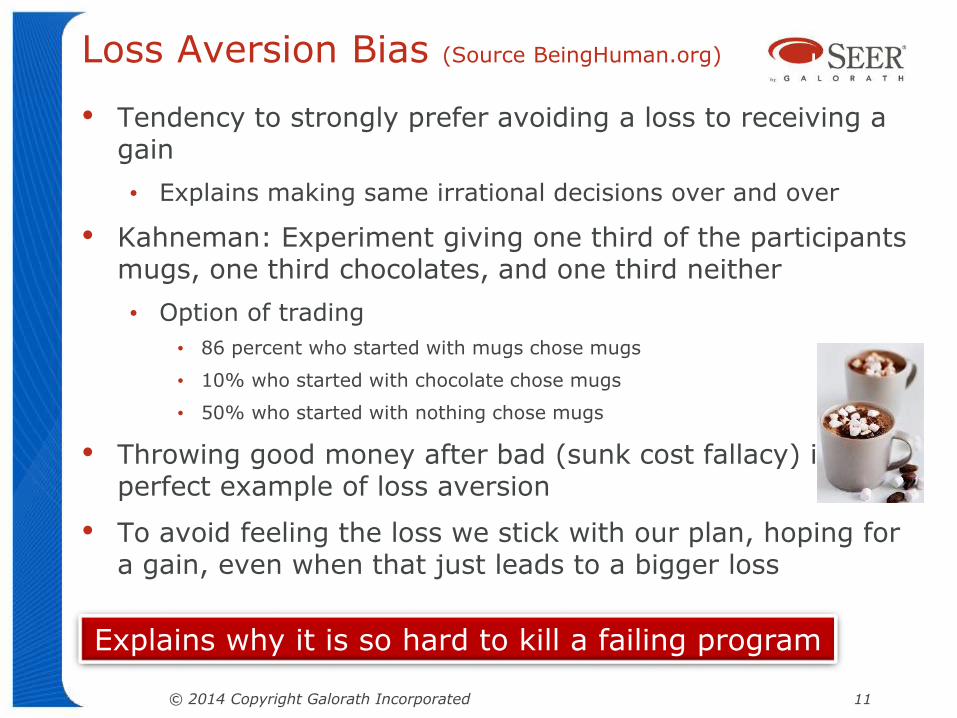
Loss Aversion Bias (Source BeingHuman.org)
• Tendency to strongly prefer avoiding a loss to receiving a gain
• Explains making same irrational decisions over and over
• Kahneman: Experiment giving one third of the participants mugs, one third chocolates, and one third neither
• Option of trading
• 86 percent who started with mugs chose mugs
• 10% who started with chocolate chose mugs
• 50% who started with nothing chose mugs
• Throwing good money after bad (sunk cost fallacy) is a perfect example of loss aversion
• To avoid feeling the loss we stick with our plan, hoping for a gain, even when that just leads to a bigger loss
© 2014 Copyright Galorath Incorporated 11
Explains why it is so hard to kill a failing program
Affect Heuristic Bias (Source:
Beinghuman.org)
• Involuntary response to a stimulus that speeds up the time it takes to process information
• If we have pleasant feelings, we see benefits high and risks low, and vice versa
• affect heuristic behaves as a first and fast response mechanism in decision-making
• Helpful in life or death situations where time was of the absolute essence.
• System 2 The analytic, rational system of the brain is relatively slow and requires effort
• System 1 The experiential system is different—speedy, relying on emotional images and narratives that help us to estimate risk and benefit.
© 2014 Copyright Galorath Incorporated 12
Hopefully estimates elicit system 2... But often are off the cuff via system 1
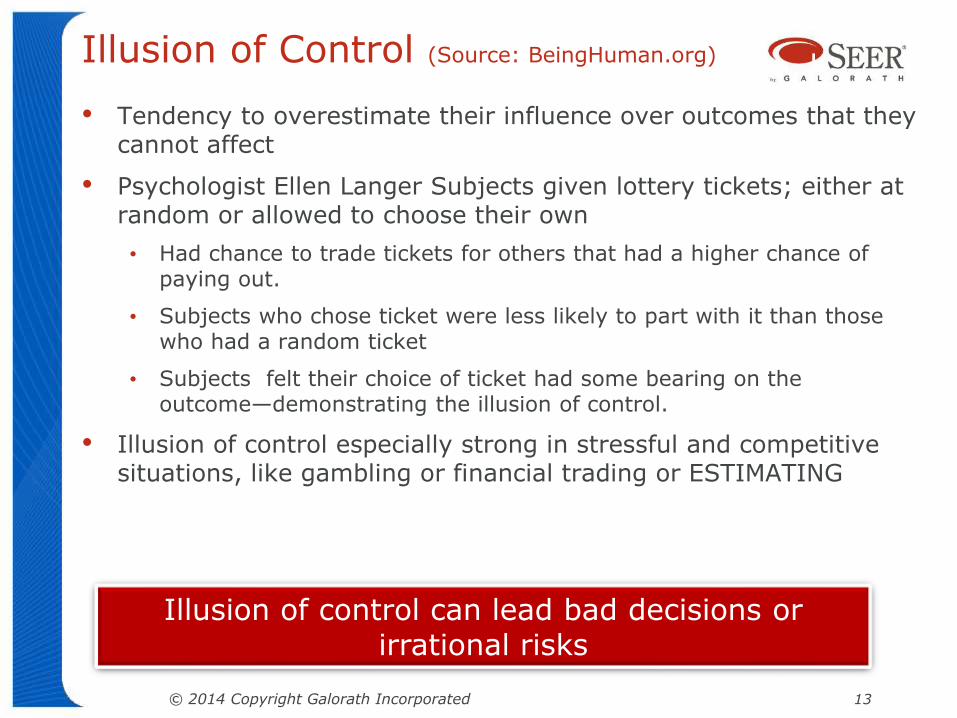
Illusion of Control (Source: BeingHuman.org)
• Tendency to overestimate their influence over outcomes that they cannot affect
• Psychologist Ellen Langer Subjects given lottery tickets; either at random or allowed to choose their own
• Had chance to trade tickets for others that had a higher chance of paying out.
• Subjects who chose ticket were less likely to part with it than those who had a random ticket
• Subjects felt their choice of ticket had some bearing on the outcome—demonstrating the illusion of control.
• Illusion of control especially strong in stressful and competitive situations, like gambling or financial trading or ESTIMATING
© 2014 Copyright Galorath Incorporated 13
Illusion of control can lead bad decisions or irrational risks
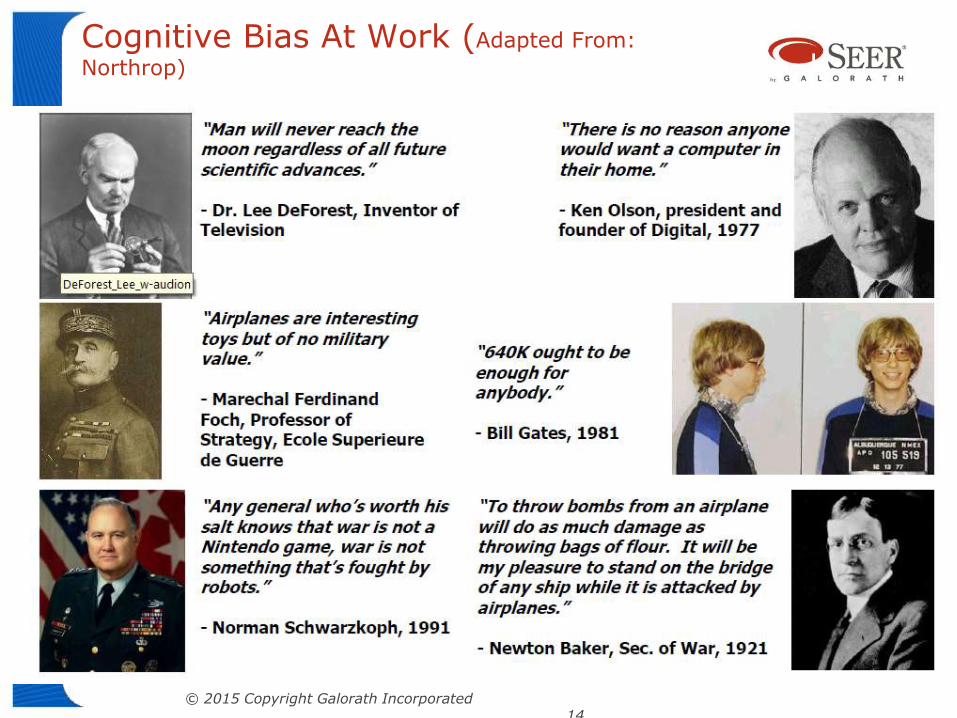
Cognitive Bias At Work (Adapted From:
Northrop)
© 2015 Copyright Galorath Incorporated14
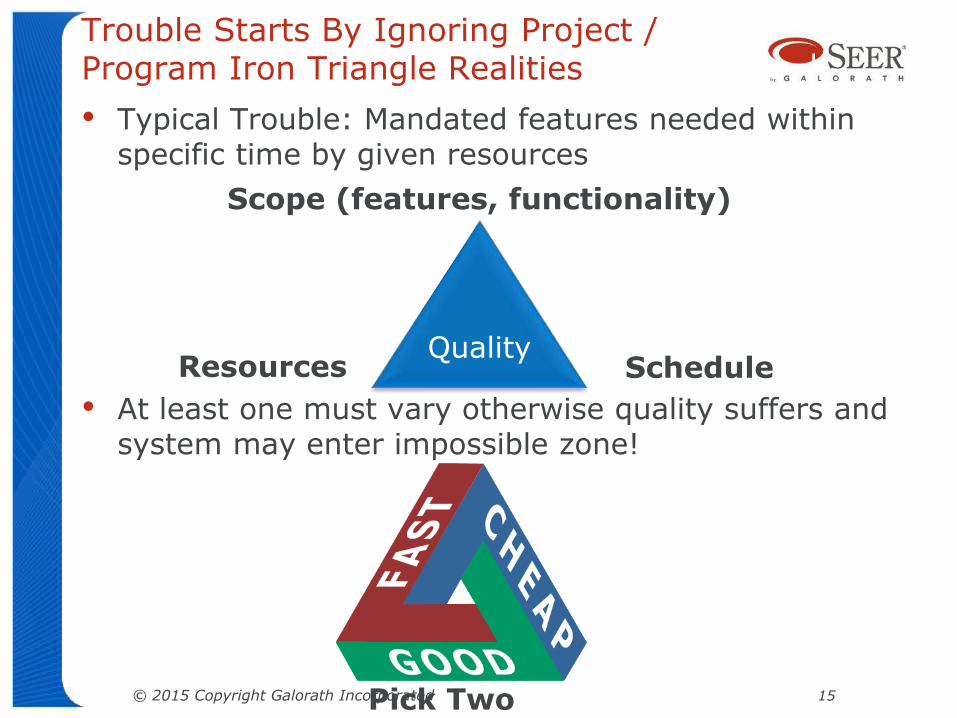
Trouble Starts By Ignoring Project / Program Iron Triangle Realities
• Typical Trouble: Mandated features needed within specific time by given resources
• At least one must vary otherwise quality suffers and system may enter impossible zone!
QualityResources Schedule
Scope (features, functionality)
Pick Two© 2015 Copyright Galorath Incorporated 15
The Planning Fallacy (Kahneman &
Tversky, 1979)
• Judgment errors are systematic & predictable, not random
• Manifesting bias rather than confusion
• Judgment errors made by experts and laypeople alike
• Errors continue when estimators aware of their nature
• Optimistic due to overconfidence ignoring uncertainty
• Underestimate costs, schedule, risks
• Overestimate benefits of the same actions
• Root cause: Each new venture viewed as unique
• “inside view” focusing on components rather than outcomes of similar completed actions
• FACT: Typically past more similar assumed
• even ventures may appear entirely different
© 2015 Copyright Galorath Incorporated 16
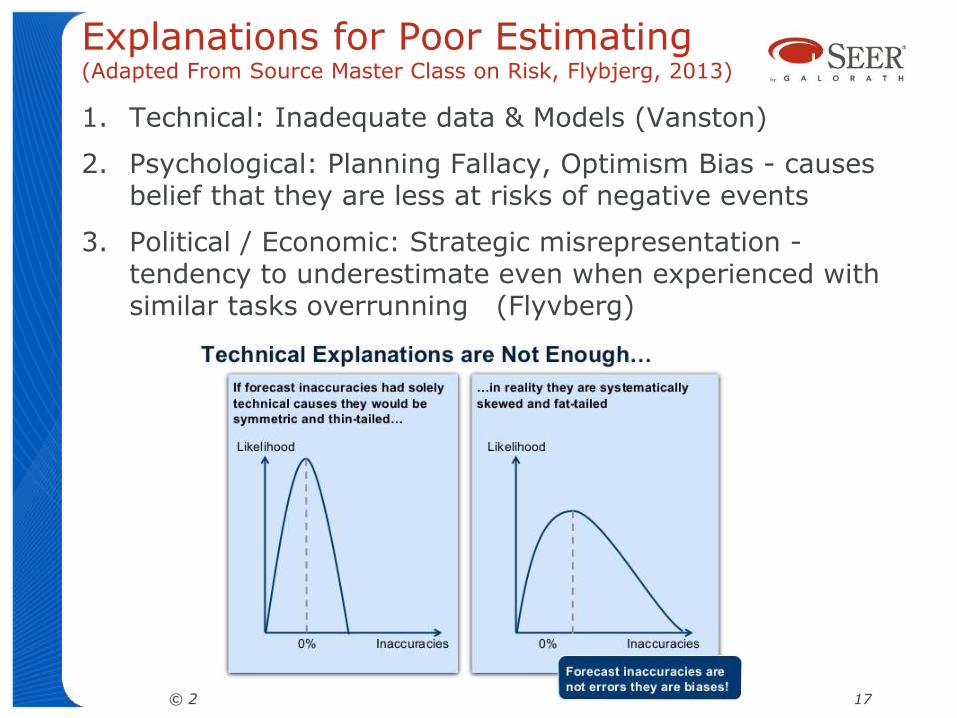
Explanations for Poor Estimating (Adapted From Source Master Class on Risk, Flybjerg, 2013)
1. Technical: Inadequate data & Models (Vanston)
2. Psychological: Planning Fallacy, Optimism Bias - causes belief that they are less at risks of negative events
3. Political / Economic: Strategic misrepresentation -tendency to underestimate even when experienced with similar tasks overrunning (Flyvberg)
© 2015 Copyright Galorath Incorporated 17
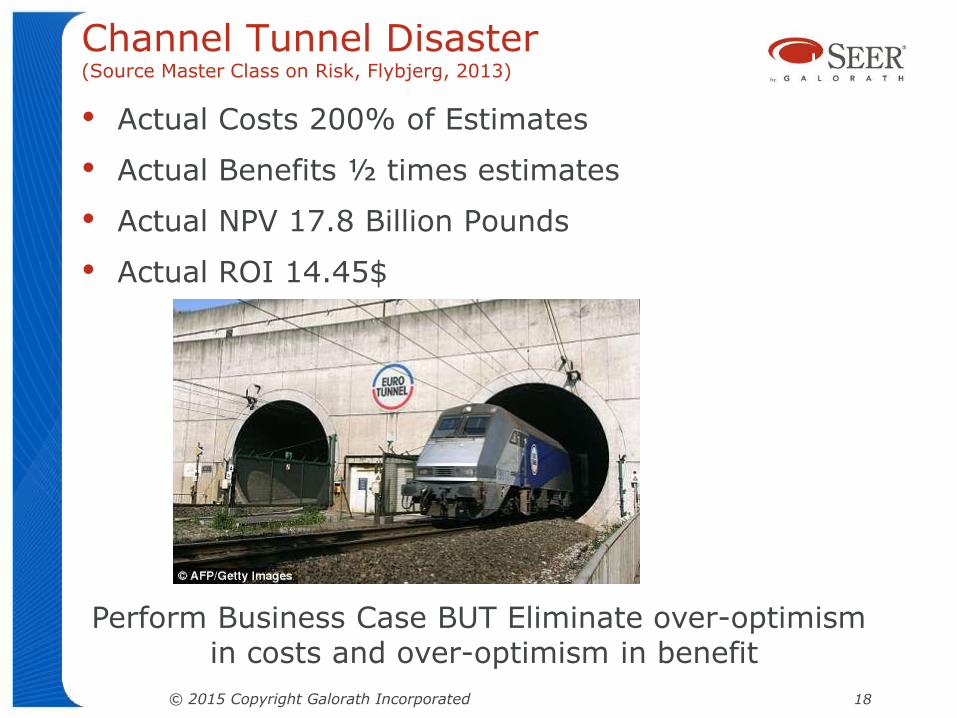
Channel Tunnel Disaster (Source Master Class on Risk, Flybjerg, 2013)
• Actual Costs 200% of Estimates
• Actual Benefits ½ times estimates
• Actual NPV 17.8 Billion Pounds
• Actual ROI 14.45$
© 2015 Copyright Galorath Incorporated 18
Perform Business Case BUT Eliminate over-optimismin costs and over-optimism in benefit
Reference Class Forecasting (adapted
from http://www.slideshare.net/assocpm/a-masterclass-in-risk)
• Best predictor of performance is actual performance of implemented comparable projects (Nobel Prize Economics 2002)
• Provide an “outside view” focus on outcomes of analogous projects
• Reference Class Forecasting attempts to force the outside view and eliminate optimism and misrepresentation
• Choose relevant “reference class” completed analogous projects
• Compute probability distribution
• Compare range of new projects to completed projects
© 2015 Copyright Galorath Incorporated 19
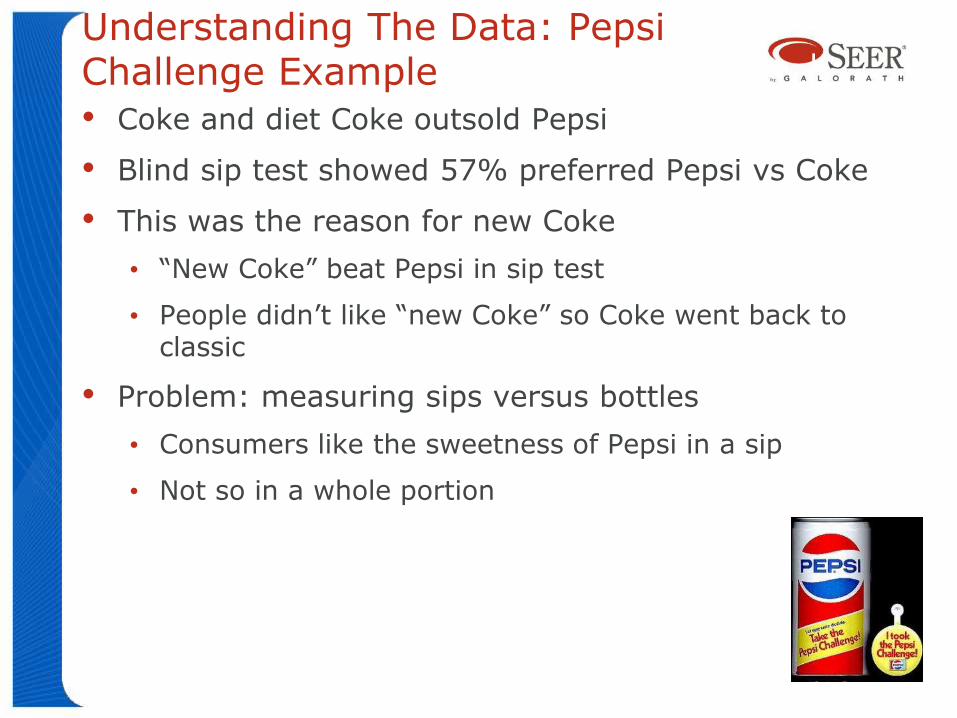
Understanding The Data: Pepsi Challenge Example• Coke and diet Coke outsold Pepsi
• Blind sip test showed 57% preferred Pepsi vs Coke
• This was the reason for new Coke
• “New Coke” beat Pepsi in sip test
• People didn’t like “new Coke” so Coke went back to classic
• Problem: measuring sips versus bottles
• Consumers like the sweetness of Pepsi in a sip
• Not so in a whole portion
21
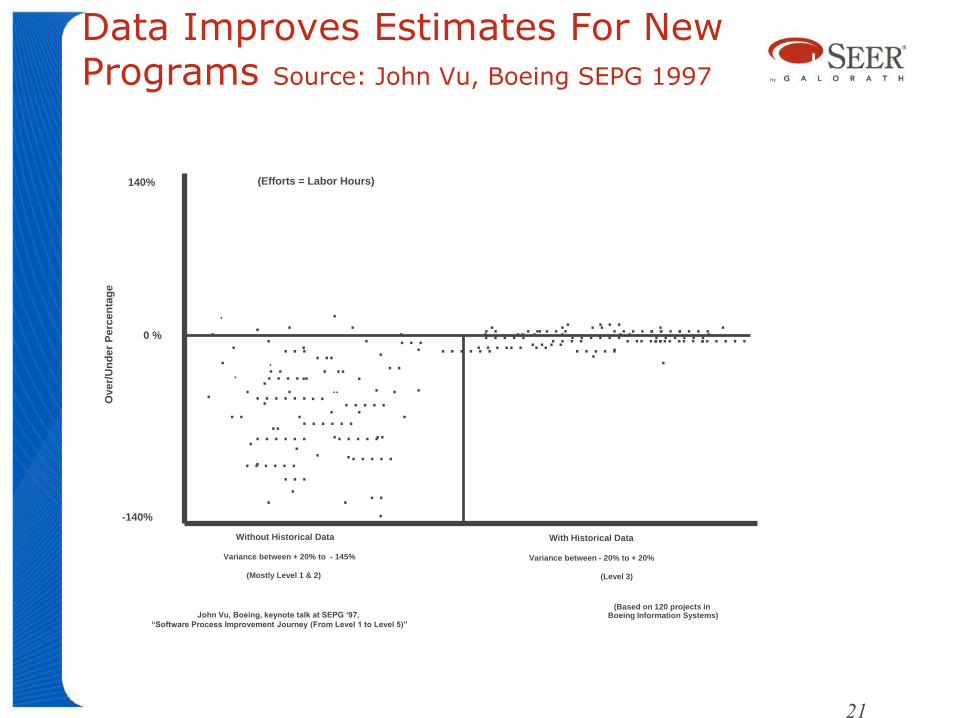
Data Improves Estimates For New Programs Source: John Vu, Boeing SEPG 1997
.
0 %
140%
-140%
..
..
.
..
.
.
.
.
.
.
. .
. . . .
.
. . .
. .
.
.
. . . .. . . . . . . ...
. . . .. .
.
. .
. ..
.
.
.
. .. .. ...... . .. . ... . ...
.. .
.
Without Historical Data With Historical Data
Variance between + 20% to - 145% Variance between - 20% to + 20%
(Efforts = Labor Hours)
(Mostly Level 1 & 2) (Level 3)
Over/
Un
de
r P
erc
en
tag
e
.
(Based on 120 projects in Boeing Information Systems)
.
. . .
.
.
..
..
.
. .
.
.
.
.
. .
.
.
.. .
. . .. . . . . .. . . . . .. .
..
. . .. . .
. . . .. . . .. . . . .
. . . . .
. . . . .. . . . . .
. . . . .. . . . . .
. . . . . .. . . . . . . .
. . .
. . . . .
. . . . .
. . . .
. . . . . .
. . . . . .
. . . . . .
John Vu, Boeing, keynote talk at SEPG ‘97,
“Software Process Improvement Journey (From Level 1 to Level 5)”
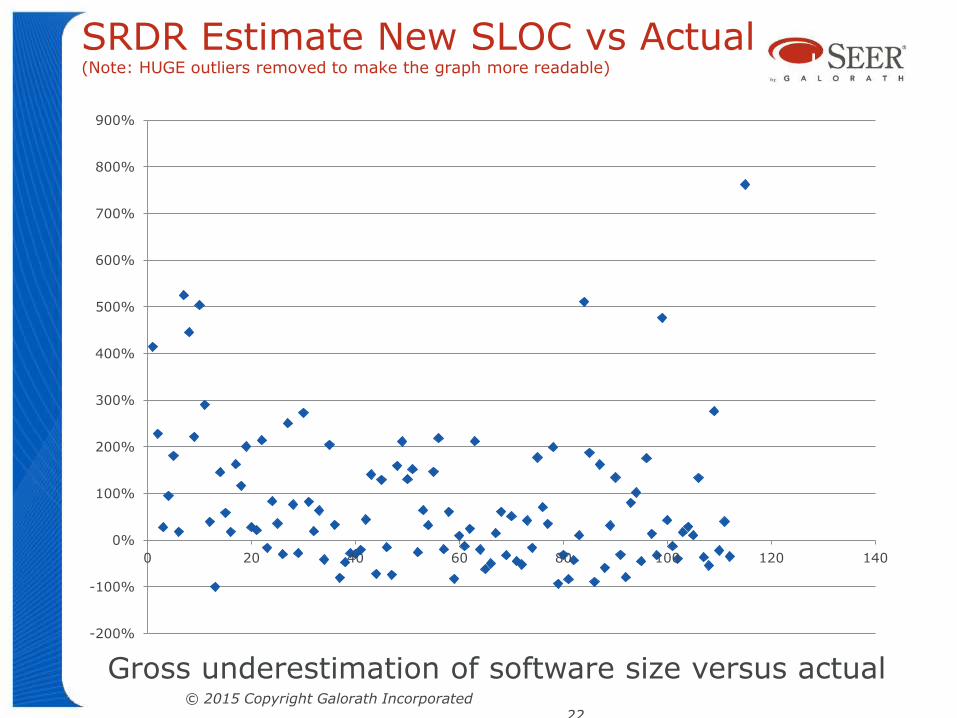
SRDR Estimate New SLOC vs Actual (Note: HUGE outliers removed to make the graph more readable)
-200%
-100%
0%
100%
200%
300%
400%
500%
600%
700%
800%
900%
0 20 40 60 80 100 120 140
© 2015 Copyright Galorath Incorporated22
Gross underestimation of software size versus actual
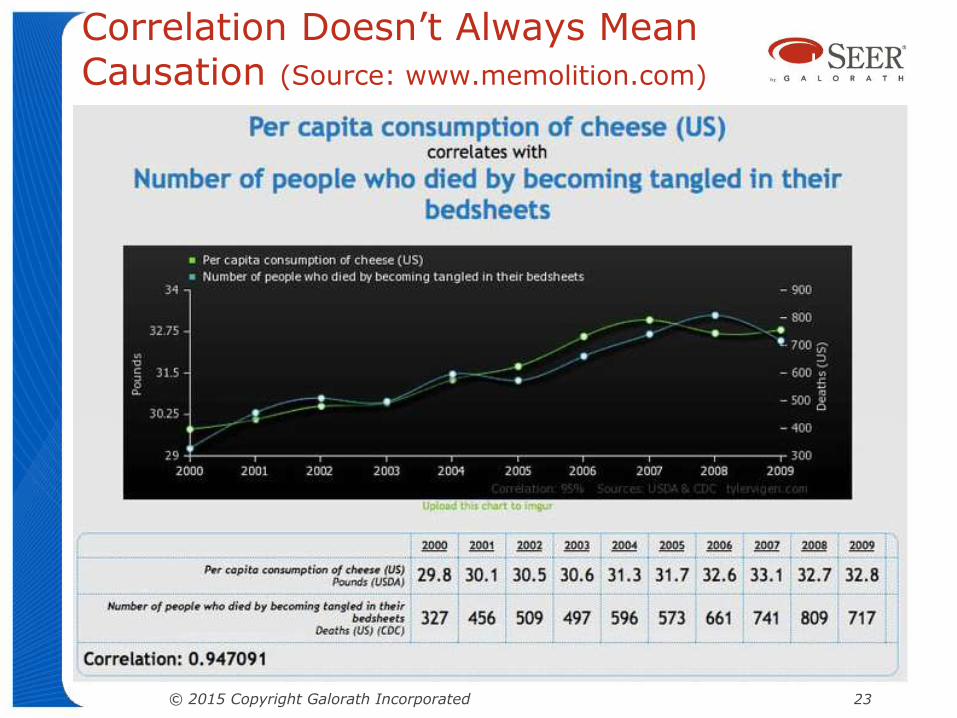
Correlation Doesn’t Always Mean Causation (Source: www.memolition.com)
© 2015 Copyright Galorath Incorporated 23
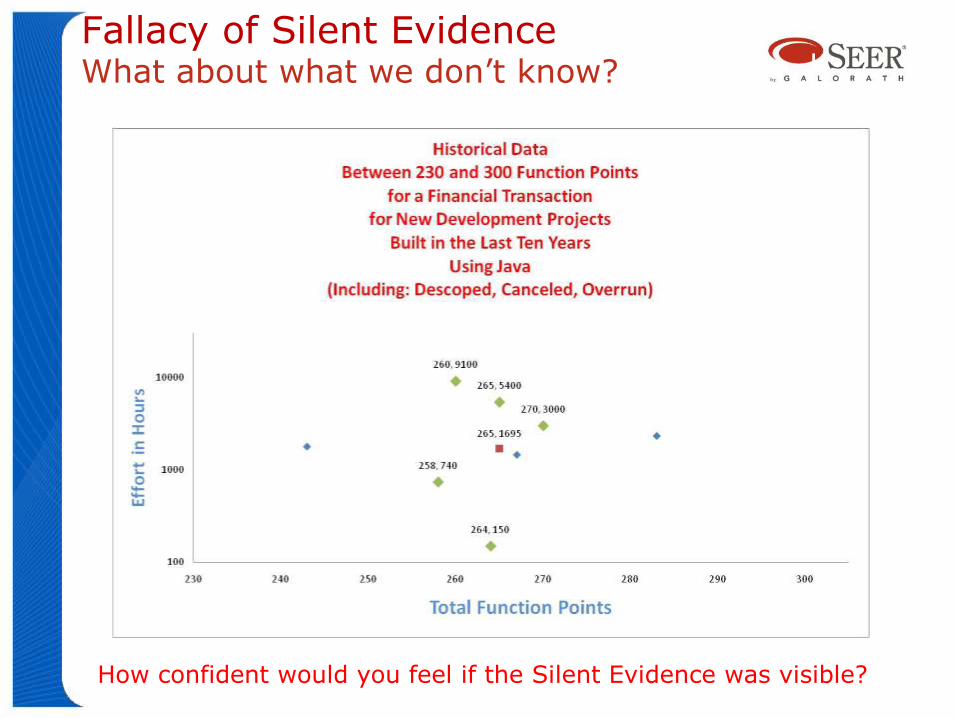
Fallacy of Silent EvidenceWhat about what we don’t know?
How confident would you feel if the Silent Evidence was visible?
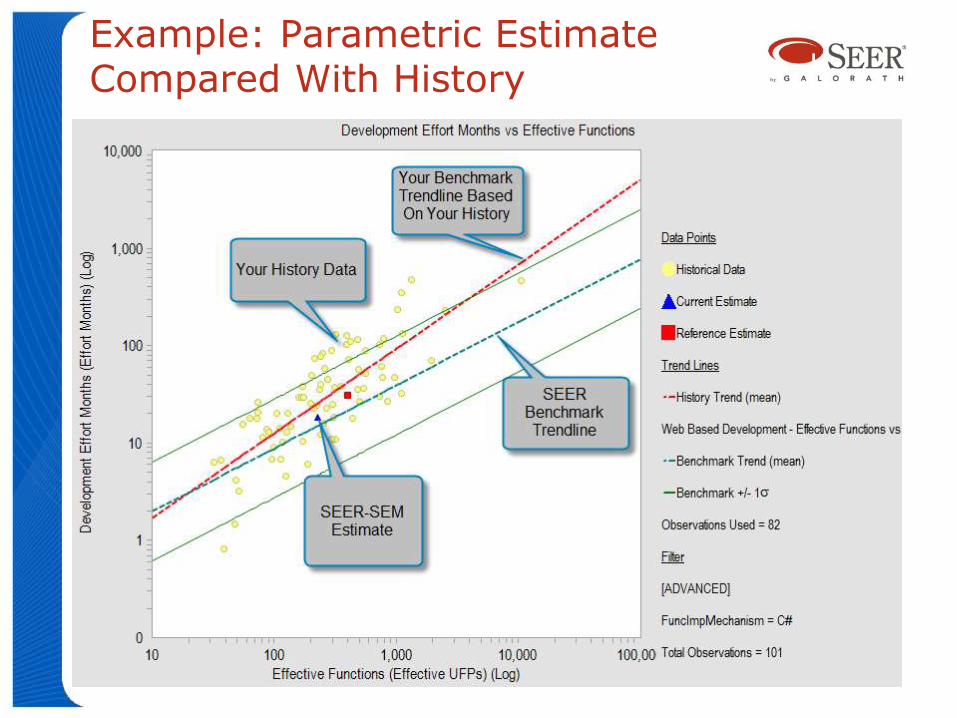
Example: Parametric Estimate Compared With History
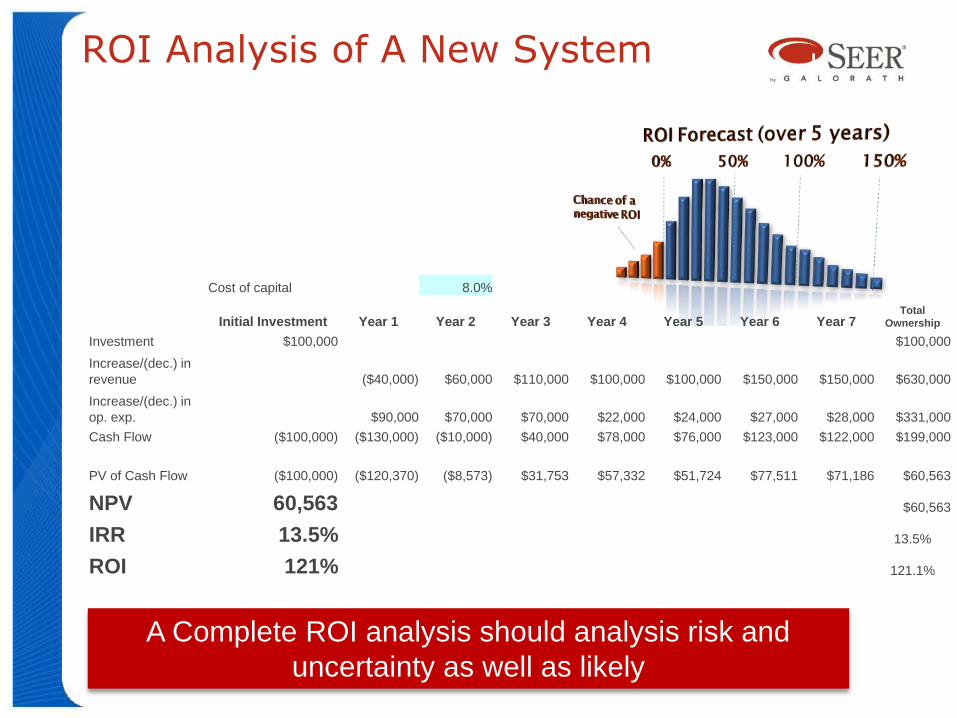
ROI Analysis of A New System
Cost of capital 8.0%
Initial Investment Year 1 Year 2 Year 3 Year 4 Year 5 Year 6 Year 7Total
Ownership
Investment $100,000 $100,000
Increase/(dec.) in
revenue ($40,000) $60,000 $110,000 $100,000 $100,000 $150,000 $150,000 $630,000
Increase/(dec.) in
op. exp. $90,000 $70,000 $70,000 $22,000 $24,000 $27,000 $28,000 $331,000
Cash Flow ($100,000) ($130,000) ($10,000) $40,000 $78,000 $76,000 $123,000 $122,000 $199,000
PV of Cash Flow ($100,000) ($120,370) ($8,573) $31,753 $57,332 $51,724 $77,511 $71,186 $60,563
NPV 60,563 $60,563
IRR 13.5% 13.5%
ROI 121% 121.1%
A Complete ROI analysis should analysis risk and
uncertainty as well as likely
0 4 8 12 16 20
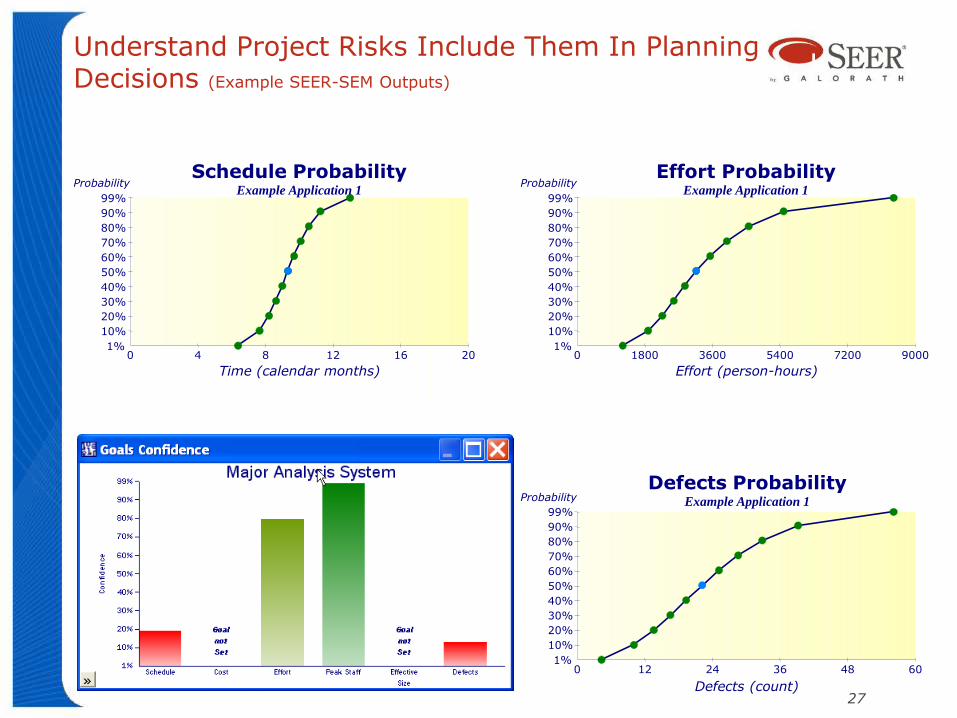
Schedule ProbabilityExample Application 1
Probability
Time (calendar months)
1%
10%
20%
30%
40%
50%
60%
70%
80%
90%
99%
Understand Project Risks Include Them In Planning Decisions (Example SEER-SEM Outputs)
0 1800 3600 5400 7200 9000
Effort (person-hours)
1%
10%
20%
30%
40%
50%
60%
70%
80%
90%
99%
Effort ProbabilityExample Application 1
Probability
0 12 24 36 48 60
Defects ProbabilityExample Application 1Probability
Defects (count)
1%
10%
20%
30%
40%
50%
60%
70%
80%
90%
99%
27
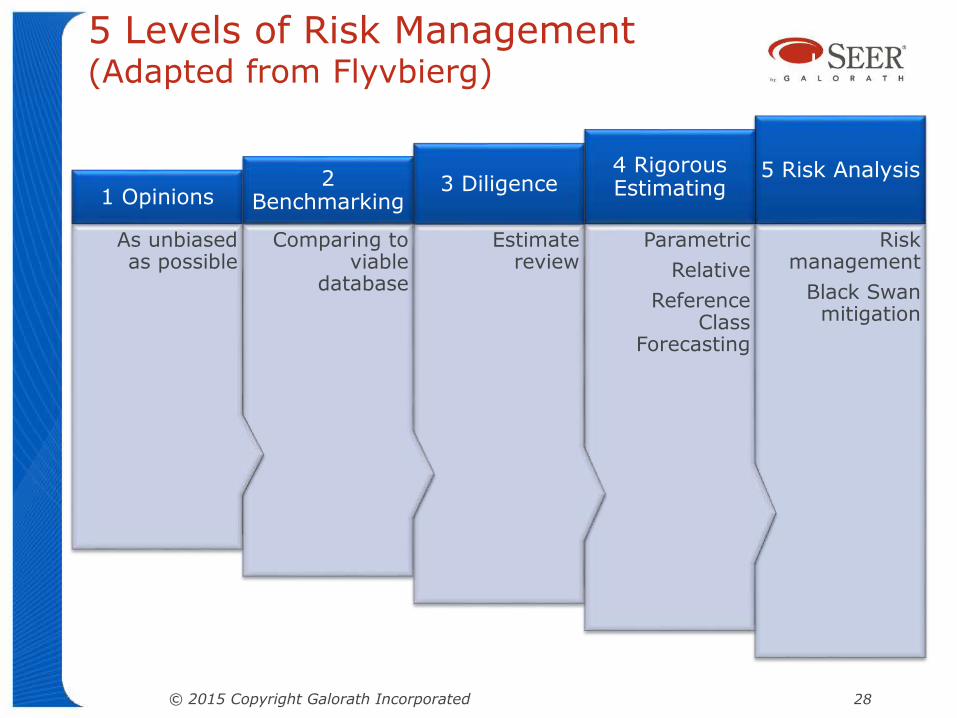
5 Levels of Risk Management (Adapted from Flyvbierg)
Risk management
Black Swan mitigation
5 Risk Analysis
Parametric
Relative
Reference Class
Forecasting
4 Rigorous Estimating
Estimate review
3 Diligence
Comparing to viable
database
2 Benchmarking
As unbiased as possible
1 Opinions
© 2015 Copyright Galorath Incorporated 28
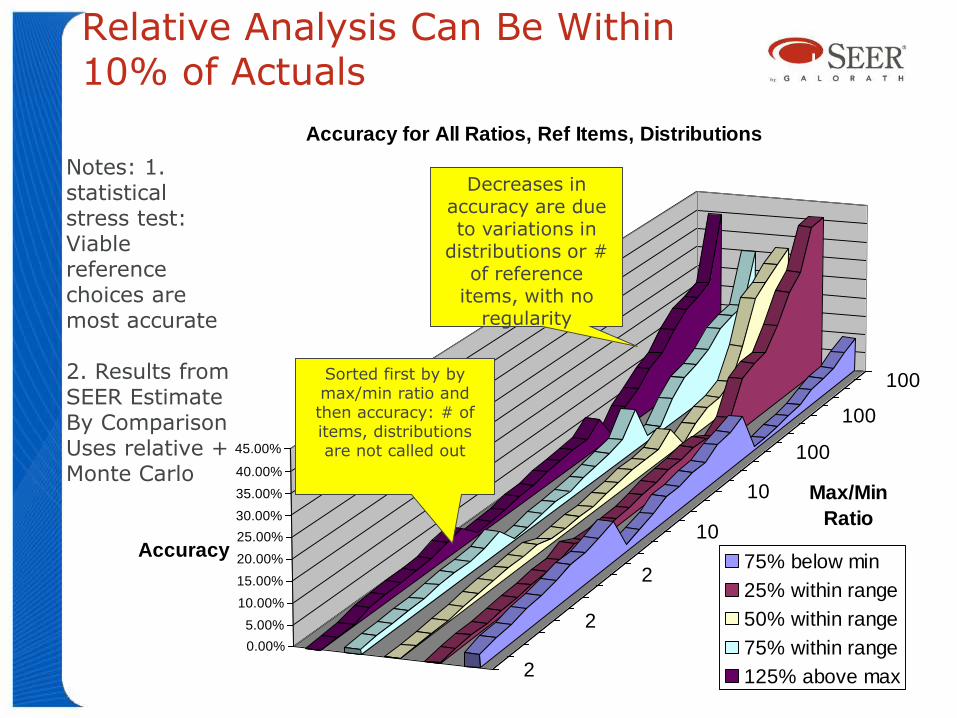
Relative Analysis Can Be Within 10% of Actuals
2
2
2
10
10
100
100
100
0.00%
5.00%
10.00%
15.00%
20.00%
25.00%
30.00%
35.00%
40.00%
45.00%
Accuracy
Max/Min
Ratio
Accuracy for All Ratios, Ref Items, Distributions
75% below min
25% within range
50% within range
75% within range
125% above max
Sorted first by bymax/min ratio and then accuracy: # of items, distributions are not called out
Decreases in accuracy are due to variations in
distributions or # of reference
items, with no regularity
Notes: 1. statistical stress test: Viable reference choices are most accurate
2. Results from SEER Estimate By ComparisonUses relative + Monte Carlo
Root Causes Of Bad Estimates In Agile Projects As An Example
• Team not really doing Agile
• Everyone seems to have their own “hybrid” which is code for management controls
• Immature process
• No one with previous experience, i.e.: no Scrum Master
• No training in the process being used
• Management gets in the way
• Micromanage the burn down chart
• Want to use velocity as productivity
• Assume Ideal Days = Capacity Days
• Bad Story Counting
• Trying to use counts across teams
• Using historical story point counts for new work
© 2012 Copyright Galorath Incorporated 30
Add In The Agile Bashing of Estimating For a Full View
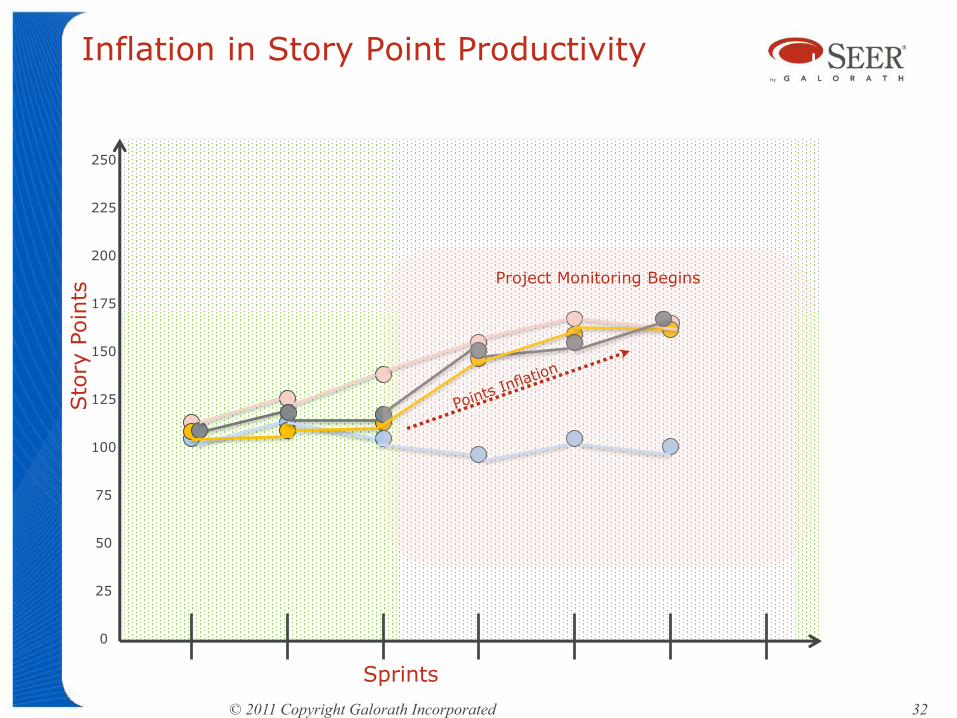
250
225
200
175
150
125
100
75
50
25
0
Sto
ry P
oin
ts
Sprints
Inflation in Story Point Productivity
© 2011 Copyright Galorath Incorporated 32
Project Monitoring Begins
5/12/
2015
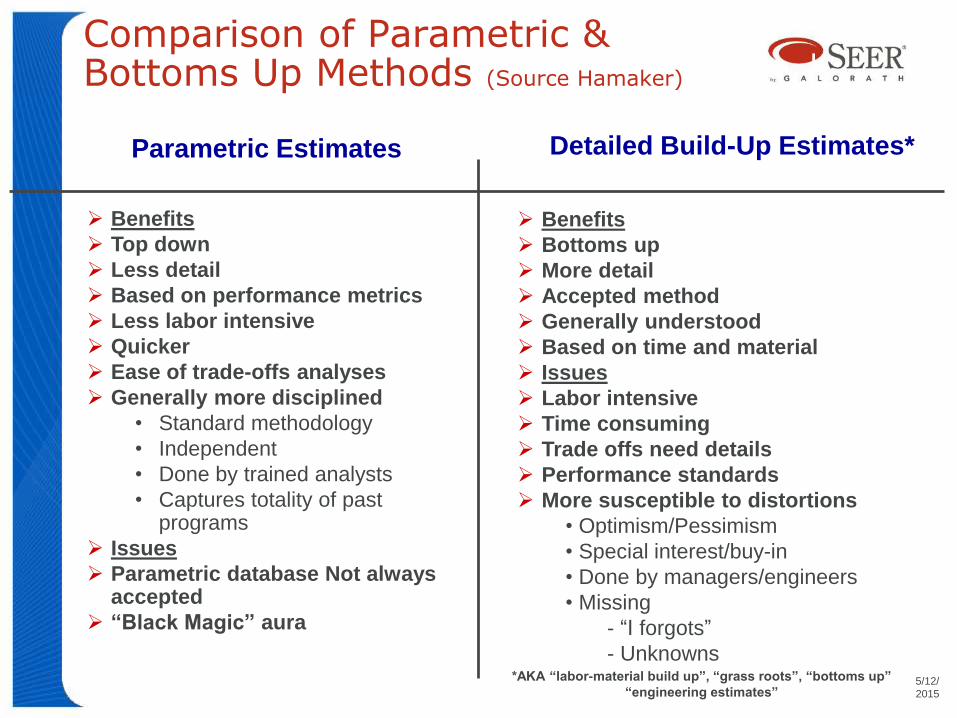
Comparison of Parametric & Bottoms Up Methods (Source Hamaker)
Parametric Estimates
Benefits
Top down
Less detail
Based on performance metrics
Less labor intensive
Quicker
Ease of trade-offs analyses
Generally more disciplined
• Standard methodology
• Independent
• Done by trained analysts
• Captures totality of past programs
Issues
Parametric database Not always accepted
“Black Magic” aura
Detailed Build-Up Estimates*
Benefits
Bottoms up
More detail
Accepted method
Generally understood
Based on time and material
Issues
Labor intensive
Time consuming
Trade offs need details
Performance standards
More susceptible to distortions
• Optimism/Pessimism
• Special interest/buy-in
• Done by managers/engineers
• Missing
- “I forgots”
- Unknowns*AKA “labor-material build up”, “grass roots”, “bottoms up”
“engineering estimates”
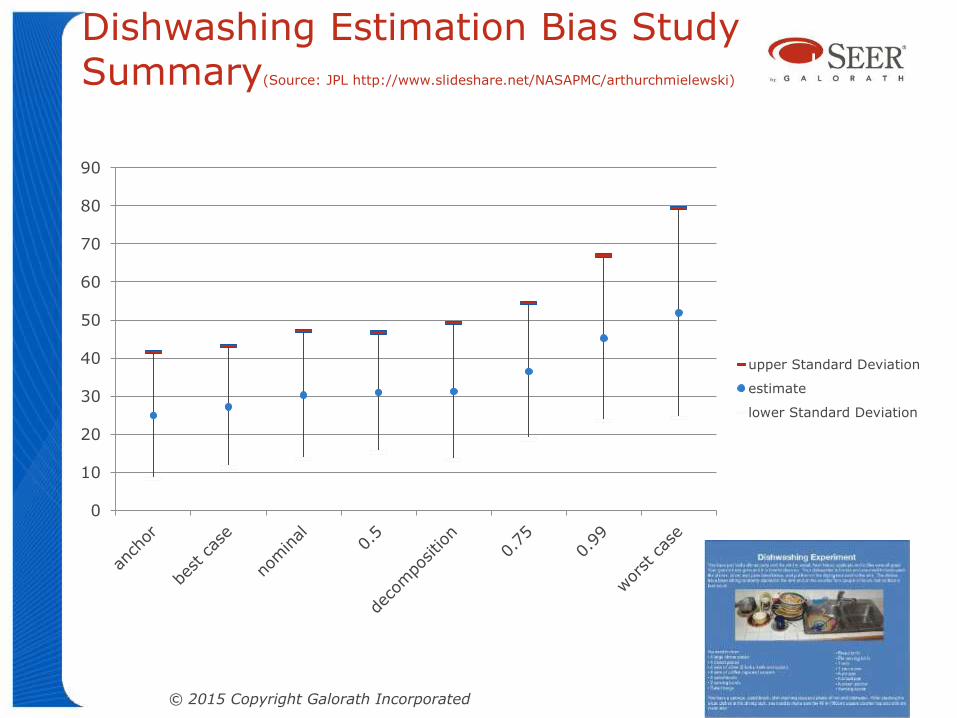
Dishwashing Estimation Bias Study Summary(Source: JPL http://www.slideshare.net/NASAPMC/arthurchmielewski)
© 2015 Copyright Galorath Incorporated 34
0
10
20
30
40
50
60
70
80
90
upper Standard Deviation
estimate
lower Standard Deviation
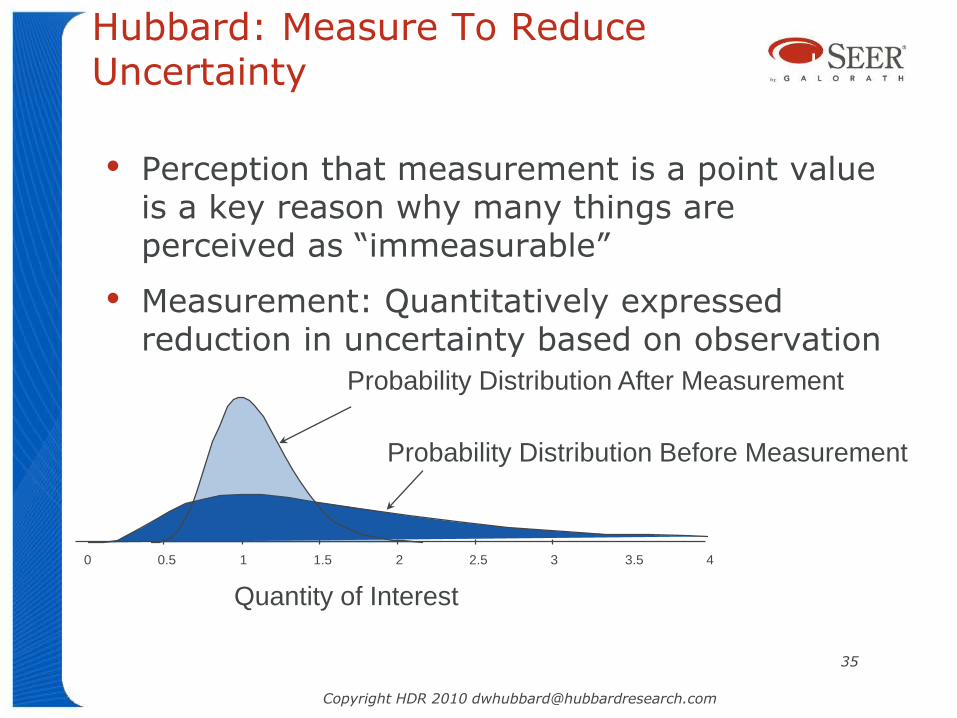
Hubbard: Measure To Reduce Uncertainty
• Perception that measurement is a point value is a key reason why many things are perceived as “immeasurable”
• Measurement: Quantitatively expressed reduction in uncertainty based on observation
Copyright HDR 2010 [email protected]
35
Quantity of Interest
0 0.5 1 1.5 2 2.5 3 3.5 4
Probability Distribution Before Measurement
Probability Distribution After Measurement
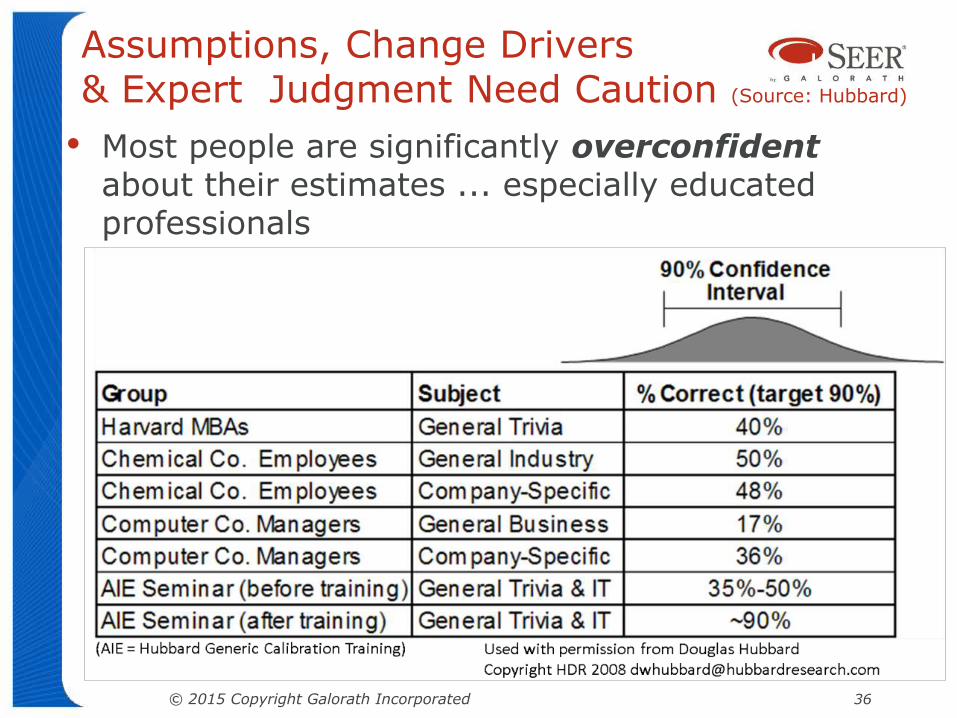
• Most people are significantly overconfident about their estimates ... especially educated professionals
Assumptions, Change Drivers & Expert Judgment Need Caution (Source: Hubbard)
© 2015 Copyright Galorath Incorporated 36
37
Gunning for Models (Adapted from Hubbard)
• Be careful of red herring arguments against models
• “We cannot model that…it is too complex.”
• “Models will have error and therefore we should not attempt it.”
• “We don’t have sufficient data to use for a model.”
• “It works but we cant see all data so we should not use it”
• Build on George E. P. Box: “Essentially, all models are wrong, but some are useful.”
• Some models are more useful than others
• Everyone uses a model – even if it is intuition or “common sense”
• So the question is not whether a model is “right” or whether to use a model at all
• Question is whether one model measurably outperforms another
• A proposed model (quantitative or otherwise) should be preferred if the error reduction compared to the current model (expert judgment, perhaps) is enough to justify the cost of the new model
Copyright HDR 2008 [email protected]

Key Points
Estimates can be better,
squelching bias & strategic mis-
estimation…Parametrics
help.
© 2015 Copyright Galorath Incorporated 38
Tempering with an
“outside view” can mitigate some bias
Without care estimates are usually biased (even with experts)