Embed Size (px)
Citation preview

Information Economics and Policy 25 (2013) 204–213
Contents lists available at SciVerse ScienceDirect
Information Economics and Policy
journal homepage: www.elsevier .com/locate / iep
Why adopt social enterprise software? Impacts and benefits
0167-6245/$ - see front matter � 2013 Elsevier B.V. All rights reserved.http://dx.doi.org/10.1016/j.infoecopol.2012.12.001
⇑ Corresponding author. Tel.: +49 (0) 621 1235 134; fax: +49 (0) 6211235 333.
E-mail addresses: [email protected] (B. Engelstätter), [email protected] (M. Sarbu).
Benjamin Engelstätter ⇑, Miruna SarbuCentre for European Economic Research (ZEW Mannheim), P.O. Box 103443, 68034 Mannheim, Germany
a r t i c l e i n f o
Article history:Available online 11 January 2013
JEL classification:D00L10O31
Keywords:Adoption of ICTSocial enterprise softwareNested innovationComplementarity
a b s t r a c t
This paper explores the performance impacts and benefits of the adoption of Social Enter-prise Software (SES). SES forms a nested innovation, given that its adoption requires analready established infrastructure of Information and Communication Technology. To con-trol for induced sample selection, we use a two-step estimation procedure. Based on Ger-man firm-level data our results confirm that firms which use business-to-business (B2B)e-commerce applications are more likely to adopt SES. The estimated correlations alsoprovide weak evidence for complementarity between B2B e-commerce and SES. We showthat two measures of firm performance, i.e. sales and labor productivity, are highest forfirms using SES and B2B e-commerce applications in conjunction.
� 2013 Elsevier B.V. All rights reserved.
1. Introduction
In recent years, social software, e.g. wikis, blogs,microblogs or social networks, has increasingly appearedin both public dialogues and press releases. Social softwareis already extensively used in private households andincreasingly adopted by firms. As for firms, more than80% of the top 100 companies in the Fortune 500 maintaina presence on social network sites (Gartner, 2012).However, currently a new type of business software isemerging, which interrelates recent social software andfirms’ established enterprise systems, e.g. Enterprise Re-source Planning (ERP), Supply Chain Management (SCM),Customer Relationship Management (CRM). This so calledSocial Enterprise Software (SES) links firms’ enterprisesoftware systems and social software applications as in,e.g., social CRM solutions.
Overall, SES offers benefits in the areas of business-to-customer (B2C) and business-to-business (B2B). For B2C,SES supports tracking data from customer surveys, cus-
tomer feedback, reviews or user profiles on social networksor blogs, thereby enabling firms to identify new customers,new market segments and observe recent trends. SES pack-ages additionally feature various communication channelsallowing for a two-way interaction between companiesand their customers, by offering them a direct channelfor providing their feedback. With specific customer datacollected and direct customer interaction SES might facili-tate the development of new products as it allows firms toobserve customer tastes and build up meaningful customerprofiles.
In the B2B segment benefits of SES emerge in form ofenhanced collaboration and communication as employeesand partners are connected in a way they can exchangeinformation fast and freely. Stakeholders have real-timeaccess to all areas they are interested in and can monitorand directly access interactions and inputs of others. SESfurther enhances process management and knowledgesourcing as knowledge consumers, like sales teams, can ac-cess information from knowledge providers, like productdevelopers, in real-time saving time for each employee.With partners and clients of the utilizing firm connected,the benefits of SES are not limited to the boundary of thefirm but may spread onto other business contacts.

B. Engelstätter, M. Sarbu / Information Economics and Policy 25 (2013) 204–213 205
Up to now there are no empirical studies on the emerg-ing phenomenon of SES although these software packagesbegan to come up in 2008 (Chess Media Group, 2010). Con-sequently, as SES is still an uncertain new technology in itsinfancy, empirical evidence about determinants of itsadoption and its potential impacts on firm performanceis still lacking. Also, up to now it is still unclear which dis-tribution segment, i.e. B2B or B2C, benefits the most onceSES is adopted.
We aim at filling this research gap by empirically eval-uating the determinants of SES adoption and exploring itsimpacts on firm performance. In the analysis, we distin-guish between benefits and impacts in the area of B2Band B2C. Our analysis is based on a unique database con-sisting of German manufacturing and service firms. SinceSES requires a firm to first adopt particular Informationand Communication Technology (ICT) before it can up-grade them to SES, it represents a so-called ‘‘nested inno-vation’’ (Greenstein and Prince, 2007). This ‘‘nested’’structure induces sample selection which has to be takenappropriately into account in the estimation procedure.
Our study adds to the empirical literature in a numberof ways. To our knowledge we are the first to explore theperformance impacts of most recent SES and investigatethe determinants of its adoption. Second, considering thatICT might act as complements (Aral et al., 2012) or evensubstitutes (Kretschmer et al., 2012) in their impact onperformance our results offer a weak test for complemen-tarity based on correlations between the usage of estab-lished ICTs, i.e. B2B e-commerce applications, and theadoption of most recent ICTs, i.e. SES. Third, our paper pre-sents a valid empirical method with which to model thedata generating process in the case of a ‘‘nested innova-tion’’, i.e. the probit with sample selection (Berinsky,2004; Gourieroux and Jasiak, 2007)
Our results show that firms using B2B e-commerceapplications are more likely to adopt SES. B2C e-commerceapplications fail to impact the adoption decision. The esti-mated correlations also provide weak evidence for comple-mentarity between B2B e-commerce applications and SES.Concerning impacts on firm performance, we show thatmean sales and labor productivity are highest for firmsusing SES and B2B e-commerce applications in conjunction.
The paper proceeds as follows: Section 2 summarizesthe empirical literature of ICT, its complementarities andperformance impacts and explains SES, its classificationas a ‘‘nested’’ ICT innovation and its benefits. Section 3 pre-sents the dataset whereas Section 4 highlights the empiri-cal model. Section 5 provides a detailed explanation of theselected exogenous variables and the necessary exclusionrestriction. The estimation results and additional robust-ness checks to clarify the validity of the results are pre-sented in Section 6. Finally, Section 7 concludes.
2. Background
2.1. Complementarities in and performance impacts ofinformation and communication technology
In general, ICT is expected to enable productivity andperformance gains by supporting the optimization of firms’
business processes (Brynjolfsson and Hitt, 2000). Such per-formance gains are often documented for ICT-intensivefirms (Brynjolfsson and Hitt, 2003). Thus, there is firm-level based evidence of performance impacts for manydifferent measures of ICT-intensity, e.g., the usage of B2Be-commerce applications (Bertschek et al., 2006), differententerprise software systems (Hitt et al., 2002; Shin, 2006;Aral et al., 2006) or broadband internet (Bertschek et al.,2013). As for the impact of ICTs on innovation as a crucialprerequisite for productivity gains (Hall et al., 2009),empirical analyses at the firm level usually report positiveand significant impacts (Gera and Gu, 2004; Hempell andZwick, 2008; Engelstätter, 2012; Engelstätter and Sarbu,in press). Still, the returns of ICT are not the same for allfirms as there are substantial variations shown acrossfirms (Brynjolfsson and Hitt, 1995). These variations aremost likely due to performance premiums which firmswith higher returns on ICT realize as they adopt comple-mentary organizational practices (Bresnahan et al., 2002;Caroli and Van Reenen, 2001; Aral and Weill, 2007; Bloomet al., 2008). However, not only organizational practicesmight complement ICTs in their impact on performance.Recent ICT applications might act as complements amongthemselves regarding their impact on firm performance(Aral et al., 2012) or even function as substitutes(Kretschmer et al., 2012).
Although expected, potential performance impacts ofrecent SES have not yet been explored at all. Offering ben-efits in the areas of B2C and B2B this new kind of businesssoftware might as well form complementary benefitsregarding its impact on firm performance with alreadyestablished B2C or B2B e-commerce software solutions.Therefore, we examine performance impacts, potentialcomplementarities with established e-commerce applica-tions and the determinants of SES adoption.
2.2. Social enterprise software: benefits, complementaritiesand impacts
In general, SES links and combines the firms’ estab-lished enterprise software systems with its social softwareapplications in use. Thereby, SES seems particularly usefulfor managing customer relations, e.g., a so-called socialCRM system can directly implement and exploit data andinformation from customer surveys, commentaries, re-views or user profiles on social networks or blogs. If thesedata are processed via SES, the utilizing firm can monitorrecent trends and customer demands quickly, helping withthe elaboration of sales forecasts, market developmentexpectations or the development of new products.Appropriate targeting of customers based on their inter-ests, so-called hyper-targeting (Shih, 2010), also becomesfeasible. SES systems can add value back to the customeras they offer different channels like email, several instantmessaging or chat applications for him to interact withthe firm. Direct customer feedback on their ideas, wants,and needs may also contribute to the development ofnew or improved products and services or the observationof new trends and purchase intentions (Gartner, 2012). Inaddition, the established two-way interaction betweenthe customer and the firm via SES might allow engaging

206 B. Engelstätter, M. Sarbu / Information Economics and Policy 25 (2013) 204–213
with non-traditional industry influencers like bloggers,independent analysts and customers passionate aboutbrands (Chess Media Group, 2010) resulting in a positiveattitude of the firm’s products potentially attracting morecustomers. However, communication channels like blog-ging or profile pages in social networks also provide plat-forms for visible critique or customer displeasure.Accordingly, if firms do not attend and manage the directcontact to the customer properly, open communicationmay end up in a social media disaster which could severelydamage the brand as experienced by, e.g., South West Air-lines (McCarthy, 2010a) or Nestle (McCarthy, 2010b).
Overall, not only firms focused on private customerswill benefit from the adoption of SES, as utilizing firms willalso receive benefits in collaboration, communication,knowledge sourcing, innovation, social linkages or processmanagement (blueKiwi, 2011). Collaboration and commu-nication are particularly enhanced, given that employeesand partners are connected so that they can exchangeinformation in real-time with no boundaries through thecloud. With applications like, e.g., many-to-many commu-nication, task management, idea sharing or document co-creation continued engagement of contributing individualsis assured, especially as stakeholders can see and directlyaccess interactions and inputs of others. As for knowledgesourcing and process management, SES enhances both asknowledge consumers, e.g. a sales team, can access infor-mation from knowledge providers, e.g. product experts,rapidly and in real-time which saves time for each employ-ee resulting in more efficient processes (blueKiwi, 2011).Because partners and clients of the utilizing firm are alsoconnected, these benefits are not limited to the boundariesof the firm but may spread out to other business contacts,thereby greatly enhancing B2B effectiveness. As everystakeholder, may it be a complete team or an individual,can access each discussion he takes interest in at any time,appropriate experts on each topic will meet, and therebymost likely germinate ideas, fostering process or evenproduct innovations.
In sum, SES is not necessarily bounded to facilitate andenhance the area of B2C, but also enables numerousimprovements in the B2B segment of firms. Given its ben-efits in B2C and B2B, one can expect that firms will exhibitcomplementary benefits once they add SES to their B2B orB2C e-commerce solutions. However, it remains unclearnowadays which segment benefits the most if firms adoptSES. Nevertheless, there is first evidence that potentialbenefits of SES seem to be more interesting for B2B as upto today 15% of companies engaged in B2B e-commercealready implemented SES (Gartner, 2012). This number isexpected to grow up to 70% by 2014 (Gartner, 2012). Inour analysis, we identify complementarities of SES and aparticular e-commerce solution as we explore if eitherestablished B2B or B2C e-commerce applications drivethe adoption decision.
Even though SES applications are expected to benefitfirms in various areas, no empirical studies have yet estab-lished whether these benefits translate into increased firmperformance, e.g. increased sales or productivity. Mostlikely, with SES being a very recent technology just on itsway to embark on the diffusion process, this research gap
is due to lacking data availability. Given our data, we areunable to present an all-embracing final analysis of theperformance impacts of SES over time. However, as ourdata features the firms’ sales and labor productivity as con-temporaneous performance measures we start filling thisresearch gap by offering first descriptive and correlationbased evidence.
2.3. The process of adopting social enterprise software
A firm can implement SES in two ways, by either linkingits enterprise and social software already in use with theappropriate SES upgrade or via installing a full SES solutionproviding the complete software without prior experiencewith enterprise or social software. Chronologically, thepossibility of linking both applications via the appropriatesoftware upgrade occurred first. Installing a complete solu-tion was offered later for firms starting out completely newin the adoption of ICT infrastructure or for firms wanting tochange their service provider or vendor. With upgrades,enterprise and social software must already exist beforeSES can be used making SES a ‘‘nested innovation’’. With‘‘nested innovations’’, one ought primarily adopt a prere-quisite tool, e.g. a personal computer, and build the moreadvanced tool, e.g. internet usage, upon the existing infra-structure (Greenstein and Prince, 2007). As explained inSection 4, we model this nested structure empirically usinga Heckman (1979) selection model.
Although potentially profitable, the adopting firm bearssome costs of enhancing its current ICT infrastructure withSES. In general, costs occur per user making it possibleeven for smaller firms to adopt SES. Heck (2009) providesan overview of pricing schemes and cost levels of someSES providers. However, researchers still have to have thecosts in mind when focusing on the adoption of SES andshould adequately control for each firm’s ICT budgetsituation.
3. Description of data
The dataset used in this study stems from two com-puter-aided telephone surveys conducted in 2007 and2010 by the Centre for European Economic Research(ZEW). These ZEW ICT surveys lay a specific focus on thediffusion and use of ICT in German companies. In addition,the surveys contain detailed information about the firms’economic characteristics and performance, e.g. qualifica-tion or age structure of the workforce, competitiveenvironment, innovation performance, exports and e-com-merce. Usually, the interviewee was the chief executiveofficer of the firm, but he could also decide to pass onquestions to a corresponding employee, e.g., the head ofthe ICT department. Each wave of this dataset originallycontains information of about 4400 firms with five or moreemployees, representatively chosen from service andmanufacturing sectors in Germany.
The ZEW ICT surveys are organized as a panel dataset.However, as the question on the usage of SES was first in-cluded in the survey in 2010, a panel data analysis cannotbe provided in this paper. Thus, we employ a cross-section

Fig. 1. Usage of software applications. Source: ZEW ICT survey 2010, own calculations, 1523 observations, descriptive statistics
B. Engelstätter, M. Sarbu / Information Economics and Policy 25 (2013) 204–213 207
which consists of a combination of the survey wavesconducted in 2007 and 2010 for inference. Combiningthese two surveys is necessary as we need a well-definedtemporal sequence between the usage of SES and appropri-ate prior experience. We explain the selection of thesevariables in detail in Section 5.
For this study, we construct a dummy variable measur-ing the adoption of SES which takes the value one if a firmestablishes a link between its enterprise systems in useand its employed social software applications in the year2010 and zero otherwise. This dummy variable representsthe dependent variable in our analysis. The questionnairewas structured in a way that only firms who already haveestablished social software and enterprise software wereasked if they link both software types. Accordingly, we pre-sume that the firms adopt SES in the form of an upgrade oftheir existing software infrastructure and not as a com-pletely new solution. This assumption is strengthened as92% of the firms that reported using enterprise softwarein 2010 had already used enterprise software in 2007. Ifthese firms adopt SES they most likely use the appropriateupgrade.
In order to analyze the adoption of SES, we built threedummy variables for the usage of social software applica-tions, the usage of enterprise software systems and theusage of both social software and enterprise software inthe year 2010. The dummy variable representing the useof social software applications takes the value one if atleast one social software application such as a blog, wiki,social network, collaboration platform, podcast, RSS-feedor tagging is used in the year 2010. Fig. 1 shows that atleast one social software application is employed by about40% of the firms. The dummy variable for the usage ofenterprise software systems, on the other hand, takes thevalue one if a firm uses at least one of the enterprisesoftware systems ERP, CRM or SCM and zero otherwise.Nearly 80% of the firms use at least one of the mentioned
1 Overall, a share of 80% of the surveyed firms using enterprise softwareseems quite high. However, one has to keep in mind that enterprisesoftware is available for more than 30 years now resulting in a vastreduction of complexity and making recent applications useful even forsmaller firms. Also, there are nowadays cheap applications available likeopen source or freeware solutions and software as service applications inthe cloud. Hence, even small firms with a restricted budget can adoptenterprise software.
enterprise software applications, see Fig. 1.1 Furthermore,about one third of the firms employ both social softwareand enterprise software applications. SES is adopted byabout 22% of all firms.2
4. Analytical framework and estimation procedure
As our dataset only contains firms suspected to upgradetheir existing ICT infrastructure to SES we face sampleselection in our analysis. First, firms have to decide aboutusing both social software and enterprise software applica-tions. In a second step firms then decide to link both soft-ware types, i.e. upgrading them to SES. This ‘‘nestedinnovation’’ structure with one prerequisite innovationneeded to be adopted before the next innovation can beused results in a two stage decision process. We model thisstructure adequately as we employ the Heckman selectionmodel (Heckman, 1979) for inference in our empiricalanalysis. The first part of the decision process is modeledby the selection equation
ES�i ¼ Xib1 þ IDib2 þ Zib3 þ ei ESi ¼ 1 if ES�i� 0; ESi ¼ 0 otherwise ð1Þ
with ES�i being a latent variable reflecting the use of bothsocial software applications and enterprise software forfirm i. Both types of software applications are used by firmi but not linked with each other at this point in time. Xi
contains firm characteristics expected to influence thedecision of firm i to use social software and enterprise soft-ware, e.g. lagged innovation activity, firm size, characteris-tics of the workforce or ICT intensity. IDi includes commoncontrol dummies for business sector and East Germany.Zi reflects the necessary exclusion restriction needed toidentify the model. We assume a standard identically andindependently distributed error term.
As the selection Eq. (1) shows which firm characteristicsfoster the unlinked use of social software applications andenterprise software, the next consecutive step will be toexplain the firms’ decision to link both software types via
2 Given these adoption rates we cannot exclude the possibility that ouranalysis only features early adopters with SES being widely diffused andperhaps used by nearly every firm in several years.
208 B. Engelstätter, M. Sarbu / Information Economics and Policy 25 (2013) 204–213
SES. We model the second part of the decision processbeing the outcome equation as
SES�i ¼ Xic1 þ IDic2 þ ui SESi ¼ 1 if SES�i � 0; SESi
¼ 0 otherwise ð2Þ
where SES�i is the unobserved latent variable accounting forthe usage of social enterprise software for firm i. In the out-come equation, we use the same explanatory variables Xi
as in the selection equation without the mentioned exclu-sion restriction. ui is again a standard identically and inde-pendently distributed error term.
Eqs. (1) and (2) are estimated via maximum likelihood.As ESi and SESi are both variables reflecting a binary choicewe use a probit with sample selection (Berinsky, 2004;Gourieroux and Jasiak, 2007), the so called heck-probit, asestimation procedure for the Heckman selection model.The probit structure of our employed model also providesa test for complementarity based on its observed correla-tions (Aral et al., 2012). The employed explanatory variablesas well as the exclusion restriction and their temporalsequence are explained in detail in the following section.
5. Selection of exogenous variables and exclusionrestriction
In exploring if firms perceive more benefits of SES in theB2B or the B2C segment our main explanatory variables forexplaining the adoption of SES are the usage of B2B or B2Ce-commerce practices. We measure the usage of either B2Bor B2C by two dummy variables, each one taking the valueone if a firm adopted the appropriate e-commerce practicein the year 2007. However, the first SES solutions wereavailable in 2008 (Chess Media Group, 2010). Before thatenterprise and social software were only obtainableseparately. The adoption of e-commerce practices in 2007occurred before SES adoption was possible thereby provid-ing a clear temporal relation between our two e-commerceexplanatory variables and SES. We elaborate more on theupcoming of social software and SES as we explain ourexclusion restriction at the end of this section.
The adoption of SES will most likely not only be deter-mined by adopted e-commerce practices. Therefore, weadd a number of additional control variables to ouranalysis. As SES fosters innovation activity due to enhancedcommunication and information handling, already innova-tive firms may install SES to further increase their innova-tion performance. Overall, SES can also be interpreted as aprocess innovation itself based on its provided knowledgesourcing and process management capabilities. Thus, firmsalready successful in realizing process innovations mightengage more likely in SES experiencing the ‘‘success breedssuccess’’ phenomenon (Flaig and Stadler, 1994) with suc-cessful innovations yielding more innovations in the future.In our analysis, we control for success in innovations inform of two dummy variables. Each dummy variable takesthe value one if a firm realized at least either one product orprocess innovation during 2007–2009 and zero if no inno-vation was realized. We feature both types of innovationsas controls in our analysis as product innovations and pro-cess innovations are often interrelated (Hall et al., 2009).
We control for typical firm characteristics expected todrive the adoption of a new technology like, e.g., firm size(Bertschek and Frynges, 2002). However, with SES being arather new technology, its adoption and usefulness mightalso depend on the availability of appropriate human cap-ital (Lo and Sutthiphisal, 2010) or a younger workforce(Meyer, 2010). We measure firm size by the logarithm ofthe number of employees in the year 2009. As for the avail-ability of human capital, we consider the qualificationstructure of the workforce by creating three control vari-ables: the share of highly qualified (holding a universityor university of applied science degree), medium qualified(technical college or vocational qualification) and lowqualified (other) employees measured in the year 2009.The share of low qualified employees is taken as the refer-ence category. Additionally, we control for the age struc-ture of the work force with three different variables. Thefirst one represents the share of employees younger than30 years, the second one the share of employees between30 and 50 years (reference category) and the third onethe share of employees over 50 years. The age structureof employees refers to the year 2009.
Aghion et al. (2002) stress the impact of the competitiveenvironment on the incentives to adopt innovations. Asadopting SES could also be interpreted as a process innova-tion itself we additionally control for competitive pressurein our analysis. We employ three dummy variables captur-ing the number of main competitors in the year 2009according to the firms’ self-assessment as additional con-trols. The first variable indicates 0–5 competitors, the sec-ond one 6–50 competitors (reference category) and the lastone more than 50 competitors. We also control for interna-tional competition and trade activity as a driver of technol-ogy adoption (Bertschek, 1995). We measure the tradeactivity of firms by a dummy variable that takes the valueone if the firms exported or imported goods or servicesduring the year 2009.
We also include some general controls that might affectthe adoption of SES, e.g., ICT budget constraints or businesssector classification. Since the adoption of SES might in-duce substantial costs the firm has to bear, we control forthe firms’ ICT budget by taking the expenditures for ICT(components plus staff) per employee in the year 2009 intoaccount in our analysis. Another part of the firms’ ICT bud-get is captured in ICT outsourcing measured as the share ofICT expenditures allotted to external service providers dur-ing the year 2009. We employ the logarithm of the expen-diture measures to make this measure comparable to thenumber of employees measure. We also capture an addi-tional workforce characteristic common for German firmsin the general controls, i.e. the establishment of a workscouncil. Such a council enables employees to participatein the decision making (Zwick, 2003), for example, thedecision to adopt huge sophisticated software applicationsand presents a proxy for firm strategy and aims. In addi-tion, we use dummy variables to control for 17 businesssector specific effects. A dummy variable for East Germanyaccounts for potential regional differences.
An appropriate exclusion restriction requires an explan-atory variable which is highly correlated with the selectionvariable but is not correlated to SES adoption. The

Table 2Distribution of industries. Source: ZEW ICT survey 2007, 2010 and owncalculations.
Industry Observations Percentage
ManufacturingElectrical engineering 172 11.29Consumer goods 129 8.47Metal and machine construction 103 6.76Precision instruments 93 6.11Other raw materials 89 5.84Chemical industry 73 4.79Automobile 68 4.46
ServicesComputer and telecommunication
services140 9.19
Media services 118 7.75Transportation and postal services 117 7.68Technical services 95 6.24Wholesale trade 93 6.11Retail trade 79 5.19Management consulting and
advertising42 2.76
Banks and insurances 39 2.56Real estate and leasing services 37 2.43Services for enterprises 36 2.36Sum 1523 100
B. Engelstätter, M. Sarbu / Information Economics and Policy 25 (2013) 204–213 209
exclusion restriction we use is ICT training measured as theshare of employees who received specific ICT-related train-ing in the year 2006. We expect this exclusion restriction tobe correlated with the common use of social software andenterprise software but showing no correlation with thelinkage of both software types. Firms engaging in ICT train-ing in the year 2006 might do so to get first insights into theuse of social software applications and possibly prepare theuse of these software applications at a later point in time.Social software applications were a new technology in theyear 2006, especially for private users, and not yet broadlyadopted by firms. Thus, ICT training would have been nec-essary for firms’ adoption of social software applications.Firms’ adoption of new enterprise software systems usuallyalso requires ICT training as these systems are sophisticatedand it is hardly possible to adopt and use them properlywithout appropriate training. SES applications, however,arose in 2008 for the first time (Chess Media Group,2010). Accordingly, we can discard the possibility that SESmay be part of the ICT training measures conducted bythe firms in 2006. This timing argument allows us to con-clude that our ICT training measure is not correlated tothe adoption decision and represents a suitable exclusionrestriction in our empirical setup.
For an overview, Table 1 presents the summary statis-tics for all variables, including endogenous and exogenousvariables as well as the exclusion restriction. We also in-clude the firms’ sales and labor productivity of 2009 asmentioned in Section 2 in Table 1. Table 2 pictures all 17industry sectors our data stems from.
Table 1Summary statistics. Source: ZEW ICT survey 2007, 2010 and own calculations.
Variable Mean
SES adoption 0.216Enterprise software usage 0.794Social software usage 0.409Usage of both social software and enterprise software 0.369Number of employees 245.71Log (number of employees) 3.701Share of highly qualified employees 0.247Share of medium qualified employees 0.596Share of low qualified employees 0.105Share of employees younger than 30 years 0.216Share of employees between 30 and 50 years 0.554Share of employees older than 50 years 0.230B2B e-commerce 0.556B2C e-commerce 0.2660–5 Competitors 0.4316–50 Competitors 0.311More than 50 competitors 0.257Trade activity 0.600Prior product innovation 0.557Prior process innovation 0.632ICT outsourcing 0.358ICT expenditures per employeea 629.06Log (ICT expenditures per employee) 0.919Works council 0.302East Germany 0.328ICT training 2006 0.140Salesb 86.13Labor productivityc 0.273
a In € 1000.b In € 1,000,000.c Sales per employee in €1,000,000.
6. Results
6.1. Main results
Table 3 contains our main estimation results for theselection Eq. (1) and the outcome Eq. (2) in two different
Min. Max. N
0 1 15230 1 15160 1 14580 1 15211 45,000 15230 10.714 15230 1 14080 1 14060 1 14130 1 14150 1 14200 1 14250 1 15140 1 15150 1 15230 1 15230 1 15230 1 15180 1 15050 1 15100 1 11830.004 300,000 1195�5.480 12.611 11950 1 15170 1 15230 1 14580.030 15,000 11610.012 13.333 1161
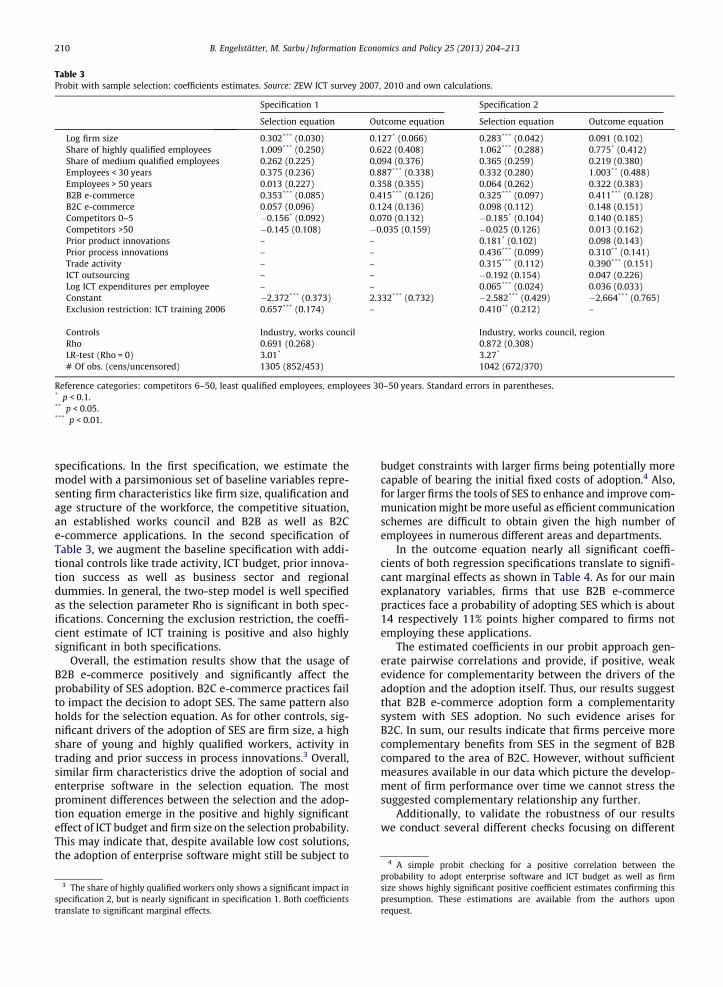
Table 3Probit with sample selection: coefficients estimates. Source: ZEW ICT survey 2007, 2010 and own calculations.
Specification 1 Specification 2
Selection equation Outcome equation Selection equation Outcome equation
Log firm size 0.302*** (0.030) 0.127* (0.066) 0.283*** (0.042) 0.091 (0.102)Share of highly qualified employees 1.009*** (0.250) 0.622 (0.408) 1.062*** (0.288) 0.775* (0.412)Share of medium qualified employees 0.262 (0.225) 0.094 (0.376) 0.365 (0.259) 0.219 (0.380)Employees < 30 years 0.375 (0.236) 0.887*** (0.338) 0.332 (0.280) 1.003** (0.488)Employees > 50 years 0.013 (0.227) 0.358 (0.355) 0.064 (0.262) 0.322 (0.383)B2B e-commerce 0.353*** (0.085) 0.415*** (0.126) 0.325*** (0.097) 0.411*** (0.128)B2C e-commerce 0.057 (0.096) 0.124 (0.136) 0.098 (0.112) 0.148 (0.151)Competitors 0–5 �0.156* (0.092) 0.070 (0.132) �0.185* (0.104) 0.140 (0.185)Competitors >50 �0.145 (0.108) �0.035 (0.159) �0.025 (0.126) 0.013 (0.162)Prior product innovations – – 0.181* (0.102) 0.098 (0.143)Prior process innovations – – 0.436*** (0.099) 0.310** (0.141)Trade activity – – 0.315*** (0.112) 0.390*** (0.151)ICT outsourcing – – �0.192 (0.154) 0.047 (0.226)Log ICT expenditures per employee – – 0.065*** (0.024) 0.036 (0.033)Constant �2.372*** (0.373) 2.332*** (0.732) �2.582*** (0.429) �2.664*** (0.765)Exclusion restriction: ICT training 2006 0.657*** (0.174) – 0.410** (0.212) –
Controls Industry, works council Industry, works council, regionRho 0.691 (0.268) 0.872 (0.308)LR-test (Rho = 0) 3.01* 3.27*
# Of obs. (cens/uncensored) 1305 (852/453) 1042 (672/370)
Reference categories: competitors 6–50, least qualified employees, employees 30–50 years. Standard errors in parentheses.* p < 0.1.** p < 0.05.*** p < 0.01.
4
210 B. Engelstätter, M. Sarbu / Information Economics and Policy 25 (2013) 204–213
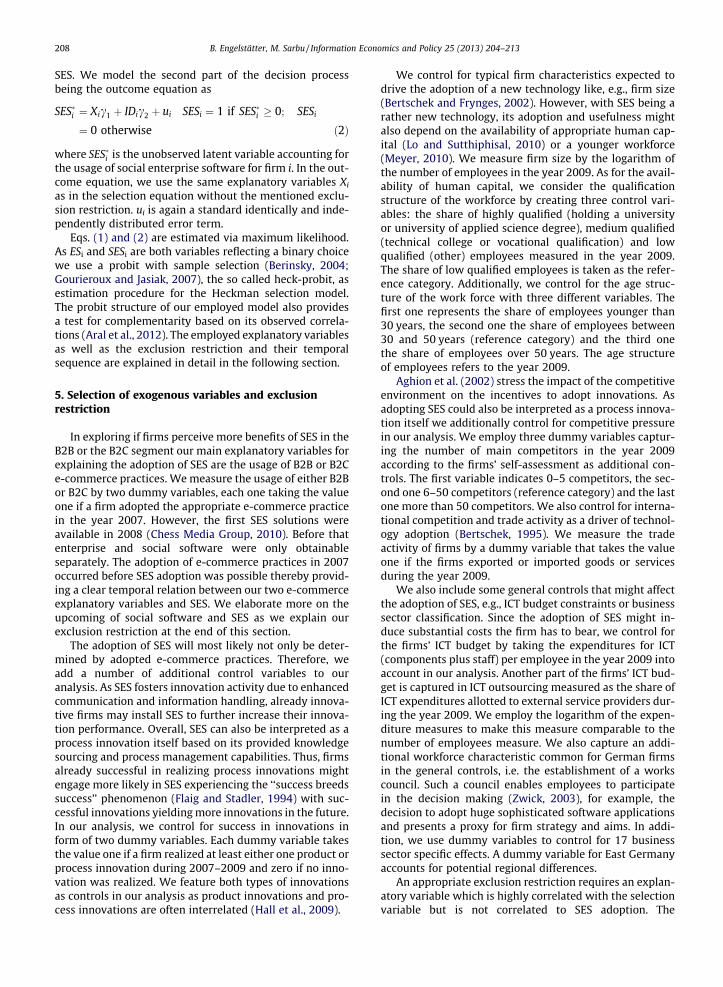
specifications. In the first specification, we estimate themodel with a parsimonious set of baseline variables repre-senting firm characteristics like firm size, qualification andage structure of the workforce, the competitive situation,an established works council and B2B as well as B2Ce-commerce applications. In the second specification ofTable 3, we augment the baseline specification with addi-tional controls like trade activity, ICT budget, prior innova-tion success as well as business sector and regionaldummies. In general, the two-step model is well specifiedas the selection parameter Rho is significant in both spec-ifications. Concerning the exclusion restriction, the coeffi-cient estimate of ICT training is positive and also highlysignificant in both specifications.
Overall, the estimation results show that the usage ofB2B e-commerce positively and significantly affect theprobability of SES adoption. B2C e-commerce practices failto impact the decision to adopt SES. The same pattern alsoholds for the selection equation. As for other controls, sig-nificant drivers of the adoption of SES are firm size, a highshare of young and highly qualified workers, activity intrading and prior success in process innovations.3 Overall,similar firm characteristics drive the adoption of social andenterprise software in the selection equation. The mostprominent differences between the selection and the adop-tion equation emerge in the positive and highly significanteffect of ICT budget and firm size on the selection probability.This may indicate that, despite available low cost solutions,the adoption of enterprise software might still be subject to
3 The share of highly qualified workers only shows a significant impact inspecification 2, but is nearly significant in specification 1. Both coefficientstranslate to significant marginal effects.
budget constraints with larger firms being potentially morecapable of bearing the initial fixed costs of adoption.4 Also,for larger firms the tools of SES to enhance and improve com-munication might be more useful as efficient communicationschemes are difficult to obtain given the high number ofemployees in numerous different areas and departments.
In the outcome equation nearly all significant coeffi-cients of both regression specifications translate to signifi-cant marginal effects as shown in Table 4. As for our mainexplanatory variables, firms that use B2B e-commercepractices face a probability of adopting SES which is about14 respectively 11% points higher compared to firms notemploying these applications.
The estimated coefficients in our probit approach gen-erate pairwise correlations and provide, if positive, weakevidence for complementarity between the drivers of theadoption and the adoption itself. Thus, our results suggestthat B2B e-commerce adoption form a complementaritysystem with SES adoption. No such evidence arises forB2C. In sum, our results indicate that firms perceive morecomplementary benefits from SES in the segment of B2Bcompared to the area of B2C. However, without sufficientmeasures available in our data which picture the develop-ment of firm performance over time we cannot stress thesuggested complementary relationship any further.
Additionally, to validate the robustness of our resultswe conduct several different checks focusing on different
A simple probit checking for a positive correlation between theprobability to adopt enterprise software and ICT budget as well as firmsize shows highly significant positive coefficient estimates confirming thispresumption. These estimations are available from the authors uponrequest.

Table 4Probit with sample selection: average marginal effects. Source: ZEW ICTsurvey 2007, 2010 and own calculations.
(1) (2)
Dependent variable: dummy for social enterprise software (outcomeequation)
Log firm size 0.043*** (0.016) 0.025 (0.022)Highly qualified
employees0.210* (0.125) 0.216** (0.104)
Medium qualifiedemployees
0.032 (0.126) 0.061 (0.103)
Employees < 30 0.299** (0.138) 0.280 (0.201)Employees > 50 0.121 (0.128) 0.090 (0.119)B2B e-commerce 0.138*** (0.043) 0.112** (0.049)B2C e-commerce 0.042 (0.049) 0.043 (0.050)Competitors 0–5 0.024 (0.046) 0.039 (0.061)Competitors > 50 �0.012 (0.053) 0.004 (0.046)Prior product innovation 0.027 (0.037)Prior process innovation 0.084** (0.036)Trade activity 0.105* (0.055)ICT outsourcing 0.013 (0.065)Log ICT expenditures per
employee0.010 (0.008)
Controls Industry, workscouncil
Industry, workscouncil, region
Observations 1305 1042
Reference categories: competitors 6–50, least qualified employees,employees 30–50 years. Standard errors in parentheses.* p < 0.1.** p < 0.05.*** p < 0.01.
Table 5Impacts of SES – correlations and descriptive evidence. Source: ZEW ICTsurvey 2007, 2010 and own calculations.
Mean ofsalesa
Mean of laborproductivityb
Correlationc
to sales
SES in general 253.46 0.289 0.135***
SES and B2B e-commerce usage
369.46 0.301 0.144***
SES and B2C e-commerce usage
202.51 0.206 0.020
a In €1,000,000.b Sales per employee in €1,000,000.c Pairwise correlation coefficient.
*** p < 0.01.
B. Engelstätter, M. Sarbu / Information Economics and Policy 25 (2013) 204–213 211
estimation techniques.5 We estimate both specificationsusing the classical two-stage heckman selection model. Asexpected, the results remain qualitatively similar with onlymarginal changes in coefficients and standard errors. Ignor-ing a possible selection, we also estimate a simple probitmodel to explain SES adoption and take only those firms intoaccount that use both enterprise software and social soft-ware. Overall, the results remain mostly the same comparedto the heck-probit although the coefficients are less pre-cisely estimated. Using B2B e-commerce applications stillforms a highly significant driver of SES adoption. However,some coefficients that are based on a lower significance levelin our main estimation, especially prior process innovationsuccess, fail to reach significance in this robustness check.All other coefficients keep their level of significance andsizes. Being appropriately careful in case of a potential biaswe repeat our estimations, i.e. the heck-probit and the sim-ple probit, using standard errors obtained via bootstrap (50replications) and find no mentionable coefficient changes.Thus, we conjecture, based on these checks, that a simpleprobit model seems to produce biased results as it doesnot appropriately model the data generating process in thecase of a selection based on a ‘‘nested innovation’’.
6.2. Potential performance impacts of SES
In Table 5, we present a first exploration of potentialfirm performance impacts of SES by taking a deeper look
5 All regressions conducted as robustness checks are available from theauthors upon request.
at the mean of two measures of firm performance, i.e. salesand labor productivity, for firms using SES together withB2B or B2C applications. Forming additional descriptiveevidence Table 5 also reports the correlation to sales forthe respective groups of firms. Overall, mean sales andmean labor productivity are highest for firms using SESand B2B applications together. As for correlations, SESusage and especially the usage of SES applications togetherwith already established B2B applications feature a signif-icant correlation with firm sales.6 The correlation for SES to-gether with already established B2C practices in use fail toreach significance. Corroborating our conjectures that B2Be-commerce and SES usage act as complements, the highestperformance means as well as the highest correlation coeffi-cient to sales manifests for firms which use SES as well asB2B applications.
We can, however, offer no further causal analyses here.Any regressions of SES adoption on sales or labor produc-tivity would be heavily biased due to endogeneity andmeasurement error as the firms’ SES adoption refers to2010 with sales and labor productivity being reported for2009. Also, performance impacts of SES will most likelyneed time to emerge and can therefore only be identifiedonce new long-term data is available.
7. Conclusion and discussion
Based on recent German firm-level data, our study pro-vides insights into the benefits of adopting the most recentbusiness software, i.e. SES. We estimate a heck-probitusing ICT training as an exclusion restriction to modelthe adoption of SES appropriately as a ‘‘nested innovation’’.We find that the usage of B2B e-commerce leads to theadoption of SES. The adoption of B2C e-commerce showsno impact on the adoption decision. The estimated correla-tions in our model provide weak evidence for a comple-mentary relationship between B2B e-commerce usageand SES. Our results remain robust to several modelspecifications and estimation procedures. For descriptiveevidence of performance impacts of SES we additionally
6 The same pattern also holds for the correlation to labor productivity.However, we decided only to report the correlation to sales forconvenience.
212 B. Engelstätter, M. Sarbu / Information Economics and Policy 25 (2013) 204–213
explore correlations to and the mean of firm sales for SES,B2B and B2C users. The results show that the correlationand the mean are highest for firms using SES and B2Be-commerce application in conjunction.
Overall, our results have several implications. First,based on our weak evidence of complementarity betweenB2B e-commerce and SES adoption, the benefits of SES inthe B2B segment seem to outweigh the benefits in theB2C area. Secondly, although descriptive, we confirm theseresults offering first evidence of positive performance im-pacts of SES, which seem to be particularly high for firmswho adopt SES in addition to already established B2B e-commerce solutions. Third, modeling the data generatingprocess in case of SES adoption as a ‘‘nested innovation’’adequately takes the selection process into account result-ing in biased coefficients otherwise. Overall, as B2C seemsto not benefit from SES overall, we conjecture that for firmsthe potential benefits of SES do, at this stage, not outweighthe potential costs of a possible social media disaster asmentioned in Section 2. However, exploring this issue indetail we have to pass onto further research as our datadoes not permit us to stress this any further.
Our analysis faces a few potential short-comings whichare primarily related to data constraints and unobservedheterogeneity. As stated before, our analysis of any perfor-mance impacts of SES must be interpreted very carefully asthe analysis is merely descriptive. These results need to bestressed and investigated further once new long-term dataincluding firm performance measures are available. Besidesthat, we do not observe management decisions of the sur-veyed firms as we only take an established works councilinto account. It may be the case that some firms simplyadopt new technologies because they want to be on the fastlane in terms of technology, sending out a positive signal. Apart of this phenomenon may be captured in the ICT expen-ditures we control for as those firms can be expected tospend more money on ICT in comparison to firms whichare not as prone to the technology frontier. Availability ofnew data might do away with this potential drawback. Fur-thermore, our exclusion restriction is not without concernabout its exogeneity. It may be the case that ICT intensivefirms invest more in ICT training and expect their trainedemployees to adopt and utilize SES more eagerly. As SESsolutions are sophisticated software tools, even particularlyeager employees may not be able to utilize the softwareaccording to its full potential without specific training.However, as such additional training and further educationis definitely not captured in our exclusion restriction gen-eral ICT training, we expect the aforementioned eagernessto produce a bias of negligible magnitude.
Acknowledgements
We would like to thank Irene Bertschek, Daniel Cerqu-era, Jörg Claussen, Ashok Kaul, Tobias Kretschmer, FrancoisLaisney, Matthias Lengnick, Pierre A. Mohnen, Marina Ryb-alka, Konrad Stahl, Michael R. Ward, one anonymous ref-eree and several conference participants for helpfulcomments and suggestions. We thank Philipp Rathjen forexcellent research assistance. All errors are our own.
References
Aghion, P., Bloom, N., Blundell, R., Griffith, R., Howitt, P., 2002.Competition and innovation: an inverted-U relationship. TheQuarterly Journal of Economics 120 (2), 701–728.
Aral, S., Weill, P., 2007. IT assets, organizational capabilities, and firmperformance. How resource allocations and organizationaldifferences explain performance variation. Organization Science 18(5), 763–780.
Aral, S., Brynjolfsson, E., Wu, D.J., 2006. Which came first, IT orproductivity? The virtuous cycle of investment and use inenterprise systems. In: Proceedings of the 27th Conference onInformation Systems, Milwaukee.
Aral, S., Brynjolfsson, E., Wu, L., 2012. Three-way complementarities:performance pay, human resource analytics, and informationtechnology. Management Science 58 (5), 913–931.
Berinsky, A., 2004. Silent Voices: Opinion Polls and PoliticalRepresentation in America. Princeton University Press, Princeton.
Bertschek, I., 1995. Product and process innovation as a response toincreasing imports and foreign direct investment. Journal of IndustrialEconomics 43 (4), 341–357.
Bertschek, I., Frynges, H. 2002. The Adoption of Business-to-Business E-Commerce: Empirical Evidence for German Companies, ZEWDiscussion Paper 02-05, Mannheim.
Bertschek, I., Frynges, H., Kaiser, U., 2006. B2B or not to be: does B2B E-commerce increase labour productivity? International Journal of theEconomics of Business 13 (3), 387–405.
Bertschek, I., Cerquera, D., Klein, G., 2013. More bits – more bucks?Measuring the impact of broadband internet on firm performance.Information Economics and Policy 25 (3) 190–203.
Bloom, N., Sadun, R., Van Reenen, J., 2008. Americans do I.T. better: USMultinationals and the Productivity Miracle. Mimeo, Centre forEconomic Performance, London School of Economics, London.
blueKiwi, 2011. Understanding the ROI of Enterprise Social Networks,blueKiwi White Paper, blueKiwi, Paris.
Bresnahan, T., Brynjolfsson, E., Hitt, L.M., 2002. Information technology,workplace organization and the demand for skilled labor: firm-levelevidence. Quarterly Journal of Economics 117 (1), 339–376.
Brynjolfsson, E., Hitt, L.M., 1995. Information technology as a factor ofproduction: the role of differences among firms. Economics ofInnovation and New Technology 3 (3), 183–200.
Brynjolfsson, E., Hitt, L.M., 2000. Beyond computation: informationtechnology, organizational transformation and business perfor-mance. Journal of Economic Perspectives 14, 23–48.
Brynjolfsson, E., Hitt, L.M., 2003. Computing productivity: firm-level evidence. Review of Economics and Statistics 85 (4), 793–808.
Caroli, E., Van Reenen, J., 2001. Skill-biased organizational change:evidence from a panel of British and French establishments.Quarterly Journal of Economics 116 (4), 1449–1492.
Chess Media Group, 2010. Guide to Understand Social CRM, Chess MediaGroup White Paper, San Francisco.
Engelstätter, B., 2012. It’s not all about performance gains – enterprisesoftware and innovations. Economics of Innovation and NewTechnology 21 (3), 223–245.
Engelstätter, B., Sarbu, M., in press. Does enterprise software matter forservice innovation? Standardization versus customization. Economicsof Innovation and New Technology.
Flaig, G., Stadler, M., 1994. Success breeds success: the dynamics of theinnovation process. Empirical Economics 19, 55–68.
Gartner, 2012. Predicts 2012: Marketers Must Adapt, Differentiate andInnovate in Social CRM, SaaS and IMM, Gartner Inc, Stanford.
Gera, S., Gu, W., 2004. The effect of organizational innovation andinformation and communications technologies on firm performance.International Productivity Monitor 9, 37–51.
Gourieroux, C., Jasiak, J., 2007. The Econometrics of Individual Risk:Credit, Insurance, and Marketing. Princeton University Press,Princeton.
Greenstein, S., Prince, J., 2007. Internet diffusion and the geography of thedigital divide in the United States. In: Mansell, R., Quah, D.,Silverstone, R. (Eds.), The Oxford Handbook of Information andCommunication Technologies. Oxford University Press, Oxford, pp.168–195.
Hall, B.H., Lotti, F., Mairesse, J., 2009. Innovation and PRODUCTIVITY inSMEs: empirical evidence for Italy. Small Business Economics 33, 13–33.
Heck, M., 2009. Enterprise Social Software Spurs Connections.InfoWorld Applications, San Francisco. <http://www.infoworld.com/

B. Engelstätter, M. Sarbu / Information Economics and Policy 25 (2013) 204–213 213
d/applications/enterprise-social-software-spurs-connections-804>(last visited 28.12.12).
Heckman, J., 1979. Sample selection bias as a specification error.Econometrica 47, 153–161.
Hempell, T., Zwick, T., 2008. New technology, work organisation andinnovation. Economics of Innovation and New Technology 17 (4),331–354.
Hitt, L.M., Wou, D.J., Zhou, X., 2002. Investment in enterprise resourceplanning: business impact and productivity measures. Journal ofManagement Information Systems 19 (1), 71–98.
Kretschmer, T., Miravete, E.J., Pernías, J.C., 2012. Competitive pressure andthe adoption of complementary innovations. American EconomicReview 102 (4), 1540–1570.
Lo, S., Sutthiphisal, D., 2010. Crossover inventions and knowledge diffusionof general purpose technologies: evidence from the electricaltechnology. The Journal of Economic History 70 (3), 744–764.
McCarthy, C., 2010a. What Kevin Smith Means for the Future of PR. CBSInteractive Inc., Cnet News, San Francisco. <http://news.cnet.com/8301-13577_3-10454328-36.html>, (last visited 28.12.12).
McCarthy, C., 2010b. Nestle Mess Shows Sticky Side of Facebook Pages.CBS Interactive Inc., Cnet News, San Francisco. <http://news.cnet.com/8301-13577_3-20000805-36.html> (last visited 28.12.12).
Meyer, J., 2010. Does social software support service innovation?International Journal of the Economics of Business 17 (3), 289–311.
Shih, C., 2010. The Facebook Era: Tapping Online Social Networks toMarket, Sell, and Innovate, second ed. Prentice Hall, Upper SaddleRiver.
Shin, I., 2006. Adoption of enterprise application software and firmperformance. Small Business Economics 26 (3), 241–256.
Zwick, T., 2003. Works Councils and the Productivity Impact of DirectEmployee Participation, ZEW Discussion Paper 03–47. Mannheim.