Embed Size (px)
Citation preview

WHONET for CAESAR
Manual
Version 2021-1 December 2021

2
Contents 1 Introduction ............................................................................................................................................... 4
CAESAR data collection ...................................................................................................................... 4
Why electronic data capture and management? .............................................................................. 4
2 WHONET and BacLink ................................................................................................................................ 5
About WHONET and BacLink ............................................................................................................. 5
WHONET in surveillance .................................................................................................................... 5
Installing WHONET and BacLink ........................................................................................................ 6
2.3.1 Installing WHONET for the first time ......................................................................................... 6
2.3.2 Updating WHONET software ..................................................................................................... 8
WHONET laboratory configuration ................................................................................................... 9
2.4.1 Creating a new laboratory configuration .................................................................................. 9
2.4.2 Configuring antibiotics ............................................................................................................. 13
2.4.3 Checking and updating antibiotic breakpoints ........................................................................ 16
2.4.4 Locations and hospitals ........................................................................................................... 17
2.4.5 Modifying data fields for CAESAR ............................................................................................ 18
2.4.6 Changing file locations ............................................................................................................. 20
WHONET data format ...................................................................................................................... 23
2.5.1 dBase vs SQLite ........................................................................................................................ 23
2.5.2 Viewing WHONET files in other programs............................................................................... 24
2.5.3 Converting dBase into SQLite .................................................................................................. 24
WHONET data entry ........................................................................................................................ 24
3 WHONET data analysis ............................................................................................................................ 36
Macros ............................................................................................................................................. 43
3.1.1 Creating a new macro .............................................................................................................. 43
3.1.2 Using macros that have already been created ........................................................................ 44
Useful analyses for CAESAR ............................................................................................................. 45
3.2.1 Isolate listing and summary ..................................................................................................... 45
3.2.2 %RIS and test measurements .................................................................................................. 47
3.2.3 Resistance profile .................................................................................................................... 50
4 Exporting WHONET files to the CAESAR format ...................................................................................... 56
Preparing CAESAR data that is already in WHONET to send to the national data manager ........... 56
Preparing data in WHONET to send to the international CAESAR data manager ........................... 57
Dealing with problems with WHONET/BacLink ............................................................................... 62
5 Data validation ......................................................................................................................................... 63

3
6 Submitting your data to CAESAR ............................................................................................................. 65
7 Data security ............................................................................................................................................ 66
Annex 1 BacLink ......................................................................................................................................... 67
A1.1 Setting up BacLink ........................................................................................................................... 67
A1.1.1 Formats and structures ........................................................................................................... 67
A1.1.2 Configuring a new format ........................................................................................................ 67
A1.2 Converting data files ........................................................................................................................ 74

4
1 Introduction
CAESAR data collection
CAESAR collects isolate-based antimicrobial resistance data from the member countries. As opposed to
aggregated data that contains only the overall numbers of isolates and the percentages of these that are
resistant, intermediate and susceptible, isolate-based data is much more useful for monitoring antimicrobial
resistance. Isolate-based data make it possible to add additional patient data, including gender and age, data
of hospitalization and other information that makes CAESAR able to conduct analyses that will help give a
clearer picture of the antimicrobial resistance situation in the member countries.
Each laboratory contributing to CAESAR collects antimicrobial resistance data and the local data manager
sends the data to the national data manager. The national data manager will collect all data from his/her
country. Before submitting the data to CAESAR, the national data manager will have to prepare the data and
make sure they comply with the CAESAR data file format. When all data has been prepared the national data
manager will submit the data to CAESAR and the data will be added to the CAESAR database.
As with any surveillance system, the national data manager needs to perform a number of steps including
data collection, data validation and cleaning, data analysis, reporting and feedback. In addition to reporting
to CAESAR, it is important to look at local, regional and national trends to inform strategies for the control of
antimicrobial resistance. Local data managers should also look at their own data to inform empiric guidelines
for treatment in their hospital(s).
Why electronic data capture and management?
Antimicrobial susceptibility testing is increasing and storing data electronically will make data more
accessible. When the amount of data is huge it is difficult to manually analyze data from hand written
registers. Data need to be analyzed regularly to monitor trends and check for emergence of resistance. Local
resistance patterns are useful for guidance regarding empiric use of antibiotics.
There are several Laboratory Information Management Systems (LIMS) available with different specifications
according to the different needs of the laboratory. These LIMS might be costly so not available to every
laboratory. WHONET is a free software that can be used to enter data directly into, or transfer electronic
data already entered elsewhere, to be able to analyze it. It can also be used to print results to be sent out to
clinicians.
5
2 WHONET and BacLink
About WHONET and BacLink
WHONET is free software developed by the WHO Collaborating Centre for Surveillance of Antimicrobial
Resistance, Brigham and Women's Hospital, Boston USA, for the purpose of laboratory-based surveillance of
infectious diseases and antimicrobial resistance.
WHONET is meant to be used in laboratories. It stores the results of antimicrobial resistance tests in its own
database, and enables analysis on these data. The program is flexible to fit in the workflow of each laboratory:
all entry screens are configurable, the list of pathogens can be modified, as well as the tested antimicrobials.
Data are stored as raw values (MIC or diameter), and are interpreted according to guidelines which can easily
be updated or edited. WHONET data can be exported to international surveillance systems like GLASS, EARS-
Net or CAESAR.
BacLink is software to convert and standardize microbiology data from existing systems or prepared files into
WHONET. BacLink is a flexible tool and accepts different data structures and file formats. Installation of
WHONET installs BacLink as well.
This WHONET manual has been prepared to facilitate the collection and analysis of AMR data for CAESAR.
However, WHONET can also be used to collect and analyze other AMR data from laboratories and hospitals.
In WHONET, there is often more than one way to perform a particular task or to navigate to a particular part
of the program. Some examples are given in this brief manual but you will come across further examples as
you gain more experience with the software.
WHONET in surveillance
WHONET has the option to combine data from different laboratories into one data file. This option can be
used for national surveillance. The WHONET files from the participating laboratories combined, will give a
datafile that can be used to provide national statistics. WHONET can also combine WHONET files into TESSy,
CAESAR or GLASS data files.
This option is particularly useful if the majority of laboratories use WHONET for data handling. For the
laboratories not using WHONET, the data need to be entered into WHONET afterwards. This data entry needs
to be done with a separate configuration for each laboratory, making this a time-consuming process.
Alternatively, a BacLink conversion could be developed, to translate the data in some other standardized
format into WHONET.

6
Installing WHONET and BacLink
The software is available from the WHONET website: www.whonet.org. The WHONET installation includes
BacLink. There are 2 WHONET versions available: 64 and 32 bit. Both versions have the same functionality,
and files are compatible. WHONET has the option to export Excel files, therefore it is recommended to match
the version with the version of Microsoft Office on your computer. If you have 64 bit MS-Office installed, also
install 64 bit WHONET, otherwise install 32 bit WHONET.
To find your currently installed version of MS-Office: open any MS-Office application (Access, Excel, Word).
Choose file, account. Here you find: about Access/Excel/Word. The version is shown.
Choose one of the versions of WHONET, and download. Only one version can be installed on one computer.
Figure 2.1: WHONET download page.
2.3.1 Installing WHONET for the first time
Downloading and installing the latest version of WHONET is simple to do, although you may need to get your
IT/computer department to do this for you as often they restrict what users can do in terms of downloading
and installing software. To install WHONET, an administrator account for your computer is needed.
Sometimes anti-virus software blocks the installation. If this occurs, the protection must be temporarily
disabled during the installation. Most antivirus software has the option to disable the protection for a couple
of minutes.
Once you have downloaded the installation package, right-click on the downloaded file, and choose ‘Run as
administrator’. It is possible that you need to provide an administrator username and password. Follow the
instructions on the InstallShield Wizard screen (‘Run’, ‘Next’, ‘Install’, ‘OK’, ‘Finish’).
7
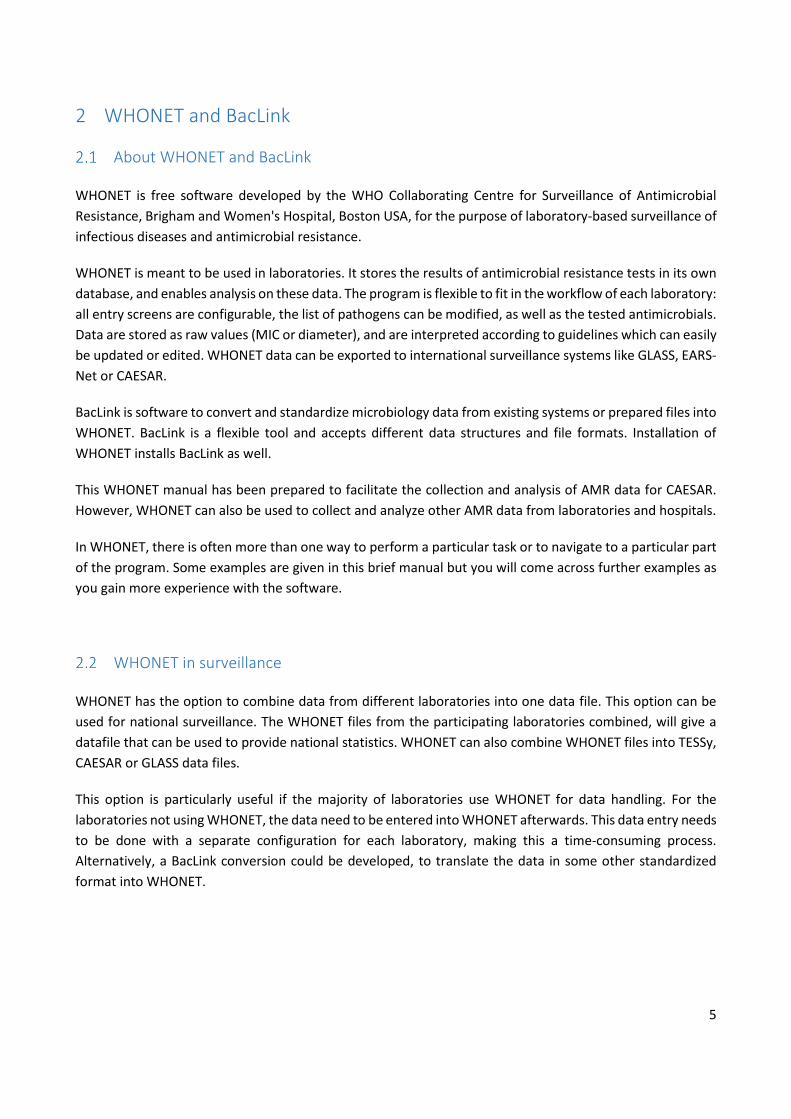
The default location for the WHONET installation is C:\WHONET (see Figure 2.2). Once WHONET is installed,
this folder is where you will find a number of subfolders including ‘Documents’, where you will find
comprehensive manuals for both WHONET and BacLink. Two other important subfolders to be aware of are:
• ‘Data’ subfolder, which is the default location for all new data files created (unless the location is
specifically changed)
• ‘Output’ subfolder, which is the default location for any new output files created when you analyze your
data
Figure 2.2: Default location on the C:\ drive for WHONET installation, including Data and Output subfolders and configuration files.
Once you have installed the program you will find icons for both WHONET and BacLink on your desktop (see
Figure 2.3). It is from these icons that you can access the program. Alternatively, you can access the program
from the Start menu like any other program.

8
Figure 2.3: Desktop showing icons for WHONET and BacLink 2019.
2.3.2 Updating WHONET software
This section does not apply to users installing WHONET for the very first time.
It is advisable to install the most up to date version of WHONET at least once a year, but preferably mHore
often because WHONET gets regular updates. These updates could correct errors in the software, or add
new features. The name of the program is usually WHONETyyyy (where yyyy is the current year). This does
not mean there is only one version per year, every version has a built date and a version number.
When you are installing the latest version of WHONET, only the program files for the software will be
updated: all your configuration and data files will not be changed in any way. This also means that
breakpoints are not updated automatically. Updating breakpoints is a manual process for each laboratory
configuration. It could be important when interpreting and analyzing data from a specific year, that the
breakpoints from that year are used. Updating breakpoints will be covered later in this manual in the
section about WHONET configuration.
9
WHONET laboratory configuration
WHONET is flexible software. It can be used in microbiology laboratories for human healthcare, but also
laboratories working for veterinary care of for food and environment. It supports guidelines from EUCAST,
CLSI as well as a lot of national guidelines. The price for this flexibility is that configuration is very important.
So before starting to use WHONET in a laboratory the program needs to be configured to fit the procedures
and guidelines used in that laboratory. All the settings are stored in a laboratory configuration file: one for
each laboratory, for each year of data. The latter because EUCAST as well as CLSI will have updated
breakpoints each year, and the breakpoints are part of the laboratory configuration.
In WHONET, there is often more than one way to perform a particular task or to navigate to a particular part
of the program. Some examples are given in this manual but you will come across further examples as you
gain more experience with the software.
2.4.1 Creating a new laboratory configuration
In WHONET, there are several ways to create a new laboratory configuration, all in the ‘file’ menu. Examples:
• New laboratory, this is the long way. You will have to configure all the fields yourself. This is not dealt
with in this manual.
• Create a laboratory from a data file (especially useful for users of BacLink and when you receive a
WHONET data file from someone else). The configuration will include the used antibiotics and tests (such
as disk or MIC), and also the guideline (CLSI or EUCAST) but it is not possible to see which version of the
breakpoints was used to create the file.
• File menu: EARS-Net/CAESAR › New laboratory. This is the easiest way for our purpose. It is still possible
to make all modifications, but much of the necessary configuration is already predefined. We will explain
this option in detail.
2.4.1.1 Creating a new laboratory for TESSy/CAESAR
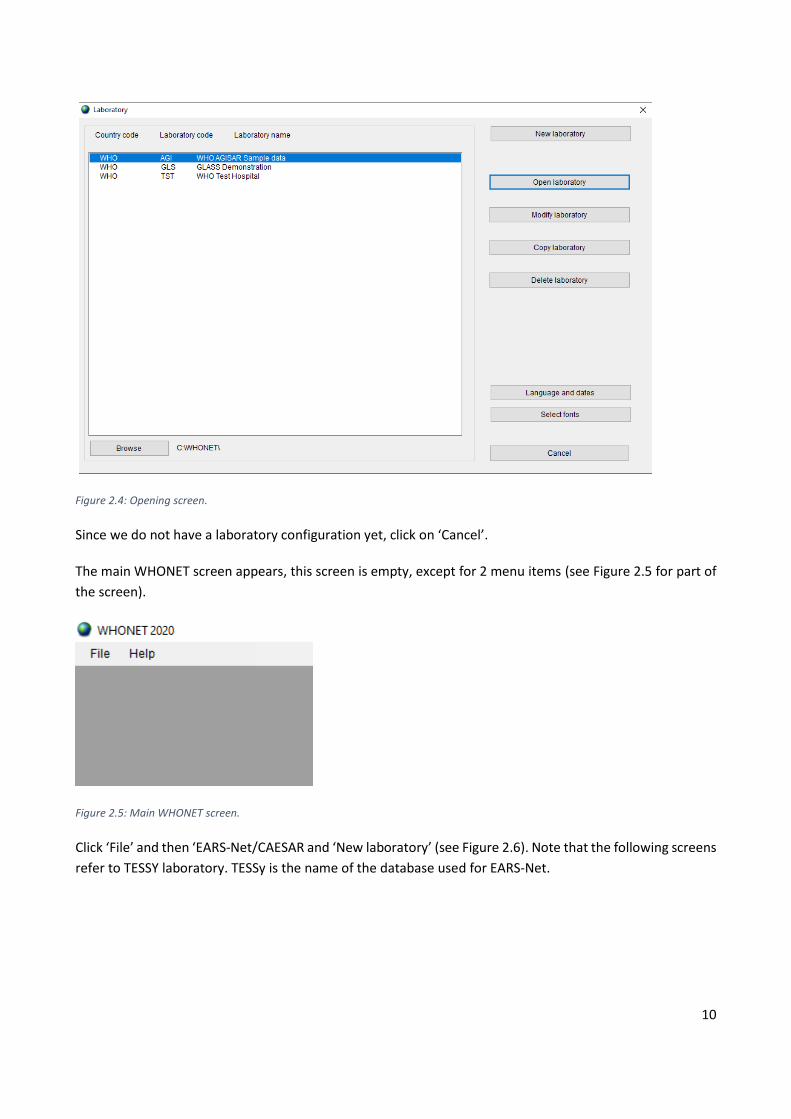
If you start WHONET the first time, the screen below will appear. The only laboratory configurations are
examples (see Figure 2.4).
10
Figure 2.4: Opening screen.
Since we do not have a laboratory configuration yet, click on ‘Cancel’.
The main WHONET screen appears, this screen is empty, except for 2 menu items (see Figure 2.5 for part of
the screen).
Figure 2.5: Main WHONET screen.
Click ‘File’ and then ‘EARS-Net/CAESAR and ‘New laboratory’ (see Figure 2.6). Note that the following screens
refer to TESSY laboratory. TESSy is the name of the database used for EARS-Net.

11
Figure 2.6: Create a new EARS-Net/CAESAR laboratory.
The following screen will appear within the main screen (Figure 2.7):
Figure 2.7: New TESSy laboratory, select country.
Indicate your country, laboratory name and laboratory code (this will be provided by your national data
manager and will most likely be a 3-digit numeric code, e.g., 001) and then click ‘OK’.
The next screen appears (Figure 2.8):

12
Figure 2.8: New TESSy laboratory, select guideline.
Select the guidelines used by the laboratory and click ‘OK’. Note that if you choose EUCAST, afterwards you
can still add CLSI tests and vice versa.
Then the following screen will appear (Figure 2.9):
Figure 2.9: New TESSy laboratory, select method for MRSA screening.
If you use a cefoxitin disk to screen for MRSA isolates, indicate the medium and disk potency used, which
should be in accordance with the guidelines followed. Both CLSI and EUCAST use Mueller-Hinton 30µg. If
cefoxitin disk is not used for this purpose, select ‘Not tested.’
Click ‘OK’.
WHONET will create a new laboratory with the recommended set of CAESAR data fields and codes, including
the preferred antibiotics. You will then be prompted with the following screen (Figure 2.10):
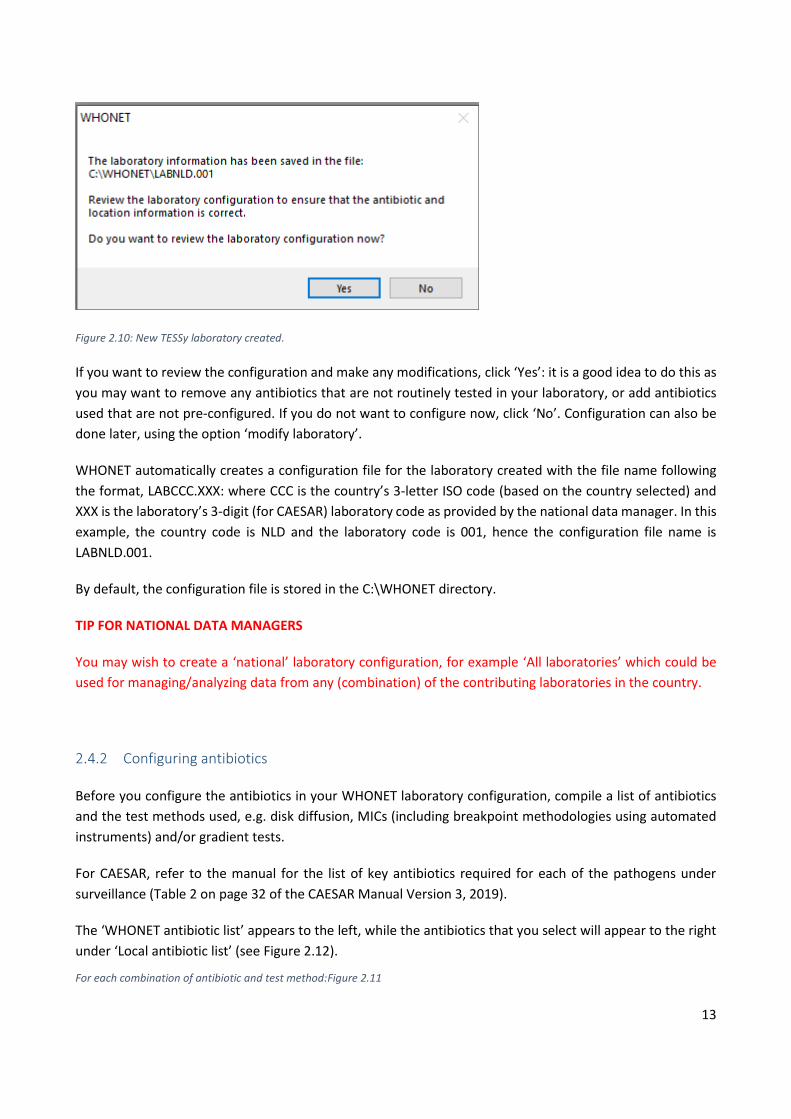
13
Figure 2.10: New TESSy laboratory created.
If you want to review the configuration and make any modifications, click ‘Yes’: it is a good idea to do this as
you may want to remove any antibiotics that are not routinely tested in your laboratory, or add antibiotics
used that are not pre-configured. If you do not want to configure now, click ‘No’. Configuration can also be
done later, using the option ‘modify laboratory’.
WHONET automatically creates a configuration file for the laboratory created with the file name following
the format, LABCCC.XXX: where CCC is the country’s 3-letter ISO code (based on the country selected) and
XXX is the laboratory’s 3-digit (for CAESAR) laboratory code as provided by the national data manager. In this
example, the country code is NLD and the laboratory code is 001, hence the configuration file name is
LABNLD.001.
By default, the configuration file is stored in the C:\WHONET directory.
TIP FOR NATIONAL DATA MANAGERS
You may wish to create a ‘national’ laboratory configuration, for example ‘All laboratories’ which could be
used for managing/analyzing data from any (combination) of the contributing laboratories in the country.
2.4.2 Configuring antibiotics
Before you configure the antibiotics in your WHONET laboratory configuration, compile a list of antibiotics
and the test methods used, e.g. disk diffusion, MICs (including breakpoint methodologies using automated
instruments) and/or gradient tests.
For CAESAR, refer to the manual for the list of key antibiotics required for each of the pathogens under
surveillance (Table 2 on page 32 of the CAESAR Manual Version 3, 2019).
The ‘WHONET antibiotic list’ appears to the left, while the antibiotics that you select will appear to the right
under ‘Local antibiotic list’ (see Figure 2.12).
For each combination of antibiotic and test method:Figure 2.11

14
• select the correct testing guidelines using the dropdown menu (e.g. EUCAST or CLSI; please note:
WHONET default is CLSI, but CAESAR recommends EUCAST)
• AND click on the correct test method (disk diffusion, MIC, Etest)
• AND select the correct antibiotic (including the correct disk potency for the guidelines being followed if
the test method is disk diffusion). For MIC or gradient testing, you can choose any disk potency, as it is
ignored for MIC/gradient testing.
You can select an antibiotic by double-clicking on it OR by clicking on it once and then clicking the right arrow
button ‘-->‘. This will result in the antibiotic being moved across from the ‘WHONET antibiotic list’ to the
‘Local antibiotic list’.
Figure 2.12: Laboratory configuration, WHONET and local antibiotic list.
Each antibiotic-test combination is given a code (of up to nine characters) in the ‘Local antibiotic list’
consisting of:
• the three-letter antibiotic code
• a one-letter code indicating the guideline reference (e.g. E=EUCAST; N=CLSI, formerly NCCLS)
• a one-letter code indicating the test method (D=disk diffusion; M=MIC; E= Gradient, Etest)
• a disk potency (numerical value in μg) disk diffusion tests
15
For MICs or Etests, this is rather confusing, you choose the correct antibiotic (ignoring the disk potency) and
the guideline. For example: to enter Oxacillin MIC according to EUCAST, choose EUCAST, and MIC. Then
choose one of the 3 oxacillin disks. It makes no difference, the disk potency and guideline indicated in the
list, are not relevant.
For example, the code GEN_ED10 represents: GEN=gentamicin, E=EUCAST, D=disk diffusion, 10=10µg, while
GEN_EM is: gentamicin, EUCAST, MIC.
When you finish entering your antibiotics, review the list and make any needed corrections. To remove an
antibiotic from the ‘Local antibiotic list’, single-click on the antibiotic and hit the left arrow button, ‘<--’. You
may change the sequence of the antibiotics with the ‘Move Up’ and ‘Move Down’ buttons.
TIP: It is recommended that you keep the list in alphabetical order for convenience. To do this, highlight the
antibiotic you want to move and use the ‘Move up’ and ‘Move down’ buttons indicated in the screenshot
above.
When you are satisfied with the list, you have the following options:
• ‘Breakpoints’ to review, modify, and update the antibiotic breakpoints (see section 2.4.3).
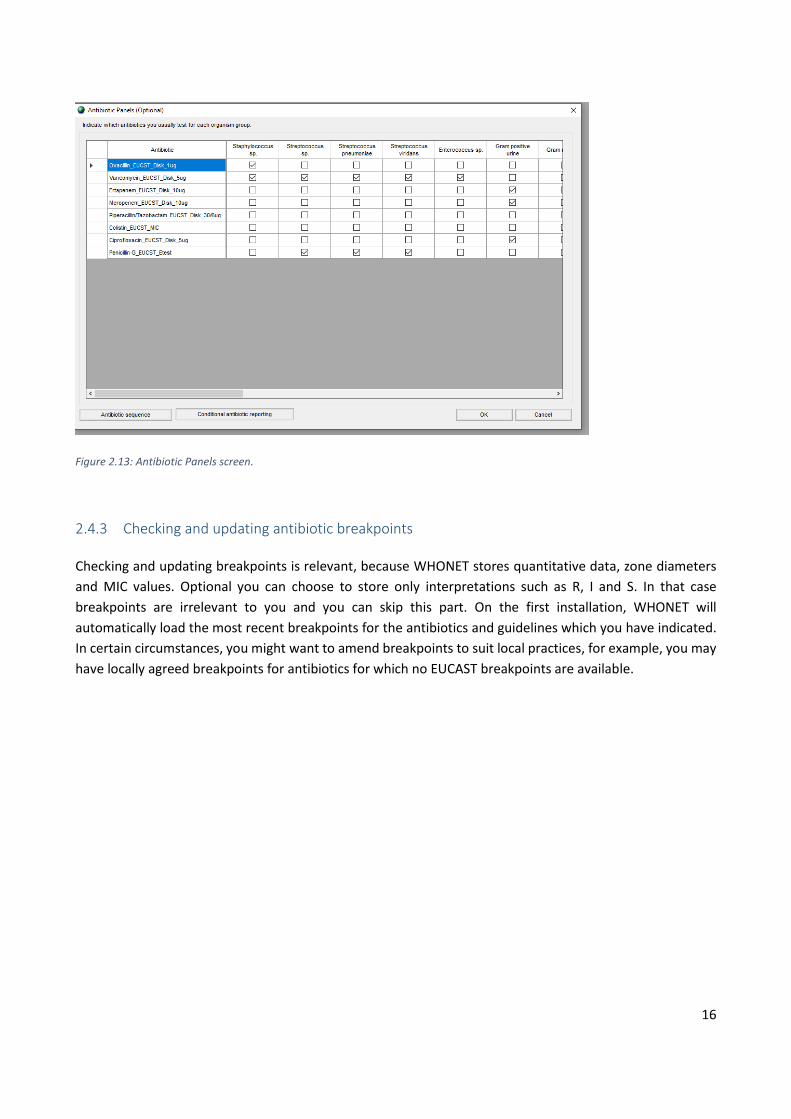
• ‘Panels’ and ‘Profiles’ are optional: to facilitate data entry, you may wish to use ‘Panels’ to indicate which
antibiotics are tested for each kind of organism (see Figure 2.13). The panels configure which antibiotics
will be visible on the entry forms. It is recommended to remove antibiotics not used in your laboratory
to prevent data entry errors.
• ‘Print’: to obtain a printout of your antibiotics and their breakpoints by organism (organism-specific
breakpoints). It is recommended that you print out your breakpoints for your review and reference
before you start data entry.
• ‘OK’: to return to the main Laboratory Configuration screen (note: the information has to be saved by
clicking on ‘Save’ in the main Laboratory Configuration screen).
16
Figure 2.13: Antibiotic Panels screen.
2.4.3 Checking and updating antibiotic breakpoints
Checking and updating breakpoints is relevant, because WHONET stores quantitative data, zone diameters
and MIC values. Optional you can choose to store only interpretations such as R, I and S. In that case
breakpoints are irrelevant to you and you can skip this part. On the first installation, WHONET will
automatically load the most recent breakpoints for the antibiotics and guidelines which you have indicated.
In certain circumstances, you might want to amend breakpoints to suit local practices, for example, you may
have locally agreed breakpoints for antibiotics for which no EUCAST breakpoints are available.
17
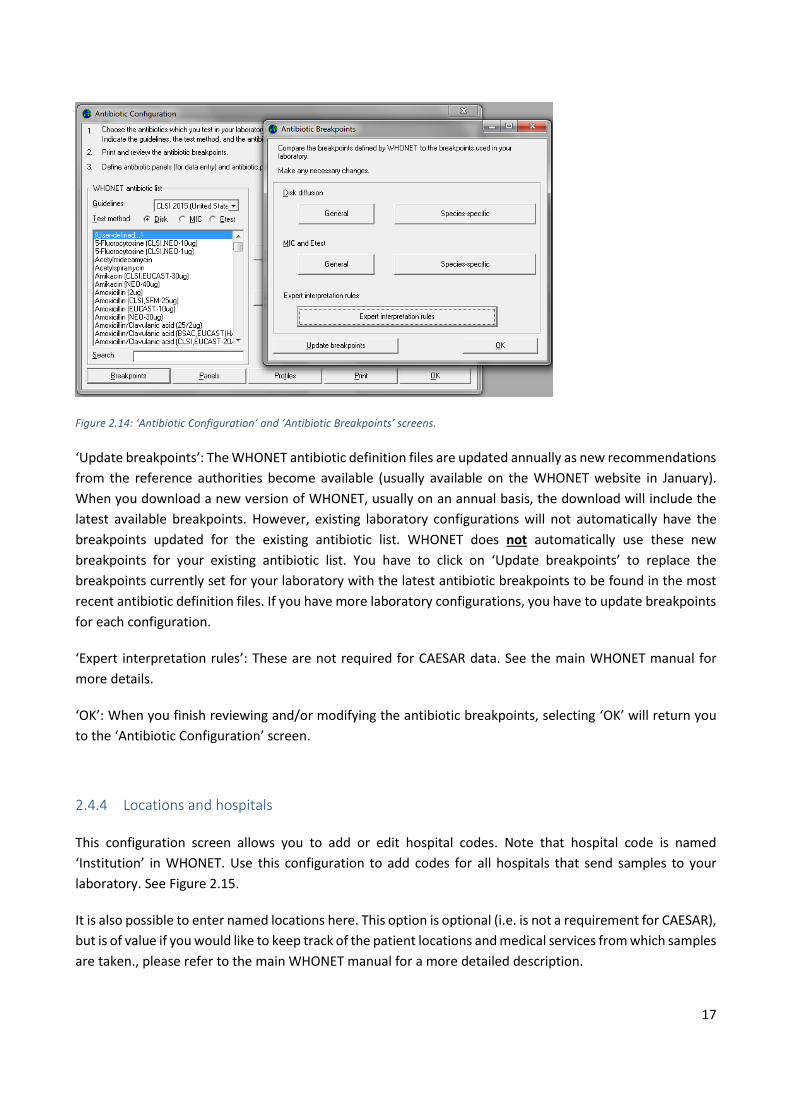
Figure 2.14: ‘Antibiotic Configuration’ and ‘Antibiotic Breakpoints’ screens.
‘Update breakpoints’: The WHONET antibiotic definition files are updated annually as new recommendations
from the reference authorities become available (usually available on the WHONET website in January).
When you download a new version of WHONET, usually on an annual basis, the download will include the
latest available breakpoints. However, existing laboratory configurations will not automatically have the
breakpoints updated for the existing antibiotic list. WHONET does not automatically use these new
breakpoints for your existing antibiotic list. You have to click on ‘Update breakpoints’ to replace the
breakpoints currently set for your laboratory with the latest antibiotic breakpoints to be found in the most
recent antibiotic definition files. If you have more laboratory configurations, you have to update breakpoints
for each configuration.
‘Expert interpretation rules’: These are not required for CAESAR data. See the main WHONET manual for
more details.
‘OK’: When you finish reviewing and/or modifying the antibiotic breakpoints, selecting ‘OK’ will return you
to the ‘Antibiotic Configuration’ screen.
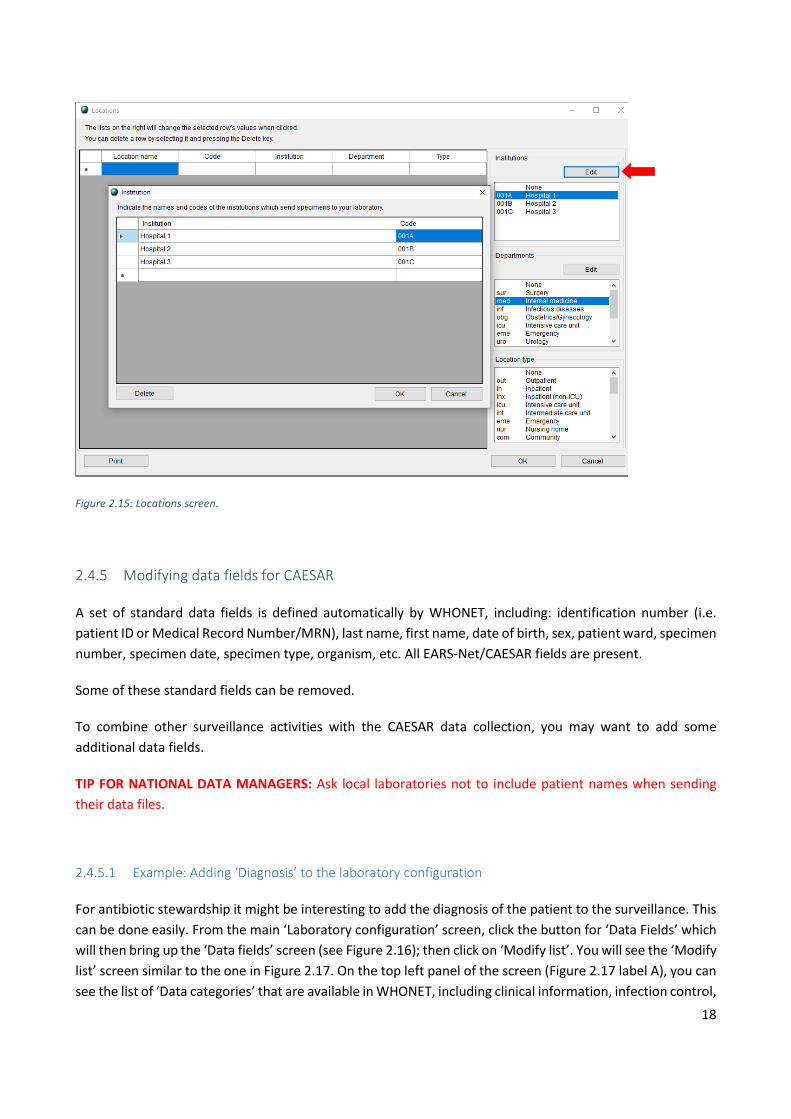
2.4.4 Locations and hospitals
This configuration screen allows you to add or edit hospital codes. Note that hospital code is named
‘Institution’ in WHONET. Use this configuration to add codes for all hospitals that send samples to your
laboratory. See Figure 2.15.
It is also possible to enter named locations here. This option is optional (i.e. is not a requirement for CAESAR),
but is of value if you would like to keep track of the patient locations and medical services from which samples
are taken., please refer to the main WHONET manual for a more detailed description.
18
Figure 2.15: Locations screen.
2.4.5 Modifying data fields for CAESAR
A set of standard data fields is defined automatically by WHONET, including: identification number (i.e.
patient ID or Medical Record Number/MRN), last name, first name, date of birth, sex, patient ward, specimen
number, specimen date, specimen type, organism, etc. All EARS-Net/CAESAR fields are present.
Some of these standard fields can be removed.
To combine other surveillance activities with the CAESAR data collection, you may want to add some
additional data fields.
TIP FOR NATIONAL DATA MANAGERS: Ask local laboratories not to include patient names when sending
their data files.
2.4.5.1 Example: Adding ‘Diagnosis’ to the laboratory configuration
For antibiotic stewardship it might be interesting to add the diagnosis of the patient to the surveillance. This
can be done easily. From the main ‘Laboratory configuration’ screen, click the button for ‘Data Fields’ which
will then bring up the ‘Data fields’ screen (see Figure 2.16); then click on ‘Modify list’. You will see the ‘Modify
list’ screen similar to the one in Figure 2.17. On the top left panel of the screen (Figure 2.17 label A), you can
see the list of ‘Data categories’ that are available in WHONET, including clinical information, infection control,
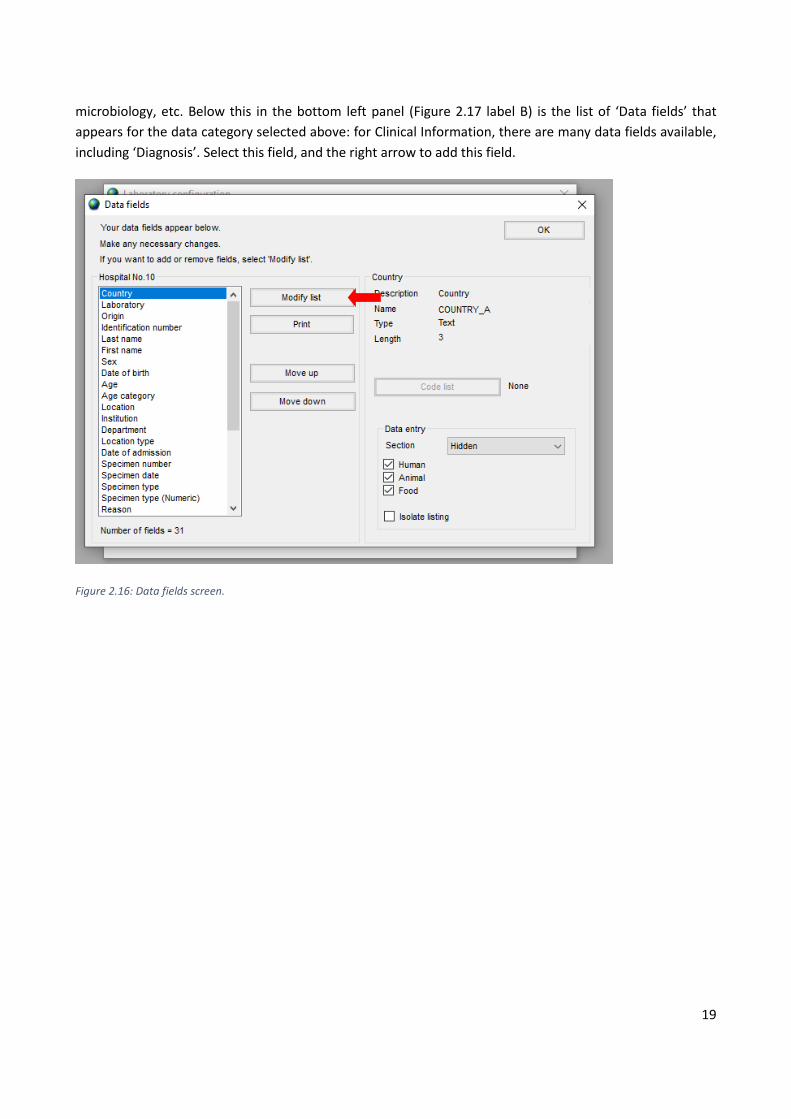
19
microbiology, etc. Below this in the bottom left panel (Figure 2.17 label B) is the list of ‘Data fields’ that
appears for the data category selected above: for Clinical Information, there are many data fields available,
including ‘Diagnosis’. Select this field, and the right arrow to add this field.
Figure 2.16: Data fields screen.

20
An asterisk appears before the data field name (Figure 2.17 label B) once it has been added to the laboratory
configuration for this laboratory.
Figure 2.17: Modify list screen.
Once you have added any other additional fields, click ‘OK’ to bring you back to the ‘Data fields’ screen and
then click ‘OK’ again to bring you back to the ‘Laboratory configuration’ screen. Finally click on ‘Save’ to save
any changes to this lab configuration.
2.4.6 Changing file locations
The default locations for all new laboratory configurations and data/output files created is on the local C:\
drive of the computer on which WHONET is installed:
Laboratory configuration files are stored in: C:\WHONET
Data files are stored in: C:\WHONET\Data
Output files are stored in: C:\WHONET\Output
A
B
C

21
Macros are stored in: C:\WHONET\Macros
If your laboratory has a computer network, it is not recommended to keep any files on the local C:\ drive. If
this computer crashes then all these files could be lost if the data have not been backed up. By keeping files
on a network drive it is possible to share the configuration and data/output files between computers and
there is a better chance that all the latest files will have been backed up (of course, this depends on the local
IT policies).
1. To change the location of configuration files:
When you open up WHONET, you will see the ‘Laboratory’ screen (Figure 2.18) showing the list of
laboratories available. The red arrow indicates the exact location or pathway to the laboratory configuration
files.
TIP: Always change file locations to a drive on your computer network (if you have one).
Figure 2.18: Laboratory screen.
Click on the ‘Browse’ button to the left of this pathway in order to change this location. This brings up another
screen that allows you to ‘Select file location’. To change from the C:\ drive to a network drive, in the example
below P:\ (Figure 2.19), click on the dropdown menu at the bottom of this screen and navigate to the new
location. You may want to create a folder in this location called ‘Networked WHONET configuration files’.
Once you have re-set the location of your laboratory configuration files, you will have to move any
configuration files from the old location (C:\WHONET5) to the new location.

22
Figure 2.19: ‘Browse For Folder’ screen: this allows you to select the folder on your network where laboratory configuration files will
be placed.
2. To change the file locations for data, output and macro files:
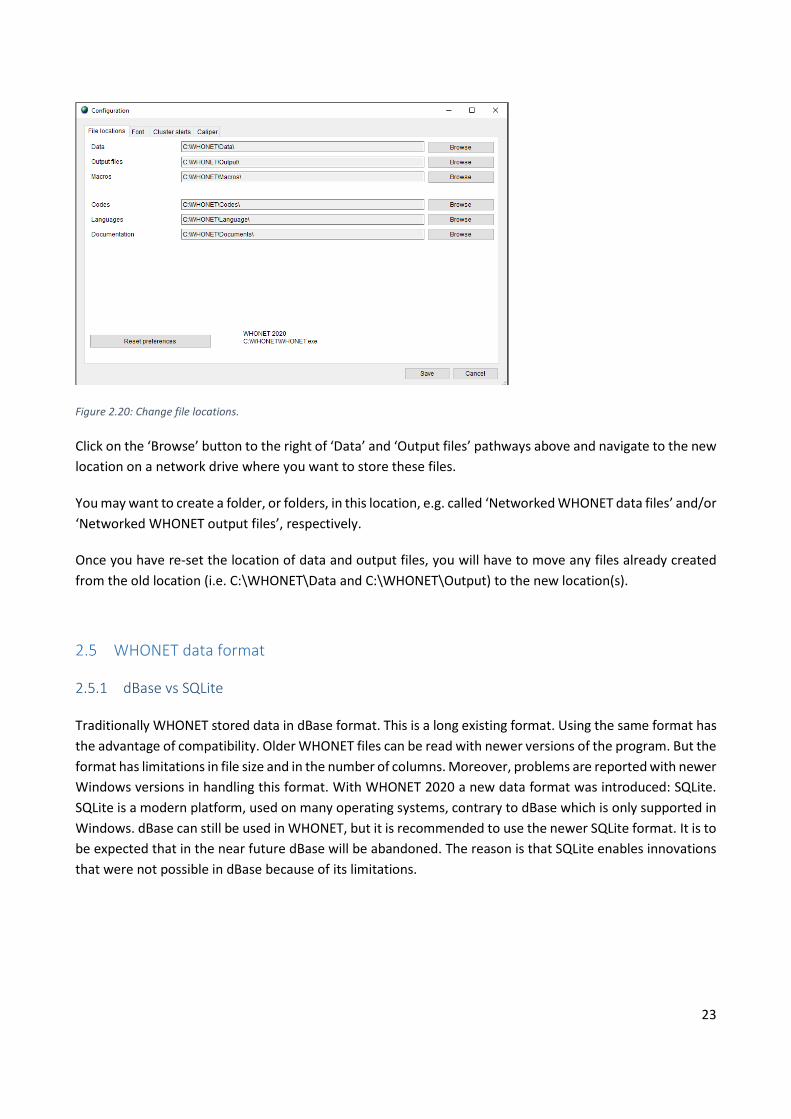
Go to the WHONET main menu. Click on ‘File’, then ‘Configuration’ to bring up the File locations
(‘Configuration’) screen (see Figure 2.20).
23
Figure 2.20: Change file locations.
Click on the ‘Browse’ button to the right of ‘Data’ and ‘Output files’ pathways above and navigate to the new
location on a network drive where you want to store these files.
You may want to create a folder, or folders, in this location, e.g. called ‘Networked WHONET data files’ and/or
‘Networked WHONET output files’, respectively.
Once you have re-set the location of data and output files, you will have to move any files already created
from the old location (i.e. C:\WHONET\Data and C:\WHONET\Output) to the new location(s).
WHONET data format
2.5.1 dBase vs SQLite
Traditionally WHONET stored data in dBase format. This is a long existing format. Using the same format has
the advantage of compatibility. Older WHONET files can be read with newer versions of the program. But the
format has limitations in file size and in the number of columns. Moreover, problems are reported with newer
Windows versions in handling this format. With WHONET 2020 a new data format was introduced: SQLite.
SQLite is a modern platform, used on many operating systems, contrary to dBase which is only supported in
Windows. dBase can still be used in WHONET, but it is recommended to use the newer SQLite format. It is to
be expected that in the near future dBase will be abandoned. The reason is that SQLite enables innovations
that were not possible in dBase because of its limitations.

24
2.5.2 Viewing WHONET files in other programs
Excel and Access can open dBase files. Saving a dBase file is not possible in recent Excel versions. Opening
SQLite files in Excel is not (yet?) possible. Opening SQLite can be done in the freeware program DB Browser
(SQLite). This program has the option to export tables as CSV files. These CSV files can be opened in many
programs, including Excel.
2.5.3 Converting dBase into SQLite
WHONET has the option to convert existing dBase files into SQLite (see Figure 2.21). The original files will be
kept in a backup folder.
Figure 2.21: Converting DBase to SQLite.
WHONET data entry
First you must open the appropriate laboratory configuration before you can start entering data:
• Open WHONET
• Select the appropriate laboratory and click on ‘Open laboratory’ (see Figure 2.22)

25
Figure 2.22: WHONET opening screen, Open laboratory.
OR
• Go to the main menu and click on ‘File’, then ‘Open laboratory’ (see Figure 2.23)
• Select the appropriate laboratory and click on ‘‘Open laboratory’
Figure 2.23: WHONET main screen: Open laboratory.
You can select a new data file or you can open an existing file.
To create a new file:
Main menu
26
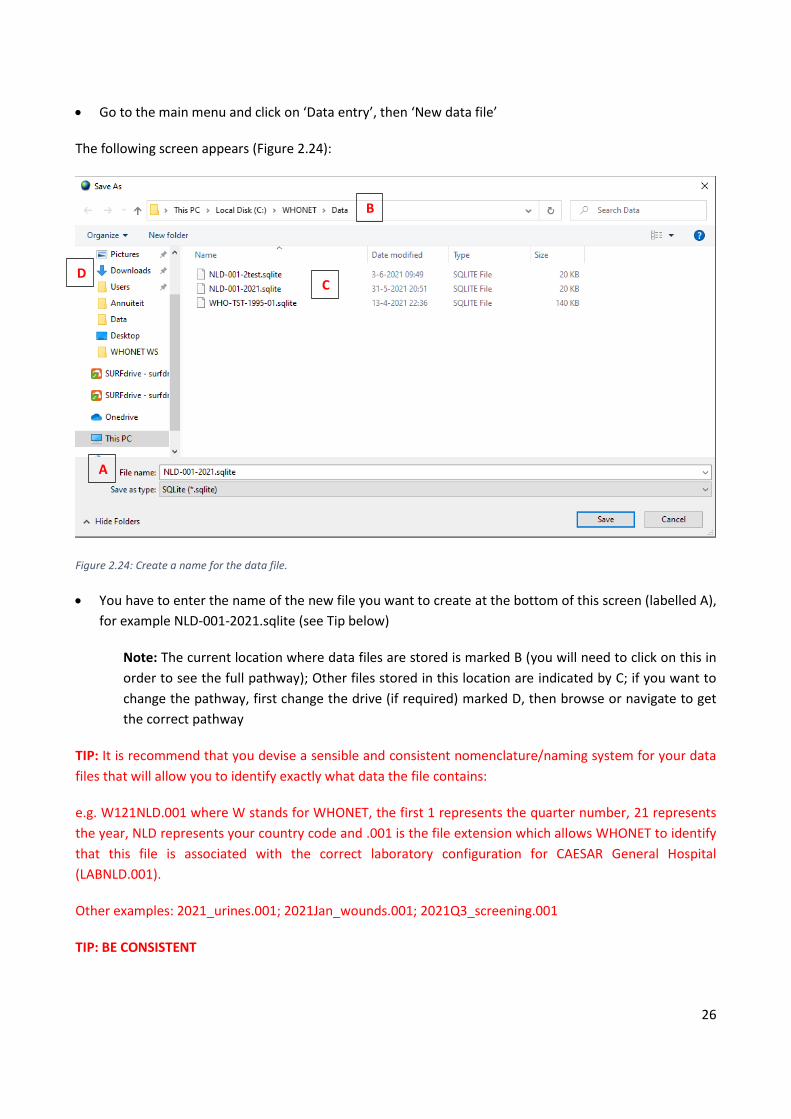
• Go to the main menu and click on ‘Data entry’, then ‘New data file’
The following screen appears (Figure 2.24):
Figure 2.24: Create a name for the data file.
• You have to enter the name of the new file you want to create at the bottom of this screen (labelled A),
for example NLD-001-2021.sqlite (see Tip below)
Note: The current location where data files are stored is marked B (you will need to click on this in
order to see the full pathway); Other files stored in this location are indicated by C; if you want to
change the pathway, first change the drive (if required) marked D, then browse or navigate to get
the correct pathway
TIP: It is recommend that you devise a sensible and consistent nomenclature/naming system for your data
files that will allow you to identify exactly what data the file contains:
e.g. W121NLD.001 where W stands for WHONET, the first 1 represents the quarter number, 21 represents
the year, NLD represents your country code and .001 is the file extension which allows WHONET to identify
that this file is associated with the correct laboratory configuration for CAESAR General Hospital
(LABNLD.001).
Other examples: 2021_urines.001; 2021Jan_wounds.001; 2021Q3_screening.001
TIP: BE CONSISTENT
A
C
B
D
27
TIP: we recommend that you do NOT store your data files in C:\WHONET5\data, which is the default folder
for newly created files in WHONET unless otherwise stated. It is preferable and safer to store ALL data files
in a network folder that is backed up regularly (if your organisation has a computer network). If not available
make sure to regularly save backup copies elsewhere as well.
Once you have given the new data file its name, click ‘Save’.
WHONET will then create the file and open up the data entry screen (see Figure 2.25).
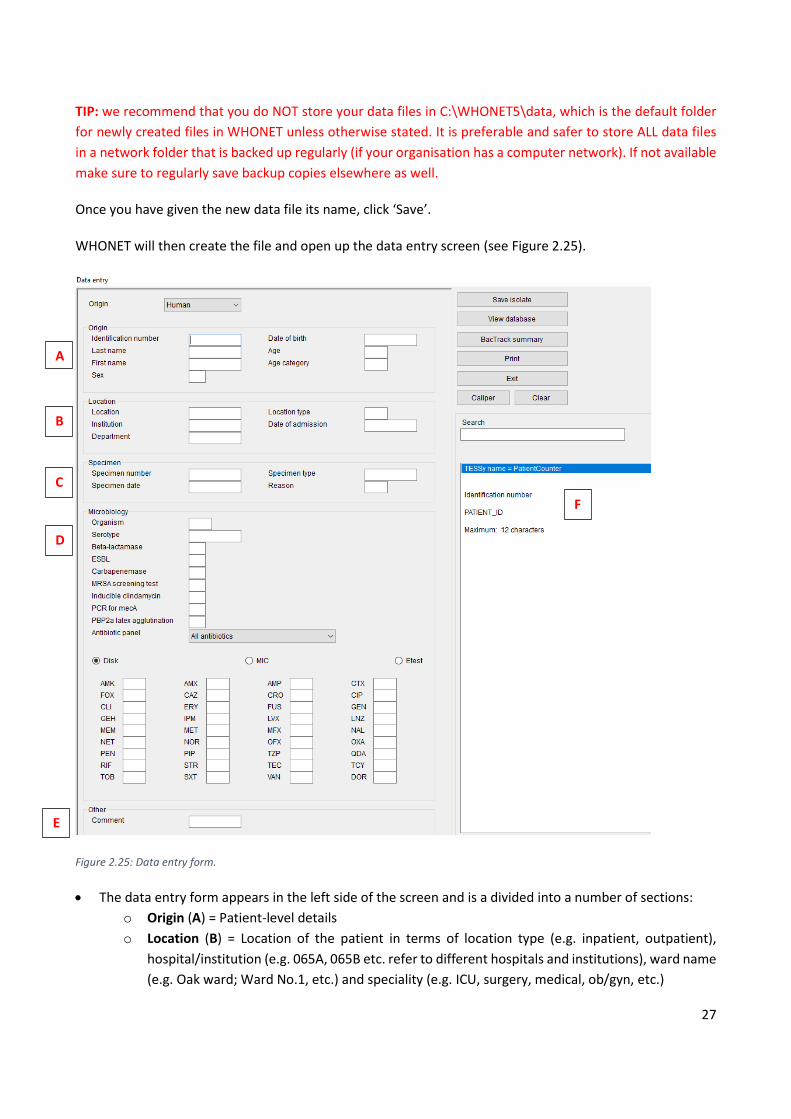
Figure 2.25: Data entry form.
• The data entry form appears in the left side of the screen and is a divided into a number of sections:
o Origin (A) = Patient-level details
o Location (B) = Location of the patient in terms of location type (e.g. inpatient, outpatient),
hospital/institution (e.g. 065A, 065B etc. refer to different hospitals and institutions), ward name
(e.g. Oak ward; Ward No.1, etc.) and speciality (e.g. ICU, surgery, medical, ob/gyn, etc.)
D
C
B
A
E
F

28
o Specimen (C) = Specimen-level details
o Microbiology (D) = Organism name and its associated antibiogram
o Other (E) = Comment and other optional data fields as configured locally
• By clicking on each of the data fields in turn, a brief outline of the data options for that field (instructions
and recommended data codes) appear in the lower right of the screen (F)
TIP: You can only enter data for one isolate of an organism at a time: if a specimen has more than one isolate
(or strain) of a particular organism or multiple isolates of different organisms, subsequent strains and
organisms must be entered separately.
Figure 2.26: Entering data.
• After entering data in one field, there are four ways of moving to the next field:
29
o press the <Enter> key; or
o press the <Tab> key; or
o press the arrow keys; or
o use the mouse
• You should enter dates in the same format as the default format on your computer, namely as
day/month/year or month/day/year or year/month/day. When you have entered a date and moved to
the next field, check that the date has been interpreted correctly: WHONET automatically converts the
numeric date to the name of the month. When entering a date, the year can be entered as a 2- or 4-digit
date. The numbers indicating day, month and year must be separated by a ‘/’ or a ‘–‘ or a space
TIP: Be careful with dates before 1950, e.g. if you enter a date of birth 01/01/49, this will appear as
01/01/2049. So for dates before 1950, enter the full 4-digit year.
Field specific comments:
Age
You have the option of entering the patient’s age. However, if you have entered the patient’s date of birth,
their age and age category will automatically be calculated and inserted in the age and age category fields,
respectively, when you enter the specimen date (otherwise the age will be calculated using the date of data
entry if no specimen date is available).
Organism
The 3-character WHONET organism code should be entered here, or selected from the list on the right half
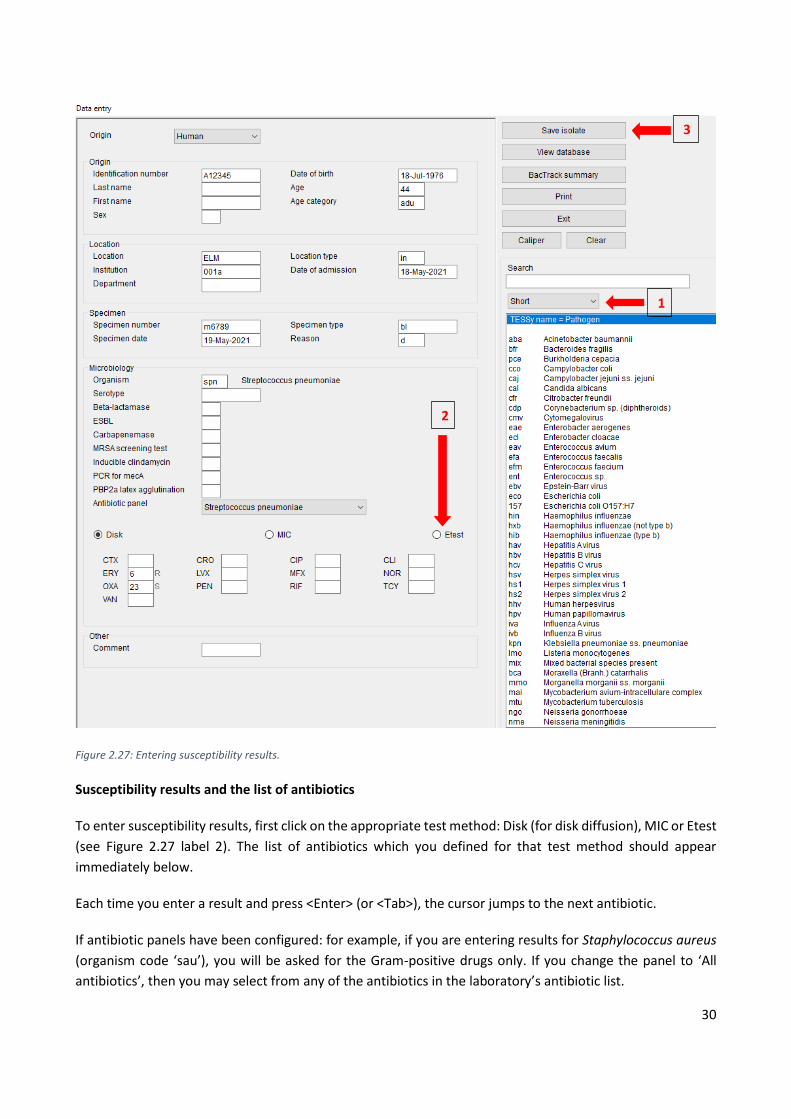
of the screen. By default, only the most common organism codes (‘Short’ list) are listed. To view the full list,
select ‘Extended’ from the dropdown (see Figure 2.27 label 1).
30
Figure 2.27: Entering susceptibility results.
Susceptibility results and the list of antibiotics
To enter susceptibility results, first click on the appropriate test method: Disk (for disk diffusion), MIC or Etest
(see Figure 2.27 label 2). The list of antibiotics which you defined for that test method should appear
immediately below.
Each time you enter a result and press <Enter> (or <Tab>), the cursor jumps to the next antibiotic.
If antibiotic panels have been configured: for example, if you are entering results for Staphylococcus aureus
(organism code ‘sau’), you will be asked for the Gram-positive drugs only. If you change the panel to ‘All
antibiotics’, then you may select from any of the antibiotics in the laboratory’s antibiotic list.
1
2
3

31
TIP: In the laboratory configuration, the order of antibiotics should be alphabetical or some other logical way
to ensure ease of data entry: the order should never be random!
Entering susceptibility results
WHONET allows the entry of quantitative results (e.g. 13mm, 64µg/ml) or qualitative results (R = resistant, I
= intermediate, S = susceptible).
The lowest possible zone diameter is 6mm. If you enter 0mm (indicating no inhibition), WHONET
automatically changes this to 6mm.
For off-scale MIC values you may enter, for example, <=.5, >64.
If you are entering MIC results from the test of a drug combination, enter the result of the first (or principal)
agent only:
o trimethoprim/sulfamethoxazole >4/76: then enter >4
o piperacillin/tazobactam <=4/4: then enter <=4
Note: MIC concentrations usually follow the 1, 2, 4, 8 … doubling-dilution series.
Saving the isolate information
• When you have entered all the data for an isolate, click on ‘Save Isolate’ (see Figure 2.27 label 3), or press
Alt-S. WHONET will then ask you whether you want to:
o Save the isolate
o Save and continue with the same specimen (all the details for Origin, Location and Specimen will
be automatically filled in based on the previous entry, but not Microbiology or Other)
o Save and continue with the same patient (all the details for Origin and Location will be
automatically filled in based on the previous entry, but not Specimen, Microbiology or Other)
• Click on one of these options as appropriate and then ‘OK’ (the data will be saved to disk and the Data
Entry screen will be cleared so that the data for the next isolate can be entered) OR if you decide not to
save the record click ‘Cancel’
Exiting data entry
• Once you are finished entering data, click on ‘Exit’ on the Data entry screen to return to the main menu
of WHONET
To open an existing data file, view the database and edit the data
• From the main menu, go to ‘Data entry’, then ‘Open data file’
• Select the data file and click on ‘Open’, or alternatively just double-click on the data file to be opened
• To look at the database, containing all the records entered so far, click on ‘View database’ (see Figure
2.28 label A)

32
Figure 2.28: Data entry screen.
A
B
33
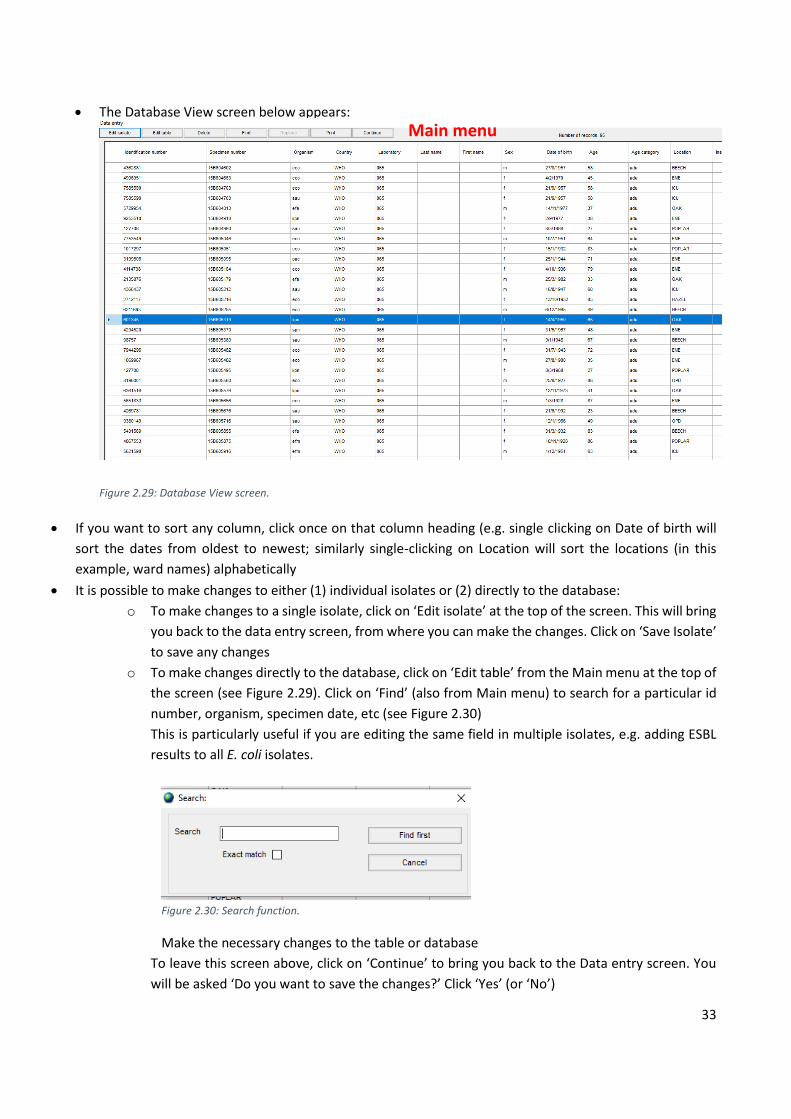
• The Database View screen below appears:
Figure 2.29: Database View screen.
• If you want to sort any column, click once on that column heading (e.g. single clicking on Date of birth will
sort the dates from oldest to newest; similarly single-clicking on Location will sort the locations (in this
example, ward names) alphabetically
• It is possible to make changes to either (1) individual isolates or (2) directly to the database:
o To make changes to a single isolate, click on ‘Edit isolate’ at the top of the screen. This will bring
you back to the data entry screen, from where you can make the changes. Click on ‘Save Isolate’
to save any changes
o To make changes directly to the database, click on ‘Edit table’ from the Main menu at the top of
the screen (see Figure 2.29). Click on ‘Find’ (also from Main menu) to search for a particular id
number, organism, specimen date, etc (see Figure 2.30)
This is particularly useful if you are editing the same field in multiple isolates, e.g. adding ESBL
results to all E. coli isolates.
Figure 2.30: Search function.
Make the necessary changes to the table or database
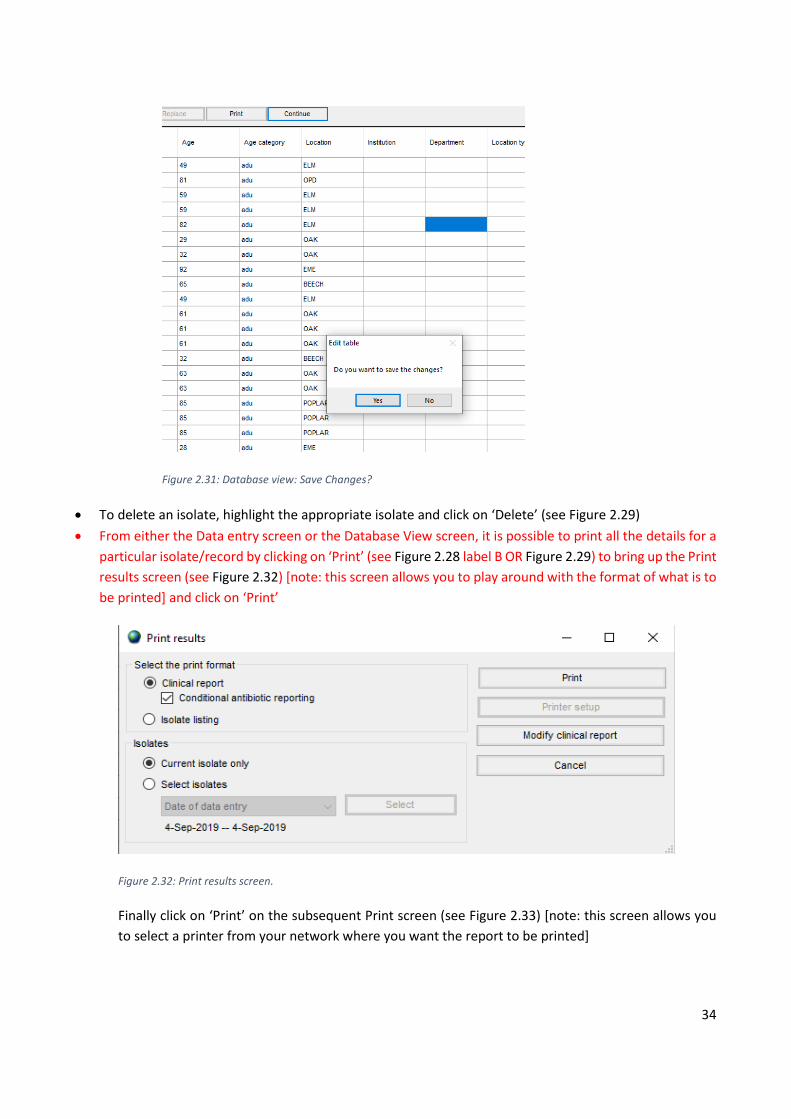
To leave this screen above, click on ‘Continue’ to bring you back to the Data entry screen. You
will be asked ‘Do you want to save the changes?’ Click ‘Yes’ (or ‘No’)
Main menu
34
Figure 2.31: Database view: Save Changes?
• To delete an isolate, highlight the appropriate isolate and click on ‘Delete’ (see Figure 2.29)
• From either the Data entry screen or the Database View screen, it is possible to print all the details for a
particular isolate/record by clicking on ‘Print’ (see Figure 2.28 label B OR Figure 2.29) to bring up the Print
results screen (see Figure 2.32) [note: this screen allows you to play around with the format of what is to
be printed] and click on ‘Print’
Figure 2.32: Print results screen.
Finally click on ‘Print’ on the subsequent Print screen (see Figure 2.33) [note: this screen allows you
to select a printer from your network where you want the report to be printed]

35
Figure 2.33: Printer selection screen.
• From the data entry screen, click on ‘Exit’ to bring you back to the main menu of WHONET

36
3 WHONET data analysis
WHONET provides a useful ‘Data analysis’ package for analysing your data.
The ‘Data analysis’ screen is divided into a number of different sections (see Figure 3.1).
Figure 3.1: Data analysis screen.
Click on the ‘Analysis type’ button (Figure 3.1 label 1) to see the 6 analysis type options currently available:
1. Isolate listing and summary
2. %RIS and test measurements
3. Scatterplot (Not covered in this manual)
4. Resistance profiles
5. Isolate alerts - previously called Bactrack in WHONET 5.6 (Not covered in this manual)
6. Cluster alerts (Not covered in this manual)
6
4
10
0 9
5
7
3
2
8
1
1
37
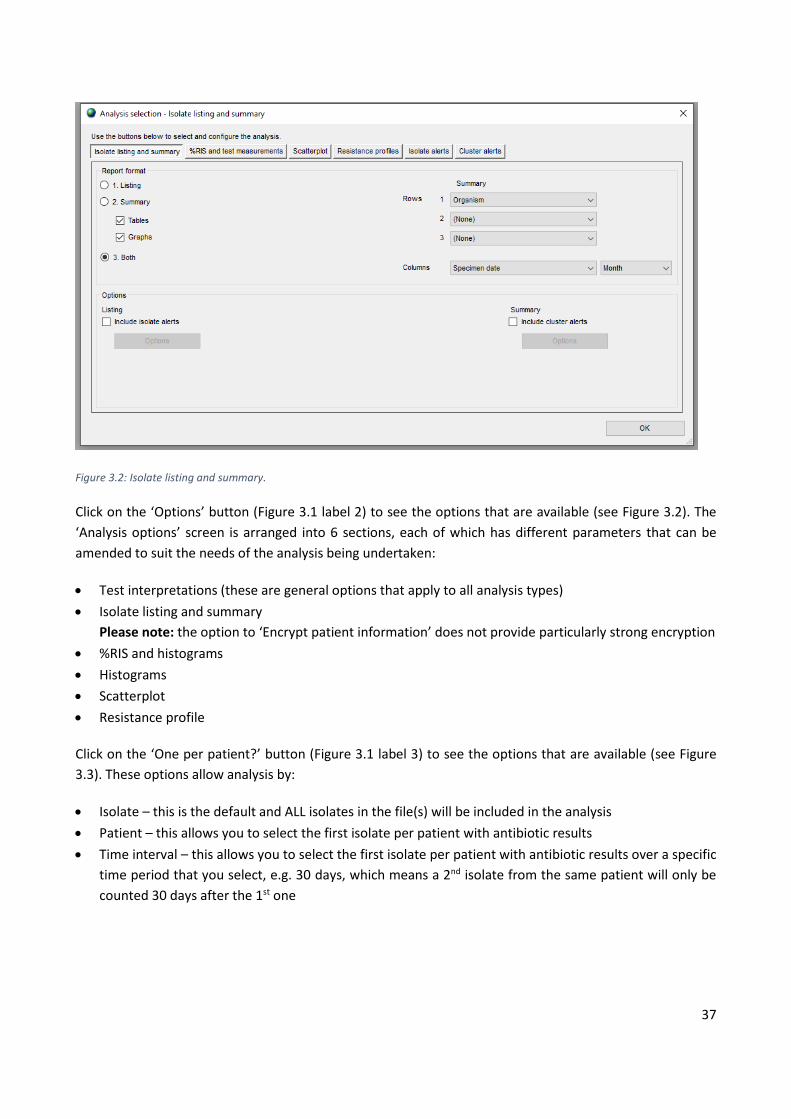
Figure 3.2: Isolate listing and summary.
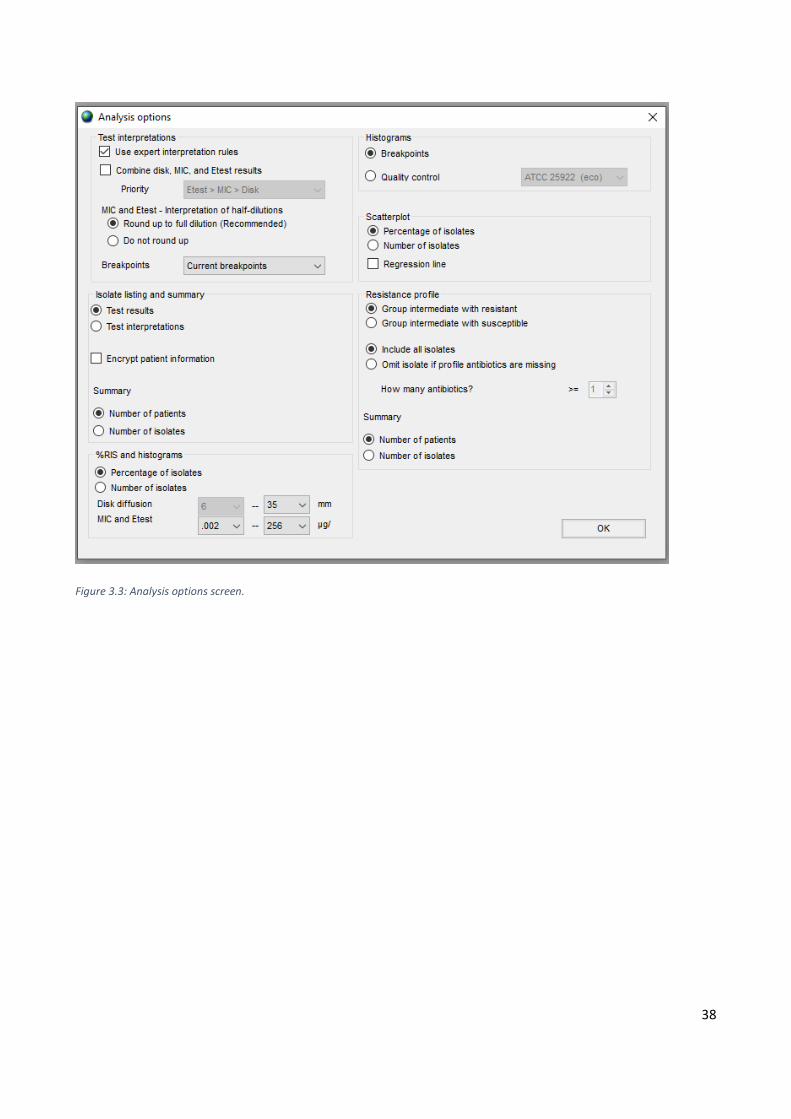
Click on the ‘Options’ button (Figure 3.1 label 2) to see the options that are available (see Figure 3.2). The
‘Analysis options’ screen is arranged into 6 sections, each of which has different parameters that can be
amended to suit the needs of the analysis being undertaken:
• Test interpretations (these are general options that apply to all analysis types)
• Isolate listing and summary
Please note: the option to ‘Encrypt patient information’ does not provide particularly strong encryption
• %RIS and histograms
• Histograms
• Scatterplot
• Resistance profile
Click on the ‘One per patient?’ button (Figure 3.1 label 3) to see the options that are available (see Figure
3.3). These options allow analysis by:
• Isolate – this is the default and ALL isolates in the file(s) will be included in the analysis
• Patient – this allows you to select the first isolate per patient with antibiotic results
• Time interval – this allows you to select the first isolate per patient with antibiotic results over a specific
time period that you select, e.g. 30 days, which means a 2nd isolate from the same patient will only be
counted 30 days after the 1st one
38
Figure 3.3: Analysis options screen.

39
Figure 3.4: Options for ‘One (isolate) per patient’.
Click on the ‘Organisms’ button (Figure 3.1 label 4) to select the species or groups (e.g. all Gram-negatives or
Enterobacteriaceae). WHONET uses 3 letter codes for organisms and organism groups. The relevant
organisms and codes for CAESAR are in Table 1:
Table 1: WHONET codes for CAESAR organisms.
Organism WHONET code
S. aureus sau
S. pneumoniae spn
E. coli eco
E. faecalis efa
E. faecium efm
K. pneumoniae kpn
P. aeruginosa pae
Salmonella spp. sal
Acinetobacter spp. ac-
*Note: The code AC- (upper case) will bring back all Acinetobacters regardless of the species
If you want to analyse all organisms in the file(s), then use the organism code ‘ALL’.

40
Note: ‘All’ will include all the results in your data file even if these were no growth/no pathogens isolated if
your file includes all the laboratory results.
The full list of organisms and groups appears on the left side of the window (see Figure 3.4), the panel on the
right side is the list of organisms/groups to be analysed. Use the Search field to find the organism(s) to be
included in the analysis, highlight the organism using your mouse (it will be highlighted in blue) and then
double (left) click your mouse or single click on the left-pointing arrow between the two panels to bring the
organism across to the panel on the right. Click ‘OK’ when the list is complete.
Figure 3.5: Organism options.
Click on the ‘Isolates’ button (Figure 3.1 label 5) to restrict the analysis to include (or exclude) patients and/or
isolates matching a certain criteria, e.g. only males aged between 16 and 40 years and/or isolates that are
non-susceptible to a particular antibiotic (see Figure 3.6).
Highlight the field of interest and double click to bring up the options available for narrowing down the
analysis (see Figure 3.7).
It is possible to include isolates that meet all the selection criteria (default option) or at least one of the
selection criteria.

41
Figure 3.6: ‘Isolates’ options 1.
Figure 3.7: ‘Isolates’ options 2.

42
Click on the ‘Data files’ button (Figure 3.1 label 6) to select the file(s) to be analysed. WHONET will
automatically look in the default ‘Data files’ folder (if previously selected under ‘File locations’). You can select
one or more files.
WHONET allows you to select where you would like the analysis output to go to (Figure 3.1 label 8). The
default is to the screen, but using the dropdown menu you could also choose to send the output to Excel,
text or to Dbase, i.e. if you are creating a new file (the latter is the same as creating a new WHONET data file
as these are created using Dbase).
If you select to create a new file, you must give the file a name (remember that the nomenclature you use is
important for identifying the data contained within and for filing, i.e. it must make sense).
The output data file will automatically go to the default ‘Output files’ folder (if previously selected under ‘File
locations’).
Once you run the analysis, the pathway to the new file will appear in the ‘File name’ field (Note: this field
appears only after selecting the output to another file format other than to the screen).
Figure 3.8: Screenshot of output to dBASE (WHONET format) with location pathway in ‘File name’ field (i.e.,
C:\WHONET\OUTPUT\EFM study_20190904.065).
The buttons for ‘Begin analysis’ (Figure 3.1 label 9) and ‘Exit’ (Figure 3.1 label 10) are self-explanatory.
43
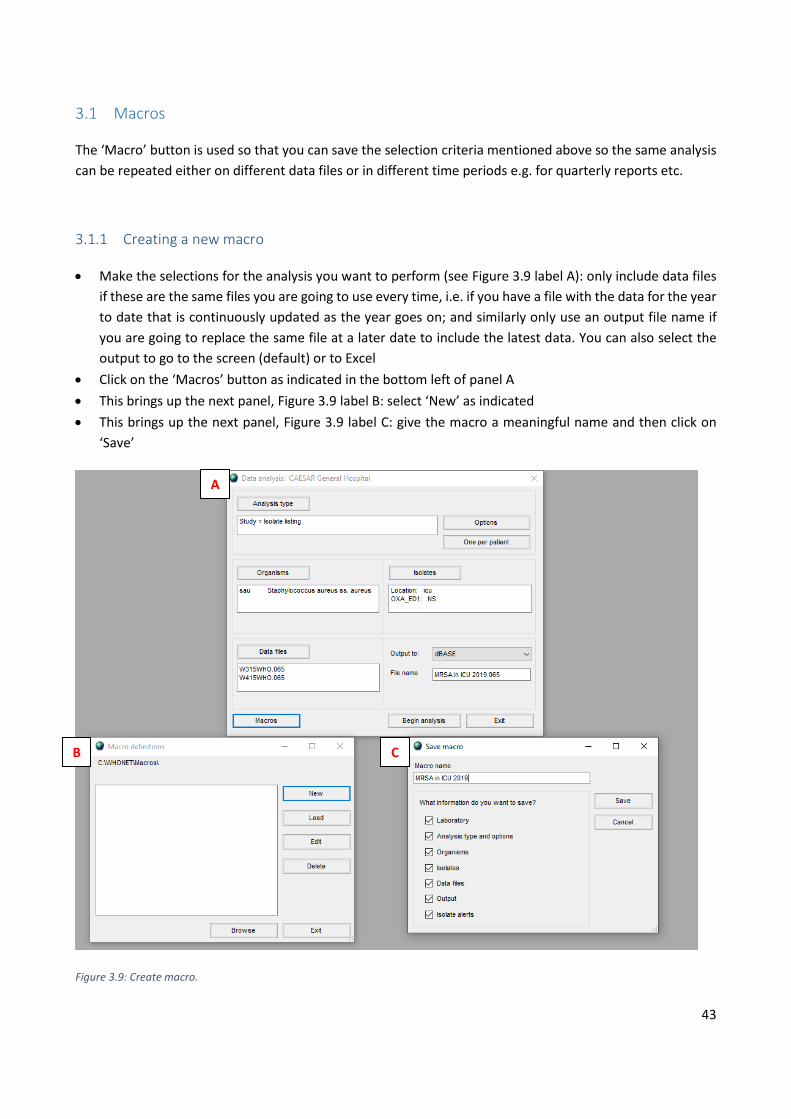
Macros
The ‘Macro’ button is used so that you can save the selection criteria mentioned above so the same analysis
can be repeated either on different data files or in different time periods e.g. for quarterly reports etc.
3.1.1 Creating a new macro
• Make the selections for the analysis you want to perform (see Figure 3.9 label A): only include data files
if these are the same files you are going to use every time, i.e. if you have a file with the data for the year
to date that is continuously updated as the year goes on; and similarly only use an output file name if
you are going to replace the same file at a later date to include the latest data. You can also select the
output to go to the screen (default) or to Excel
• Click on the ‘Macros’ button as indicated in the bottom left of panel A
• This brings up the next panel, Figure 3.9 label B: select ‘New’ as indicated
• This brings up the next panel, Figure 3.9 label C: give the macro a meaningful name and then click on
‘Save’
Figure 3.9: Create macro.
A
A
B
A
C
A

44
Make sure to save the macro in a safe place where you will be able to find it and where WHONET will ‘look’
for its macros.
By default macro files are stored in C:\WHONET\macros (see Figure 3.10). It is probably a good idea to change
the location of these to a network drive (in case the local hard drive crashes resulting in loss of all files/data
stored locally) (see section 2.4.6).
Figure 3.10: Save macro.
3.1.2 Using macros that have already been created
When you click on ‘Macros’ in the main Data analysis screen, the Macro definitions window below will appear
(see Figure 3.11). This gives you the list of macros already saved. If you want to use a macro already saved,
select the required macro from the list and click ‘Load’. Macros can also be changed (edited) if required.

45
Figure 3.11: Execute macro.
These macros can be shared from one user to the other, so that each user provides the same results when
doing the analysis. Make sure to save any macros received from others in the folder where WHONET will
search for macros, that is in C:\WHONET5\macros or on the hospital’s server or network, which is more
secure, as described above. In case a network server is not available make sure to have a backup copy of all
your macros saved somewhere else as well. Macros are small text files that do not take much space/memory.
TIP: Macros make routine data analysis easier!
Useful analyses for CAESAR
3.2.1 Isolate listing and summary
This analysis type results in a simple line-listing of isolates.
Using the CAESAR General Hospital (LabCode WHO065) example, select the analysis type to ‘Isolate listing
and summary’ and the Report Format to ‘Listing’. Next select ‘Organisms’ entering the following codes AC-,
efa, efm, eco, kpn, pae, sau, spn (which are all of the CAESAR pathogens) and the ‘Data files’ as
W315WHO.065. In ‘Isolates’, restrict the analysis so that the only specimen types are bl (blood) and sf (CSF)
and that the specimen dates cover the period you are interested in. In ‘One per patient’, restrict the analysis
to the first isolate by patient. Leave the output to the screen (which is the default) and then click on ‘Begin
analysis’ (see Figure 3.12). The output on the screen appears as in Figure 3.13.

46
Figure 3.12: Data analysis, isolate listing.
Figure 3.13: Output from line-listing.

47
The data in columns can be sorted by clicking on the field name above the column: a single click will sort A-Z
and a subsequent click will reverse the sort order.
The listing produced does not include the complete list of fields present in the laboratory configuration.
Above the table, there is a tick box ‘Show hidden columns’ that can be selected to reveal the full data set.
The table can be copied or printed by clicking on Copy table or Print table at top of the screen (this applies
to all analyses types).
The isolate (or line-) listing is particularly useful for doing quick validation checks of your data:
• Sort the main columns to ensure there are no unexpected blanks, e.g. patient id, DOB, sex, specimen
number, specimen type, specimen date
• Sort the specimen dates to make sure they make sense, e.g. if the data are for 2015 only, then there
should be no date from 2014 or 2016, or 1945 (if specimen date has been entered incorrectly!)
3.2.2 %RIS and test measurements
In this type of analysis, we want to look at the percentage of isolates that are resistant or intermediate or
susceptible to the antibiotics they have been tested against (see Figure 3.14). This can be visualised in a
simple table or on a graph.
Figure 3.14: Data analysis, %RIS and measurements.

48
In this example, we are going to use the laboratory configuration and sample data file from CAESAR Hospital
No. 3.
Figure 3.15 shows the selections made on the ‘Analysis Selection’ screen:
Figure 3.15: Data analysis, %RIS and measurements, analysis selection.
We then select the organisms (=eco) and the data files (=w315who.058), leave the output to the screen and
click on ‘Begin analysis’. The following output is obtained (Figure 3.16):
49
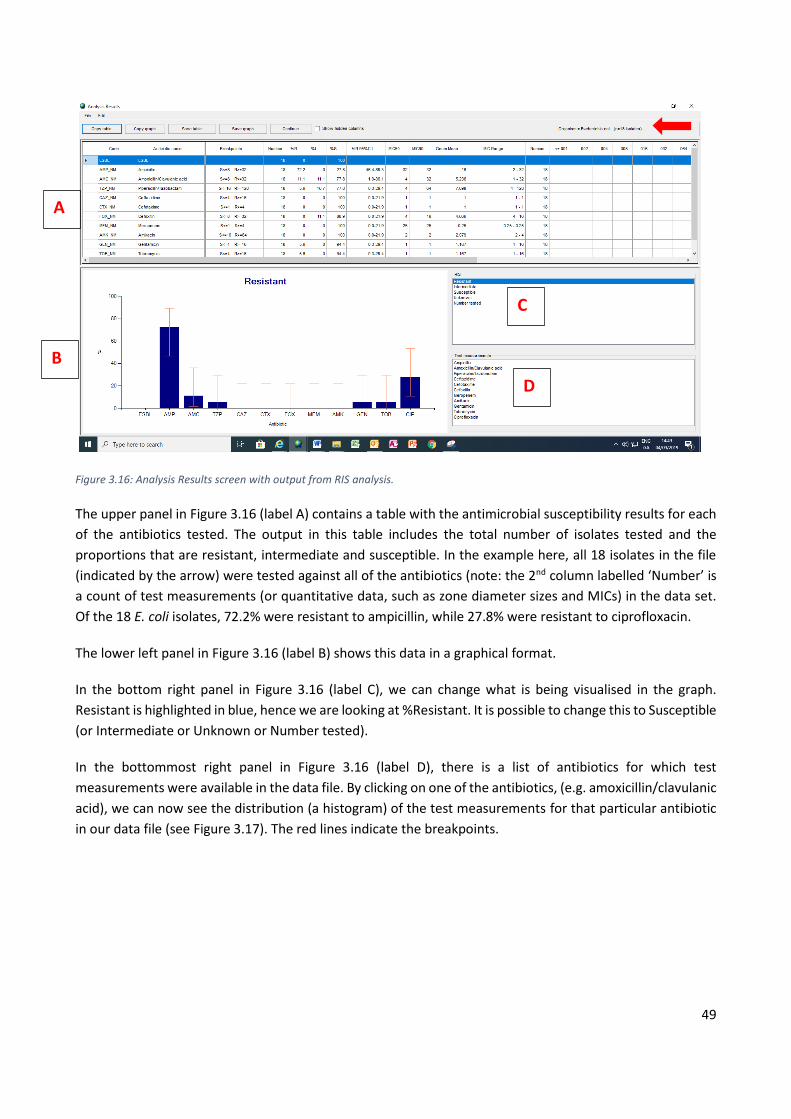
Figure 3.16: Analysis Results screen with output from RIS analysis.
The upper panel in Figure 3.16 (label A) contains a table with the antimicrobial susceptibility results for each
of the antibiotics tested. The output in this table includes the total number of isolates tested and the
proportions that are resistant, intermediate and susceptible. In the example here, all 18 isolates in the file
(indicated by the arrow) were tested against all of the antibiotics (note: the 2nd column labelled ‘Number’ is
a count of test measurements (or quantitative data, such as zone diameter sizes and MICs) in the data set.
Of the 18 E. coli isolates, 72.2% were resistant to ampicillin, while 27.8% were resistant to ciprofloxacin.
The lower left panel in Figure 3.16 (label B) shows this data in a graphical format.
In the bottom right panel in Figure 3.16 (label C), we can change what is being visualised in the graph.
Resistant is highlighted in blue, hence we are looking at %Resistant. It is possible to change this to Susceptible
(or Intermediate or Unknown or Number tested).
In the bottommost right panel in Figure 3.16 (label D), there is a list of antibiotics for which test
measurements were available in the data file. By clicking on one of the antibiotics, (e.g. amoxicillin/clavulanic
acid), we can now see the distribution (a histogram) of the test measurements for that particular antibiotic
in our data file (see Figure 3.17). The red lines indicate the breakpoints.
A
B
C
D

50
Figure 3.17: Histogram with breakpoints.
Tables and charts can easily be copied and pasted into Word or Excel files.
For more information on the RIS analysis type, please refer to the main manual.
3.2.3 Resistance profile
In this type of analysis, we want to look at the resistance profiles of all isolates in our data set. For this, it is
important to set up profiles for various pathogens under surveillance. Resistance profiles can be visualised in
a simple table or on a graph.
A resistance profile is basically a list of antibiotics to which the organism is resistant: the antibiotics included
in the resistance profile should be those that are tested against all isolates of the organism. Resistance
profiles can be set up in one of two ways:
1. In the ‘Laboratory configuration’ – go to the main WHONET screen, select ‘Modify laboratory’, then click
on ‘Antibiotics’, followed by ‘Profiles’. Highlight the organism group for which you want to create a
profile, then click on ‘Edit’. See Figure 3.18.

51
Figure 3.18: Antibiotic profiles.
Select key antibiotics (from the ‘Local antibiotic list’ on the right; these are antibiotics that you have
configured for your laboratory) to appear in the ‘Profile antibiotics’ panel on the upper right and any
additional ones to appear in the ‘Supplementary antibiotics’ panel on the lower right (these will not appear
in the profile, but will be included in the line-listing). See Figure 3.19.

52
Figure 3.19: Edit antibiotic profiles.
Once you are finished, click ‘Save changes’, then ‘Ok’, ‘Ok’ and ‘Save’.
2. In the ‘Analysis selection’ screen – once you have selected ‘Resistance profiles’ as the Analysis type, an
option appears in the lower part of the screen to ‘Edit profiles’. Proceed as outlined in 1. above but note
that resistance profiles created here are only temporary. Update the laboratory configuration for
permanent resistance profiles.
To perform this analysis on E. coli isolates in our test lab 058 (CAESAR Hospital No.3), make the selections as
indicated in the ‘Data analysis’ and the ‘Analysis Selection’ screens below (Figure 3.20 and Figure 3.21). Click
on ‘Begin analysis’.
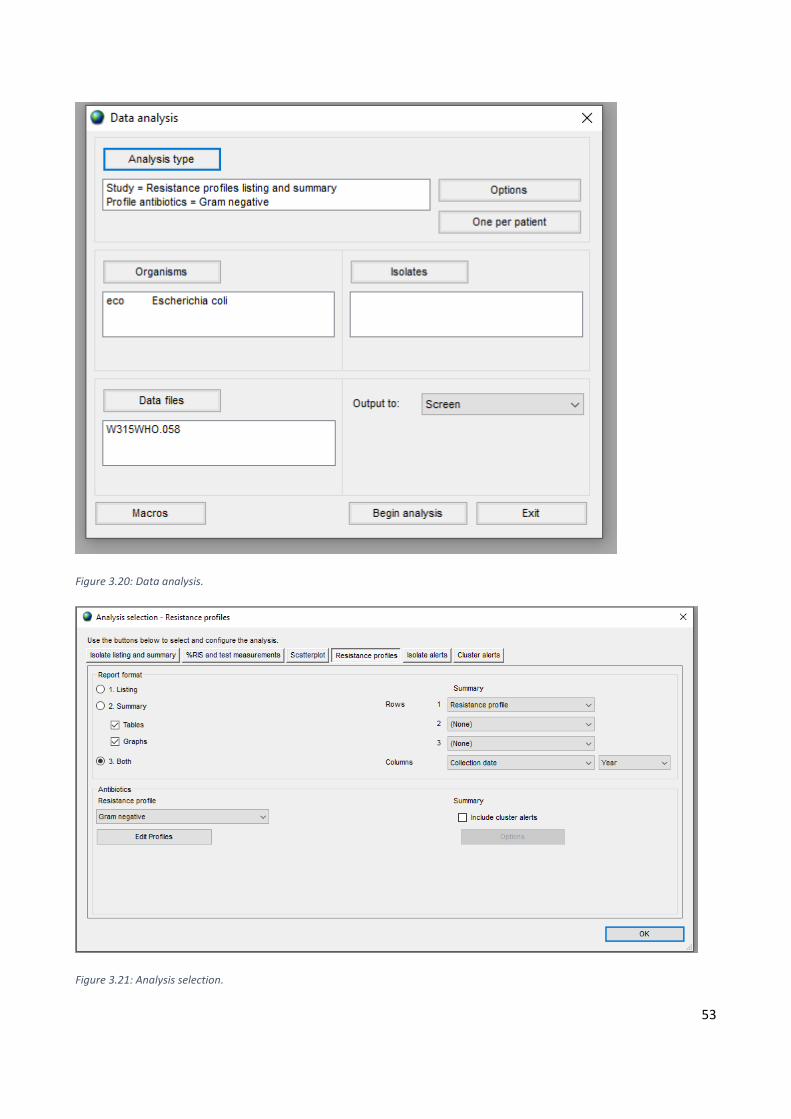
53
Figure 3.20: Data analysis.
Figure 3.21: Analysis selection.

54
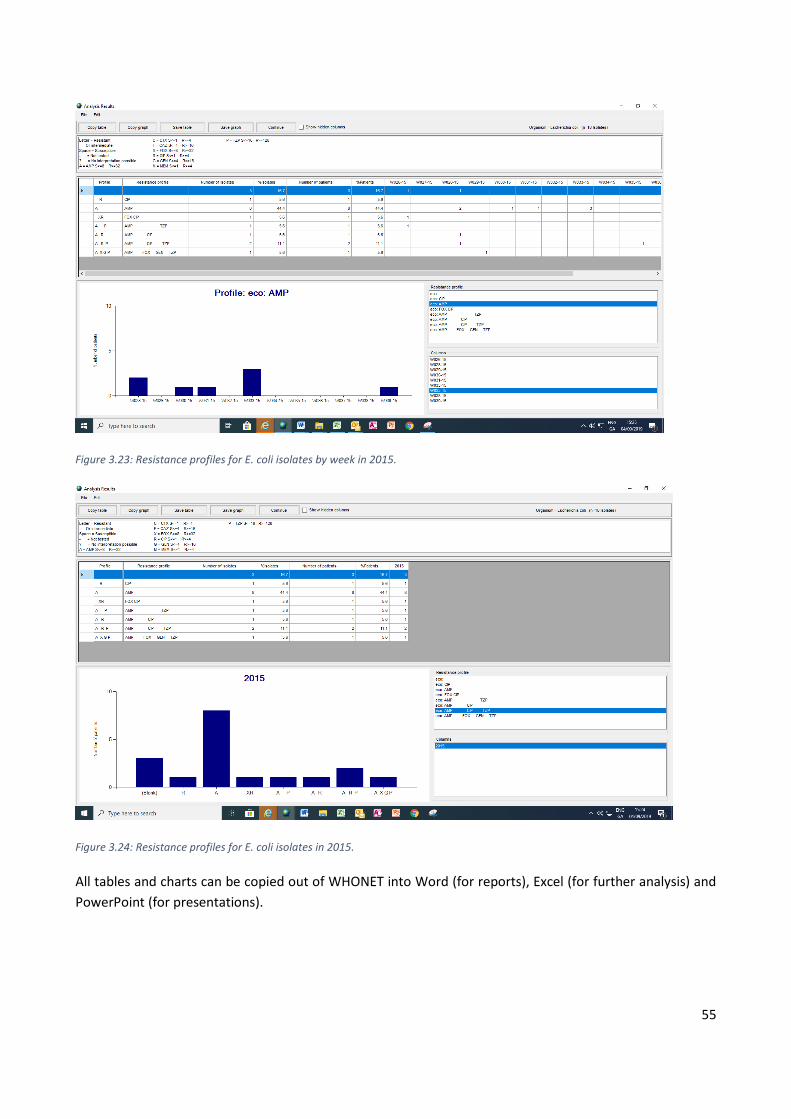
The first part of the analysis will return a line-listing (as the ‘Report format’ selected was for both a listing
and a summary). This includes two additional columns with the resistance profile: ‘Profile’ uses one-letter
antibiotic codes (see Figure 3.22 label A), while ‘Resistance profile’ uses the standard three-letter antibiotic
codes used in WHONET (see Figure 3.22 label B). The isolates in the line-listing are sorted from least to most
resistant.
Figure 3.22: Line listing with resistance profiles.
The second part of the analysis will return the summary data with the isolates aggregated in a table according
to their resistance profile, again from least to most resistant. The aggregate data are presented graphically
in Figure 3.23 and Figure 3.24.
• Highlight a particular Resistance profile (AMP FOX GEN TZP in Figure 3.23) to see graphically the
distribution of all isolates with this profile over the whole time frame in the dataset being analysed
• Highlight a particular month to see graphically all profiles identified in the dataset being analysed during
this time period
A B
55
Figure 3.23: Resistance profiles for E. coli isolates by week in 2015.
Figure 3.24: Resistance profiles for E. coli isolates in 2015.
All tables and charts can be copied out of WHONET into Word (for reports), Excel (for further analysis) and
PowerPoint (for presentations).
56
4 Exporting WHONET files to the CAESAR format
Preparing CAESAR data that is already in WHONET to send to the national data
manager
This section applies to local data managers. For national data managers refer to section 4.2.
If your data file only contains CAESAR data for one quarter/year (i.e. there is no other data, including data
associated with other pathogens, specimen types, quarters) then:
• Go to the location on your network drive where your WHONET data files are stored
• Make a copy of the correct file. For example, a file labelled ‘W415WHO.065’ will be ‘W415WHO –
Copy.065’
• You may need to open up this file using WHONET to remove patient names (First names and Last names),
to add in any additional information that has become available, such as MIC or serotype results or an
important comment regarding an isolate
• When you are happy that the file is ready to send to your National Data Manager:
• Encrypt a copy of the file using a software such as Axcrypt, Winzip, etc. (Optional, but recommended
from a data security perspective: if in doubt, consult with your local IT department and your national
data manager)
• Attach the (encrypted) file to an email and send
If your data file contains AMR data for your whole laboratory (i.e. there is data other than that for CAESAR,
i.e. including other pathogens and specimen types) and for a time period exceeding that which you are
interested in (e.g. data relates to five-years but you only want the last year’s data) then:
• Open WHONET and go to ‘Data analysis’ from the main WHONET screen
• From the ‘Analysis type’, select ‘Isolate listing’
• Click on ‘One per patient?’, select ‘By patient’ and ‘First isolate with antibiotic results’ and then click on
‘OK’
• Click on ‘Organisms’ and select the eight pathogens under surveillance (3-letter codes: sau, spn, eco, efa,
efm, kpn, pae and AC-, the latter in capitals captures all species of Acinetobacter)
• Click on ‘Isolates’ and highlight specimen type. Double-click to bring up the ‘Isolates’ selection screen.
Enter the codes for blood (bl) and CSF (sf). By default, the button for ‘Include’ is selected so only these
specimen types will be returned in this analysis. Click ‘OK’ and then ‘OK’ again
Click on ‘Data files’ to select the data file or files containing the data of interest (you can go to the default
or navigate to the file location)
• The ‘Output to’ is to the screen by default
• Click on ‘Begin analysis’ and check the output on the screen to make sure it is showing the required data
• Change ‘Output to’ to WHONET 5 (Dbase) and give the new file that you are about to create a meaningful
name, e.g. CAESAR2015Q3-4.065 (remember to include the suffix with the lab’s code: in this example,
‘.065’)
• Click on ‘Begin analysis’
57
• The new file will be created. The location of this new file will be in default location for output files from
WHONET (either in C:\WHONET5\output OR on a network location that you have previously chosen –
see section 2.4.6).
Preparing data in WHONET to send to the international CAESAR data manager
This section applies to national data managers.
Create a National Configuration ‘laboratory’ in WHONET, giving this a Laboratory Code distinct from any of
the Laboratory Codes used nationally in your CAESAR surveillance network. In the example below, there are
two laboratories in the national network CAESAR General Hospital (lab code 065) and CAESAR Hospital No.3
(lab code 058). The national configuration is given the laboratory name ‘CAESAR National Configuration’ with
the lab code ‘WH1’.
Depending on the volume of data a country has, it might be preferable to create different CAESAR national
configuration files for each of the pathogen groups:
e.g.
LAB NAME LAB CODE
CC-CAESAR-SAU CC1
CC-CAESAR-ECO-KPN CC2
CC-CAESAR-EFA-EFM CC3, etc.
Each of the above configurations will only contain the specific antibiotics required for that particular
pathogen/group of pathogens. Note: CC above refers to Country code, e.g. UZ = Uzbekistan.
It is important that the national configuration file includes all of the relevant antibiotic combinations from
each of the laboratories. For example, one laboratory might test for MRSA in S. aureus using a cefoxitin disk
while another might test for MRSA using an oxacillin Etest or MIC; therefore, both cefoxitin and oxacillin will
need to be included in the national configuration.
Steps for combining data files at the national level for sending to CAESAR:
• In WHONET, open the laboratory with your national configuration, in our example this is the ‘CAESAR
National Configuration’ (lab code = WH1)
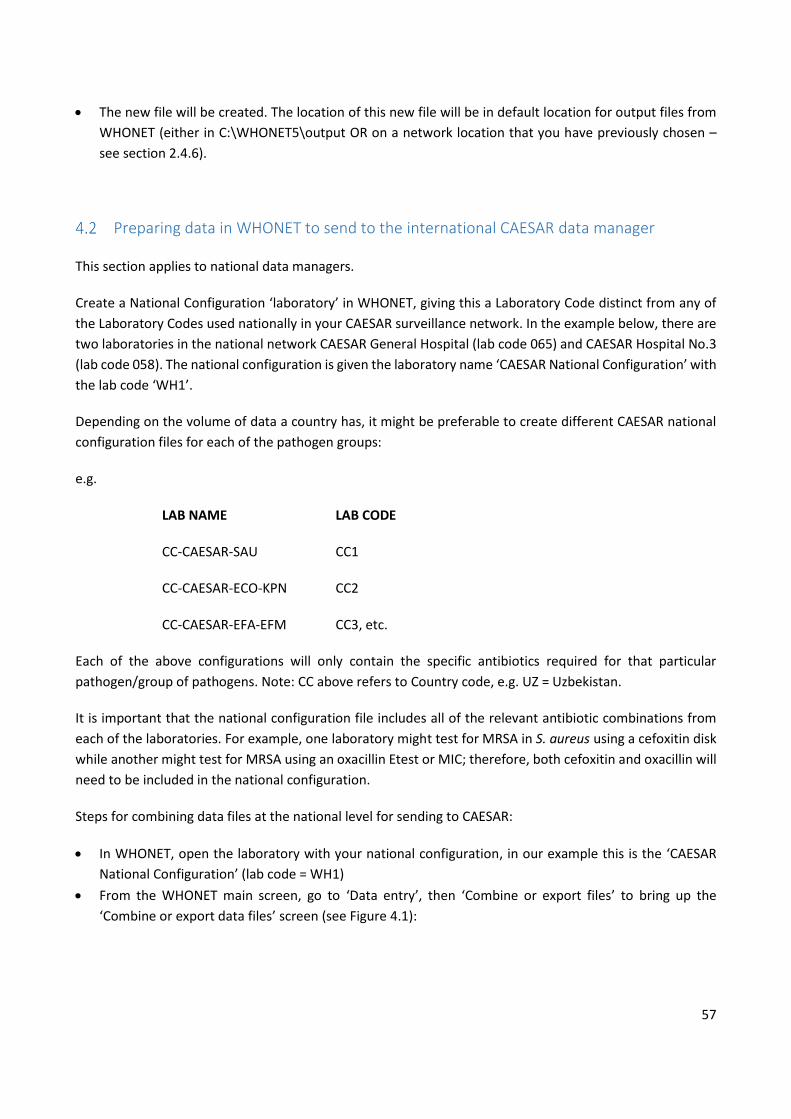
• From the WHONET main screen, go to ‘Data entry’, then ‘Combine or export files’ to bring up the
‘Combine or export data files’ screen (see Figure 4.1):
58
Figure 4.1: Combining datasets.
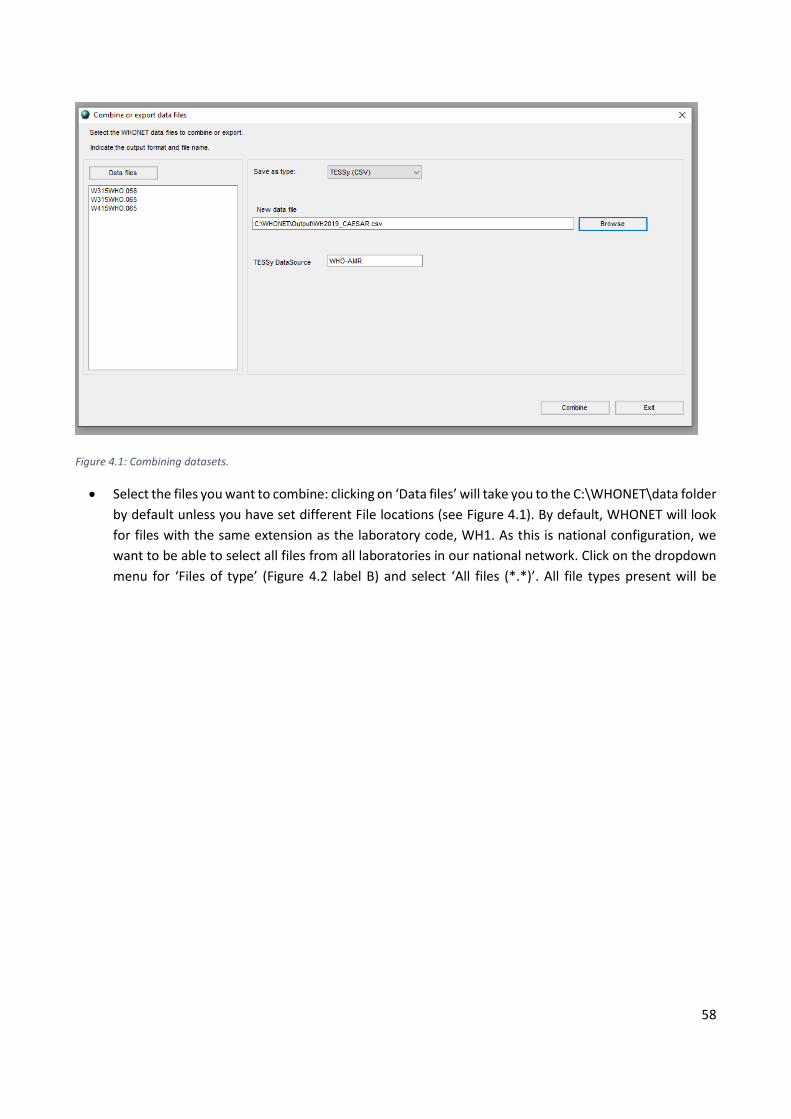
• Select the files you want to combine: clicking on ‘Data files’ will take you to the C:\WHONET\data folder
by default unless you have set different File locations (see Figure 4.1). By default, WHONET will look
for files with the same extension as the laboratory code, WH1. As this is national configuration, we
want to be able to select all files from all laboratories in our national network. Click on the dropdown
menu for ‘Files of type’ (Figure 4.2 label B) and select ‘All files (*.*)’. All file types present will be

59
returned in the panel on the left (Figure 4.2 label A). Select all of these and double-click to bring them
across to the panel on the right, ‘Files for data analysis’ (Figure 4.2 label C). Click ‘OK’.
Figure 4.2: Selecting files.
B
A C
60
Figure 4.3: Selecting files (all types).
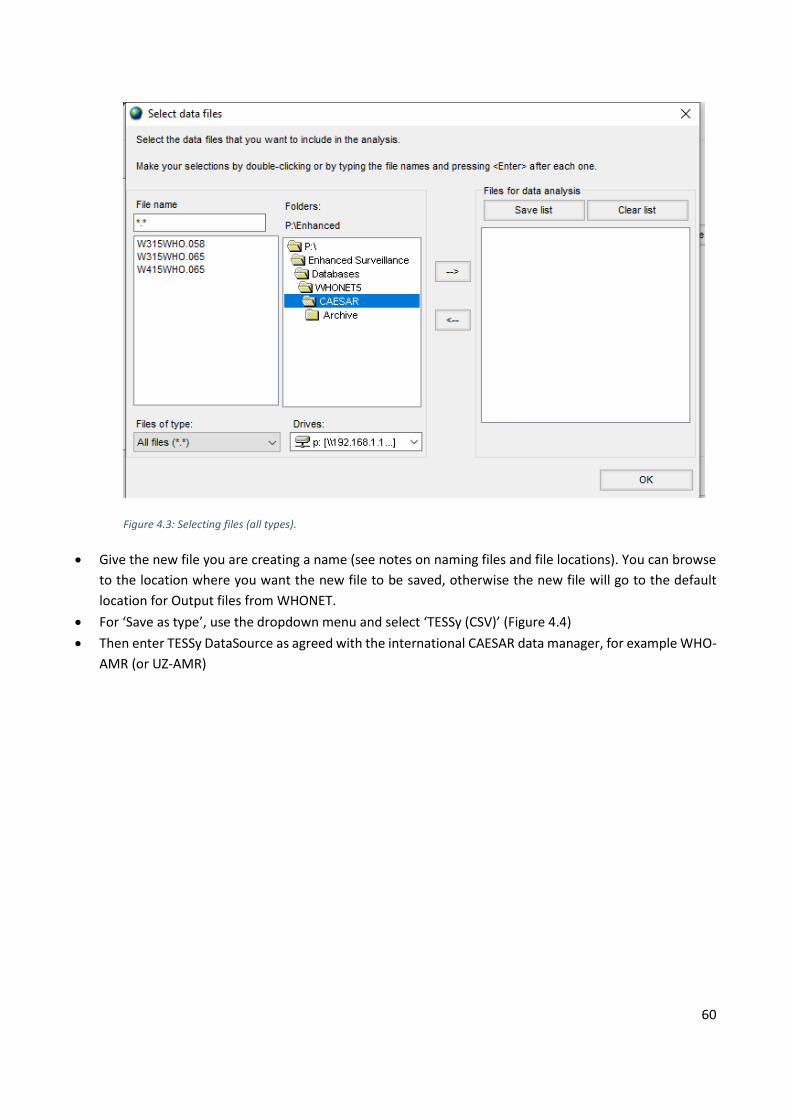
• Give the new file you are creating a name (see notes on naming files and file locations). You can browse
to the location where you want the new file to be saved, otherwise the new file will go to the default
location for Output files from WHONET.
• For ‘Save as type’, use the dropdown menu and select ‘TESSy (CSV)’ (Figure 4.4)
• Then enter TESSy DataSource as agreed with the international CAESAR data manager, for example WHO-
AMR (or UZ-AMR)
61
Figure 4.4: Selecting output type.
• Click ‘Combine’
• You could get a message saying that the files were successfully combined. Click ‘OK’ to continue
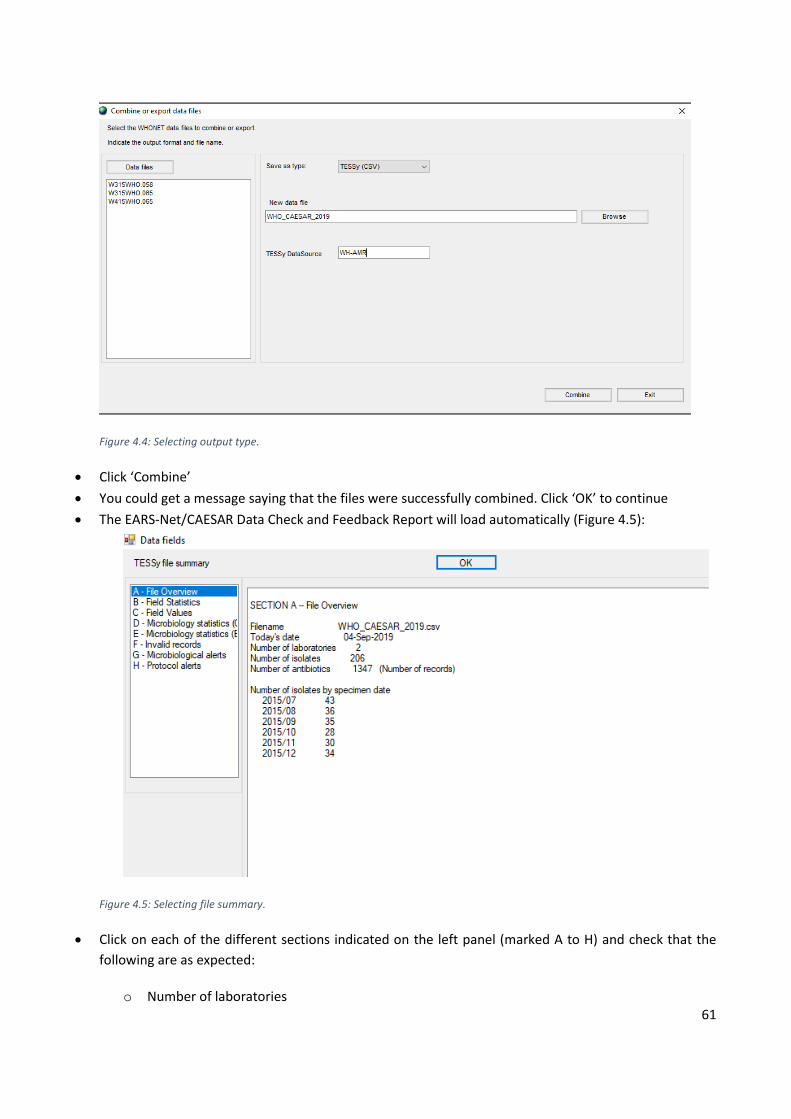
• The EARS-Net/CAESAR Data Check and Feedback Report will load automatically (Figure 4.5):
Figure 4.5: Selecting file summary.
• Click on each of the different sections indicated on the left panel (marked A to H) and check that the
following are as expected:
o Number of laboratories
62
o Number of isolates
o Date range
o No missing data fields that are mandatory
o Microbiology statistics (Overall)
o Microbiology statistics (By laboratory)
o Invalid fields
o Microbiological alerts
o EARS-Net/CAESAR protocol alerts
• Make corrections to the original data files if required and then re-combine as above and review the Data
Check and Feedback Report again until you are happy the data are ready to send to the international
CAESAR data manager.
Dealing with problems with WHONET/BacLink
Local users in a country: Any general problems with WHONET, i.e. you are not sure how to do something:
contact your national data manager.
Encountering potential bugs in the software: contact the developers of WHONET, but check with your
national data manager first as there may not be a bug or they may already be aware of the issue and the
developers have already been contacted.
National data managers: Any general problems with WHONET, i.e. you are not sure how to do something:
contact your CAESAR colleagues with known expertise or the developers of WHONET.
Encountering bugs in the software: contact the developers of WHONET (they will get back to you but they
may need a reminder if no response).

63
5 Data validation
After you have analysed your data in WHONET there are a few things you can look at to catch errors or
missing data.
Species Does your data file contain all the species you expect?
o Make sure that any missing species were in the original file and that they
were translated correctly if BacLink was used, or if the species was selected
when exporting from the original file into CAESER data file.
Antibiotics Does your data file contain all the antibiotics you expect?
o Make sure that the missing antibiotics were in the original file.
o Check that the antibiotic codes are translated correctly in BacLink and make
sure that they have been added to the laboratory configuration in WHONET.
Number of
tested
isolates
Does the number of isolates match what you would expect for this period of time?
o If you have a lot less isolates maybe some isolates are missing?
o If you have a lot more isolates compared to a similar time period maybe you
were missing some isolates in the previous time period?
In both cases it could also be due to a change in sampling so ask the laboratory
if they can explain any big differences. Also see ‘Sample dates’ below.
Duplicates Does your file contain duplicate isolates of a particular organism from a single
patient?
o If so, you will need to re-do your analysis (see section 3) to include one isolate
(of a species) per patient (first isolate only).
Sample
dates
Does your data file contain isolates with a sample date not included in the time
period under surveillance?
o If so, remove the isolates or disregard them during analysis.
o Make sure that you have isolates from the whole time period under
surveillance. If you had 75 isolates in January and 92 in February it is unlikely
(but not impossible) that you only had 3 in March.
o If for some reason the laboratory adds a new code for a certain antibiotic
during the year, make sure that both the original and the new code is
exported from the laboratory information system. If only the original code is
exported you will miss the test results for this drug after the date of change.
If only the new code is exported you will miss results prior to the date of
change.

64
Resistance
levels
Do the levels of resistance for all drug/bug combinations match what you have
previously seen in your country or laboratory?
o If not, does it seem likely that the difference reflects a true change in
antibiotic resistance levels or could it be due to an error?
Since the resistance level is the percentage of resistant isolates of all tested isolates, an error
in either the number of resistant isolates or the total number of isolates will influence the
reported level of resistance. An unusually high level of resistance could therefore be due too
many resistant isolates or a too low total number of isolates.
If a certain resistance level is unusually high, consider what you are using as a denominator.
Normally you would use the number of tested isolates as the denominator. Ideally all isolates
are susceptibility tested for all relevant drugs and if this is the case your number of tested
isolates will be identical to the total number of isolates. But in reality this is not always the
case. If all isolates are not susceptibility tested you need to consider whether or not the
tested isolates are representative for the population you are trying to describe in your
analysis. If 90% of all isolates are susceptibility tested they are most likely representative.
Fifty or even 10% may be representative, but it depends on how the isolates are selected for
susceptibility testing. If only a few isolates are susceptibility tested based on a suspicion of a
certain resistance you may risk overestimating the resistance level dramatically.
Example: The laboratory has isolated 100 Streptococcus pneumoniae. As a screening for
penicillin resistance all of the isolates are tested with an oxacillin disk. Ten of the isolates are
resistant to oxacillin. These 10 isolates are then tested for penicillin resistance using the MIC
method. Of the 10 ten isolates tested for penicillin resistance only one turns out to be
resistant. If you were to report the penicillin resistance in S. pneumoniae it would make sense
to look in your database and say ‘Of the 10 isolates tested for penicillin one isolate was
resistant therefore the resistance level is 1/10 = 10%’. But in reality it is one of the total 100
isolates that is resistant so the result should be 1/100 = 1%. So be careful if only a limited
number of isolates are selected for susceptibility testing for a particular drug.
65
6 Submitting your data to CAESAR
When you have validated your data and exported them to a csv file in the CAESAR format you are ready to
submit your data to CAESAR. This is done by sending your csv file by email to CAESAR’s international data
manager: [email protected]. If your data file is very big you may encounter problems with the maximum
attachment size in some email systems. Even if the file is within the limit it may take a while to send it by
email depending on your internet connection speed. In this case consider compressing the file using a file
compression program. In Windows you can easily compress your data file by right-clicking the file, clicking
‘Send to’ and then ‘Compressed (zipped) Folder’. This should reduce the size of the file by about 90%.
When the international CAESAR data manager has received your data file, the data will be checked by a
program that generates a small report that summarizes the findings in your data. This feedback report will
be send to you for approval. You should go through this feedback report and check if the numbers look
credible. If everything looks OK you should reply to the international CAESAR data manager that everything
appears to be in order and that you approve the data. If you find errors or something just doesn’t look right,
you can try to find the error in your data yourself or you can ask the international CAESAR data manager if
he can find any errors. When you have approved your data the international CAESAR data manager will add
them to the CAESAR database and your data will be ready for publication. You have now finished the
submission of your CAESAR data.
66
7 Data security
This section is concerned with anonymization of patient information, backing up your data, keeping data on
network drives instead of PC desktop, encryption etc.
It is of utmost importance to safeguard a patient’s privacy and in this regard security measures must be taken
to protect the confidentiality of laboratory data. Laboratories are responsible for putting policies and
procedures in place to assure confidentiality of patient information. The personal information of patients is
not needed for CAESAR such as name, surname, citizenship number, address, phone number, etc. However,
unique identifiers in addition to some basic demographic data (e.g. age and sex for epidemiological purposes)
are required, but this is anonymized before submission to CAESAR.
Also it is important to establish a means to protect against loss of data. It is a good idea to keep the CAESAR
data on a network drive which is backed up regularly and is authorized just for the national surveillance team
instead of keeping the data on your local hard drive. This way you won’t lose your data if your hard drive
breaks down. You can ask to your IT department for assistance.
It is important to establish a means to protect against loss of data. As a national data manager always keep
the original data you received for an agreed period after data collection (e.g. 5 years).
If you need to send data that contains identifiable patient information e.g. to your national data manager
you should consider encrypting your data. You can either encrypt the data file or send it in an encrypted
email. Talk to your local IT department and national data manager about this.
Annex 1 BacLink
A1.1 Setting up BacLink
A1.1.1 Formats and structures
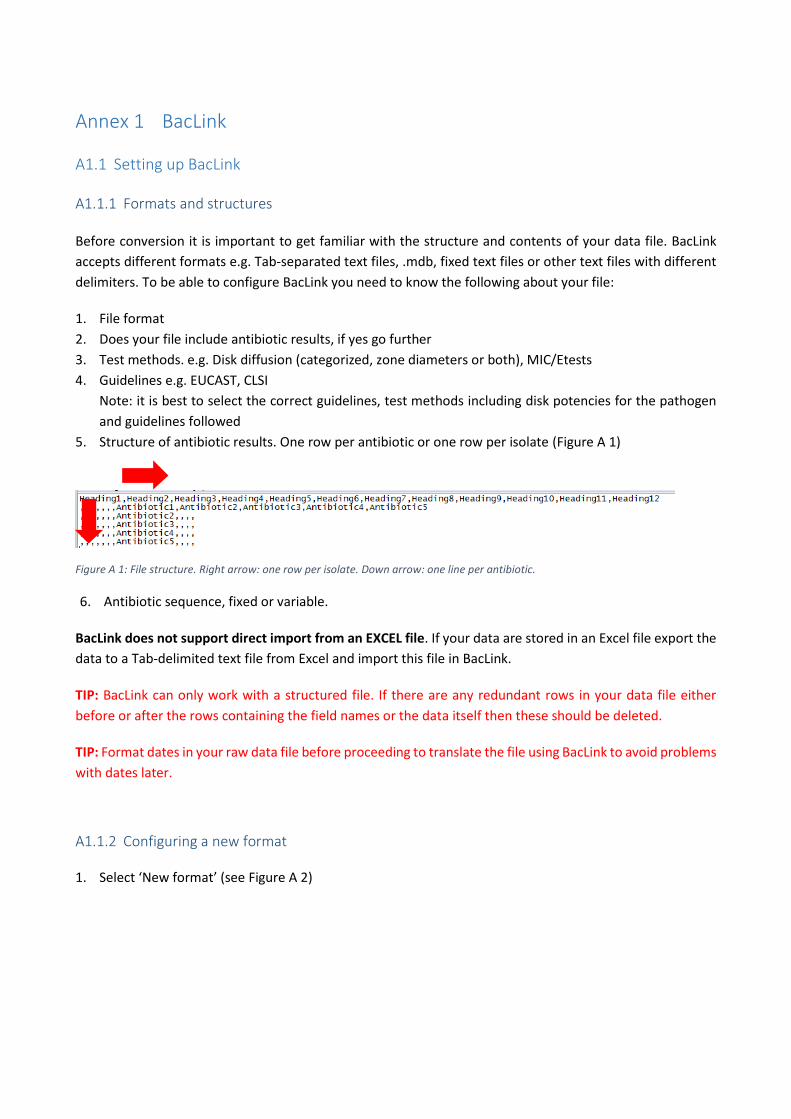
Before conversion it is important to get familiar with the structure and contents of your data file. BacLink
accepts different formats e.g. Tab-separated text files, .mdb, fixed text files or other text files with different
delimiters. To be able to configure BacLink you need to know the following about your file:
1. File format
2. Does your file include antibiotic results, if yes go further
3. Test methods. e.g. Disk diffusion (categorized, zone diameters or both), MIC/Etests
4. Guidelines e.g. EUCAST, CLSI
Note: it is best to select the correct guidelines, test methods including disk potencies for the pathogen
and guidelines followed
5. Structure of antibiotic results. One row per antibiotic or one row per isolate (Figure A 1)
Figure A 1: File structure. Right arrow: one row per isolate. Down arrow: one line per antibiotic.
6. Antibiotic sequence, fixed or variable.
BacLink does not support direct import from an EXCEL file. If your data are stored in an Excel file export the
data to a Tab-delimited text file from Excel and import this file in BacLink.
TIP: BacLink can only work with a structured file. If there are any redundant rows in your data file either
before or after the rows containing the field names or the data itself then these should be deleted.
TIP: Format dates in your raw data file before proceeding to translate the file using BacLink to avoid problems
with dates later.
A1.1.2 Configuring a new format
1. Select ‘New format’ (see Figure A 2)

68
Figure A 2: Create new format.
2. Select Country from the drop down box, enter a laboratory name and enter up to 3 characters for the
Laboratory code. The laboratory code (assigned by your national data manager; the format will be in
accordance with that recommended by CAESAR, i.e.3-digits) will be used in BacLink and in WHONET as
the default file extension for your WHONET data files. See Figure A 3.
Figure A 3: Select country and assign laboratory code.
3. Click on ‘File structure’, a new window labelled ‘File structure’ pops up. Select your File structure and
delimiter from the dropdown menu. Enter File location and File name. In this example our file is a tab-
separated text file. See Figure A 4.
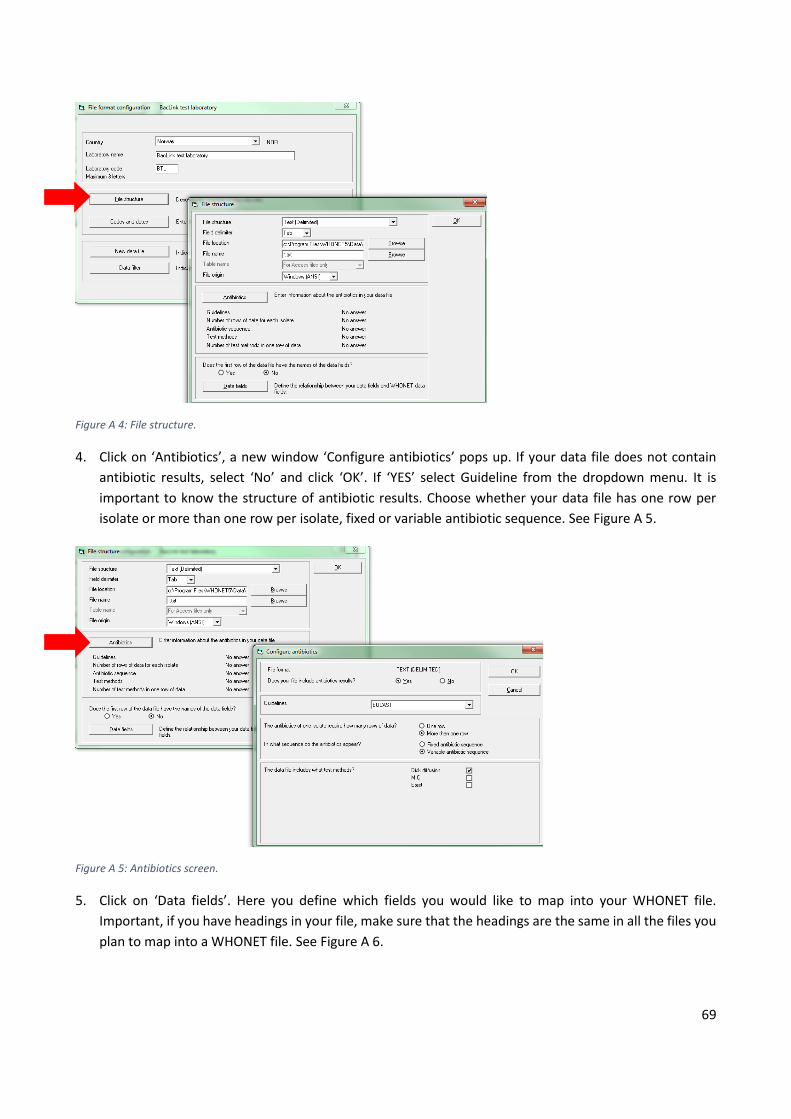
69
Figure A 4: File structure.
4. Click on ‘Antibiotics’, a new window ‘Configure antibiotics’ pops up. If your data file does not contain
antibiotic results, select ‘No’ and click ‘OK’. If ‘YES’ select Guideline from the dropdown menu. It is
important to know the structure of antibiotic results. Choose whether your data file has one row per
isolate or more than one row per isolate, fixed or variable antibiotic sequence. See Figure A 5.
Figure A 5: Antibiotics screen.
5. Click on ‘Data fields’. Here you define which fields you would like to map into your WHONET file.
Important, if you have headings in your file, make sure that the headings are the same in all the files you
plan to map into a WHONET file. See Figure A 6.

70
Figure A 6: Selecting data fields.
TIP: It is a good idea to check the mapping each time you want to convert a file using a BacLink file format
already configured, especially important if you only rarely use BacLink. This is particularly useful for new users
who are not fully familiar with their file formats. If the field names change even very slightly from one file to
another then BacLink will not recognise the new field name, no mapping will take place and your newly
created WHONET data file will be missing data.
6. For the CAESAR report the following variables are required and need to be in the file. Some of the
variables will be created by WHONET. See Table A 1.

71
Table A 1: CAESAR variables.
7. After clicking ‘Select a sample data file’, the information in your file needs to be mapped to the WHONET
fields. The list on the left contains the WHONET information fields. The list on the right contains the
Tab
le 1
: Ove
rvie
w o
f th
e s
et
of
vari
able
s fo
r A
MR
su
rve
illa
nce
Var
iab
les
for
AM
R s
urv
eil
lan
ceR
eq
uir
ed
fo
r C
AES
AR
Fie
ld in
Bac
Lin
kFi
eld
nam
es
Co
mm
en
ts
Re
cord
IDN
oN
oFo
r EA
RS-
Ne
t/TE
SSy
com
pat
ibil
ity
on
ly.#
Re
cord
Typ
eN
oN
oFo
r EA
RS-
Ne
t/TE
SSy
com
pat
ibil
ity
on
ly.#
Re
cord
Typ
eve
rsio
nN
oN
oFo
r EA
RS-
Ne
t/TE
SSy
com
pat
ibil
ity
on
ly.#
Sub
ject
No
No
For
EAR
S-N
et/
TESS
y co
mp
atib
ilit
y o
nly
.#
Dat
aSo
urc
eN
oN
oFo
r EA
RS-
Ne
t/TE
SSy
com
pat
ibil
ity
on
ly.#
Re
po
rtin
gCo
un
try
Ye
sYe
sC
ou
ntr
y
Dat
eU
sed
forS
tati
stic
sY
es
Yes
Spe
cim
en
dat
e
Stat
us
No
No
For
EAR
S-N
et/
TESS
y co
mp
atib
ilit
y o
nly
.#
Lab
ora
tory
Co
de
Ye
sYe
sLa
bo
rato
ry
Spe
cim
en
Ye
sYe
sSp
eci
me
n t
ype
Pat
ien
tCo
un
ter
Ye
sYe
sId
en
tifi
cati
on
nu
mb
er
Encr
ypti
on
in W
HO
NET
Ge
nd
er
Ye
sYe
sSe
x
age
Ye
sYe
sA
geB
irth
-dat
e is
als
o a
n o
pti
on
Iso
late
IDY
es
Yes
Spe
cim
en
nu
mb
er
Ho
spit
alID
Ye
sYe
sEA
RSS
Ho
spit
al c
od
e*
Pat
ien
tTyp
eY
es
Yes
De
fin
ed
by
loca
tio
n f
ield
Ho
spit
alU
nit
Typ
eY
es
Yes
De
fin
ed
by
loca
tio
n f
ield
Pat
ho
gen
Ye
sYe
sO
rgan
ism
Dat
eO
fHo
spit
alis
atio
nN
oYe
sD
ate
of
adm
issi
on
*
Re
sult
PC
Rm
ec
No
Yes
PC
R f
or
me
cA*
Re
sult
Pb
p2a
Agg
lN
oYe
sP
BP
2a la
tex
aggl
uti
nat
ion
*
Sero
typ
eN
oYe
sSe
roty
pe
*
esb
lN
oYe
sES
BL
Re
sult
Car
bap
en
em
ase
sN
oYe
sC
arb
ape
ne
mas
e
An
tib
ioti
cY
es
Yes
An
tib
ioti
c n
ame
1B
e a
war
e o
f m
eth
od
wh
en
ch
oo
sin
g an
tib
ioti
c co
de
SIR
Ye
sYe
sA
nti
bio
tic
resu
lt 1
Cat
ego
rize
d o
r n
um
eri
c b
ase
d o
n m
eth
od
Re
sult
Zon
eSi
gnN
oYe
sFi
eld
nam
e g
ive
n b
y th
e a
b-c
od
e a
nd
inp
ut-
valu
e
Re
sult
Zon
eV
alu
eN
oYe
sFi
eld
nam
e g
ive
n b
y th
e a
b-c
od
e
Re
sult
Zon
eSI
RN
oYe
sFi
eld
nam
e g
ive
n b
y th
e a
b-c
od
e
Re
sult
MIC
Sign
No
Yes
Fie
ldn
ame
giv
en
by
the
ab
-co
de
an
d in
pu
t-va
lue
Re
sult
MIC
valu
eN
oYe
sFi
eld
nam
e g
ive
n b
y th
e a
b-c
od
e
Re
sult
MIC
SIR
No
Yes
Fie
ldn
ame
giv
en
by
the
ab
-co
de
an
d in
pu
t-va
lue
Re
sult
Ete
stSi
gnN
oYe
sFi
eld
nam
e g
ive
n b
y th
e a
b-c
od
e a
nd
inp
ut-
valu
e
Re
sult
Ete
stV
alu
eN
oYe
sFi
eld
nam
e g
ive
n b
y th
e a
b-c
od
e
Re
sult
Ete
stSI
RN
oYe
sFi
eld
nam
e g
ive
n b
y th
e a
b-c
od
e a
nd
inp
ut-
valu
e
Dis
klo
adN
oYe
sFi
eld
nam
e g
ive
n b
y th
e a
b-c
od
e
Re
fere
nce
Gu
ide
lin
esS
IRN
oYe
sFi
eld
nam
e g
ive
n b
y th
e a
b-c
od
e
* C
an b
e a
dd
ed
fro
m t
he
"M
od
ify
the
list
of
dat
a fi
eld
s"
# N
ot
curr
en
tly
in u
se f
or
CA
ESA
R

72
information fields in your data file. Click the WHONET field name and the field in your file that you want
to map to it. When the two fields are highlighted click the ‘=‘ button between the two lists to map the
codes. Make sure that all of the required variables are included in the mapping. Be aware of the date
formats before clicking ‘=‘ in order for the dates to be correct. See Figure A 7.
Figure A 7: Mapping variables.
8. Some fields will not be available in the default list. Click ‘Modify list of data fields’(see Figure A 7 arrow).
If the field you would like to include exist in the list but are not visible tick ‘Display in list’ for the one you
would like to include. If the field doesn’t exist click ‘Modify list’ and choose the field based on your data
you would like to include and click ‘Ok’. See Figure A 8.
Figure A 8: Modify list of variables.

73
9. After finalizing all the mappings click ‘OK’ and ‘OK’ (see Figure A 9).
Figure A 9: Finalize mapping.
10. Click on ‘Codes and Dates’. Select your date formats, abbreviations for RIS, Sex and change your locations
for codes. After finalizing click ‘OK’. See Figure A 10.
Figure A 10: Codes and dates screen.
11. Click on ‘Save as’ and give your configuration file a name. This file needs to be located in the same folder
as the BacLink.exe file. After saving click ‘Exit’. See Figure A 11.
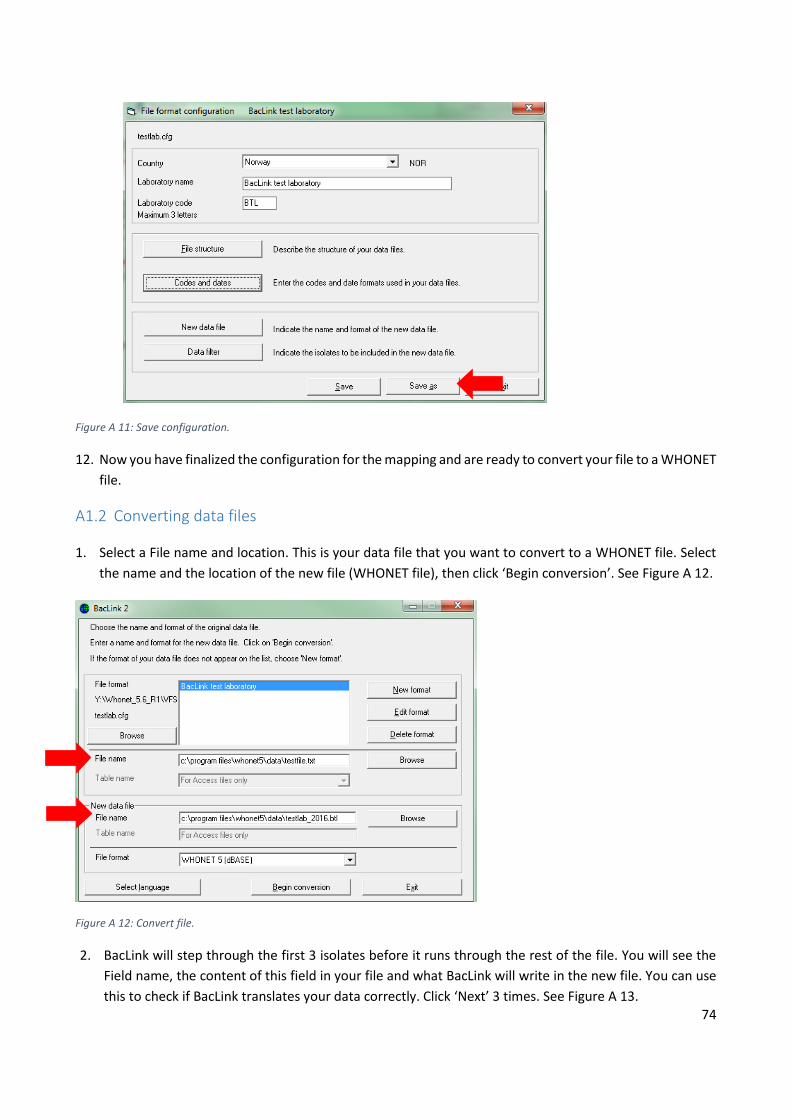
74
Figure A 11: Save configuration.
12. Now you have finalized the configuration for the mapping and are ready to convert your file to a WHONET
file.
A1.2 Converting data files
1. Select a File name and location. This is your data file that you want to convert to a WHONET file. Select
the name and the location of the new file (WHONET file), then click ‘Begin conversion’. See Figure A 12.
Figure A 12: Convert file.
2. BacLink will step through the first 3 isolates before it runs through the rest of the file. You will see the
Field name, the content of this field in your file and what BacLink will write in the new file. You can use
this to check if BacLink translates your data correctly. Click ‘Next’ 3 times. See Figure A 13.
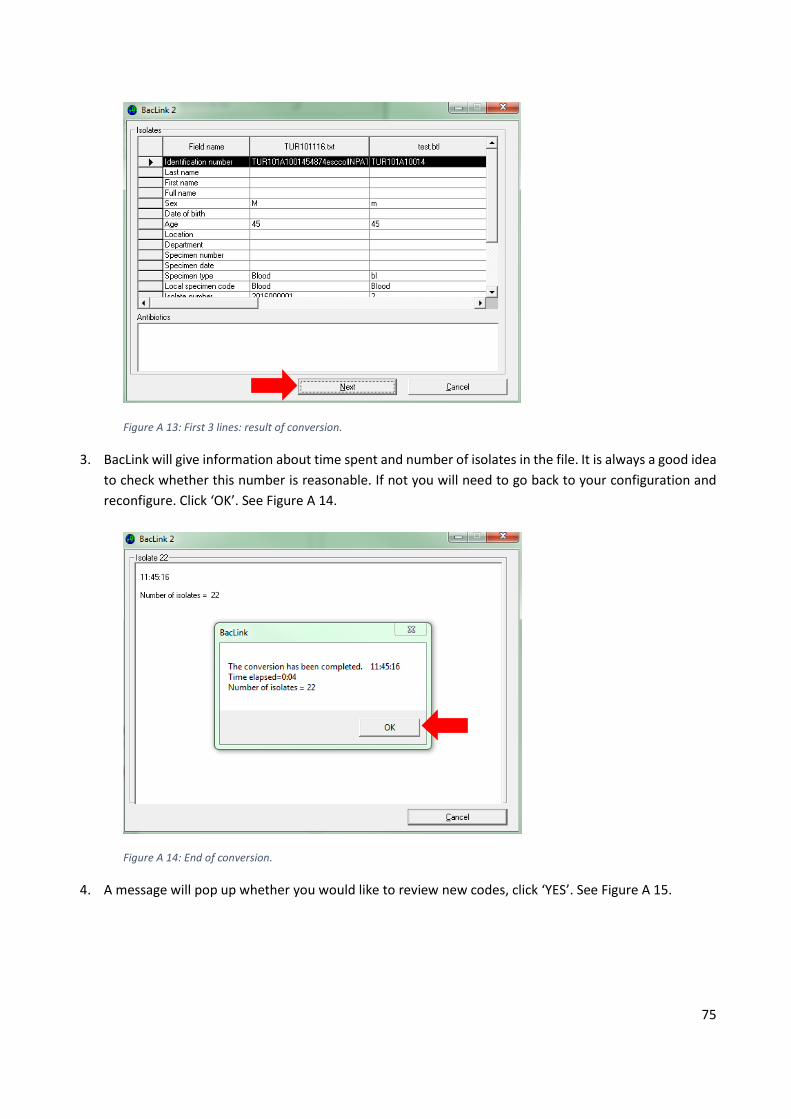
75
Figure A 13: First 3 lines: result of conversion.
3. BacLink will give information about time spent and number of isolates in the file. It is always a good idea
to check whether this number is reasonable. If not you will need to go back to your configuration and
reconfigure. Click ‘OK’. See Figure A 14.
Figure A 14: End of conversion.
4. A message will pop up whether you would like to review new codes, click ‘YES’. See Figure A 15.

76
Figure A 15: Choose to review new codes.
TIP: always click ‘Yes’ if you get this message as there may be codes that BacLink has not yet encountered
from your data files. Even if the codes from your data files are exactly the same as those used in WHONET,
BacLink will not understand any new codes until they have been mapped.
5. BacLink shows what data fields contain data codes BacLink doesn’t understand. In this case ‘Organism’
with the codes ‘esccol ‘and ‘klepne’. Click on ‘Define codes’. See Figure A 16.
Figure A 16: Unknown codes.
6. Each new code will be listed and you have to go through the list in order to explain to BacLink what the
codes mean. Select the code then click on ‘Define code’. A list of possible codes will pop up. BacLink will
narrow the search based on what you type in the ‘Search’ field. Choose one of these codes then select

77
‘OK’. Do the same with the next code until the ‘Define code’ list is empty. If more than one Data field
contain unknown codes, repeat this operation. See Figure A 17.
Figure A 17: Add codes.
7. After all the new codes are mapped and explained, redo the ‘Begin conversion’ in step 1 and the list of
new codes will be empty. Always redo the conversion after you map new codes to make sure all the
data are translated properly.
Congratulations, you are now ready to analyse your data in WHONET!