Embed Size (px)
Citation preview
Whole-genome analysis reveals molecularinnovations and evolutionary transitionsin chromalveolate speciesCindy Martens, Klaas Vandepoele, and Yves Van de Peer*
Department of Plant Systems Biology, VIB, and Department of Molecular Genetics, Ghent University, Technologiepark 927, B-9052 Ghent, Belgium
Communicated by Marc C. E. Van Montagu, Ghent University, Ghent, Belgium, December 27, 2007 (received for review October 31, 2007)
The chromalveolates form a highly diverse and fascinating assem-blage of organisms, ranging from obligatory parasites such as Plas-modium to free-living ciliates and algae such as kelps, diatoms, anddinoflagellates. Many of the species in this monophyletic groupingare of major medical, ecological, and economical importance. Never-theless, their genome evolution is much less well studied than that ofhigher plants, animals, or fungi. In the current study, we haveanalyzed and compared 12 chromalveolate species for which whole-sequence information is available and provide a detailed picture ongene loss and gene gain in the different lineages. As expected, manygene loss and gain events can be directly correlated with the lifestyleand specific adaptations of the organisms studied. For instance, in theobligate intracellular Apicomplexa we observed massive loss of genesthat play a role in general basic processes such as amino acid,carbohydrate, and lipid metabolism, reflecting the transition of afree-living to an obligate intracellular lifestyle. In contrast, many genefamilies show species-specific expansions, such as those in the plantpathogen oomycete Phytophthora that are involved in degrading theplant cell wall polysaccharides to facilitate the pathogen invasionprocess. In general, chromalveolates show a tremendous difference ingenome structure and evolution and in the number of genes theyhave lost or gained either through duplication or horizontal genetransfer.
gene gain � gene loss
The chromalveolates (1) account for about half of the recog-nized species of protists (e.g., apicomplexans and ciliates)
and algae (e.g., kelps, diatoms, and dinoflagellates), and are ofgreat ecological and economical importance. They are furthersubdivided into six diverse groups (2, 3). The Alveolata containthe parasitic apicomplexans, the plastid-less ciliates, and thedinoflagellate algae, whereas the Chromista include the cryp-tophyte, haptophyte, and stramenopile algae.
Despite general shared features, the alveolates have greatlydiverged in many respects, including host specificities, tissuetropisms, and the requirement of multiple hosts (4). The obligateintracellular apicomplexans contain several protozoan patho-gens that provoke severe diseases in mammals, including hu-mans. Infections by Plasmodium falciparum, which causes humanmalaria, and Theileria parva and T. annulata, which are respon-sible for great economic losses in cattle in Africa, have profoundmedical, social, and economic effects (5, 6). Others such asToxoplasma gondii, Cryptosporidium parvum, and C. hominis areprimarily health threats in HIV�/AIDS and immunosuppressedpopulations (7). Ciliates are unique among unicellular organismsin that they separate germline and somatic functions (8).
The haptophytes and stramenopiles share characteristics suchas tubular mitochondrial cristae, similar storage products, andfucoxanthin that suggest a specific relationship between thesetaxa (9). Stramenopiles include autotrophic and heterotrophicspecies that may differ enormously in their morphology andmode of life. Members of this group occupy key ecological nichesin marine environments. For example, the diatoms constitute themost abundant component of marine plankton. Stramenopiles
have also succeeded in occupying terrestrial environments asplant pathogens. For example, Phytophthora plant pathogensattack a wide range of agriculturally and ornamentally importantplants (10). Phytophthora sojae costs the soybean industry mil-lions of dollars each year (11). In California and Oregon, a newlyemerged Phytophthora species, P. ramorum, is responsible for adisease called sudden oak death that affects not only the live oaksthat are the keystone species of the ecosystem but also a largevariety of woody shrubs that inhabit the oak ecosystems, such asbay laurel and viburnum (12).
All extant species of the chromist and alveolate groups areconsidered to have evolved from an ancestor that contained ared algal endosymbiont (the ‘‘chromalveolate’’ hypothesis),which later gave rise to the plastids found in most of thechromalveolates. Although there is ample molecular evidencethat suggests that the alveolates and stramenopiles form amonophyletic group (13–17), the phylogenetic position of thecryptophytes and haptophytes, and their inclusion in the chrom-alveolate ‘‘superclade’’ is still debated. Recently, however, Hack-ett and colleagues (18) found additional support for the mono-phyly of the cryptophytes and haptophytes and their sisterrelationship to the chromalveolates based on a multigene datasetof nuclear genes.
Here, we have analyzed and compared 12 diverse chromal-veolate species for which whole-sequence information is avail-able. The aims of this analysis were to study the genomeevolution for these organisms and to document gene loss andgene gain along the different chromalveolate lineages. Further-more, we investigated the extent to which these events can becorrelated with the differences in lifestyle between the variousspecies.
Results and DiscussionA Parsimonious Scenario of Gene Loss and Gene Gain in the Chrom-alveolates. To study gene family evolution in this eukaryoticgroup of organisms, we assembled the publicly available proteinsequences of 12 chromalveolate and eight outgroup species. Thisresulted in a dataset of 306,696 proteins that were grouped,based on sequence similarity and Markov clustering (see Meth-ods), into 32,887 different multigene families and 58,331 or-phans—i.e., genes without homology to others in the dataset. Forall gene families, phylogenetic profiles were constructed thatreflect the presence or absence of a particular gene family in aparticular species. To make sure that an apparent gene familyabsence is not due to errors in annotation, or to increasedevolutionary rates hiding ‘‘clear’’ homology, additional analyses
Author contributions: C.M., K.V., and Y.V.d.P. designed research; C.M. and K.V. performedresearch; C.M. and K.V. analyzed data; and C.M. and Y.V.d.P. wrote the paper.
The authors declare no conflict of interest.
*To whom correspondence should be addressed. E-mail: [email protected].
This article contains supporting information online at www.pnas.org/cgi/content/full/0712248105/DC1.
© 2008 by The National Academy of Sciences of the USA
www.pnas.org�cgi�doi�10.1073�pnas.0712248105 PNAS � March 4, 2008 � vol. 105 � no. 9 � 3427–3432
EVO
LUTI
ON

were performed to see whether these two phenomena could haveseriously biased our results [see supporting information (SI)Methods]. Based on these analyses, it seems that both annotationerrors and increased evolutionary rates probably only had a veryminor effect on our results (SI Fig. 4 and SI Table 1). To be ableto study gene family evolution by means of phylogenetic profiles,information about the phylogenetic relationships between thedifferent organisms in the dataset is required. Therefore, wehave used a concatenated set of single copy core genes (20families) to resolve the phylogenetic relationships between the12 chromalveolates. After extracting these 20 families, multiplealignments were created and manually improved, and finallyconcatenated into one large multiple alignment of 5,360 aa (seeSI Methods). The inferred phylogenetic tree is shown in Fig. 1.
Combining both the species tree and phylogenetic profiles, wewere able to reconstruct a parsimonious scenario of chromal-veolate genome evolution by mapping different gene loss andgain events onto the branches of the phylogenetic tree. Further-more, to delineate the minimal gene set for the differentancestral nodes, the Dollo parsimony approach was applied (19),which assumes gene loss to be irreversible. In other words, a gene(family) can be lost independently in several evolutionary lin-eages but cannot re-evolve (except in a noticeably differentform). By applying this methodology to all phylogenetic profiles(which were treated as strings of 0 and 1; i.e., absence resp.presence of the given gene family in the given species), we couldassociate every branch of the chromalveolate tree (defined astime points or TPs) with both gene family loss and gene familyacquisition (Fig. 1). For more information regarding the per-formance of the Dollo parsimony principle on our data, see SIMethods and SI Fig. 5. To link the different evolutionary events
(i.e., loss and gain) with information about the molecularfunction or biological process the corresponding gene familiesare involved in, the Gene Ontology (GO) vocabulary was used(20). Detailed information on which genes and gene familieshave been gained or lost during chromalveolate evolution can befound at http://bioinformatics.psb.ugent.be.
One of the most notable observations is the occurrence ofmassive gene loss in the branches leading to the obligateintracellular Apicomplexa [i.e., TP11 and TP15 (Fig. 1)]. Thismassive gene loss can be linked to the transition of a free-livingto an obligate intracellular lifestyle (21). In addition, Phytoph-thora species seem to have lost a very large number of genefamilies (825 families, TP21). Although this observation seemssurprising given their large number of genes [�16,000 (Fig. 1)],this massive loss is again explained by the lifestyle of thesesuccessful plant pathogens. When we consider the functions ofthese families in both lineages (SI Table 2, TP11, TP15, andTP21), we indeed observe that these organisms have lost manygene families involved in general processes such as amino acidmetabolism, carbohydrate metabolism, and lipid metabolism.
Interestingly, the continuous loss of gene families (i.e., loss atdifferent, successive TPs) in the Apicomplexa lineage is com-pensated by a similarly continuous acquisition of novel genefamilies in this lineage. As could be expected from the lifestyleof the Apicomplexa, we observed a significant gain (q-value�0.05) of gene families involved in pathogenesis in the ancestorof the Apicomplexa (SI Table 3, TP11). Similarly, gain ofpathogenesis genes was also observed (q-value �0.05) at otherTPs within the Apicomplexa lineage (TP4, TP6, and TP7). Wealso noted a significant gain of gene families with metal-lopeptidase activity at TP6, TP7, and TP11. For the malaria
Fig. 1. A parsimonious scenario of gene loss and gene gain in the chromalveolates. At every time point (gray circles) in the chromalveolate tree (distancemethod, Poisson correction, NJ, all nodes 100% BS-supported), gene loss (red) and gene acquisition (black) was counted based on the Dollo parsimony principle.The inferred ancestral gene sets are shown in boxes. Next to every species, the number of orphans and number of predicted genes is indicated. The part of thetree drawn in solid black lines is drawn to scale; the part drawn in dashed lines is not. Detailed information on which genes and gene families have been gainedor lost at certain points in chromalveolate evolution can be obtained from a clickable map of this figure at our web site (http://bioinformatics.psb.ugent.be).
3428 � www.pnas.org�cgi�doi�10.1073�pnas.0712248105 Martens et al.
parasites (TP6), this can be explained by the fact that theyhydrolyze host proteins (hemoglobin), using acid cysteine, as-partic, and metalloproteases. Hemoglobin is thereby processedinto individual amino acids, which are subsequently used fortheir own protein synthesis (22). However, other Apicomplexahave also gained these metalloproteases, which suggests that theyalso are able to hydrolyze their host proteins and can affordloosing gene families involved in amino acid biosynthesis(SI Table 3, TP11).
Phytophthora, unlike the apicomplexans, seems to have ac-quired a huge number of novel gene families (3,458 families,TP21). We found no significant bias toward certain biologicalprocesses or functions for these newly acquired gene families,most probably because of the lack of functional annotation formany of these specific families. However, in Phytophthora ramo-rum, we observe a significant gain of gene families with potas-sium channel activity (SI Table 3, TP20), which can be explainedby the fact that potassium ions play a key role in the locomotionand encystment of the Phytophthora zoospores (23). The processof encystment is directly correlated with the oomycete patho-genicity because this process allows the zoospore to perpetuateits life cycle at the expense of the infected organism.
The ciliates, which have by far the largest number of predictedgenes (Fig. 1), have acquired many new gene families. Bothciliates show an enrichment of gene families with protein kinaseactivity and phosphotransferase activity (SI Table 3, TP12 andTP13), which is most likely correlated with the important processof exocytosis within the ciliates, because reversible proteinphosphorylation is essential in controlling exocytosis (24–26).Compared with the large number of novel gene families, thenumber of gene families in ciliates that have been lost is quitelimited (339 families, TP14).
All chromalveolates and plants are bikonts (i.e., ancestrallybiciliate, or having two cilia), this in contrast to the Metazoa andFungi, which are unikonts. However, during evolution, in allmajor eukaryote groups except the ciliates, different organismshave lost cilia and became secondary uniciliates (27). Ouranalyses indicate that among the chromalveolates, the diatoms,but also the Apicomplexa have also lost gene families responsiblefor cilium biogenesis (SI Table 2, TP18 resp. TP11), which is inconcordance with the Apicomplexa lacking cilia and (at least thecentric) diatoms (such as Thalassiosira) that became secondaryuniciliates (27).
We also investigated the fraction of the lineage-specific genefamilies for the different major chromalveolate lineages—i.e.,the alveolates (Fig. 1, TP15), Chromista (TP22), and Apicom-plexa (TP11)—that has been maintained in all extant species(i.e., lineage-specific core gene families). These gene familiesprobably contain the genes responsible for the shared, specificfeatures of these lineages. However, for the alveolates, only 5gene families of the 61 (or 8%) are still present in all extantspecies. These genes play a role in protein amino acid ADP-ribosylation, lipid metabolism, and electron transport. Withinthe Apicomplexa, 37 families (22%) of the 167 acquired familieshave been preserved. A significant fraction [q-value of 0.16,p-value �0.05 (data not shown)] of these gene families isinvolved in pathogenesis, which suggests that all Apicomplexashare a general set of pathogenicity genes. For the Chromista, 83gene families (33%) are still present in all extant species, with asignificant enrichment in prostaglandin metabolism and regula-tion of cell redox homeostasis [q � 0.37, p � 0.05 (data notshown)]. Finally, we observed a gain of 155 gene families in theancestors of the chromalveolates (TP23) of which only two havesurvived in all extant species but, unfortunately, without infor-mative gene descriptions available (i.e., hypothetical proteins).
The parsimony analysis also involves explicit reconstruction ofthe gene sets of ancestral chromalveolate genomes. Under thisapproach, 3,633 gene families were assigned to the last common
ancestor of the chromalveolate supergroup (TP23). The last com-mon ancestor of the Apicomplexa, in contrast, had the smallestnumber of gene families (i.e., 1,629), which implies that genomereduction had already occurred early in the evolution of theseparasites.
Gene Family Expansions. The results discussed so far focused onthe presence or absence of gene families but not on the actualgene family sizes. Comparing the size of all gene families makesit possible to determine whether the variations in total genenumber between the different species can, at least partially, beexplained by gene amplification in certain gene families. There-fore, we also investigated lineage-specific gene family expansionsduring chromalveolate evolution. First, the 25% most variablemultigene families were identified (see Methods). To comparethese different phylogenetic profiles, the gene copy numberswere transferred into z-scores, which are expressed as standarddeviations from their means (i.e., mean copy number over thespecies containing the gene family). This way, positive z-scoresindicate gene copy numbers that are greater than the corre-sponding mean gene family size. To be able to observe differentexpansion patterns, these z-score profiles were hierarchicallyclustered. We removed the gene families that were only ex-panded in the outgroups and the gene families only expanded inone or both of the ciliates because their massive duplicationevents (28, 29) reduce the expansion signal of the other chro-malveolates. This analysis yielded 119 gene families (see Meth-ods) (Fig. 2). Again, detailed information on these gene familiescan be found at http://bioinformatics.psb.ugent.be.
As can be observed in Fig. 2, many of the z-score profiles showPhytophthora-specific expansions. Strikingly, many of these ex-panded families are involved in degrading the plant cell wallpolysaccharides, which facilitates the pathogen invasion process.For example, the xylosidases (Fig. 2, families 259 and 842), whichhydrolyze the xyloglucan network, help the physical penetrationprocess by sufficient loosening of the host cell wall (30). Thepolygalacturonases (family 639), on the other hand, are involvedin degrading the pectin backbone embedded in the plant cellwall. Similarly, the expanded endoglucanases (family 473) andexoglucanases (family 747) are involved in the degradation ofcellulose. Moreover, the latter two enzymes are shown to bedifferentially expressed during the life cycle of the potato-pathogen Phytophthora infestans, as well as during the infectionof potatoes (31). Additionally, the �-(1, 3)-endoglucanases arecell wall-associated in P. ramorum, suggesting an important rolefor this gene family in the interaction with the host plants (32).Finally, in P. sojae, these genes were found to be specificallyexpressed during infection (33).
Another group of gene families that are expanded in thePhytophthora genomes are families involved in the protectionagainst oxidative stress, such as for example, the glutathioneS-transferases (Fig. 2, families 3403 and 990), glutaredoxin(family 3430), and the catalase-peroxidase (family 220). Thesefamilies were classified as putative pathogenicity genes by Torto-Alalibo and colleagues (33). Finally, the expansion of two othergene families can be explained by their role in the process ofpathogenesis: first, the glucokinases (family 2414) that areexpressed during the first 6 h of interaction with its host Glycinemax (34), and second, the lipases (family 845), which are alsoshown to be potentially infection related (11).
In Plasmodium spp., three families are specifically expanded (Fig.2, families 1526, 3, and 1997). One family, which is an Apicomplexa-specific gene family of trophozoite antigens R45, is only expandedin P. falciparum. This has also been observed by Schneider andMercereau-Puijalon (35), who suggested that expansion of thisfamily might contribute to P. falciparum virulence. The second genefamily, a family of erythrocyte membrane-associated antigens, isexpanded in both Plasmodium species and also plays a role in
Martens et al. PNAS � March 4, 2008 � vol. 105 � no. 9 � 3429
EVO
LUTI
ON
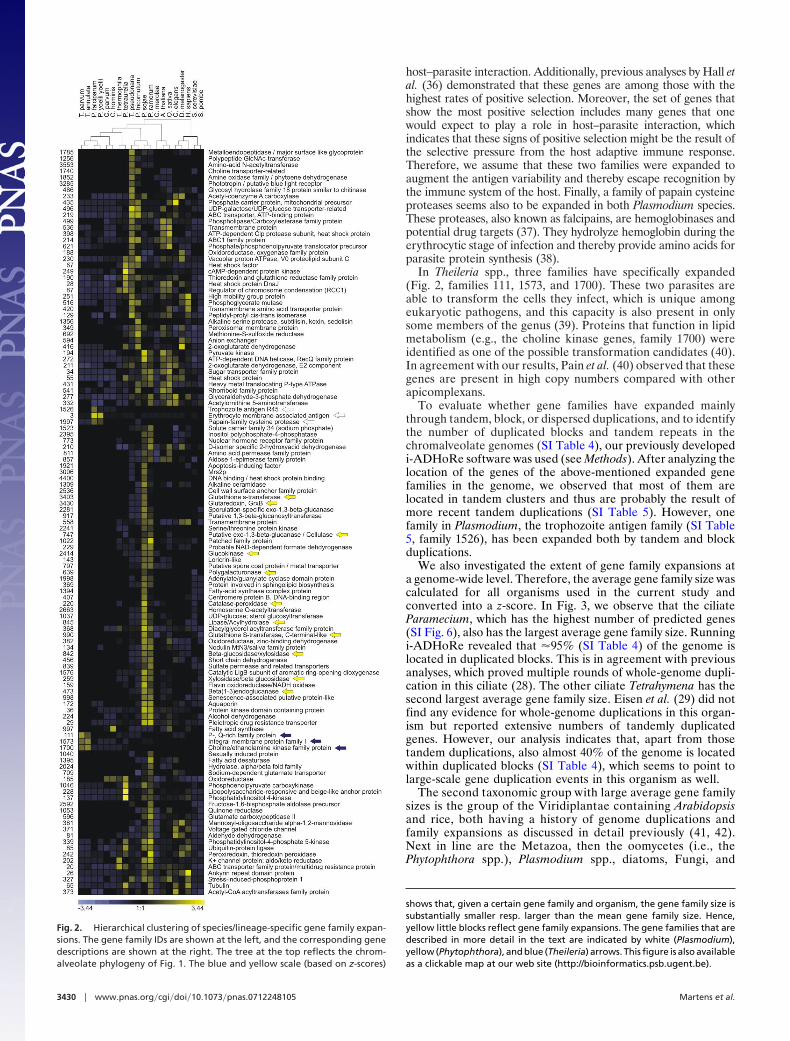
host–parasite interaction. Additionally, previous analyses by Hall etal. (36) demonstrated that these genes are among those with thehighest rates of positive selection. Moreover, the set of genes thatshow the most positive selection includes many genes that onewould expect to play a role in host–parasite interaction, whichindicates that these signs of positive selection might be the result ofthe selective pressure from the host adaptive immune response.Therefore, we assume that these two families were expanded toaugment the antigen variability and thereby escape recognition bythe immune system of the host. Finally, a family of papain cysteineproteases seems also to be expanded in both Plasmodium species.These proteases, also known as falcipains, are hemoglobinases andpotential drug targets (37). They hydrolyze hemoglobin during theerythrocytic stage of infection and thereby provide amino acids forparasite protein synthesis (38).
In Theileria spp., three families have specifically expanded(Fig. 2, families 111, 1573, and 1700). These two parasites areable to transform the cells they infect, which is unique amongeukaryotic pathogens, and this capacity is also present in onlysome members of the genus (39). Proteins that function in lipidmetabolism (e.g., the choline kinase genes, family 1700) wereidentified as one of the possible transformation candidates (40).In agreement with our results, Pain et al. (40) observed that thesegenes are present in high copy numbers compared with otherapicomplexans.
To evaluate whether gene families have expanded mainlythrough tandem, block, or dispersed duplications, and to identifythe number of duplicated blocks and tandem repeats in thechromalveolate genomes (SI Table 4), our previously developedi-ADHoRe software was used (see Methods). After analyzing thelocation of the genes of the above-mentioned expanded genefamilies in the genome, we observed that most of them arelocated in tandem clusters and thus are probably the result ofmore recent tandem duplications (SI Table 5). However, onefamily in Plasmodium, the trophozoite antigen family (SI Table5, family 1526), has been expanded both by tandem and blockduplications.
We also investigated the extent of gene family expansions ata genome-wide level. Therefore, the average gene family size wascalculated for all organisms used in the current study andconverted into a z-score. In Fig. 3, we observe that the ciliateParamecium, which has the highest number of predicted genes(SI Fig. 6), also has the largest average gene family size. Runningi-ADHoRe revealed that �95% (SI Table 4) of the genome islocated in duplicated blocks. This is in agreement with previousanalyses, which proved multiple rounds of whole-genome dupli-cation in this ciliate (28). The other ciliate Tetrahymena has thesecond largest average gene family size. Eisen et al. (29) did notfind any evidence for whole-genome duplications in this organ-ism but reported extensive numbers of tandemly duplicatedgenes. However, our analysis indicates that, apart from thosetandem duplications, also almost 40% of the genome is locatedwithin duplicated blocks (SI Table 4), which seems to point tolarge-scale gene duplication events in this organism as well.
The second taxonomic group with large average gene familysizes is the group of the Viridiplantae containing Arabidopsisand rice, both having a history of genome duplications andfamily expansions as discussed in detail previously (41, 42).Next in line are the Metazoa, then the oomycetes (i.e., thePhytophthora spp.), Plasmodium spp., diatoms, Fungi, and
shows that, given a certain gene family and organism, the gene family size issubstantially smaller resp. larger than the mean gene family size. Hence,yellow little blocks reflect gene family expansions. The gene families that aredescribed in more detail in the text are indicated by white (Plasmodium),yellow (Phytophthora), and blue (Theileria) arrows. This figure is also availableas a clickable map at our web site (http://bioinformatics.psb.ugent.be).
Fig. 2. Hierarchical clustering of species/lineage-specific gene family expan-sions. The gene family IDs are shown at the left, and the corresponding genedescriptions are shown at the right. The tree at the top reflects the chrom-alveolate phylogeny of Fig. 1. The blue and yellow scale (based on z-scores)
3430 � www.pnas.org�cgi�doi�10.1073�pnas.0712248105 Martens et al.

finally the other Apicomplexa. This order is in accordance withthe number of genes in the corresponding genomes. To ourknowledge, so far no evidence was found for whole-genomeduplications within the oomycetes, but our analyses indicatethe existence of a large number of duplicated blocks (especiallyin P. sojae), as well as a high fraction of tandem duplications(SI Table 4). This observation will need some further study. Inaddition, the pathogen Plasmodium falciparum has a consid-erable part of its genome located in duplicated blocks [i.e.,21% (SI Table 4)]. However, whereas the duplicated blocks inthe other genomes are randomly distributed over the wholegenome, in P. falciparum they seem to be preferentially locatedat the telomeres and occasionally at the centromeres (data notshown).
Origin of the Chromalveolate Orphans. Besides the set of genes thatcould be assigned to gene families, a substantial number ofgenes were uncovered that lack homologs in the eukaryoticdata set. These so-called ‘‘orphans’’ represent de novo species-specific genes, falsely predicted gene models, or genes ac-quired through horizontal gene transfer (HGT) from otherspecies (e.g., Bacteria, Viruses). To investigate the extent towhich these genes have been obtained through HGT, allorphan genes and putative species-specific families (SSFs)were compared against a nonredundant protein database.After selection of highly similar sequences [using a relative bitscore threshold (see SI Methods)], taxonomic information forall homologs was retrieved.
One first observation is that the orphans of four species (namelyboth Theileria species, Cryptosporidium parvum, and Plasmodiumfalciparum) do not show any homology with other genes at all.Whereas a small set of orphans (between 1 and 45) from Plasmo-dium yoelii yoelii, Cryptosporidium hominis, both Phytophthora spe-cies, and ciliates shows homology with bacterial species from alimited number of phyla, for both diatoms �100 orphan genesmatch a wide range of phyla (data not shown). In general, thefraction of orphans homologous to sequences from Archaea orViruses is much smaller compared with genes showing homologywith Bacterial genes (mostly Proteobacteria), suggesting that HGTbetween Bacteria and chromalveolates is most common. As fororphan genes, in most species only a minority of the SSFs havebacterial homologs, with Thalassiosira as an exception, where 42%(28/67) of all SSFs again match a wide range of phyla (data notshown).
We set out to document the genome evolution of a widediversity of chromalveolate organisms. To this end, we in-
ferred, by using a Dollo parsimony approach, both gene lossand gain events that have occurred along the chromalveolatetree. The great differences in genome content ref lect theancient history of the chromalveolate assemblage. Indeed,starting from an estimated 3,600 gene families in the ancestorof all chromalveolates, the number of gene families in extantchromalveolates ranges from �2,500 to �7,000, while thenumber of predicted genes ranges from �3,800 to almost40,000. Extensive gene loss and, contrarily, gene family ex-pansions explain the large differences in lifestyle but also manyspecific adaptations and the high degree of specialization someorganisms within this eukaryotic ‘‘superkingdom’’ haveundergone.
MethodsGene Family Clustering. To delineate gene families, a similarity search wasperformed (all-against-all BLASTP; E-value cutoff E-5) with all proteins from 12different chromalveolate species, plus the protein sequences from eight out-group organisms. For more information regarding the dataset, see SI Meth-ods. Gene families were constructed with MCLBLASTLINE (inflation factor of2.0) based on the BLASTP analyses. The performance of the MCLBLASTLINEprotein clustering method was evaluated and compared with two otherclustering methods (see SI Methods). We also evaluated the possible effects oferrors in annotation and fast-evolving genes on gene family clustering (see SIMethods).
Functional Annotation of Genes and Gene Families. Genes and gene familieswere functionally annotated by using Gene Ontology (GO) (20). In a first step,all proteins were annotated by using Blast2GO to assign the proteins to GOcategories (43). Proteins mapped to a particular GO category were alsoexplicitly included into all parental categories. GO annotation per family wasobtained by listing the GO labels for all of the genes of that family. A weight,equal to the percentage of genes with GO annotation within the samesubcategory (molecular function, cellular component, biological process) thatcarried this label, was attached to all of the GO labels. Only GO labels with aweight greater than 30% were considered as representative for the family. GOlabels occurring in fewer than 10 gene families were discarded. The statisticalsignificance of functional GO enrichment was evaluated by using the hyper-geometric distribution, whereas multiple hypotheses testing was done byusing FDR (44).
Loss and Acquisition of Gene Families. The parsimonious evolutionary scenario,which included the loss and acquisition of gene families mapped onto thebranches of the chromalveolate phylogenetic tree, was inferred by using theDOLLOP program of the PHYLIP package (45). The DOLLOP program is basedon the Dollo parsimony principle, which assumes irreversibility of characterloss (19) and has been used in similar studies describing the evolution of KOGsalong the eukaryotic phylogenetic tree (46), and studying the intron gain andloss in paralogs (47).
Species/Lineage-Specific Gene Family Expansions. For all gene families (orphansand SSFs excluded), the mean gene family size and standard deviation werecalculated. The 25% most variable profiles, based on the standard deviations,were extracted. The matrix of these profiles was transformed into a matrix ofz-scores to center and normalize the data. Subsequently, these profiles werehierarchically clustered (complete linkage clustering) by using Pearson corre-lation as a distance measure. The clustering and visualization was done byusing Genesis (48). A description was added to all families based on the mostfrequently occurring gene descriptions in the corresponding gene family.Gene families only expanded in the outgroup were removed, in addition tothose expanded only in one or both of the ciliates because of their massivegene duplication. Transposon-derived gene families were removed becausethe distribution of such families is likely to be a consequence of whether thegene models were derived from a repeat-masked genome sequence andtherefore may be artifactual.
Detection of Block Duplications and Tandem Repeats. The detection of tandemand block duplications within the 12 chromalveolate genomes was done withi-ADHoRe (49). After removal of transposable elements, the MCL pairs wereused to define the homologous relations between the genes of every genome,which served as input for the i-ADHoRe algorithm. The following parameterswere used in the i-ADHoRe analysis: gap size of 20 genes, q-value of 0.8,
Fig. 3. Differences in average gene family size for different eukaryotes. Forall organisms included in the current study, the average gene family size,converted into a z-score, is plotted on the ordinate. See text for details.
Martens et al. PNAS � March 4, 2008 � vol. 105 � no. 9 � 3431
EVO
LUTI
ON

probability cutoff at 0.01, minimum of three homologs to define a block, andhigher-level multiplicon detection disabled (level 2 only).
Origin of the Chromalveolate Orphans. For the proteins that had no homologsin our dataset (i.e., the orphans or one gene representative per SSF), asimilarity search (BLASTP, E-value cutoff E-5) was performed against thenonredundant protein database at NCBI (release 160.0). Valid hits wereextracted by using a relative bit score (BS) threshold and taxonomic filter-ing of putative homologs (see SI Methods). Similar results were found
by applying different relative BS thresholds [range 0.6 – 0.9 (data notshown)].
ACKNOWLEDGMENTS. We thank Tine Blomme and Steven Maere for helpfuldiscussions and Thomas Van Parys for technical assistance. C.M. is indebted tothe Institute for the Promotion of Innovation by Science and Technology(Flanders, Belgium) for a predoctoral fellowship. K.V. is a postdoctoral fellowof the Research Foundation-Flanders. The sequence data of Phaeodactylumtricornutum were produced by the U.S. Department of Energy Joint GenomeInstitute www.jgi.doe.gov.
1. Cavalier-Smith T (1999) Principles of protein and lipid targeting in secondary symbio-genesis: Euglenoid, dinoflagellate, and sporozoan plastid origins and the eukaryotefamily tree. J Eukaryot Microbiol 46:347–366.
2. Archibald JM, Keeling PJ (2002) Recycled plastids: A ‘green movement’ in eukaryoticevolution. Trends Genet 18:577–584.
3. Cavalier-Smith T (2004) in Organelles, Genomes and Eukaryotic Evolution, eds Hirt RP,Horner D (Taylor & Francis, London), pp 71–103.
4. Templeton TJ, et al. (2004) Comparative analysis of apicomplexa and genomic diversityin eukaryotes. Genome Res 14:1686–1695.
5. Billiouw M, et al. (2002) Theileria parva epidemics: A case study in eastern Zambia. VetParasitol 107:51–63.
6. Nahlen BL, Korenromp EL, Miller JM, Shibuya K (2005) Malaria risk: Estimating clinicalepisodes of malaria. Nature 437:E3; discussion E4–E5.
7. Kaplan JE, Jones JL, Dykewicz CA (2000) Protists as opportunistic pathogens: Publichealth impact in the 1990s and beyond. J Eukaryot Microbiol 47:15–20.
8. Jahn CL, Klobutcher LA (2002) Genome remodeling in ciliated protozoa. Annu RevMicrobiol 56:489–520.
9. Bhattacharya D, et al. (1992) Algae containing chlorophylls a�c are polyphyletic:Molecular evolutionary analysis of the Chromophyta. Evolution (Lawrence, Kans)46:1801–1817, and erratum (1993) 47:986.
10. Erwin DC, Ribeiro OK (1996) Phytophthora Diseases Worldwide (Am Phytopathol Soc,St Paul).
11. Tyler BM, et al. (2006) Phytophthora genome sequences uncover evolutionary originsand mechanisms of pathogenesis. Science 313:1261–1266.
12. Rizzo DM, Garbelotto M, Hansen EM (2005) Phytophthora ramorum: Integrativeresearch and management of an emerging pathogen in California and Oregon forests.Annu Rev Phytopathol 43:309–335.
13. Baldauf SL, Roger AJ, Wenk-Siefert I, Doolittle WF (2000) A kingdom-level phylogenyof eukaryotes based on combined protein data. Science 290:972–977.
14. Ben Ali A, De Baere R, Van der Auwera G, De Wachter R, Van de Peer Y (2001)Phylogenetic relationships among algae based on complete large-subunit rRNA se-quences. Int J Syst Evol Microbiol 51:737–749.
15. Dacks JB, Marinets A, Doolittle WF, Cavalier-Smith T, Logsdon JM, Jr (2002) Analyses ofRNA polymerase II genes from free-living protists: Phylogeny, long branch attraction,and the eukaryotic big bang. Mol Biol Evol 19:830–840.
16. Stechmann A, Cavalier-Smith T (2003) Phylogenetic analysis of eukaryotes using heat-shock protein Hsp90. J Mol Evol 57:408–419.
17. Van de Peer Y, De Wachter R (1997) Evolutionary relationships among the eukaryoticcrown taxa taking into account site-to-site rate variation in 18S rRNA. J Mol Evol45:619–630.
18. Hackett JD, et al. (2007) Phylogenomic analysis supports the monophyly of crypto-phytes and haptophytes and the association of rhizaria with chromalveolates. Mol BiolEvol 24:1702–1713.
19. Farris J (1977) Phylogenetic analysis under Dollo’s law. Syst Zool 26:77–88.20. Harris MA, et al. (2004) The Gene Ontology (GO) database and informatics resource.
Nucleic Acids Res 32:D258–D261.21. Zhang Z, Green BR, Cavalier-Smith T (2000) Phylogeny of ultra-rapidly evolving
dinoflagellate chloroplast genes: A possible common origin for sporozoan anddinoflagellate plastids. J Mol Evol 51:26–40.
22. Rosenthal PJ (2002) Hydrolysis of erythrocyte proteins by proteases of malaria para-sites. Curr Opin Hematol 9:140–145.
23. Appiah AA, van West P, Osborne MC, Gow NA (2005) Potassium homeostasis influencesthe locomotion and encystment of zoospores of plant pathogenic oomycetes. FungalGenet Biol 42:213–223.
24. Burgoyne RD, Morgan A (1993) Regulated exocytosis. Biochem J 293:305–316.25. Plattner H (1989) Regulation of membrane fusion during exocytosis. Int Rev Cytol
119:197–286.
26. Greengard P, Valtorta F, Czernik AJ, Benfenati F (1993) Synaptic vesicle phosphopro-teins and regulation of synaptic function. Science 259:780–785.
27. Cavalier-Smith T (2002) The phagotrophic origin of eukaryotes and phylogeneticclassification of Protozoa. Int J Syst Evol Microbiol 52:297–354.
28. Aury JM, et al. (2006) Global trends of whole-genome duplications revealed by theciliate Paramecium tetraurelia. Nature 444:171–178.
29. Eisen JA, et al. (2006) Macronuclear genome sequence of the ciliate Tetrahymenathermophila, a model eukaryote. PLoS Biol 4:e286.
30. Costanzo S, Ospina-Giraldo MD, Deahl KL, Baker CJ, Jones RW (2006) Gene duplicationevent in family 12 glycosyl hydrolase from Phytophthora spp. Fungal Genet Biol43:707–714.
31. McLeod A, Smart CD, Fry WE (2003) Characterization of 1,3-�-glucanase and 1,3;1,4-�-glucanase genes from Phytophthora infestans. Fungal Genet Biol 38:250–263.
32. Meijer HJ, et al. (2006) Identification of cell wall-associated proteins from Phytoph-thora ramorum. Mol Plant–Microbe Interact 19:1348–1358.
33. Torto-Alalibo TA, et al. (2007) Expressed sequence tags from Phytophthora sojae revealgenes specific to development and infection. Mol Plant–Microbe Interact 20:781–793.
34. Chen X, Shen G, Wang Y, Zheng X, Wang Y (2007) Identification of Phytophthora sojaegenes upregulated during the early stage of soybean infection. FEMS Microbiol Lett269:280–288.
35. Schneider AG, Mercereau-Puijalon O (2005) A new Apicomplexa-specific protein ki-nase family: Multiple members in Plasmodium falciparum, all with an export signature.BMC Genomics 6:30.
36. Hall N, et al. (2005) A comprehensive survey of the Plasmodium life cycle by genomic,transcriptomic, and proteomic analyses. Science 307:82–86.
37. Sijwali PS, Shenai BR, Rosenthal PJ (2002) Folding of the Plasmodium falciparumcysteine protease falcipain-2 is mediated by a chaperone-like peptide and not theprodomain. J Biol Chem 277:14910–14915.
38. Olliaro PL, Yuthavong Y (1999) An overview of chemotherapeutic targets for antima-larial drug discovery. Pharmacol Ther 81:91–110.
39. Dobbelaere D, Heussler V (1999) Transformation of leukocytes by Theileria parva andT. annulata. Annu Rev Microbiol 53:1–42.
40. Pain A, et al. (2005) Genome of the host-cell transforming parasite Theileria annulatacompared with T. parva. Science 309:131–133.
41. Simillion C, Vandepoele K, Van Montagu MC, Zabeau M, Van de Peer Y (2002) Thehidden duplication past of Arabidopsis thaliana. Proc Natl Acad Sci USA 99:13627–13632.
42. Vandepoele K, Van de Peer Y (2005) Exploring the plant transcriptome throughphylogenetic profiling. Plant Physiol 137:31–42.
43. Conesa A, et al. (2005) Blast2GO: A universal tool for annotation, visualization andanalysis in functional genomics research. Bioinformatics 21:3674–3676.
44. Storey JD, Tibshirani R (2003) Statistical significance for genomewide studies. Proc NatlAcad Sci USA 100:9440–9445.
45. Felsenstein J (1996) Inferring phylogenies from protein sequences by parsimony,distance, and likelihood methods. Methods Enzymol 266:418–427.
46. Koonin EV, et al. (2004) A comprehensive evolutionary classification of proteinsencoded in complete eukaryotic genomes. Genome Biol 5:R7.
47. Babenko VN, Rogozin IB, Mekhedov SL, Koonin EV (2004) Prevalence of intron gainover intron loss in the evolution of paralogous gene families. Nucleic Acids Res32:3724–3733.
48. Sturn A, Quackenbush J, Trajanoski Z (2002) Genesis: Cluster analysis of microarraydata. Bioinformatics 18:207–208.
49. Simillion C, Vandepoele K, Saeys Y, Van de Peer Y (2004) Building genomic profiles foruncovering segmental homology in the twilight zone. Genome Res 14:1095–1106.
3432 � www.pnas.org�cgi�doi�10.1073�pnas.0712248105 Martens et al.