Embed Size (px)
Citation preview
Whole Family Approaches to Research and Practice:
A Look at CAP Tulsa’s 2Gen CareerAdvance® Program
Monday, December 3, 20182:30 PM EDT
Amelia Popham, ModeratorKathleen Dwyer, Discussant
Janae Bradford, SpeakerTeresa Eckrich Sommer, Speaker
Terri Sabol, Speaker
opressrc.org
2Self-Sufficiency Research Clearinghouse

3Self-Sufficiency Research Clearinghouse

4Self-Sufficiency Research Clearinghouse
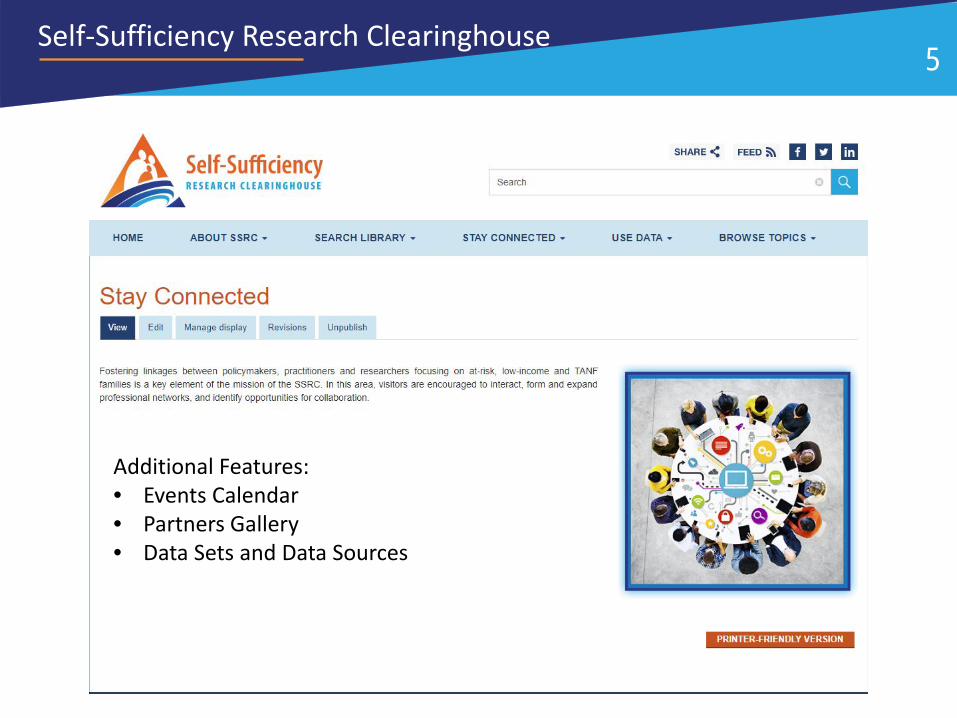
5Self-Sufficiency Research Clearinghouse
Additional Features:• Events Calendar• Partners Gallery• Data Sets and Data Sources
Health Profession Opportunity Grants (HPOG)
Building Pathwaysto a Brighter Future
What is HPOG?
•
•
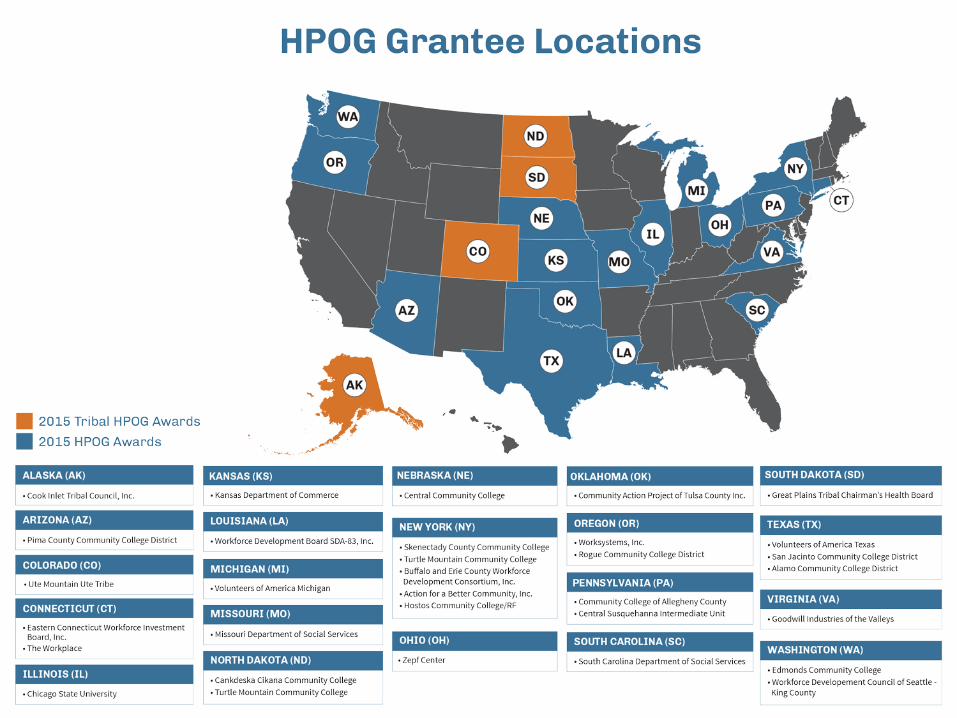
The Health Profession Opportunity Grants (HPOG) program awards competitive, discretionary grants to organizations that provide education and training to TANF recipients and other low-income individuals for occupations in the healthcare field that pay well and are expected to either experience labor shortages or be in high demand.
Office of Family Assistance administers the HPOG grants••
HPOG 1.0 (2010 to 2015)HPOG 2.0 (2015 to 2020)
•
•
•••••
HPOG Evaluation Portfolio
HPOG authorized as a demonstration program with a mandated federal evaluation
Office of Planning, Research, and Evaluation (OPRE) using a multi-pronged evaluation strategy to assess the success of HPOG 1.0 and 2.0
ImplementationSystems changeOutcomesImpactsCost-benefit
HPOG Evaluation Portfolio
HPOG University Partnership Research Grants
•
•
•
In 2016, OPRE awarded three grants to university-based researchers to conduct studies in partnership with HPOG programs Specific research questions regarding how to improve HPOG services in local contextsFocus on questions relevant to HPOG program partner’s goals and objectives while also benefitting the broader employment and self-sufficiency research field
HPOG Evaluation Portfolio
HPOG University Partnership Research Grants
Three HPOG UP 2.0 Grantees include: •
•
•
Brandeis University, Heller School for Social Policy and Management, Institute on Assets and Social Policy in partnership with the WorkPlace, Inc.
• Study of Career Advancement and Quality Jobs in Health CareLoyola University of Chicago in partnership with Chicago State University
• Evaluation of Goal-Directed Psychological Capital and Employer Coachingin Health Profession Opportunity Development
Northwestern University, Institute for Policy Research in partnership with CAP Tulsa
• The Northwestern University Two-Generation Study (CAP Family Life Study)of Parent and Child Human Capital Advancement
HPOG Evaluation Portfolio
For more information, please visit:
http://www.career-pathways.org
www.acf.hhs.gov/programs/opre/research/project/opre-career-pathways-research-portfolio
13Speakers
•
•
•
•
Kathleen Dwyer, Senior Social Science Research Analyst (Administration for Children and Families)
Janae Bradford, Assistant Director of Family Advancement Services and Partnerships (CAP Tulsa)
Terri Sabol, Assistant Professor (Northwestern University)
Teresa Sommer, Research Associate Professor (Northwestern University)

14Join the Conversation
•
•
•
Submit questions through the Question and Answer feature (bottom right of screen).
Questions will be answered after the presentations are complete.
Join the conversation on Twitter using the #SSRCWebinar hashtag.
Setting the Stage: Whole-Family Approaches to Research and Practice
Kathleen Dwyer, Ph.D.Senior Social Science Research AnalystTeam Lead, Parenting & Parent Well-Being Research
ACF and Whole-Family Approaches
•
•
Many ACF programs serve multiple generations
ACF is supporting multiple state and local efforts to promote whole-family and multi-generational approaches
–
–
Preschool Development Grant Birth through Five (PDG B-5)
Regional convenings
•
•
•
•
Region 1: “A Whole Family Approach to Jobs: Helping Parents Work and Thrive”
Regions 2 and 3: “Building Better Outcomes with Children, Youth and Families: The 2GEN Strategy”
Region 5: “Whole Family Success: Advancing Excellence in Two-Generation Programs”
Regions 8 and 10: “On the 2Gen Frontier: Catalyzing and Accelerating Whole Family Strategies in Western States”
Integrated Approaches to Supporting Child Development and Improving Family Economic Security (2015-2018)
• Motivation–
–
–
–
To understand the scope of the programs in the field
To document the state of research and evaluation efforts
To understand more about quality, intensity, and intentionality of services
To make recommendations regarding evaluations that may be feasible, relevant, and useful to ACF and the field
Activities and Products
• Project activities
–
–
–
–
–
Targeted literature review
Expert consultations
Environmental scan
Conceptual frameworks
Site visits
•
•
Final Report
– Exploration of Integrated Approaches toSupporting Child Development & ImprovingFamily Economic Security
Briefs:
–
–
–
Features of Programs Designed to HelpFamilies Achieve Economic Security andPromote Child Well-being
Conceptual Frameworks for IntentionalApproaches to Improving Economic Securityand Child Well-being
Using Research and Evaluation to SupportPrograms that Promote Parents’ EconomicSecurity and Children’s Well-being
18
Assessment of Current Research and Evaluation
19
• Little research on currently operating programs is available
– Six programs had engaged in implementation studies (only four currently operating)
– Two programs have participated in effectiveness evaluations
• Most programs are in the early stages of program development, and research and evaluation should be designed accordingly
Benefits of Research and Evaluation that Match the Stage of Program Development
20
• Contribute to stronger implementation of service approachesInform the field about promising strategiesEventually, address questions about the impacts of these programs on parents’ economic security and children’s development
••
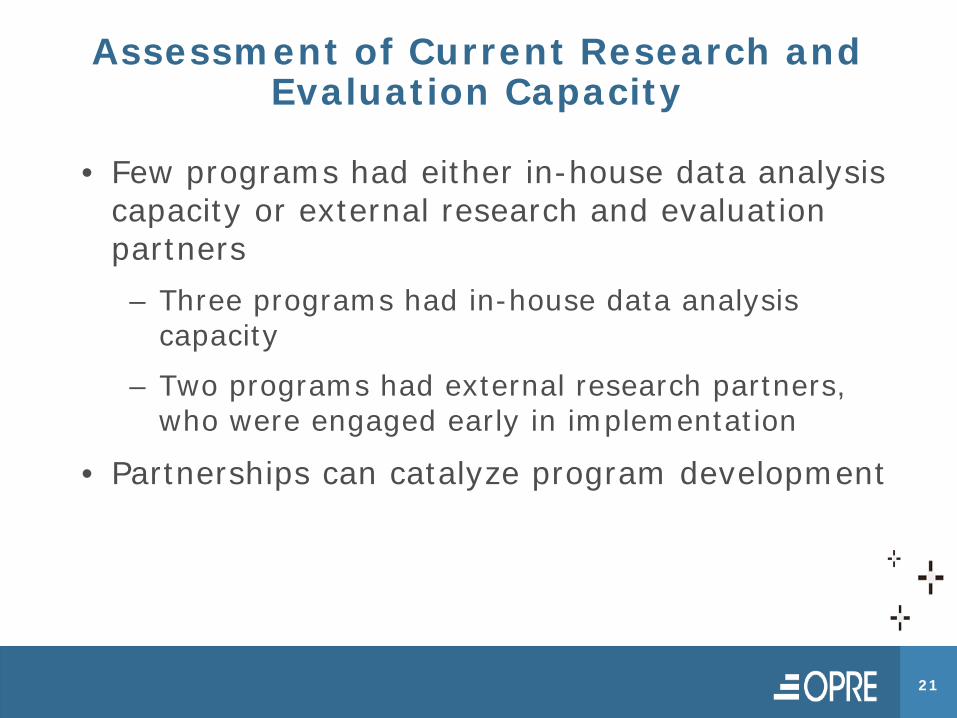
Assessment of Current Research and Evaluation Capacity
21
• Few programs had either in-house data analysis capacity or external research and evaluation partners
– Three programs had in-house data analysis capacity
– Two programs had external research partners, who were engaged early in implementation
• Partnerships can catalyze program development
Questions, Comments, Curiosity?
Office of Planning, Research and Evaluation
Kathleen Dwyer, Ph.D., Senior Social Science Research Analyst
acf.hhs.gov/opre
facebook.com/OPRE.ACF @OPRE_ACF
Whole Family Approaches to Research and Practice:A Look at CAP Tulsa’s 2Gen CareerAdvance® Program
Janae Bradford, MBA, PMPAssistant Director of Family AdvancementCAP Tulsa
Objectives
How does CAP Tulsa Define 2Generation Approaches?
What is CAP Tulsa?
Why 2Gen at CAP Tulsa?
Deep dive into CAP Tulsa’s CareerAdvance and other 2Gen Programs.
Other Promising 2Gen Models.
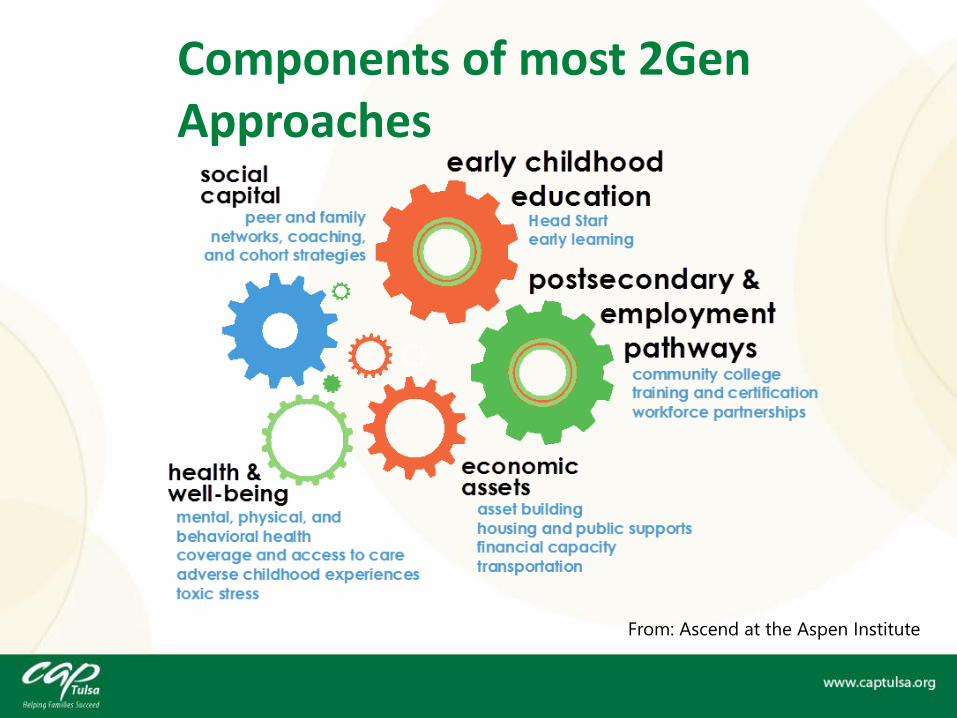
Components of most 2Gen Approaches
From: Ascend at the Aspen Institute
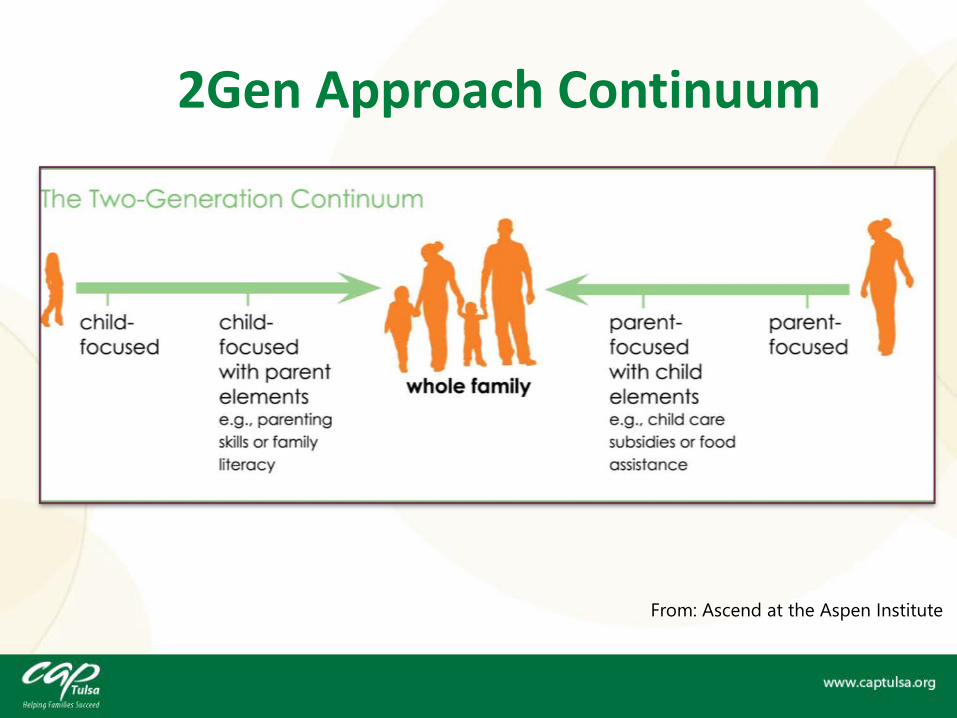
2Gen Approach Continuum
From: Ascend at the Aspen Institute
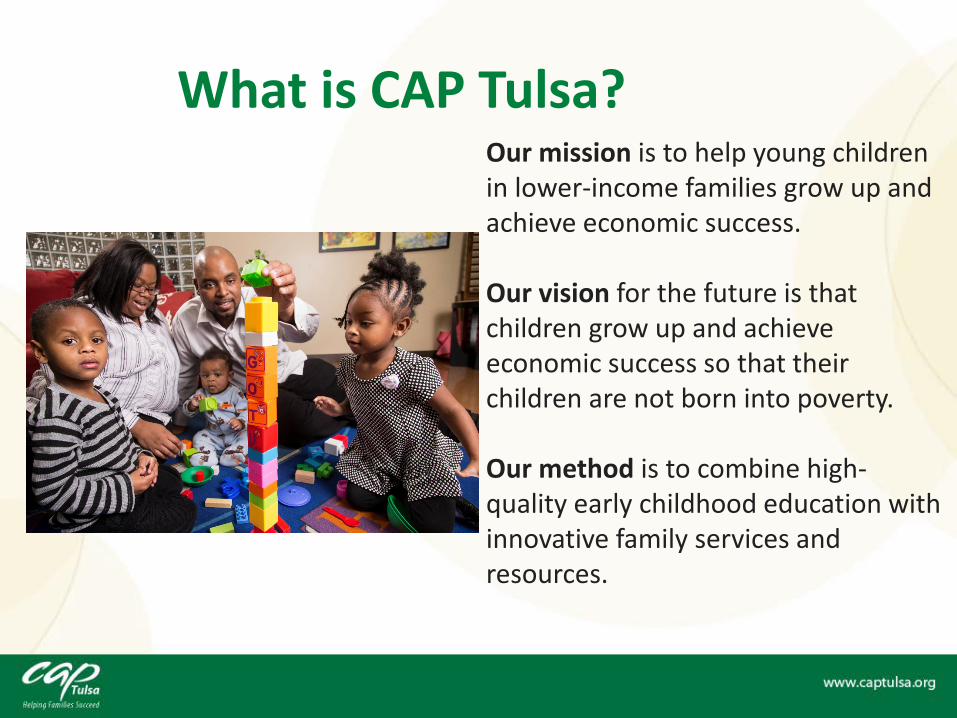
What is CAP Tulsa?Our mission is to help young children in lower-income families grow up and achieve economic success.
Our vision for the future is that children grow up and achieve economic success so that their children are not born into poverty.
Our method is to combine high-quality early childhood education with innovative family services and resources.
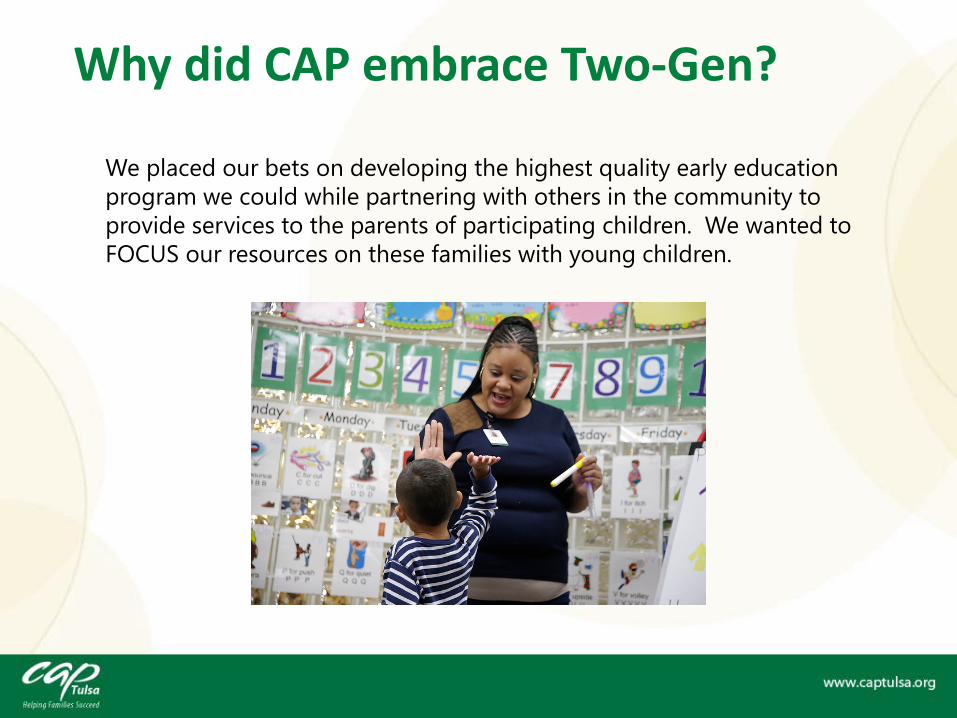
Why did CAP embrace Two-Gen?
We placed our bets on developing the highest quality early education program we could while partnering with others in the community to provide services to the parents of participating children. We wanted to FOCUS our resources on these families with young children.
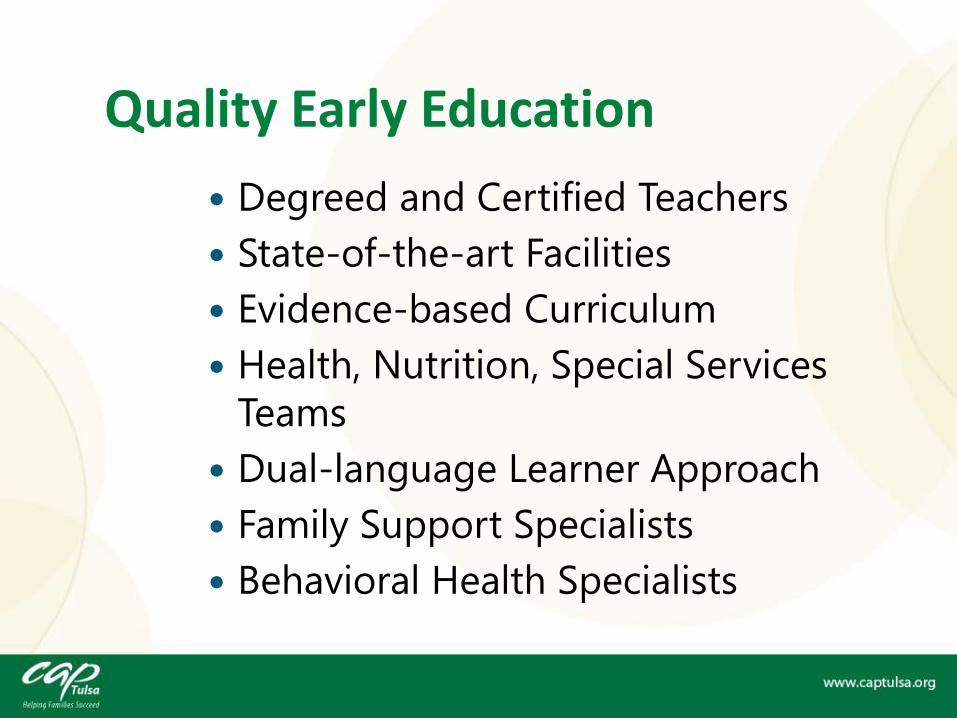
Quality Early Education
Degreed and Certified TeachersState-of-the-art FacilitiesEvidence-based CurriculumHealth, Nutrition, Special Services TeamsDual-language Learner ApproachFamily Support Specialists Behavioral Health Specialists


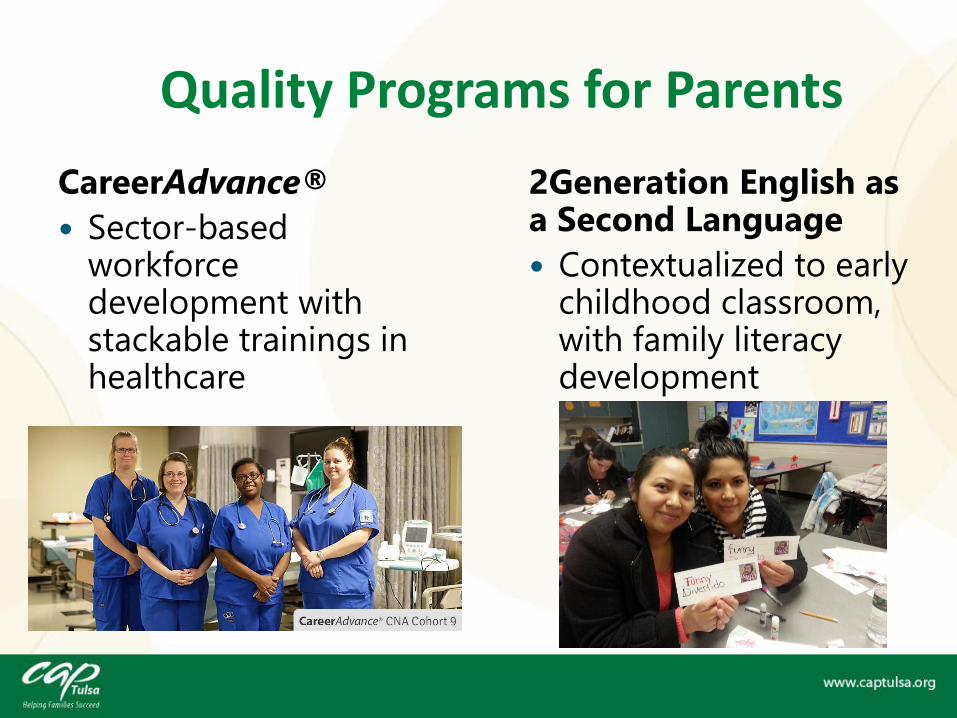
Quality Programs for ParentsCareerAdvance® Sector-based
workforce development with stackable trainings in healthcare
2Generation English as a Second Language Contextualized to early
childhood classroom, with family literacy development
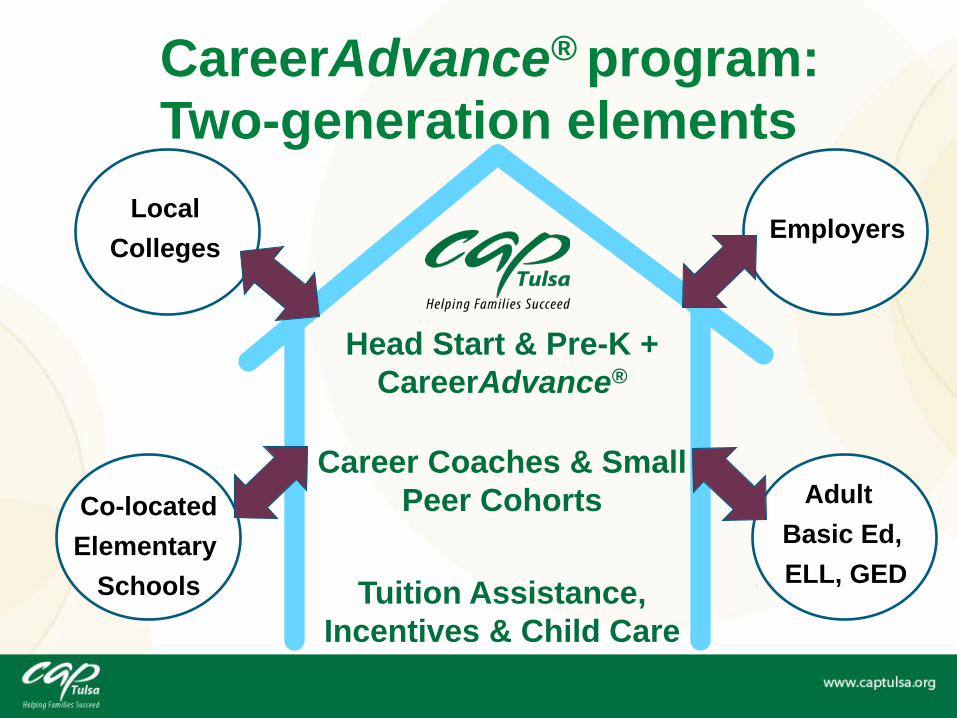
CareerAdvance® program: Two-generation elements
Head Start & Pre-K + CareerAdvance®
Career Coaches & Small Peer Cohorts
Tuition Assistance, Incentives & Child Care
Local Colleges
Employers
Co-locatedElementary
Schools
Adult Basic Ed,ELL, GED
Key Program Partners
Family & Children’s ServicesTulsa Technology CenterTulsa Community WorkAdvanceTulsa Community CollegeUnion Public Schools Adult Learning CenterTulsa Area Workforce Development BoardLocal Employers
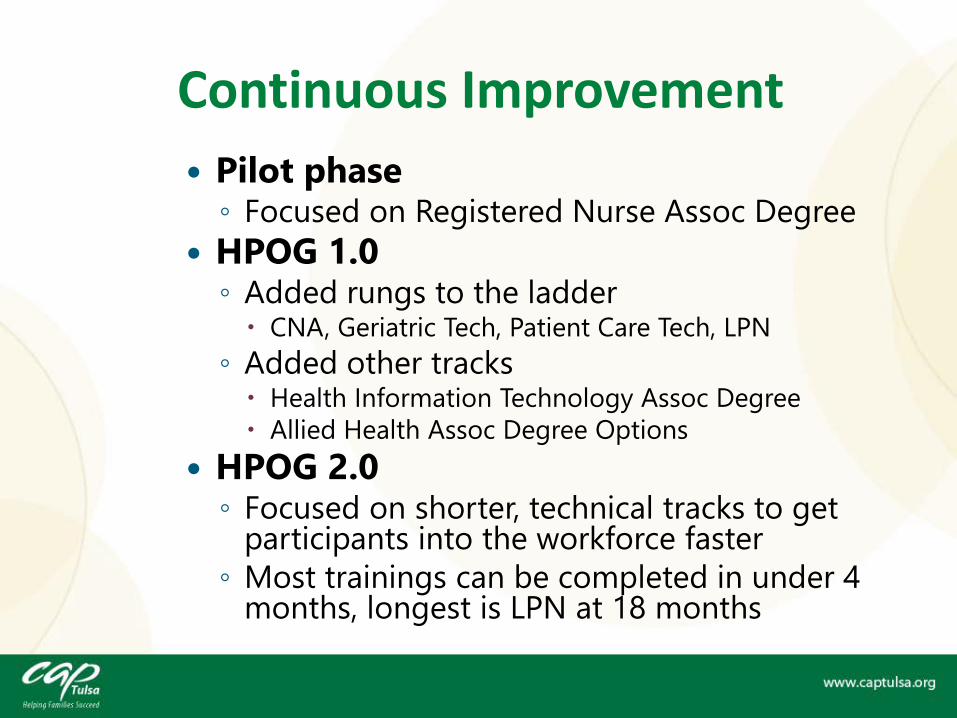
Continuous Improvement
Pilot phase◦ Focused on Registered Nurse Assoc DegreeHPOG 1.0◦
◦
Added rungs to the ladder CNA, Geriatric Tech, Patient Care Tech, LPNAdded other tracks
Health Information Technology Assoc DegreeAllied Health Assoc Degree Options
HPOG 2.0◦
◦
Focused on shorter, technical tracks to get participants into the workforce fasterMost trainings can be completed in under 4 months, longest is LPN at 18 months
Resources
OFA Promising Practices
ColoradoConnecticutMarylandRamsey County, MinnesotaNorth CarolinaUtahWashingtonWest Virginia
Building and Evidence Base for 2Gen Approaches
The Effect of CareerAdvance® on Short-Term Parent & Child
Outcomes
Teresa Eckrich Sommer & Terri J. Sabol
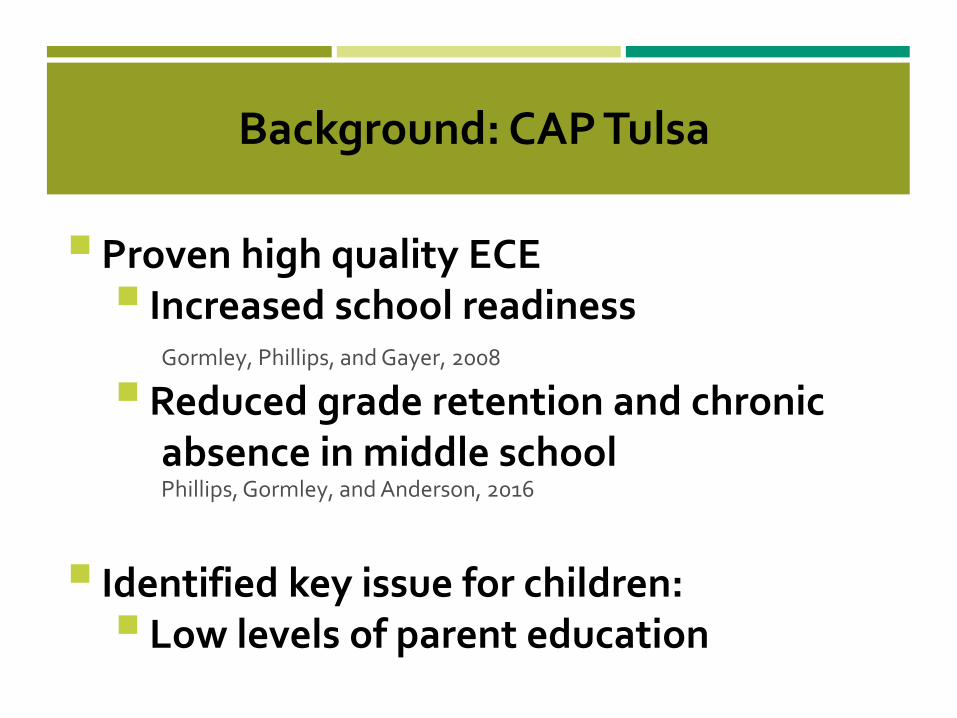
Background: CAP Tulsa
Proven high quality ECE Increased school readiness
Gormley, Phillips, and Gayer, 2008
Reduced grade retention and chronicabsence in middle school Phillips, Gormley, and Anderson, 2016
Identified key issue for children: Low levels of parent education
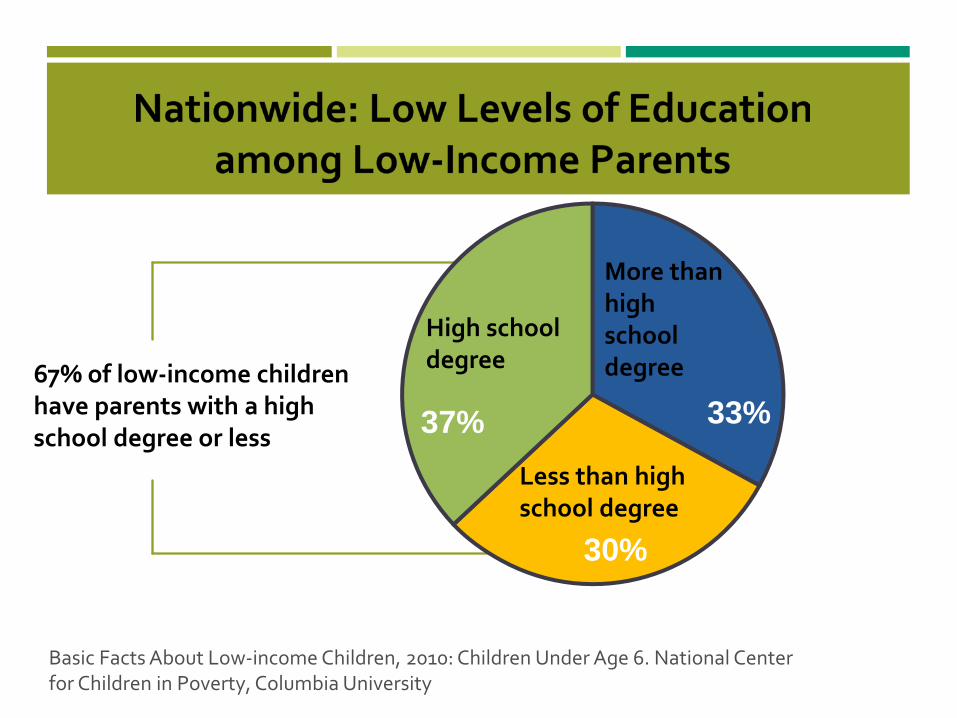
67% of low-income children have parents with a high school degree or less
33%
30%
Less than highschool degree
37%
High school degree
More than highschool degree
Basic Facts About Low-income Children, 2010: Children Under Age 6. National Center for Children in Poverty, Columbia University
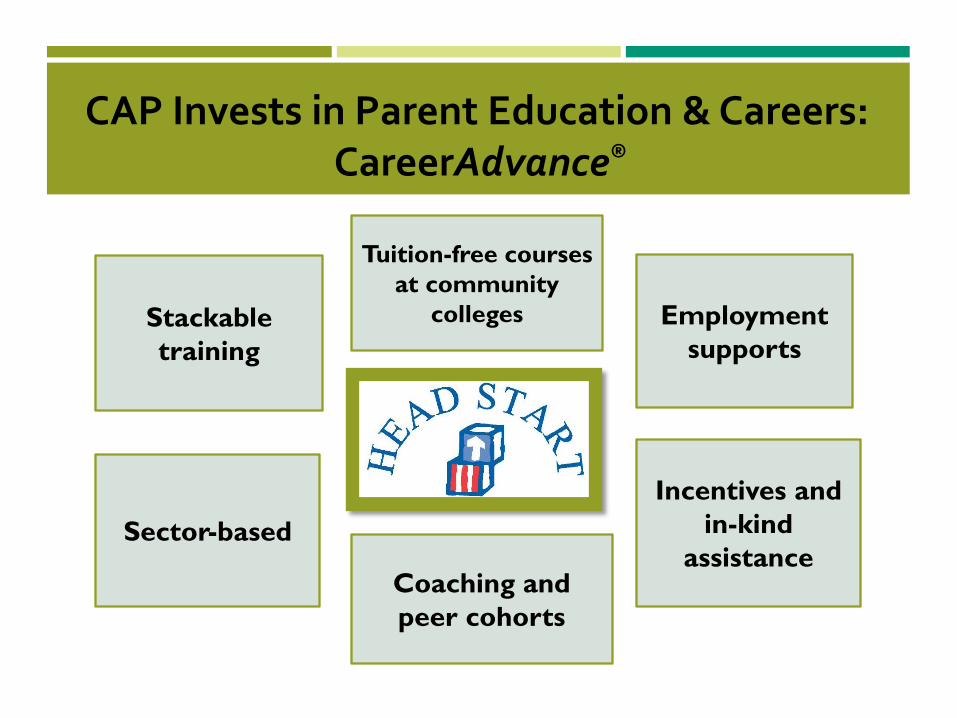
CAP Invests in Parent Education & Careers:CareerAdvance®
Stackabletraining
Sector-based
Tuition-free courses at community
colleges
Coaching and peer cohorts
Employment supports
Incentives and in-kind
assistance
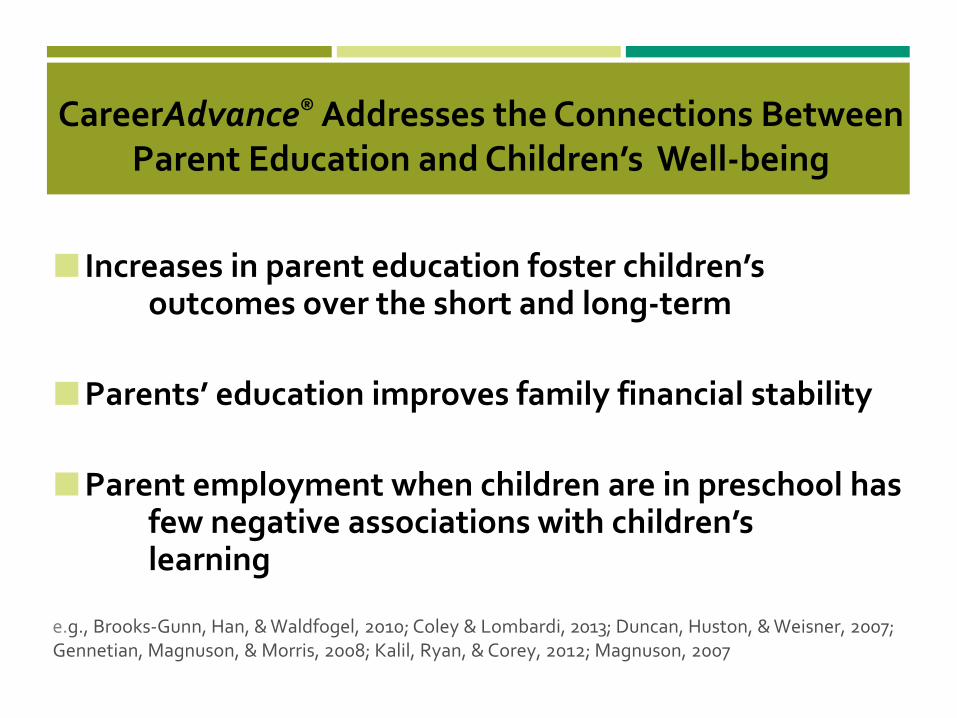
CareerAdvance® Addresses the Connections Between Parent Education and Children’s Well-being
Increases in parent education foster children’s outcomes over the short and long-term
Parents’ education improves family financial stability
Parent employment when children are in preschool has few negative associations with children’s learning
e.g., Brooks-Gunn, Han, & Waldfogel, 2010; Coley & Lombardi, 2013; Duncan, Huston, & Weisner, 2007;Gennetian, Magnuson, & Morris, 2008; Kalil, Ryan, & Corey, 2012; Magnuson, 2007
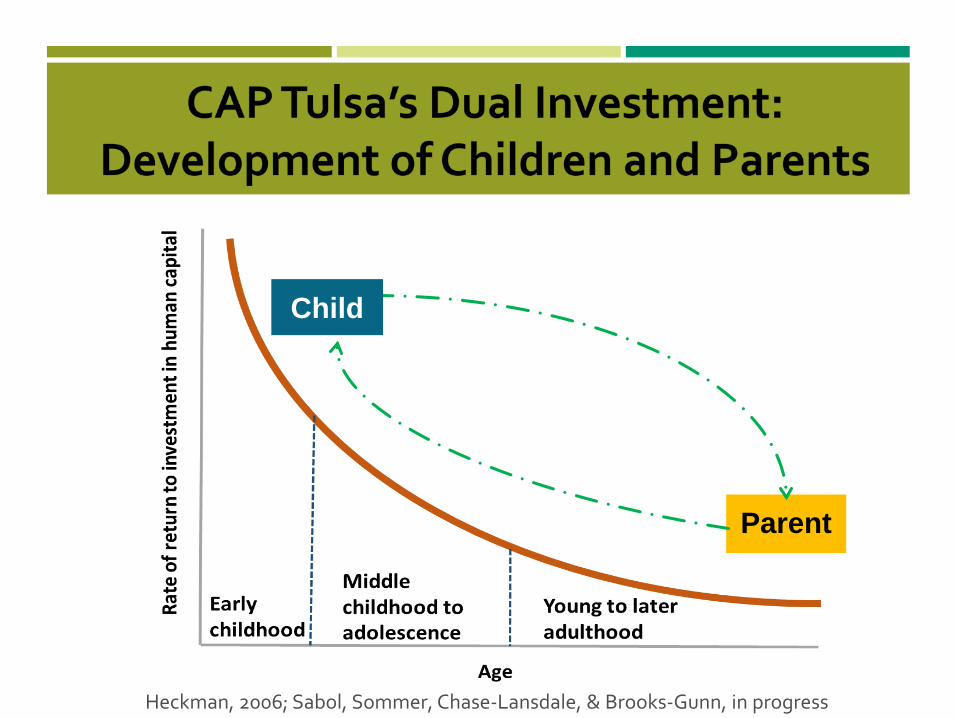
Parent
Child
Heckman, 2006; Sabol, Sommer, Chase-Lansdale, & Brooks-Gunn, in progress
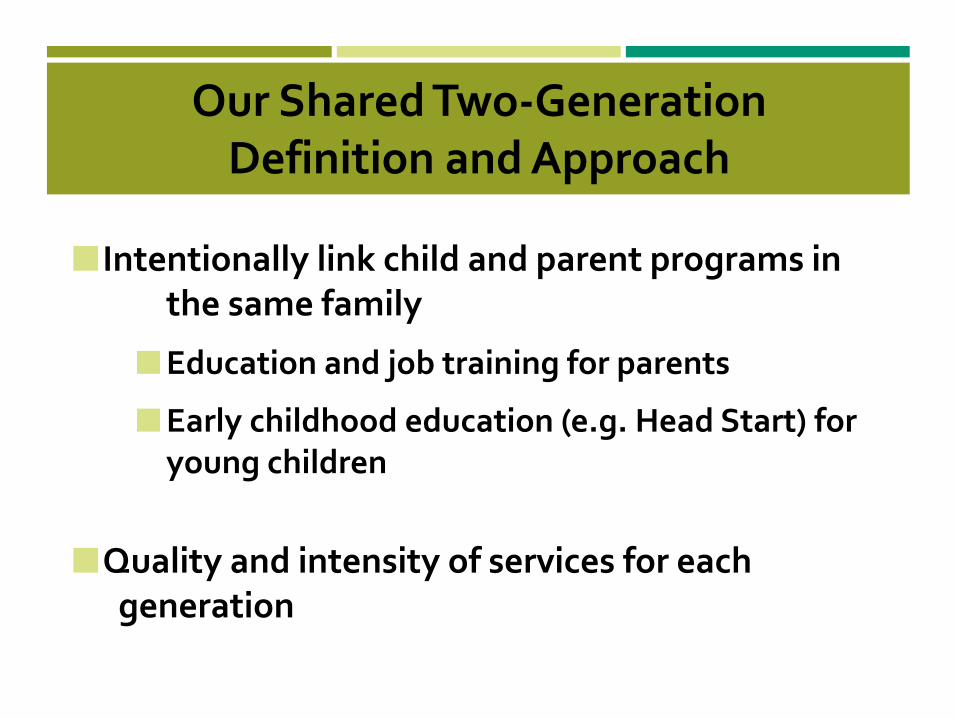
Our Shared Two-Generation Definition and Approach
I
ntentionally link child and parent programs in the same family
Education and job training for parents
Early childhood education (e.g. Head Start) for young children
Quality and intensity of services for each generation
What Evidence do we have on the Effects of Two-Generation Programs?
Empirical evidence lags behind practice and policyHseuh and Farrell, 2012
The jury is still out; few current two-generation evaluations
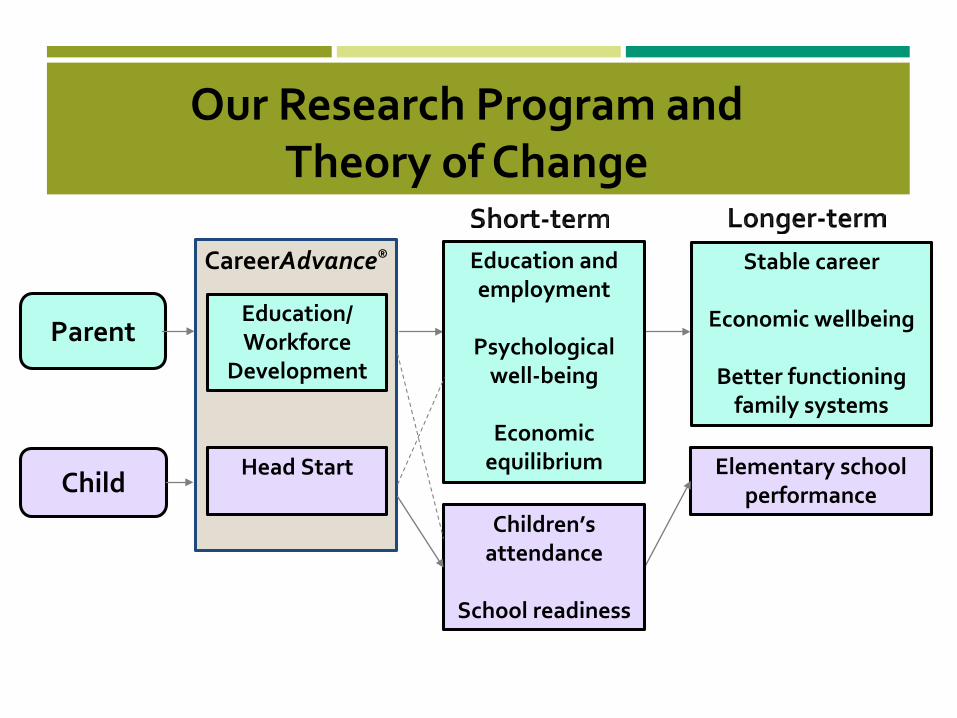
Our Research Program and Theory of Change
Child
Parent
CareerAdvance®
Head Start
Education/ Workforce
Development
Elementary school performance
Stable career
Economic wellbeing
Better functioning family systems
Education and employment
Psychological well-being
Economic equilibrium
Children’s attendance
School readiness
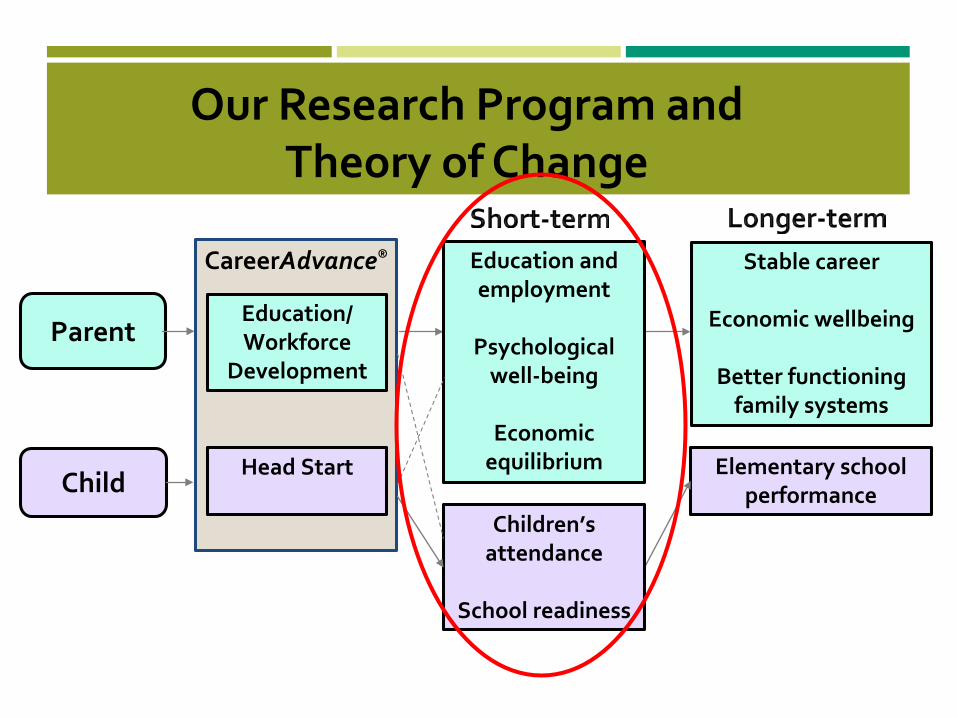
Research Question
Does CareerAdvance® have a greater effect on parents and children than Head Start alone?
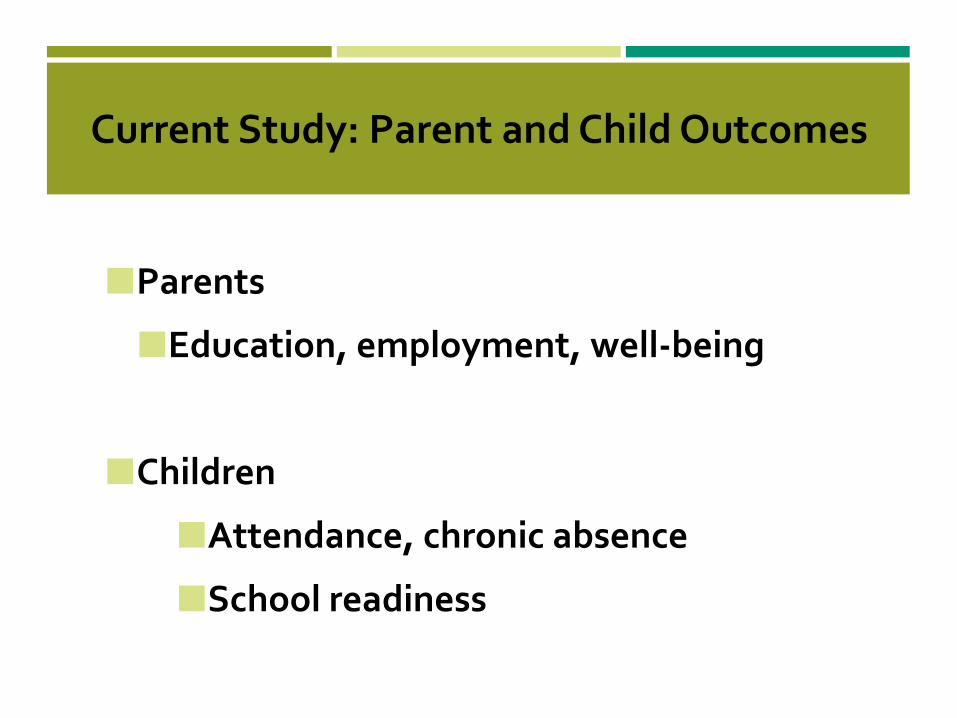
Current Study: Parent and Child Outcomes
Parents
Education, employment, well-being
Children
Attendance, chronic absence
School readiness
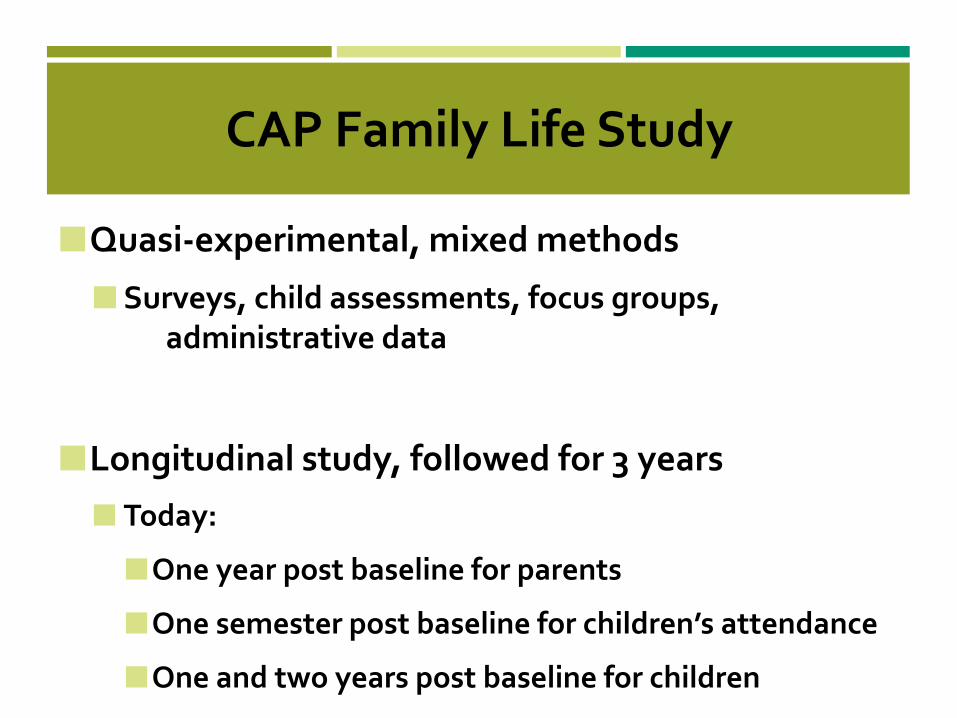
CAP Family Life Study
Quasi-experimental, mixed methods
Surveys, child assessments, focus groups, administrative data
Longitudinal study, followed for 3 years Today:
One year post baseline for parents
One semester post baseline for children’s attendance
One and two years post baseline for children
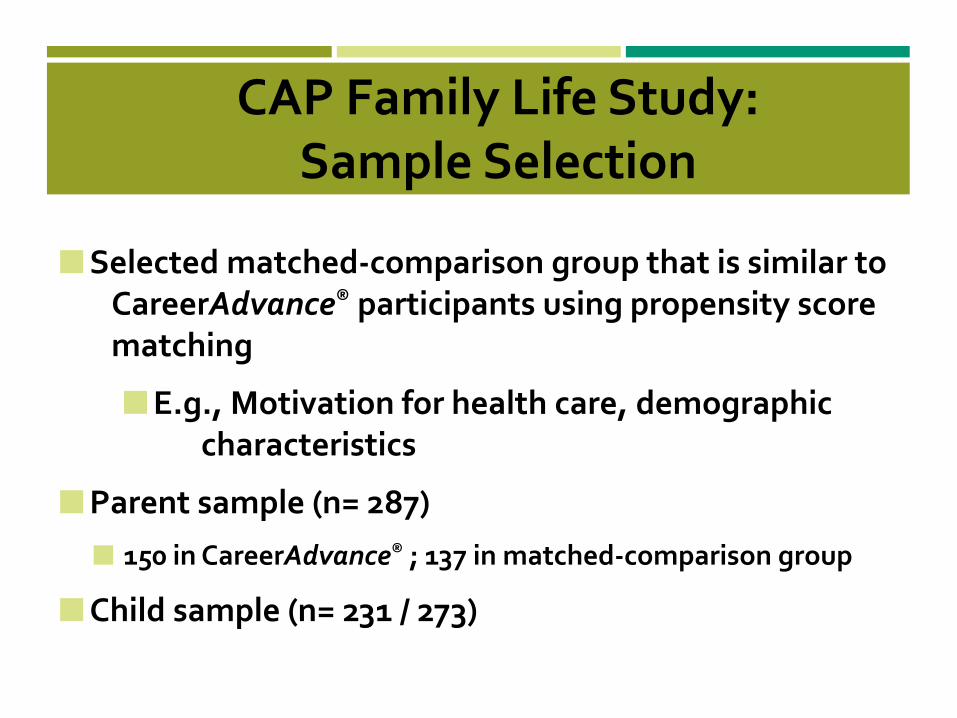
CAP Family Life Study: Sample Selection
Selected matched-comparison group that is similar to CareerAdvance® participants using propensity score matching
E.g., Motivation for health care, demographic characteristics
Parent sample (n= 287) 150 in CareerAdvance® ; 137 in matched-comparison group
Child sample (n= 231 / 273)
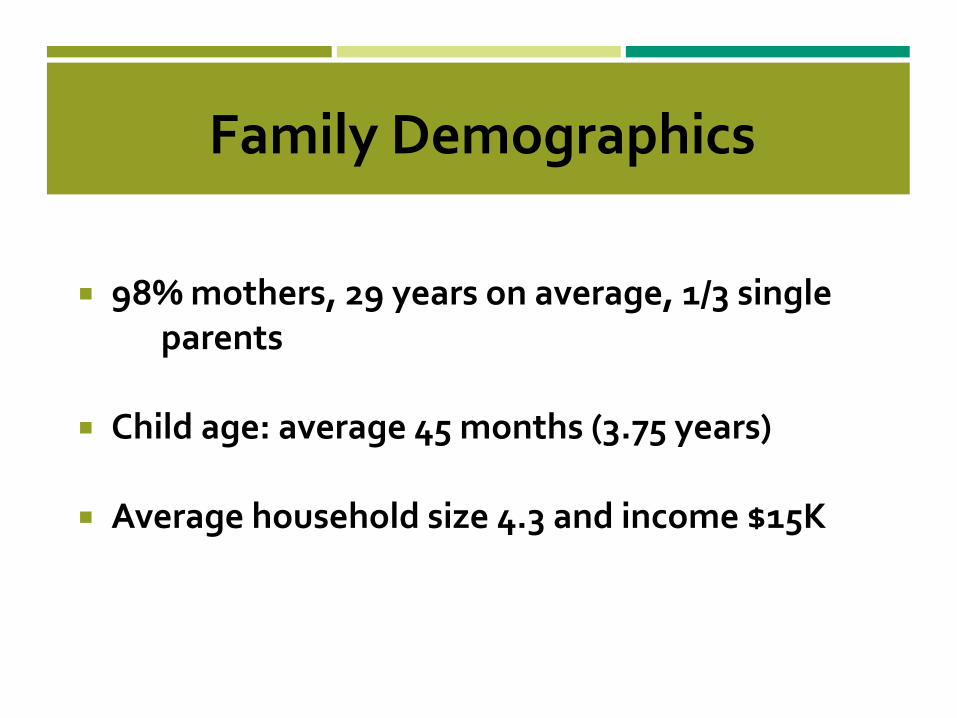
Family Demographics
98% mothers, 29 years on average, 1/3 single parents
Child age: average 45 months (3.75 years)
Average household size 4.3 and income $15K
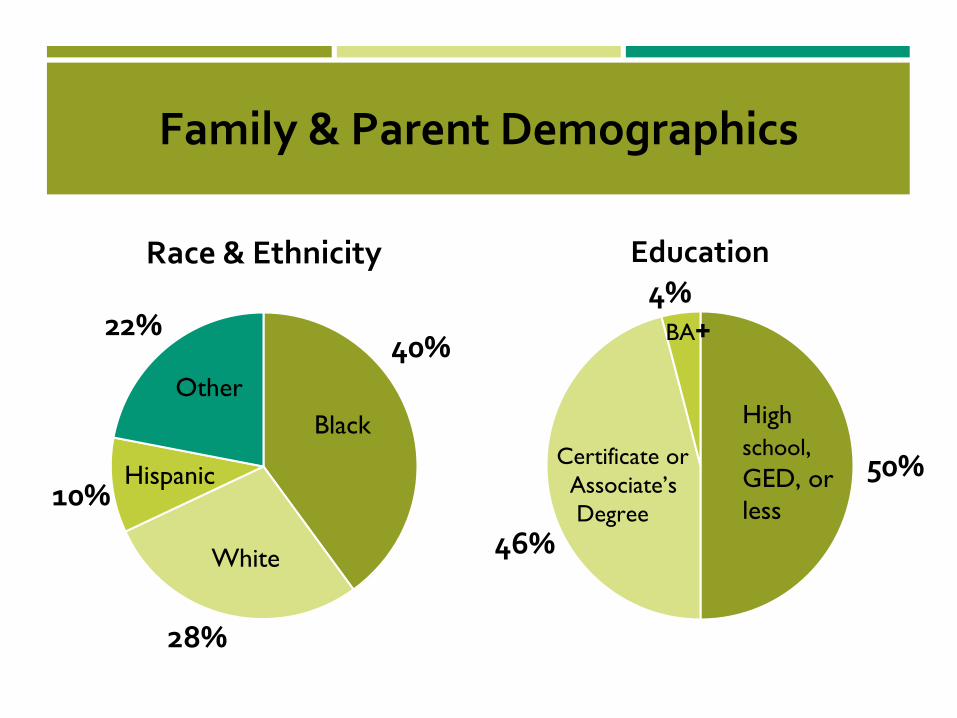
Family & Parent Demographics
40%
28%
10%
22%
Black
White
Hispanic
Other
Race & Ethnicity
50%
46%
4%
High school, GED, or less
Certificate orAssociate’sDegree
BA+
Education
Parent Outcomes
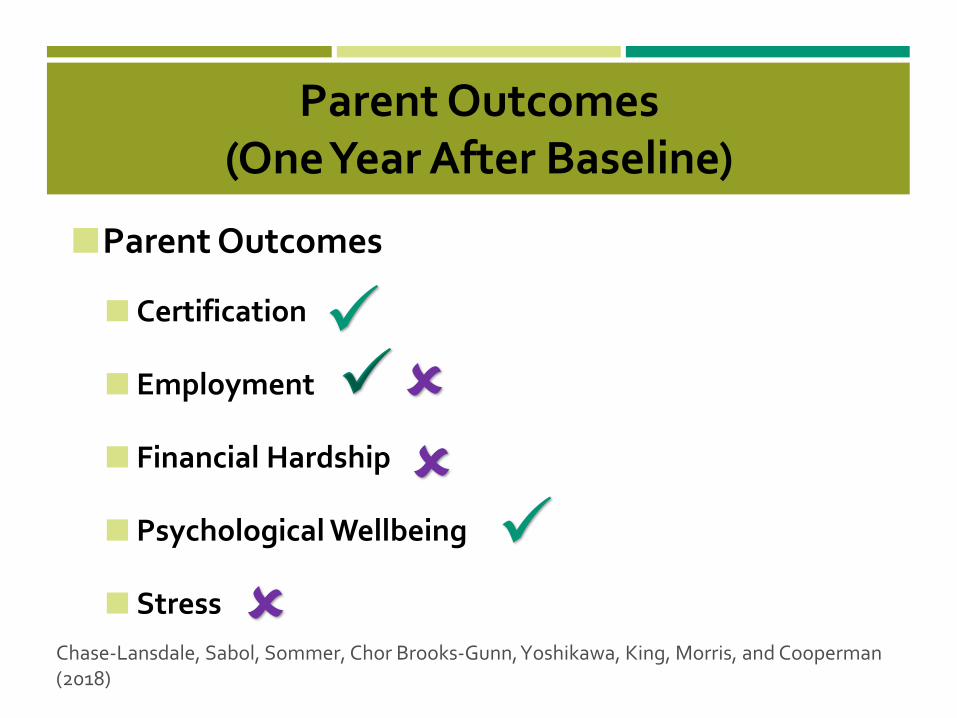
Parent Outcomes(One Year After Baseline)
Parent Outcomes
Certification
Employment
Financial Hardship
Psychological Wellbeing
Stress Chase-Lansdale, Sabol, Sommer, Chor Brooks-Gunn, Yoshikawa, King, Morris, and Cooperman (2018)
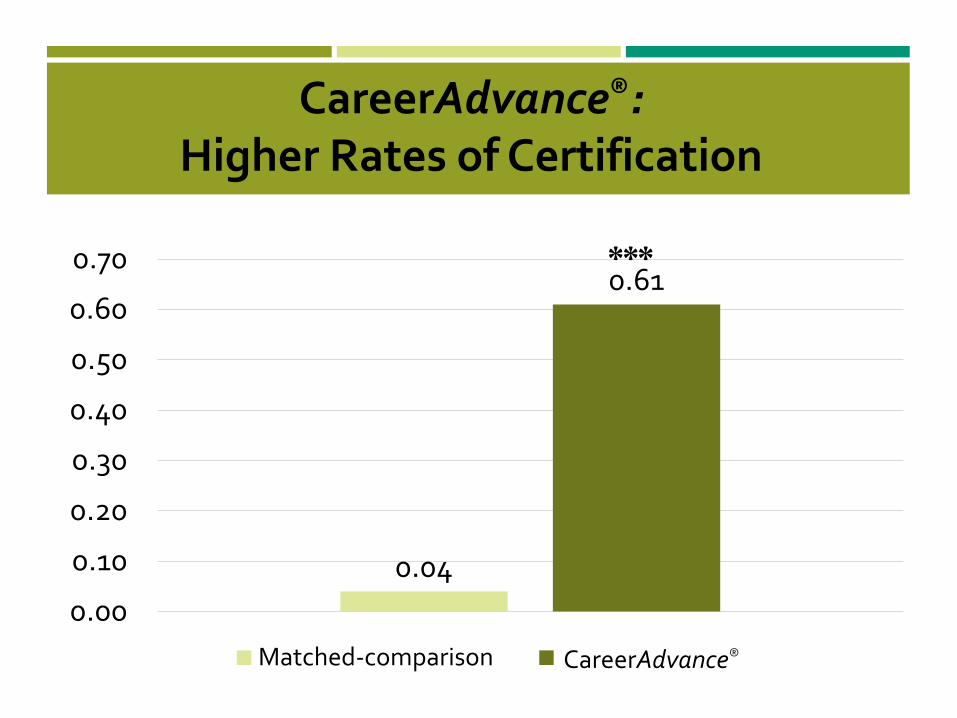
CareerAdvance®:Higher Rates of Certification
0.04
0.61
0.00
0.10
0.20
0.30
0.40
0.50
0.60
0.70
Matched-comparison CareerAdvance®
***
CareerAdvance®
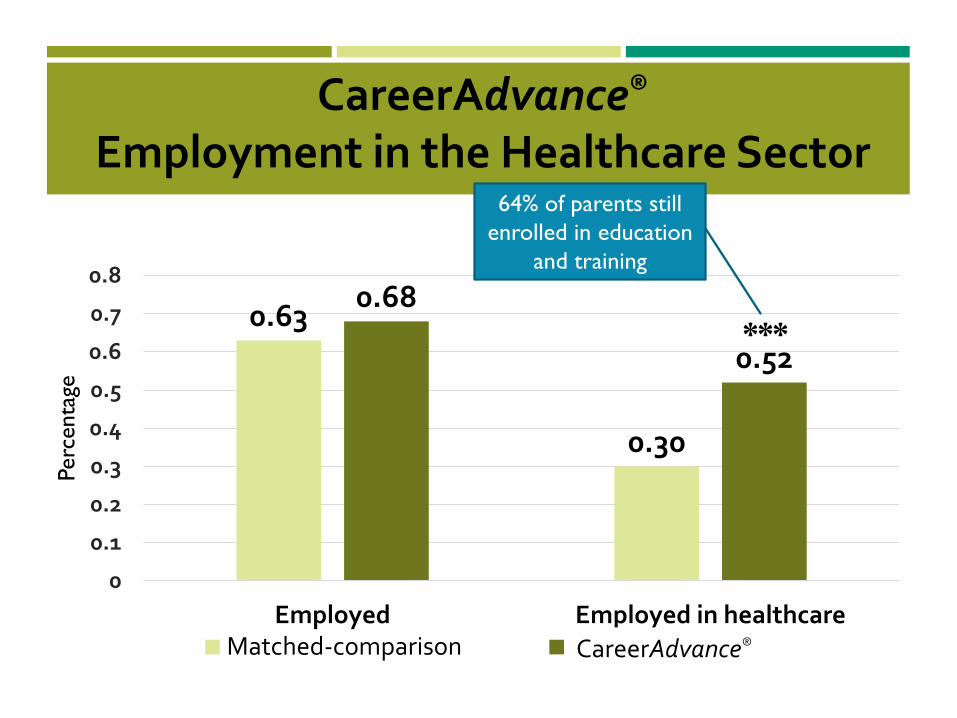
CareerAdvance®
Employment in the Healthcare Sector
0.63
0.30
0.68
0.52
0
0.1
0.2
0.3
0.4
0.5
0.6
0.7
0.8
Employed Employed in healthcare
Perc
enta
ge
Matched-comparison CareerAdvance
***
CareerAdvance®
64% of parents still enrolled in education
and training
CareerAdvance® does not yet Increase or Decrease Earnings
No increase or decrease in earnings
Average incentives in first year ($1,811) may have offset reduced earnings
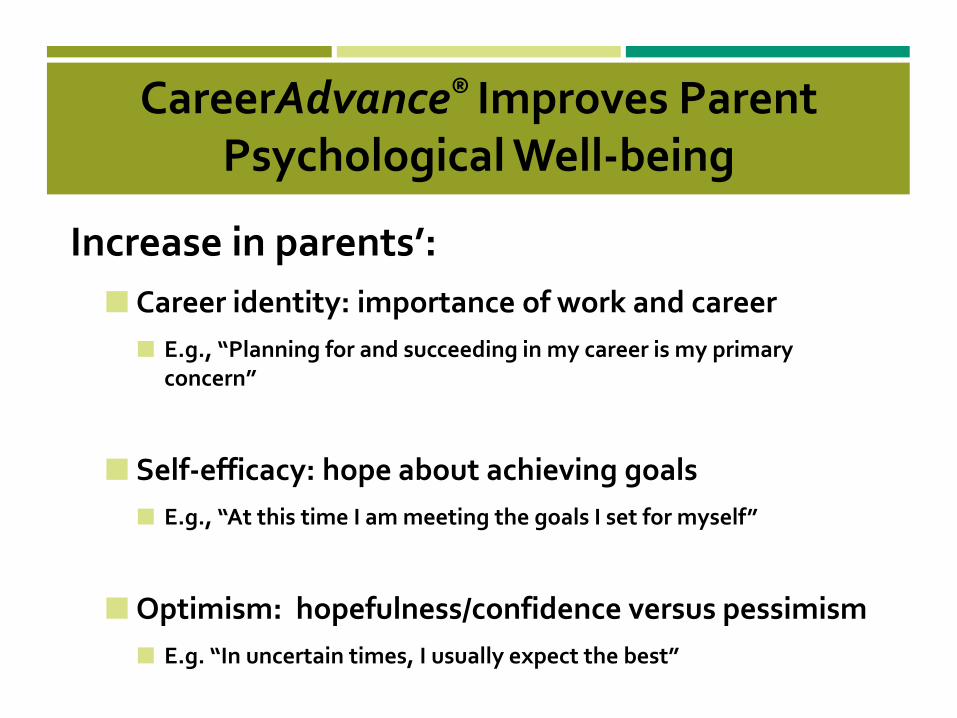
CareerAdvance® Improves Parent Psychological Well-being
Increase in parents’:
Career identity: importance of work and career E.g., “Planning for and succeeding in my career is my primary
concern”
Self-efficacy: hope about achieving goals E.g., “At this time I am meeting the goals I set for myself”
Optimism: hopefulness/confidence versus pessimism E.g. “In uncertain times, I usually expect the best”
CareerAdvance® Participants do not have Higher Stress Or Distress
No increase or decrease in perceived stress or psychological distress
Child Outcomes
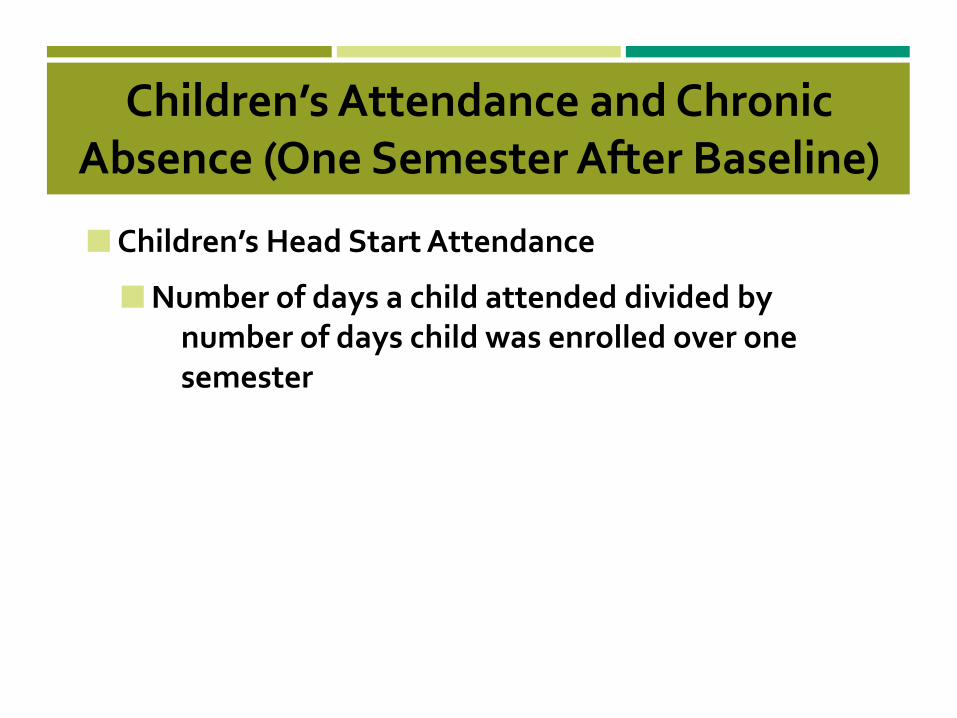
Children’s Attendance and Chronic Absence (One Semester After Baseline)
Children’s Head Start Attendance
Number of days a child attended divided by number of days child was enrolled over one semester
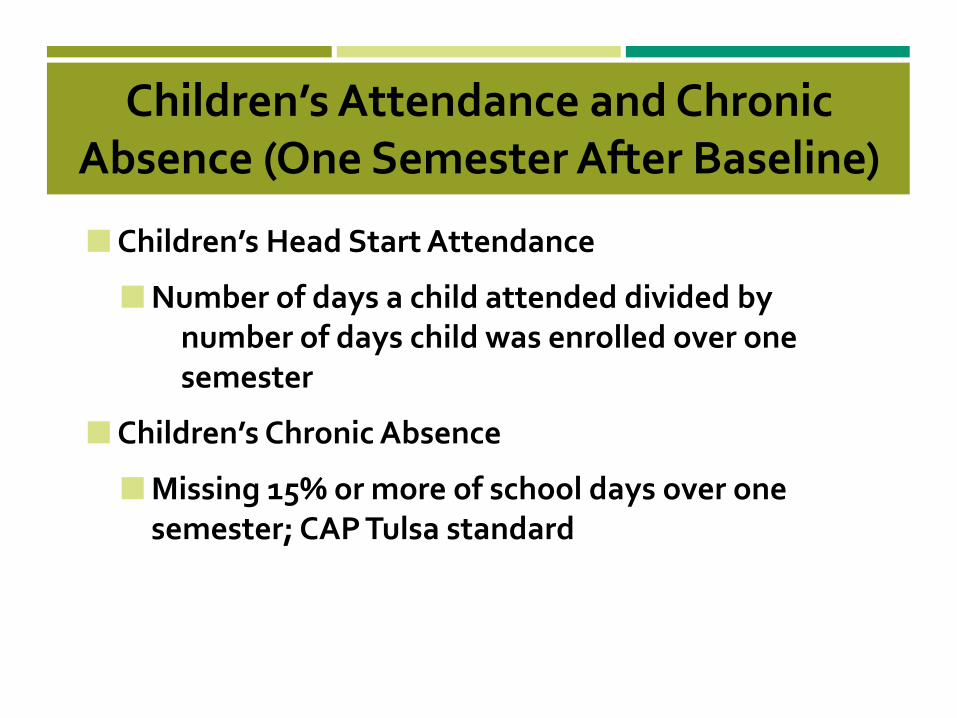
Children’s Attendance and Chronic Absence (One Semester After Baseline)
Children’s Head Start Attendance
Number of days a child attended divided by number of days child was enrolled over one semester
Children’s Chronic Absence
Missing 15% or more of school days over one semester; CAP Tulsa standard
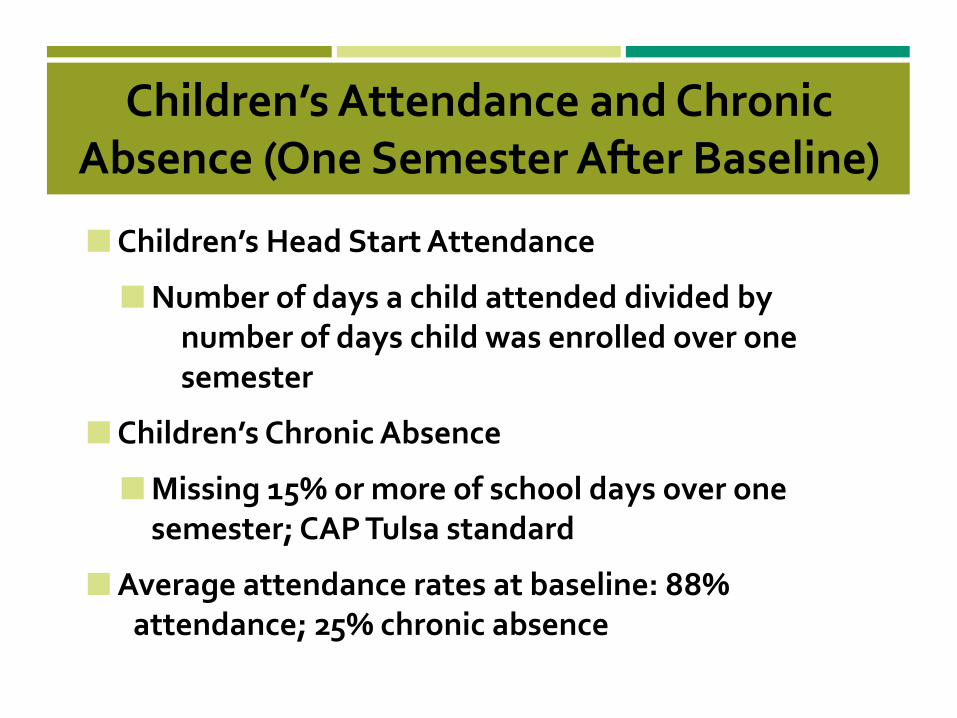
Children’s Attendance and Chronic Absence (One Semester After Baseline)
Children’s Head Start Attendance
Number of days a child attended divided by number of days child was enrolled over one semester
Children’s Chronic Absence
Missing 15% or more of school days over one semester; CAP Tulsa standard
Average attendance rates at baseline: 88% attendance; 25% chronic absence
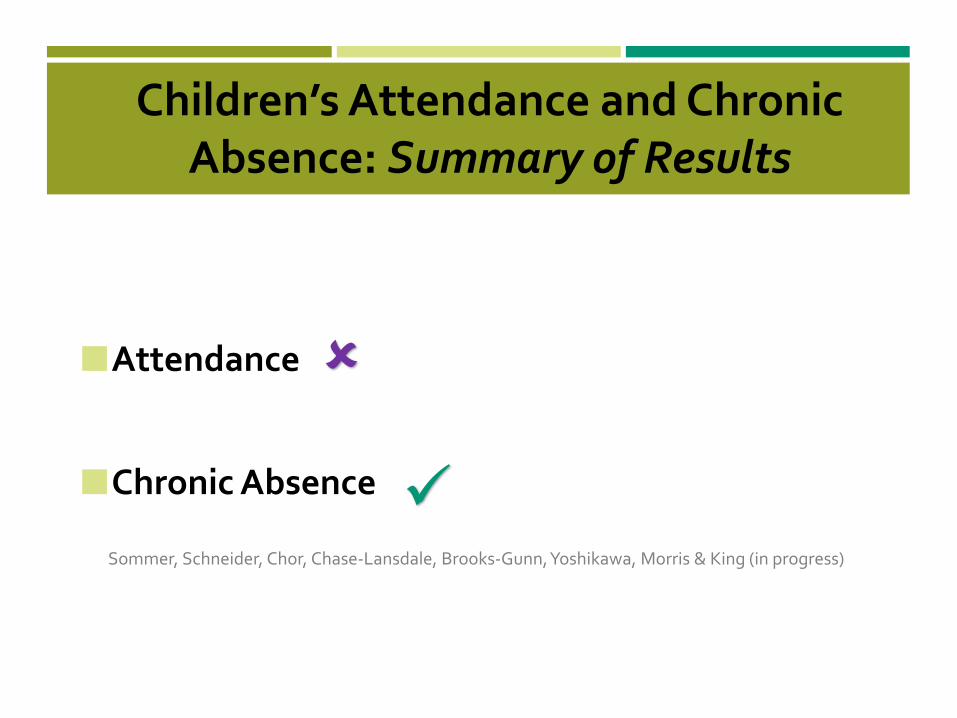
Children’s Attendance and Chronic Absence: Summary of Results
Attendance
Chronic Absence
Sommer, Schneider, Chor, Chase-Lansdale, Brooks-Gunn, Yoshikawa, Morris & King (in progress)
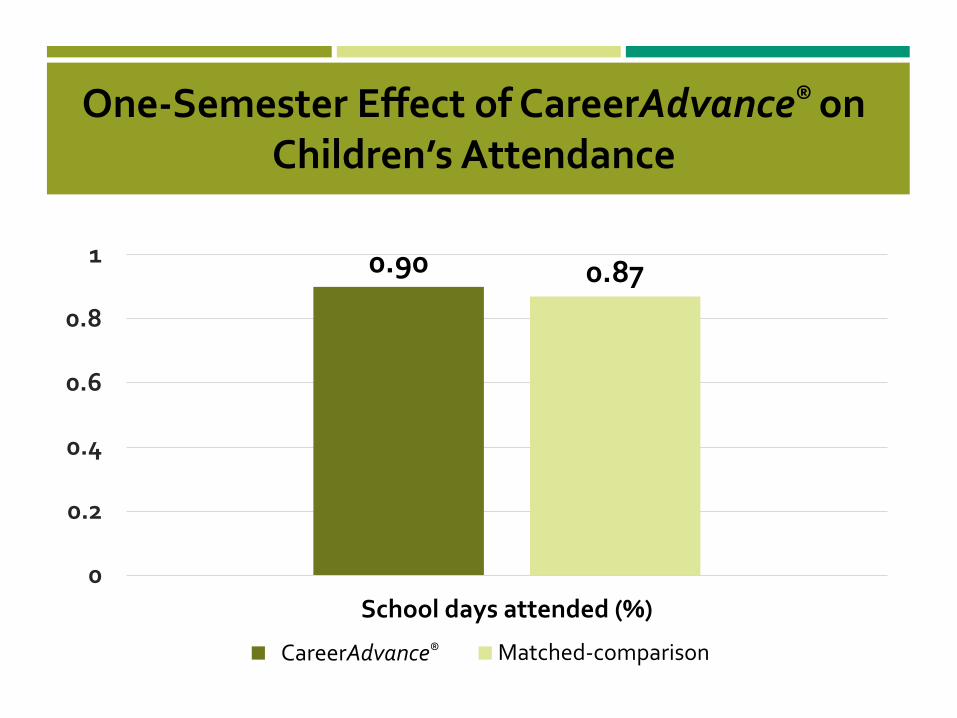
One-Semester Effect of CareerAdvance® on Children’s Attendance
0.90 0.87
0
0.2
0.4
0.6
0.8
1
School days attended (%)
CareerAdvance® Matched-comparisonCareerAdvance®
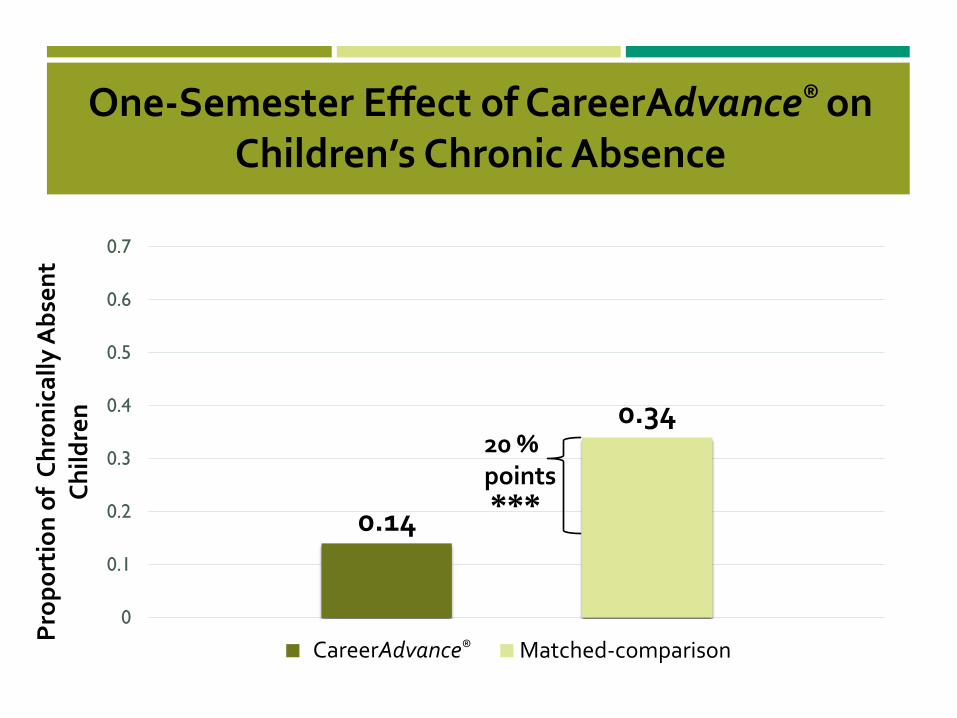
One-Semester Effect of CareerAdvance® on Children’s Chronic Absence
0.14
0.34
0
0.1
0.2
0.3
0.4
0.5
0.6
0.7
Pro
port
ion
of C
hron
ical
ly A
bsen
t Ch
ildre
n
CareerAdvance® Matched-comparison
***
20 % points
CareerAdvance®
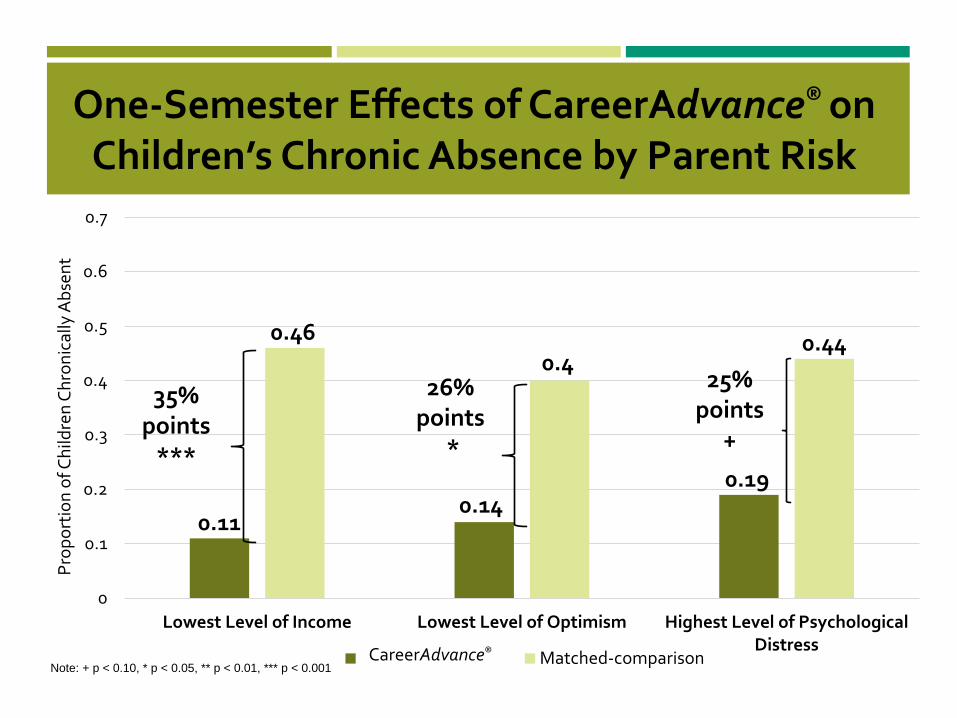
One-Semester Effects of CareerAdvance® on Children’s Chronic Absence by Parent Risk
0.110.14
0.19
0.460.4
0.44
0
0.1
0.2
0.3
0.4
0.5
0.6
0.7
Lowest Level of Income Lowest Level of Optimism Highest Level of PsychologicalDistress
Prop
ortio
n of
Chi
ldre
n Ch
roni
cally
Abs
ent
CareerAdvance® Matched-comparison
35% points
***
26%points
*
Note: + p < 0.10, * p < 0.05, ** p < 0.01, *** p < 0.001
25%points
+
CareerAdvance®
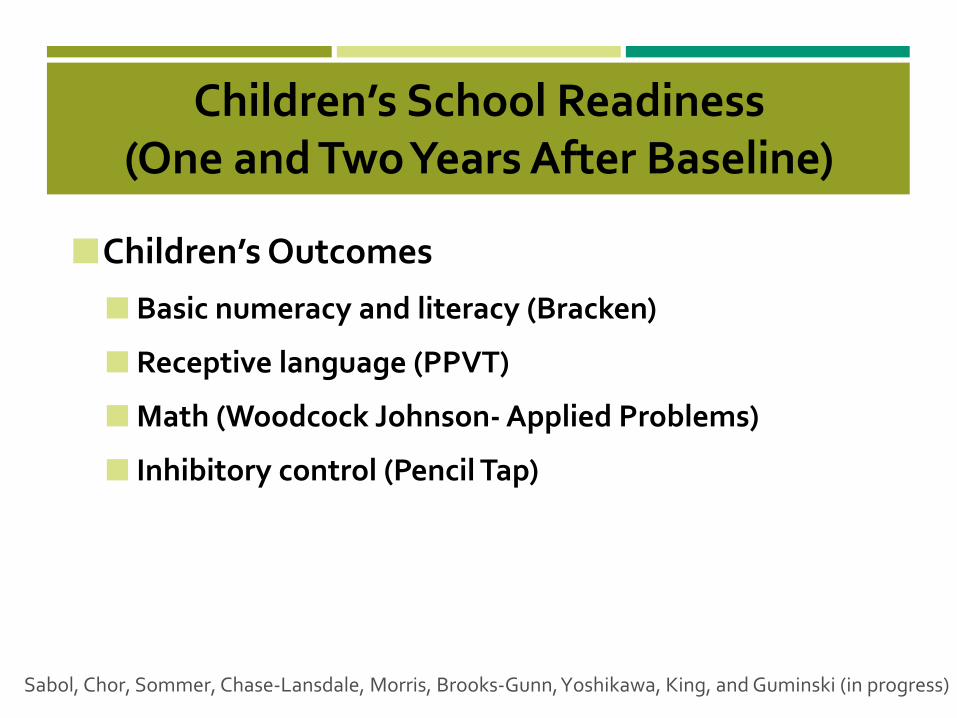
Children’s School Readiness(One and Two Years After Baseline)
Children’s Outcomes
Basic numeracy and literacy (Bracken)
Receptive language (PPVT)
Math (Woodcock Johnson- Applied Problems)
Inhibitory control (Pencil Tap)
Sabol, Chor, Sommer, Chase-Lansdale, Morris, Brooks-Gunn, Yoshikawa, King, and Guminski (in progress)
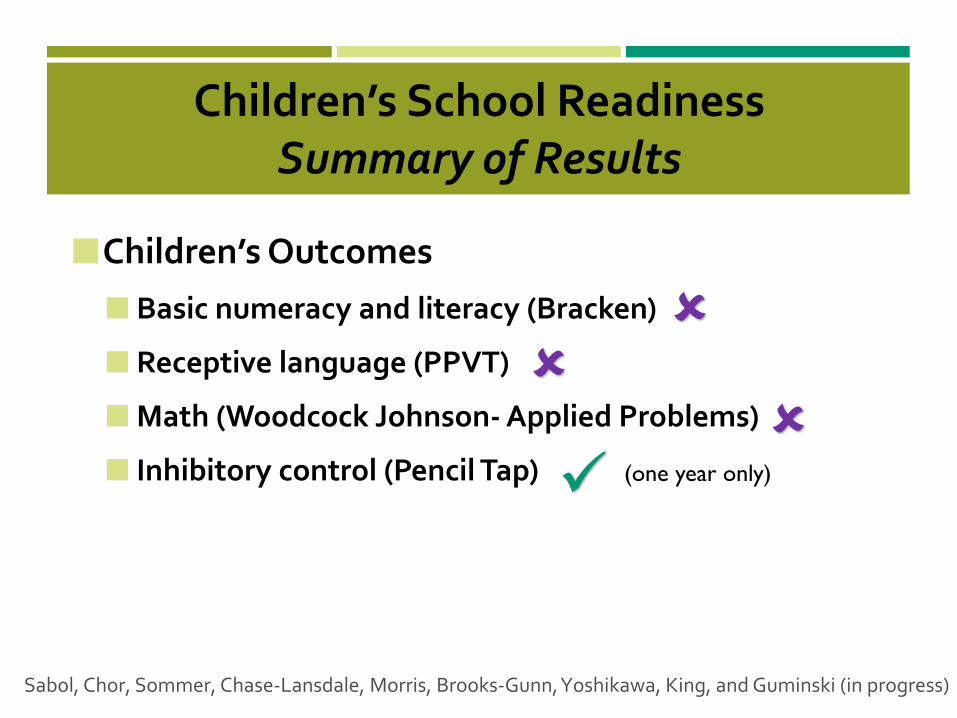
Children’s School ReadinessSummary of Results
Children’s Outcomes
Basic numeracy and literacy (Bracken)
Receptive language (PPVT)
Math (Woodcock Johnson- Applied Problems)
Inhibitory control (Pencil Tap)
Sabol, Chor, Sommer, Chase-Lansdale, Morris, Brooks-Gunn, Yoshikawa, King, and Guminski (in progress)
(one year only)
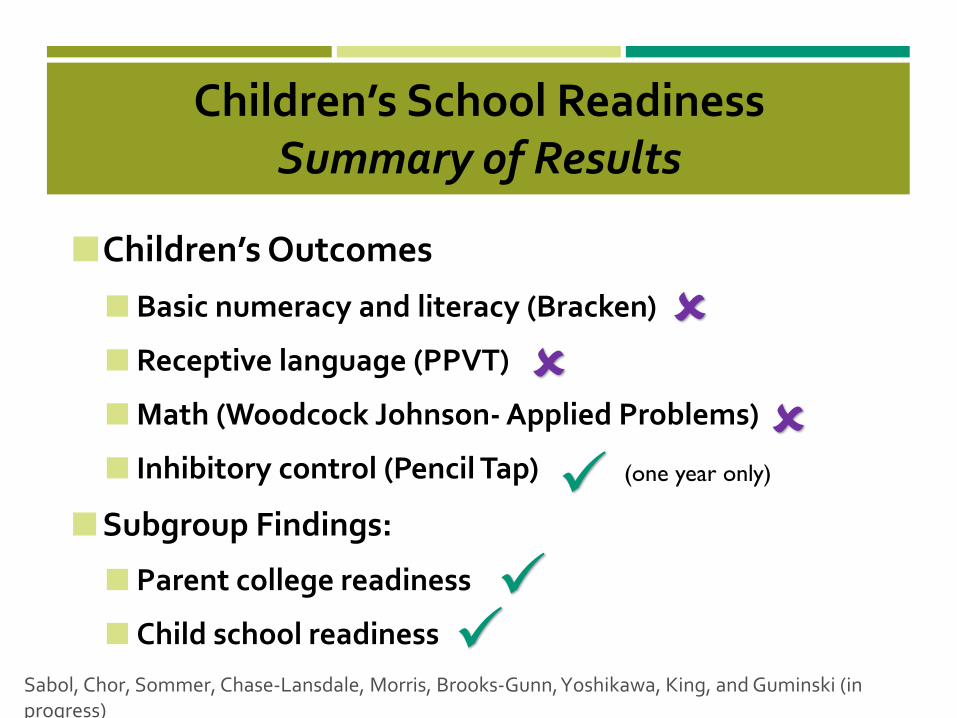
Children’s School ReadinessSummary of Results
Children’s Outcomes
Basic numeracy and literacy (Bracken)
Receptive language (PPVT)
Math (Woodcock Johnson- Applied Problems)
Inhibitory control (Pencil Tap)
Subgroup Findings:
Parent college readiness
Child school readinessSabol, Chor, Sommer, Chase-Lansdale, Morris, Brooks-Gunn, Yoshikawa, King, and Guminski (in progress)
(one year only)
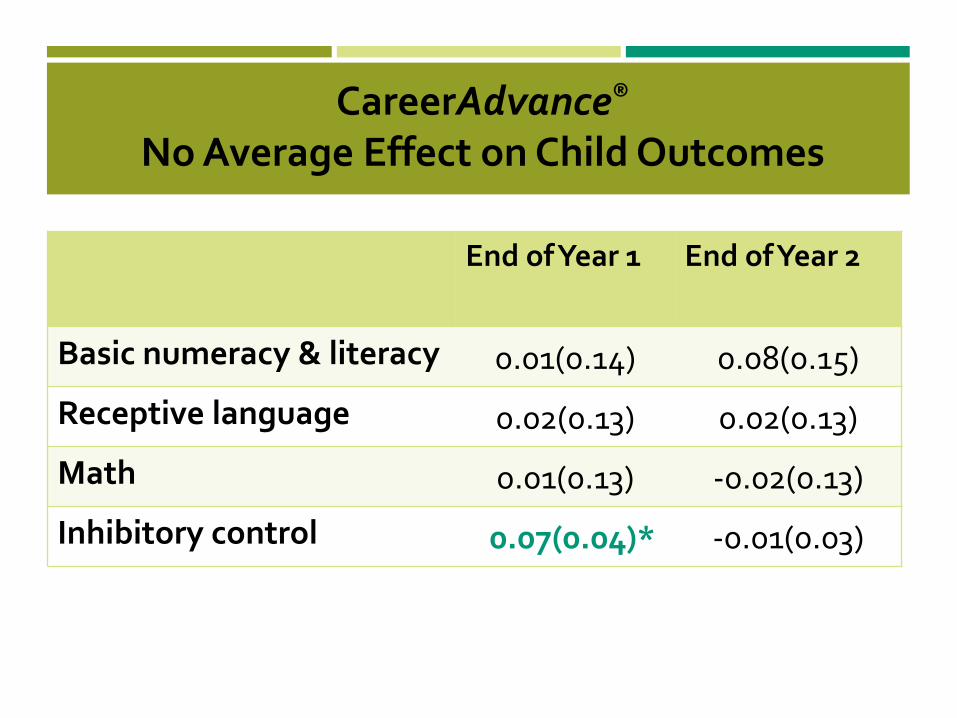
CareerAdvance®
No Average Effect on Child Outcomes
End of Year 1 End of Year 2
Basic numeracy & literacy 0.01(0.14) 0.08(0.15)
Receptive language 0.02(0.13) 0.02(0.13)
Math 0.01(0.13) -0.02(0.13)
Inhibitory control 0.07(0.04)* -0.01(0.03)
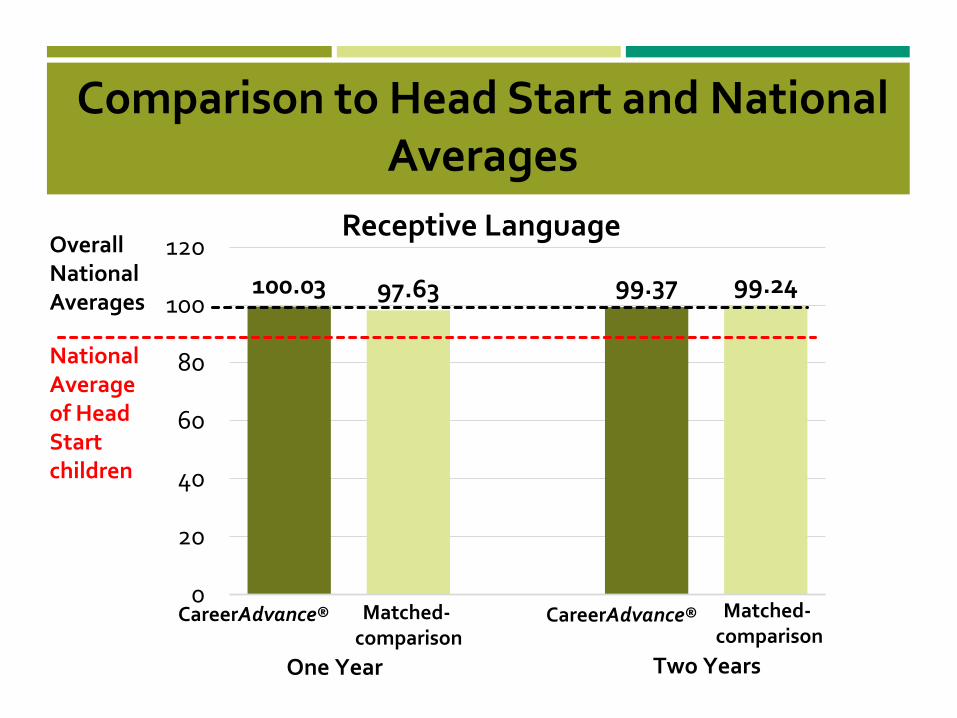
Comparison to Head Start and National Averages
100.03 97.63 99.37 99.24
0
20
40
60
80
100
120
One Year Two Years
NationalAverageof Head Startchildren
Matched-comparison
Matched-comparison
CareerAdvance® CareerAdvance®
Receptive LanguageOverall National Averages
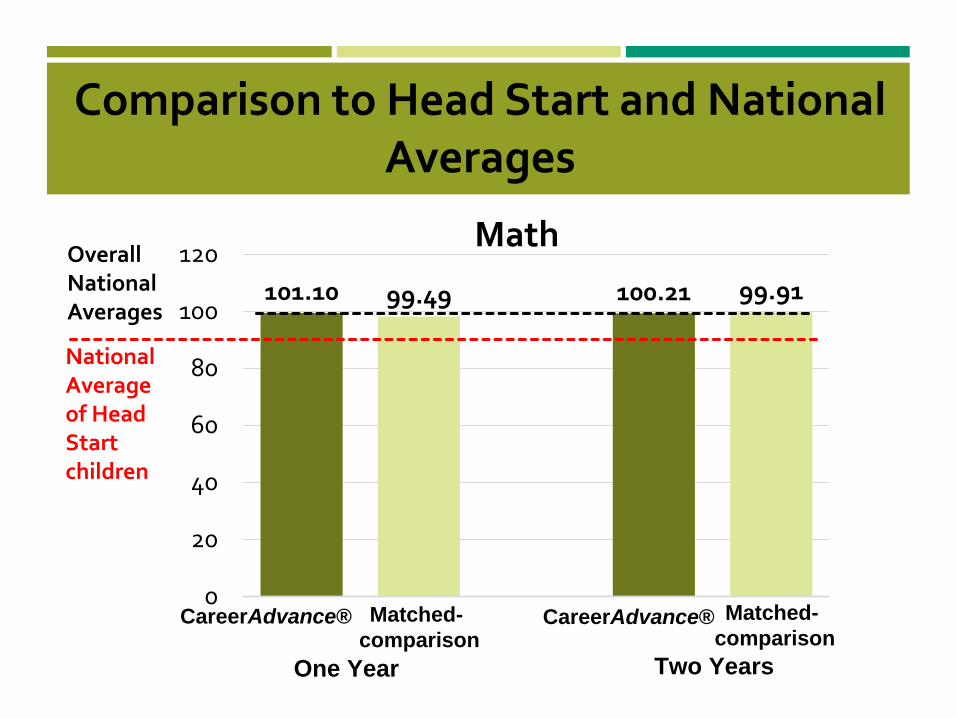
Comparison to Head Start and National Averages
101.10 99.49 100.21 99.91
0
20
40
60
80
100
120
One Year Two Years
NationalAverageof Head Startchildren
Matched-comparison
Matched-comparison
CareerAdvance® CareerAdvance®
MathOverall National Averages
Child OutcomesSubgroup Analysis
Parent college readiness: index of parent educational attainment (high school or more), age (>28), income ($24k), household size (>2) (low versus high)
Child school readiness: baseline academic achievement (below versus above national mean)
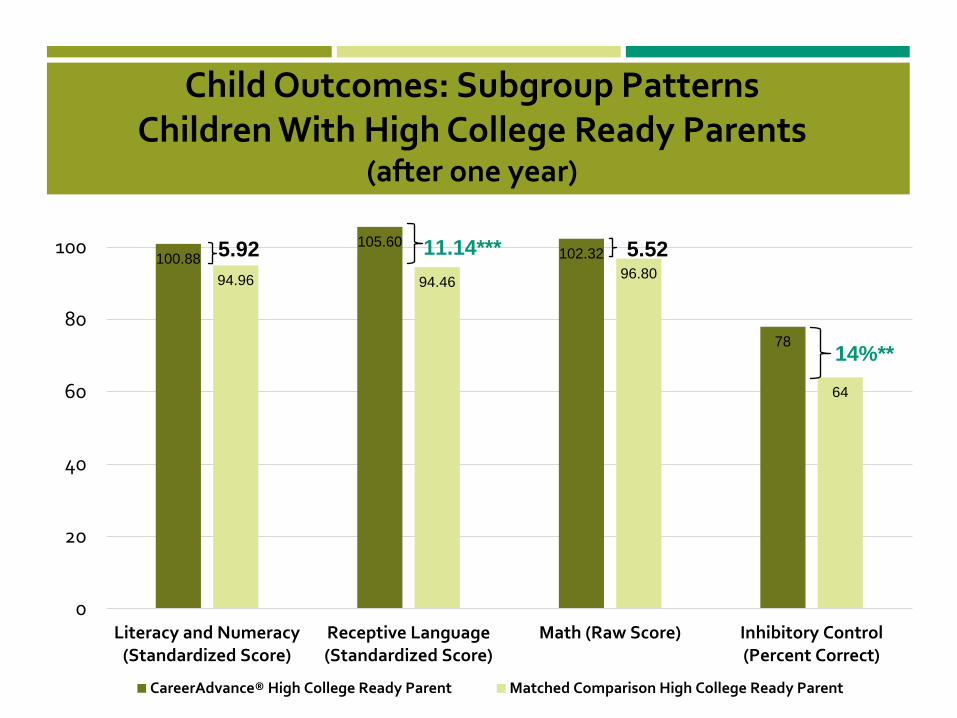
Child Outcomes: Subgroup PatternsChildren With High College Ready Parents
(after one year)
100.88105.60
102.32
78
94.96 94.46 96.80
64
0
20
40
60
80
100
Literacy and Numeracy(Standardized Score)
Receptive Language(Standardized Score)
Math (Raw Score) Inhibitory Control(Percent Correct)
CareerAdvance® High College Ready Parent Matched Comparison High College Ready Parent
5.92 11.14*** 5.52
14%**
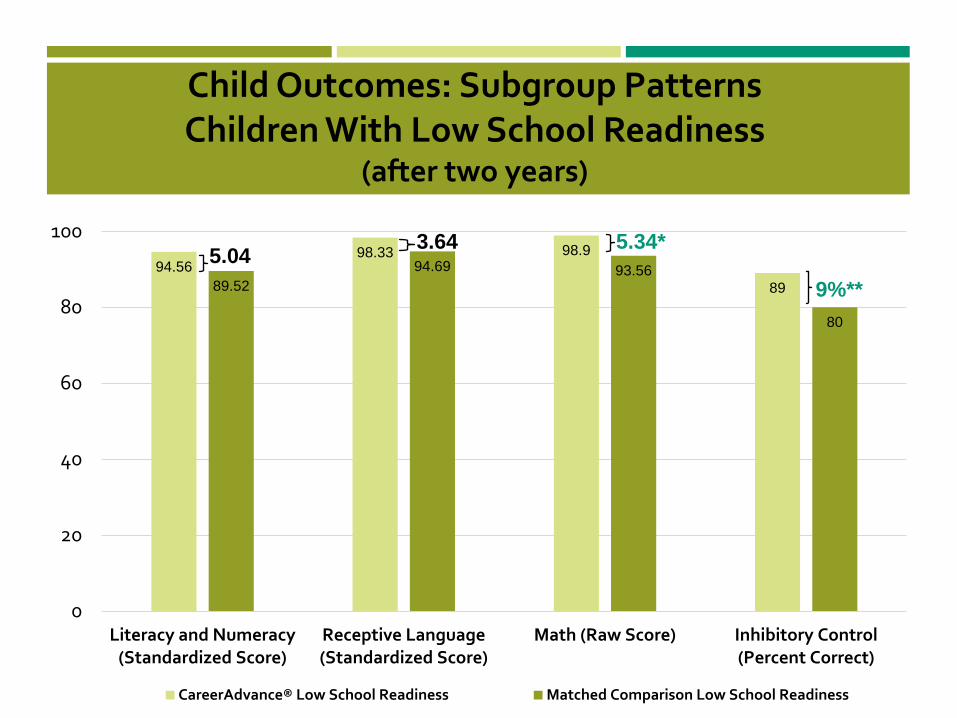
Child Outcomes: Subgroup PatternsChildren With Low School Readiness
(after two years)
94.5698.33 98.9
8989.5294.69 93.56
80
0
20
40
60
80
100
Literacy and Numeracy(Standardized Score)
Receptive Language(Standardized Score)
Math (Raw Score) Inhibitory Control(Percent Correct)
CareerAdvance® Low School Readiness Matched Comparison Low School Readiness
5.04 3.64 5.34*
9%**
Pulling It All Together
Parent
Promotes parents’ education, healthcare employment, and psychological wellbeing
Child
Led to reductions in children’s rates of chronic absence (but not overall attendance) in Head Start
Adding parent workforce training does not interfere with and in some cases exceeds the benefits to children of high quality Head Start
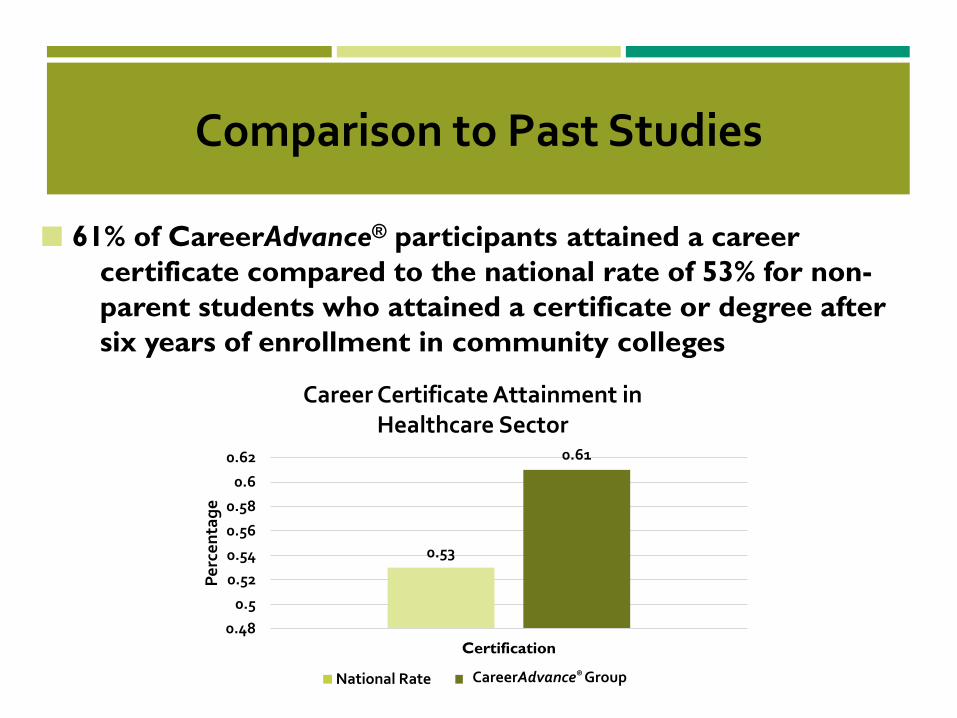
61% of CareerAdvance® participants attained a career certificate compared to the national rate of 53% for non-parent students who attained a certificate or degree after six years of enrollment in community colleges
0.53
0.61
0.48
0.5
0.52
0.54
0.56
0.58
0.6
0.62
Certification
Perc
enta
ge
Career Certificate Attainment in Healthcare Sector
National Rate CareerAdvance® Group
Comparison to Past Studies
CareerAdvance® Group
Pulling It All Together
Parent
Promotes parents’ education, healthcare employment, and psychological wellbeing
Child
Led to reductions in children’s rates of chronic absence (but not overall attendance) in Head Start
Adding parent workforce training does not interfere with and in some cases exceeds the benefits to children of high quality Head Start
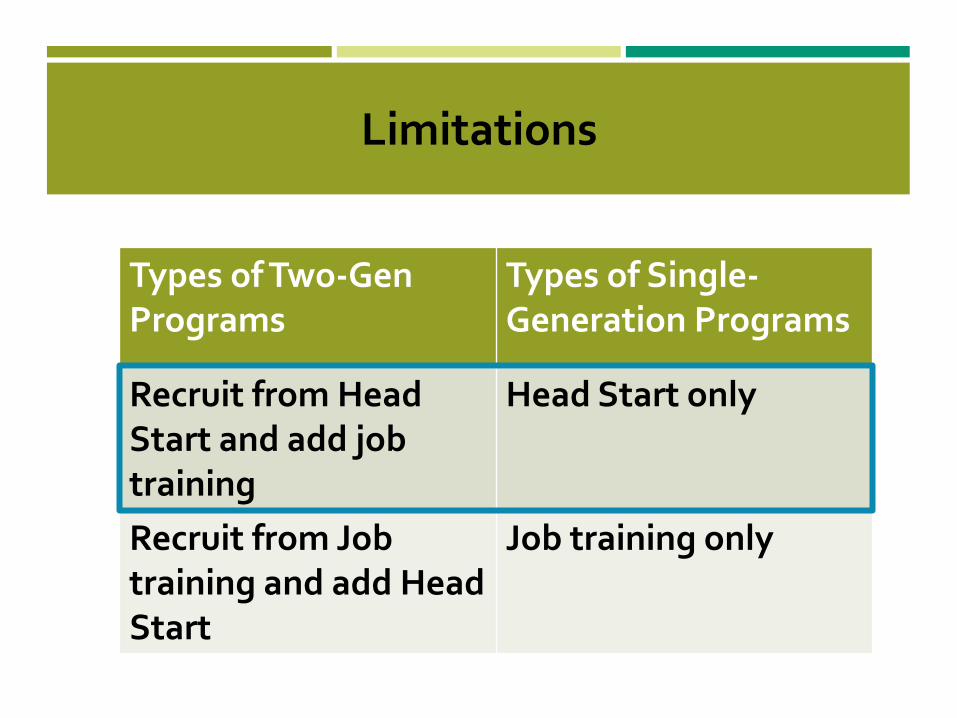
Limitations
Types of Two-Gen Programs
Types of Single-Generation Programs
Recruit from Head Start and add job training
Head Start only
Recruit from Job training and add Head Start
Job training only
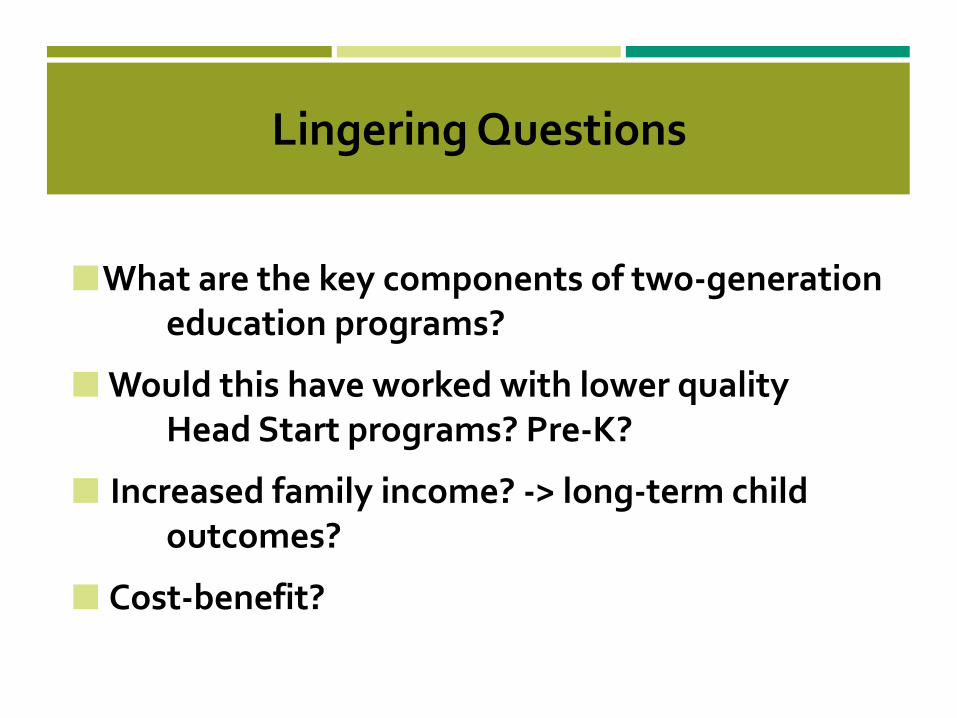
Lingering Questions
I
What are the key components of two-generation education programs?
Would this have worked with lower quality Head Start programs? Pre-K?
ncreased family income? -> long-term child outcomes?
Cost-benefit?
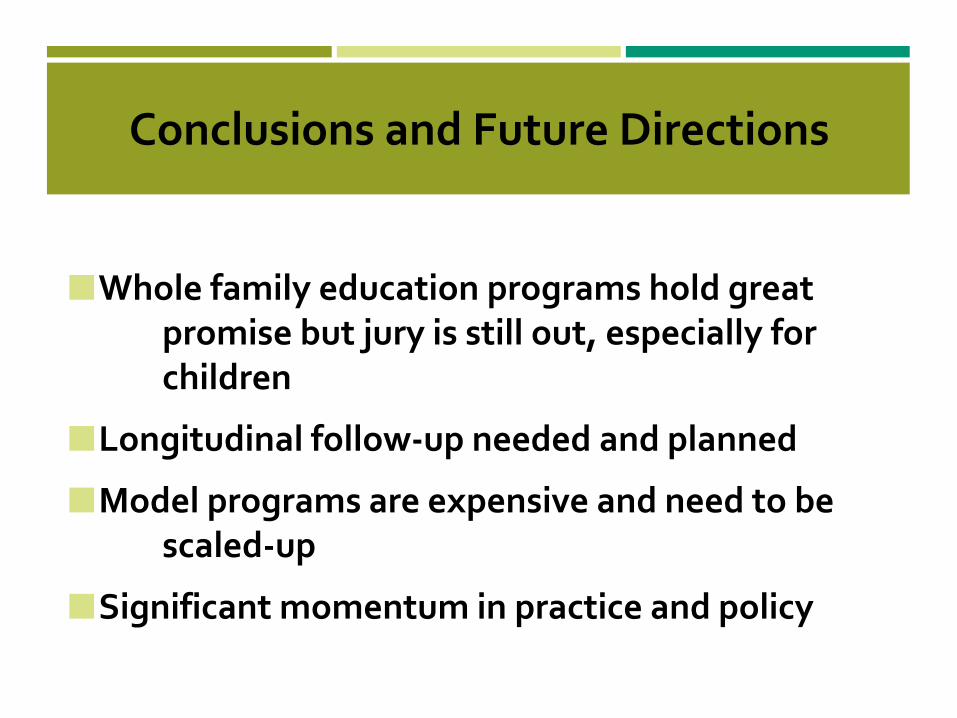
Conclusions and Future Directions
Whole family education programs hold great promise but jury is still out, especially for children
Longitudinal follow-up needed and planned
Model programs are expensive and need to be scaled-up
Significant momentum in practice and policy
Acknowledgements
91Join the Conversation
•
•
•
Submit questions through the Question and Answer feature (bottom right of screen).
Questions will be answered after the presentations are complete.
Join the conversation on Twitter using the #SSRCWebinar hashtag.
92Self-Sufficiency Research Clearinghouse
Thank you!