Embed Size (px)
Citation preview
ORIGINAL RESEARCH
Whole Brain White Matter HistogramAnalysis of Diffusion Tensor Imaging DataDetects Microstructural Damage in MildCognitive Impairment and Alzheimer’s
Disease Patients
Giovanni Giulietti, MPhys,1* Mario Torso, PhD,1 Laura Serra, PhD,1
Barbara Span�o, PhD,1 Camillo Marra, MD,2 Carlo Caltagirone, MD,3,4
Mara Cercignani, PhD,1,5 Marco Bozzali, MD,1 and
the Alzheimer’s Disease Neuroimaging Initiative (ADNI)
Background: Amnestic mild cognitive impairment (MCI) is a transitional stage between normal aging and Alzheimer’sdisease (AD). However, the clinical conversion from MCI to AD is unpredictable. Hence, identification of noninvasivebiomarkers able to detect early changes induced by dementia is a pressing need.Purpose: To explore the added value of histogram analysis applied to measures derived from diffusion tensor imaging(DTI) for detecting brain tissue differences between AD, MCI, and healthy subjects (HS).Study Type: Prospective.Population/Subjects: A local cohort (57 AD, 28 MCI, 23 HS), and an Alzheimer’s Disease Neuroimaging Initiative(ADNI) cohort (41 AD, 58 MCI, 41 HS).Field Strength: 3T. Dual-echo turbo spin echo (TSE); fluid-attenuated inversion recovery (FLAIR); modified-driven-equilibrium-Fourier-transform (MDEFT); inversion-recovery spoiled gradient recalled (IR-SPGR); diffusion tensor imaging(DTI).Assessment: Normal-appearing white matter (NAWM) masks were obtained using the T1-weighted volumes for tissuesegmentation and T2-weighted images for removal of hyperintensities/lesions. From DTI images, fractional anisotropy(FA), mean diffusivity (MD), axial diffusivity (AXD), and radial diffusivity (RD) were obtained. NAWM histograms of FA,MD, AXD, and RD were derived and characterized estimating: peak height, peak location, mean value (MV), and quar-tiles (C25, C50, C75), which were compared between groups. Receiver operating characteristic (ROC) and area underROC curves (AUC) were calculated. To confirm our results, the same analysis was repeated on the ADNI dataset.Statistical Tests: One-way analysis of variance (ANOVA), post-hoc Student’s t-test, multiclass ROC analysis.Results: For the local cohort, C25 of AXD had the maximum capability of group discrimination with AUC of 0.80 for“HS vs. patients” comparison and 0.74 for “AD vs. others” comparison. For the ADNI cohort, MV of AXD revealed themaximum group discrimination capability with AUC of 0.75 for “HS vs. patients” comparison and 0.75 for “AD vs. oth-ers” comparison.Data Conclusion: AXD of NAWM might be an early marker of microstructural brain tissue changes occurring during theAD course and might be useful for assessing disease progression.Level of Evidence: 1Technical Efficacy: Stage 2
J. MAGN. RESON. IMAGING 2017;00:000–000.
View this article online at wileyonlinelibrary.com. DOI: 10.1002/jmri.25947
Received Apr 27, 2017, Accepted for publication Dec 21, 2017.
*Address reprint requests to: G.G., Santa Lucia Foundation, Via Ardeatina 306, 00179 Rome, Italy. E-mail: [email protected]
From the 1Neuroimaging Laboratory, IRCCS Santa Lucia Foundation, Rome, Italy; 2Institute of Neurology, Catholic University, Rome, Italy; 3Department of
Systemic Medicine, University of Tor Vergata, Rome, Italy; 4Clinical and Behavioral Neurology Laboratory, IRCCS Santa Lucia Foundation, Rome, Italy; and5Department of Neuroscience, Clinical Imaging Sciences Centre, Brighton and Sussex Medical School, University of Sussex, Brighton, East Sussex, UK
VC 2018 International Society for Magnetic Resonance in Medicine 1
Amnestic mild cognitive impairment (MCI) is regarded
as a transitional stage between normal aging and fully
developed Alzheimer’s disease (AD).1 However, the short-
term clinical conversion from MCI to AD remains largely
unpredictable. The identification of noninvasive biomarkers
with the ability of staging MCI patients is becoming more
and more critical for patients’ management and clinical tri-
als. While the standard diagnostic criteria for MCI are based
on clinical/neuropsychological assessment,1 several bio-
markers,2 have been proposed to improve diagnostic accu-
racy, such as medial temporal lobe atrophy,3 positron
emission tomography (PET) imaging measures such as beta-
amyloid plaque load and index of cerebral glucose metabo-
lism,4,5 and cerebrospinal fluid (CSF) levels of beta-amyloid
and phospho-tau.6 However, medial temporal lobe atrophy
has been shown not to be an early biomarker, being not evi-
dent in the asymptomatic stage of AD,7 while CSF assess-
ment is an invasive procedure and PET imaging requires the
injection of a radioactive tracer that could present side
effects (eg, allergic reaction). A large body of literature has
demonstrated that white matter (WM) damage is present
since the early clinical stages of AD, and strongly contrib-
utes to the disease progression.8
Diffusion tensor imaging (DTI) is one of the preferred
magnetic resonance imaging (MRI) methods for WM inves-
tigation in vivo, detecting macro- and microscopic tissue
abnormalities.9 To date, several DTI-derived indices (eg,
fractional anisotropy [FA], mean diffusivity [MD], axial
[AXD], and radial diffusivity [RD]) have been proposed as
reflecting different aspects of WM microstructure and dam-
age.10 Against this background it is conceivable that these
different DTI parameters may change differently across AD
evolution, possibly reflecting different aspects of AD patho-
physiology (eg, axonal damage and loss, demyelination,
etc.).
Histogram analysis has been largely used to analyze
data coming from MRI for the investigation of various neu-
rological disorders.11–13 This approach offers the advantage,
compared to region of interest or voxel-based analyses, of
being operator-independent and of summarizing the infor-
mation from a whole image into a few simple numerical
indices.
The principal aim of this study was to define the evo-
lution of WM damage as assessed by different DTI-based
histogram parameters at different AD stages. The secondary
aim was to identify the most promising prognostic parame-
ter (or set of parameters) to be used in clinical settings.
Materials and Methods
SubjectsThis prospective study was approved by the local Ethics Commit-
tee and written informed consent was obtained from all partici-
pants before the study initiation.
One hundred patients were recruited from the Specialist
Dementia Clinics of our institution (Table 1). Fifteen patients
were excluded for the following reasons: 1) claustrophobia or poor
cooperation during MRI, with scanning interruption before com-
pleting the protocol acquisition (n 5 7); and 2) the presence of
artifacts on MR images (n 5 8). Out of the 85 enrolled patients,
57 fulfilled the diagnostic criteria for AD and 28 those of amnestic
MCI, as defined below. The diagnosis of AD was made according
to the National Institute of Neurological and Communication Dis-
orders and Stroke/Alzheimer’s Disease and Related Disorders Asso-
ciation criteria (NINCDS-ADRDA).14 AD patients also had to
fulfill the Diagnostic and Statistical Manual of Mental Disorders
(DSM-5) criteria for major neurocognitive disorders.15
MCI patients had to show episodic memory disorders1 and
no or very mild impairment in daily living activities, with a total
Clinical Dementia Rating score not exceeding 0.5.16 Within 3 days
after recruitment, patients underwent neuropsychological and
behavioral assessments and an MRI scan. With respect to the pres-
ence and severity of macroscopic WM lesions, there are no definite
cutoff criteria available to discriminate between vascular and neuro-
degenerative dementia. To reduce as much as possible the risk of
including patients with vascular MCI, principal comorbidities (ie,
diabetes, hypertension, hyperlipidemia, arrhythmias) and risk fac-
tors (ie, alcohol abuse) for developing cerebrovascular pathology
were ruled out in all patients. Additionally, in every patient, the
Hachinski score,17 a clinical tool often used to differentiate
between AD and vascular dementia, had to be less than 4, and the
total WM lesion volume had not to exceed 25 ml.18
Twenty-three healthy elderly subjects (HS) were also
recruited from the relatives of patients and served as a control
group (Table 1). All HS with major systemic and neurological ill-
nesses, cognitive deficits, and Behavioral and Psychological Symp-
toms of Dementia (BPSD) were excluded. Finally, to reduce any
potential source of variability due to hemispheric dominance, all
subjects had to be right-handed, as assessed by the Edinburgh
Handedness Inventory.19 From now on, we refer to this group of
108 subjects as the local cohort.
Neuropsychological Assessment (Local Cohort)All subjects of the local cohort underwent a neuropsychological
battery, including the following tests: verbal episodic long-term
memory: 15-Word List (Immediate and 15-min Delayed recall)20
and Short Story Test (Immediate and 20-min Delayed recall)20;
visuospatial episodic long-term memory: Complex Rey’s Figure
(Immediate and 20-min Delayed recall)20; short-term memory:
Digit span and the Corsi Block Tapping task21; executive func-
tions: Phonological Word Fluency20 and Modified Card Sorting
Test20; language: Naming objects subtest of the BADA (Batteria
per l’Analisi dei Deficit Afasici)22; reasoning: Raven’s Coloured
Progressive Matrices20; constructional praxis: Copy of simple draw-
ings with and without landmarks,20 and Copy of Complex Rey’s
Figure20; general cognitive efficiency: Mini-Mental State Examina-
tion (MMSE).20,23 For all employed tests, we used the Italian nor-
mative data for both score adjustment (sex, age, and education)
and to define cutoff scores of normality, determined as the lower
limit of the 95% tolerance interval for a confidence level of 95%.
Journal of Magnetic Resonance Imaging
2 Volume 00, No. 00

For each test, normative data are reported in the corresponding
references.
MRI Data Acquisition (Local Cohort)All subjects of the local cohort underwent MRI scanning at 3T
(Magnetom Allegra, Siemens, Erlangen, Germany), including the
following acquisitions: 1) dual-echo turbo spin echo (dual-echo
TSE, repetition time [TR] 5 7600 msec, echo time [TE] 5 12/
109 msec, matrix 5 256 3 192, field of view [FOV] 5 230 3
172.5 mm2, slice thickness 3 mm); 2) fast-fluid-attenuated inver-
sion recovery (FLAIR; TR 5 8170 msec, TE 5 96 msec, inversion
time [TI] 5 2100 msec, same matrix, FOV, and slice thickness as
the TSE); 3) 3D modified-driven-equilibrium-Fourier-transform
(MDEFT; TR 5 1394 msec, TE 5 2.4 msec, TI 5 910 msec,
matrix 5 256 3 224 3 176, in-plane FOV 5 256 3 224 mm2,
slice thickness 5 1 mm); 4) diffusion-weighted (DW) twice-
refocused spin-echo echo planar imaging (SE EPI; TR 5 10.2 sec,
TE 5 85 msec, b factor 5 1000 s/mm2, isotropic resolution 5
2.3 mm3). This last sequence collects seven images with no diffu-
sion weighting (b0) and 61 images with diffusion gradients applied
in 61 noncollinear directions.
Image Processing and Histogram Analysis (LocalCohort)
BRAIN TISSUE SEGMENTATION. White matter hyperintensities
(WMHs) were identified by consensus of two trained observers
(with 3 and 10 years of experience in head imaging analysis,
respectively) on the T2-weighted image (the longest echo time
image of sequence1), using semiautomated local thresholding con-
touring software (Jim 4.0, Xinapse System, Leicester, UK, http://
www.xinapse.com/). FLAIR images were used to increase confi-
dence in lesion identification.
Binary lesion masks and lesion volumes were then calculated.
The T2-weighted images were then affine-registered to the
TABLE 1. Principal Demographic and Clinical Characteristics of the Participants Belonging to the Local (UpperNumbers) and ADNI (Lower Numbers) Cohorts
AD MCI HS P-value
AD vs. MCI
P-value
AD vs. HS
P-value
MCI vs. HS
N 5741
2858
2341
Age (years) 72.2 [6.6]74.5 [8.5]
70.9 [8.5]72.2 [6.9]
68.4 [6.9]71.9 [6.1]
ANOVA ns: 0.11ANOVA ns: 0.18
Female/male ratio 36/2115/26
16/1220/38
10/1323/18
chi-square ns: 0.27chi-square ns: 0.07
Education (years) 9.2 [4.3]a
not available9.9 [4.6]not available
12.2 [2.9]not available
0.302/
0.011/
0.043/
MMSEc 21.0 [3.9]a,b
22.3 [3.6]a,b26.8 [1.8]a
27.0 [1.9]a29.0 [1.0]28.9 [1.1]
< 0.001< 0.001
< 0.001< 0.001
< 0.001< 0.001
GM fraction 0.42 [0.02]a,b
0.37 [0.03]a,b0.43 [0.02]0.40 [0.03]a
0.44 [0.01]0.42 [0.02]
0.0090.002
< 0.001< 0.001
0.053< 0.001
NAWM fraction 0.31 [0.02]0.29 [0.03]a,b
0.32 [0.02]0.31 [0.02]
0.32 [0.02]0.31 [0.02]
ANOVA ns: 0.330.005 < 0.001 0.249
WMHs fraction 0.003 [0.003]0.003 [0.003]
0.003 [0.004]0.003 [0.002]
0.001[0.002]0.002 [0.002]
ANOVA ns: 0.17ANOVA ns: 0.10
Unless otherwise noted, all values are expressed as mean [standard deviation]. All measures were compared between groups using Stu-dent’s t-test. Bonferroni correction was used to account for multiple comparisons (P < 0.05). Statistically significant P-values arehighlighted in bold. AD 5 Alzheimer’s disease; GM 5 gray matter; HS 5 healthy subjects; MCI 5 mild cognitive impairment;MMSE 5 Mini-Mental State Examination (raw); NAWM 5 normal appearing white matter; WMHs 5 white matter hyperinten-sities; ns 5 not significant.aStatistically significant difference between patients (AD or MCI) and HS.bStatistically significant difference between AD and MCI.cDue to lack of data in ADNI database, mean values of MMSE in ADNI cohort were computed in only 30 out of 41 AD, 49 out of58 MCI and 36 out of 41 HS (115 out of 140 subjects).
Giulietti et al.: DTI Histograms for Staging AD
Month 2018 3

T1-weighted images (MDEFT) using ANTs.24 The same transfor-
mation parameters were applied to the lesion mask. Then lesions
were stripped from the T1-weighted images, which were then proc-
essed using SPM8 (www.fil.ion.ucl.ac.uk/spm/) toolbox VBM8
(www.neuro.uni-jena.de/vbm/download/) to yield local volumes
maps of gray matter (GM), normal-appearing white matter
(NAWM), and CSF. These maps were used to compute global
brain tissues volumes (GMvol, NAWMvol, CSFvol). To account
for subjects’ head size differences, the global brain tissue volumes
were expressed as percentages of the total intracranial volume (ICV
5 GMvol1NAWMvol1WMHs_vol1CSFvol), by computing
GM fraction (GMvol/ICV), NAWM fraction (NAWMvol/ICV),
and lesion fraction (WMHs_vol/ICV). These measures were
obtained to further characterize the patient groups included in the
study and ensure consistency with previously reported cohorts.
DTI ANALYSIS. DW images were processed using tools from the
FMRIB software library (FSL, http://fsl.fmrib.ox.ac.uk/fsl/fslwiki/)
and CAMINO (http://camino.cs.ucl.ac.uk/).
First, diffusion data were corrected for misalignment between
volumes according to the following steps:
1. the seven b0 images were realigned to the first b0 volume with
a rigid body transformation and averaged (obtaining meanb0);
2. the seven b0 images were rigidly coregistered to meanb0;
3. the 61 DW volumes were averaged obtaining meanDW;
meanDW was then rigidly coregistered to the scalp stripped
meanb0 image through the transformation T_1;
4. all DW volumes (i 5 1, 2, . . ., 61) were separately realigned
to the meanDW image (with a rigid body transformation,
T_2(i)), and the transformation matching each DW volume
with the meanb0 image was obtained by combining T_2(i) and
T_1.
The b matrices were rotated accordingly.25 The final real-
igned DW volumes were obtained by merging the images from
steps 2 and 4. Therefore, the diffusion tensor was estimated in
every voxel and maps of FA, MD, RD, and AXD were obtained
for each subject.
HISTOGRAM COMPUTATION AND FEATURES EXTRACTION. For
all participants, T1-weighted images were warped to the FA map
using ANTs24; the same nonlinear transformation was then applied
to the NAWM mask. This way we could create histograms of each
DTI measure (FA, MD, AXD, RD) distribution in the NAWM
(four histograms per subject).
An absolute histogram was created by dividing the full range
of image intensity into a number of bins, each spanning a fraction
of the full range and counting the number of voxels with a value
falling in each bin. Absolute NAWM histograms were computed
using 0.5% of the maximum wide bins (200 bins). Absolute histo-
grams were then normalized, dividing by both the bin width and
the total number of voxels contributing to the histogram. The
effect of normalization is to make the shape of the histograms
independent from the brain size.26 Histograms were analyzed fol-
lowing guidelines available in Ref. 26, using in-house MatLab
(MathWorks, Natick, MA) scripts. To increase the reliability of
peak detection, the histograms of NAWM were smoothed using an
8th order median filter. Next, from each normalized and smoothed
histogram, we derived: peak height (PH), peak location (PL), 25th
centile (C25), 50th centile (C50), 75th centile (C75), and mean
value (MV). These six parameters are able to appropriately charac-
terize histograms with unimodal shape.26
Repeated Analysis on the ADNI CohortIn order to test if the results obtained in the local cohort were
independent from both scanner and clinical evaluation for patients’
dementia staging, we replicated all the analyses using a completely
different dataset, obtained from the Alzheimer’s Disease Neuroim-
aging Initiative (ADNI, http://adni.loni.usc.edu). ADNI is a global
research effort that actively supports the investigation and develop-
ment of treatments that slow or stop the progression of AD; in
this view, ADNI makes publicly available neuropsychological
(including MMSE) and imaging data for HS, early MCI (EMCI),
late MCI (LMCI), and AD patients, often including different
timepoints per subject (longitudinal data).
From the ADNI database, we downloaded data relative to
subjects whose MRI protocol included at least T1 3D, DTI, and
FLAIR sequences (not available, dual-echo TSE); if there were
more than one MRI dataset per subject (longitudinal acquisitions),
we selected the oldest timepoint for which the MMSE score was
available. In every patient the total WM lesion volume, as assessed
from FLAIR images, did not exceed 25 ml.18 Using these con-
straints, we were able to collect data including 41 HS, 58 MCI
(27 EMCI, 31 LMCI), and 41 AD. We refer to this dataset of
140 subjects as the ADNI cohort, whose main demographic charac-
teristics are given in Table 1.
MRI Data Acquisition (ADNI Cohort)MRI data for the ADNI cohort were collected at several sites, all
equipped with a whole-brain 3T MRI scanner (GE Medical Sys-
tems, Milwaukee, WI). The protocol included: 1) fast-fluid-
attenuated inversion recovery (FLAIR; TR 5 11,000 msec, TE 5
150 msec, TI 5 2250 msec, matrix 5 256 3 256, FOV 5 220
3 220 mm2, slice thickness 5 5 mm); 2) inversion-recovery
spoiled gradient recalled T1-weighted (IR-SPGR; TR 5 1422
msec, TE 5 3 msec, TI 5 400 msec, matrix 5 256 3 256 3
196; in-plane FOV 5 260 3 260 mm2, slice thickness 5 1.2
mm); 3) DW twice-refocused spin-echo echo planar imaging (TR
5 13 sec, TE 5 70 msec, b factor 5 1000 s/mm2, voxel size 5
1.37 3 1.37 3 2.7 mm3). This last sequence collects five images
with no diffusion weighting and 41 diffusion-weighted images.
Image Processing and Histogram Analysis (ADNICohort)Brain tissue segmentation, DTI analysis, and histogram computa-
tion were performed following the same pipelines described for the
local cohort.
Statistical AnalysisStatistical analysis was performed using the Statistics Toolbox avail-
able in MatLab. In all the analyses of variance (ANOVAs) and
post-hoc Student’s t-tests, we set the statistical significance thresh-
old to P 5 0.05 and then applied the Bonferroni correction for
multiple comparisons. The same analyses were performed for both
local and ADNI cohorts.
Journal of Magnetic Resonance Imaging
4 Volume 00, No. 00

All demographic characteristics but female/male ratio, clinical
characteristics, and brain tissue volumetrics were compared between
all groups (HS, AD, MCI) using a one-way ANOVA; on the mea-
sures surviving the ANOVA analysis, post-hoc Student’s t-tests
were performed. The female/male ratios were compared between
groups using a chi-square test, considering as significant P < 0.05.
For the local cohort, the neuropsychological scores (not available in
the ADNI cohort) were compared between all groups using a one-
way ANOVA; on the scores surviving the ANOVA analysis, post-
hoc Student’s t-tests were performed.
MULTICLASS ROC ANALYSIS OF HISTOGRAM-DERIVED FEA-
TURES. The six histogram-derived indices (PH, PL, C25, C50,
C75, MV) relative to FA, MD, AXD, and RD in NAWM were
compared between groups using a one-way ANOVA. On the indi-
ces surviving the ANOVA analysis, post-hoc Student’s t-tests were
performed. In the ANOVA and t-test analyses, we considered as
significant P < 0.05, applying the Bonferroni correction for multi-
ple comparisons (we set the statistical threshold to 0.05/24 in the
ANOVA analysis, and to 0.05/3 in the post-hoc t-tests).
To assess the capability of group discrimination of each
histogram-derived index, we employed a multiclass receiver operat-
ing characteristic (ROC) curve analysis. ROC analysis is typically
used for two-groups diagnostic problems.27 In our case (three
groups) we used the multiclass problem approach. One method for
handling n > 2 classes is to produce n different ROC curves, one
for each class. In particular, the ROC curve for class j (with j span-
ning from 1 to n) refers to the classification performance in which
j is the positive class and all other n-1 classes are combined to
form the negative class.27 While this approach can be straightfor-
wardly applied to n mutually independent classes, the three classes
involved in this study (HS, MCI, AD) do not fulfill this criterion,
MCI being a prodromal stage of AD. Consequently, the compari-
son of MCI vs. HS plus AD is meaningless and was not modeled.
We thus retained only the two class comparisons “MCI plus AD
vs. HS,” and “AD vs. HS plus MCI.” For each comparison we
considered the feature with the highest AUC (area under the ROC
curve) as the “best discriminator.”
POST-HOC CORRELATION ANALYSIS. In the patients group
only, Spearman partial correlation (controlled for age, gender, and
education) was used to test for associations between general cogni-
tive efficiency (measured by the MMSE score) and the “best dis-
criminator” histogram features as revealed by ROC analyses. P <
0.05 was considered statistically significant.
Results
Demographic and Neuropsychological DataDemographic and clinical characteristics of the studied sub-
jects are summarized in Table 1.
Local Cohort: According to the inclusion criteria, there
were no significant differences in age (F2,105 5 2.26, P 5
0.11) or gender distribution (chi-square 5 2.60, P 5 0.27)
between the groups. Conversely, there were differences in
years of formal education (F2,105 5 4.61, P 5 0.012),
resulting AD patients being less educated than HS. As
expected, the three groups showed significantly different
MMSE scores (F2,105 5 67.77, P < 0.0001). From a neu-
ropsychological viewpoint, MCI patients performed worse
than HS at tests exploring long-term verbal episodic mem-
ory and verbal and visuospatial short-term memory. More-
over, MCI patients reported significantly lower scores than
HS in the Modified Card Sorting Test. Patients with AD
reported a widespread cognitive impairment involving all
domains (Table 2).
ADNI Cohort: There were no significant group differ-
ences with respect to age (F2,137 5 1.72, P 5 0.18) and
gender distribution (chi-square 5 5.19, P 5 0.07), while
MMSE scores (available for 115 out of 140 subjects) were
significantly different (F2,112 5 38.43, P < 0.0001) across
groups (Table 1).
Brain Tissue VolumetricsBrain volumetrics of all subjects are summarized in Table 1.
Local Cohort: AD patients showed a significantly
lower GM fraction than MCI patients and HS (F2,105 5
14.04, P < 0.0001). When comparing MCI patients to HS,
no significant difference was found. No differences in
NAWM fraction were detected between any of the groups
(F2,105 5 1.12, P 5 0.33). Although the average lesion frac-
tion was higher in both patients group compared to HS,
these differences were not statistically significant (F2,105 5
1.79, P 5 0.17).
ADNI Cohort: GM fractions were different in each
group (F2,137 5 37.20, P < 0.0001). AD patients also
showed a significantly lower NAWM fraction than MCI
patients and HS (F2,137 5 8.07, P < 0.0001); when com-
paring MCI patients to HS, no significant difference was
found. The average lesion fractions were not significant dif-
ferent between groups (F2,137 5 2.38, P 5 0.10).
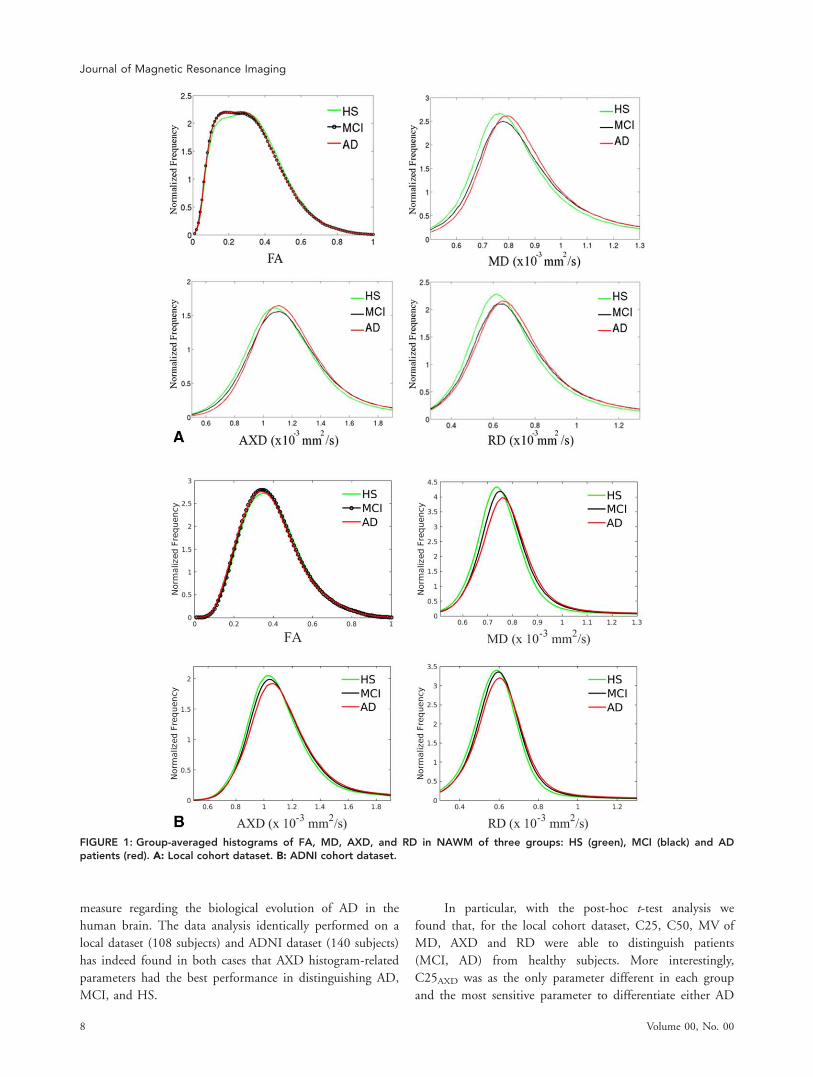
Histograms ComputationLocal Cohort: With the exception of FA, all NAWM histo-
grams had a clear unimodal shape for all participants (Fig.
1A). The FA histograms, in several subjects, presented
instead a maximum with a plateau or two maxima with
similar height and close to each other. For this reason, for
the FA histograms we computed C25, C50, C75, and MV,
but not PH and PL.
ADNI Cohort: For all subjects, all NAWM histograms
had a clear unimodal shape (Fig. 1B).
Multiclass ROC Analysis of Histogram-DerivedFeaturesLocal Cohort: No between-group difference was found in
PH, PL, and C75 of MD, AXD, and RD. Both patient
groups, compared to HS, showed higher C25, C50, and
MV relative to MD, AXD, and RD. AD compared to MCI
patients showed a significant increase in C25 of AXD histo-
gram (C25AXD). No between-group difference was found in
any of the FA histogram-derived metrics (Table 3). The
Giulietti et al.: DTI Histograms for Staging AD
Month 2018 5
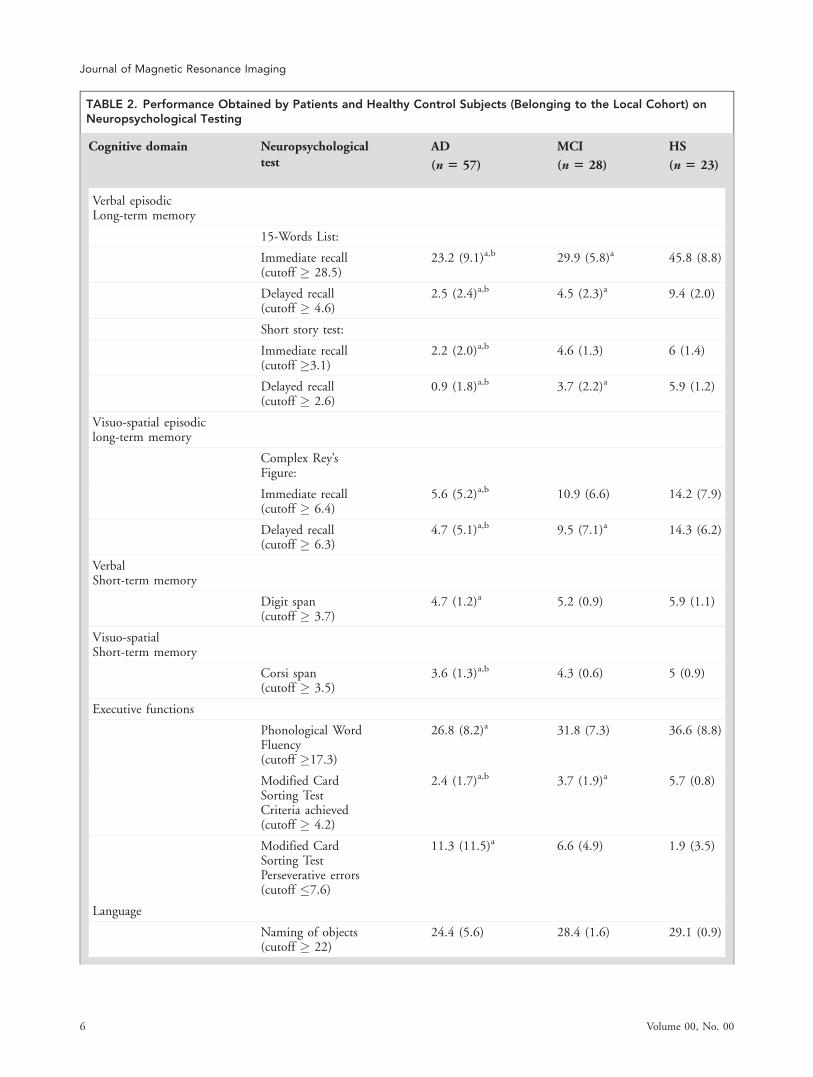
TABLE 2. Performance Obtained by Patients and Healthy Control Subjects (Belonging to the Local Cohort) onNeuropsychological Testing
Cognitive domain Neuropsychologicaltest
AD
(n 5 57)
MCI
(n 5 28)
HS
(n 5 23)
Verbal episodicLong-term memory
15-Words List:
Immediate recall(cutoff � 28.5)
23.2 (9.1)a,b 29.9 (5.8)a 45.8 (8.8)
Delayed recall(cutoff � 4.6)
2.5 (2.4)a,b 4.5 (2.3)a 9.4 (2.0)
Short story test:
Immediate recall(cutoff �3.1)
2.2 (2.0)a,b 4.6 (1.3) 6 (1.4)
Delayed recall(cutoff � 2.6)
0.9 (1.8)a,b 3.7 (2.2)a 5.9 (1.2)
Visuo-spatial episodiclong-term memory
Complex Rey’sFigure:
Immediate recall(cutoff � 6.4)
5.6 (5.2)a,b 10.9 (6.6) 14.2 (7.9)
Delayed recall(cutoff � 6.3)
4.7 (5.1)a,b 9.5 (7.1)a 14.3 (6.2)
VerbalShort-term memory
Digit span(cutoff � 3.7)
4.7 (1.2)a 5.2 (0.9) 5.9 (1.1)
Visuo-spatialShort-term memory
Corsi span(cutoff � 3.5)
3.6 (1.3)a,b 4.3 (0.6) 5 (0.9)
Executive functions
Phonological WordFluency(cutoff �17.3)
26.8 (8.2)a 31.8 (7.3) 36.6 (8.8)
Modified CardSorting TestCriteria achieved(cutoff � 4.2)
2.4 (1.7)a,b 3.7 (1.9)a 5.7 (0.8)
Modified CardSorting TestPerseverative errors(cutoff �7.6)
11.3 (11.5)a 6.6 (4.9) 1.9 (3.5)
Language
Naming of objects(cutoff � 22)
24.4 (5.6) 28.4 (1.6) 29.1 (0.9)
Journal of Magnetic Resonance Imaging
6 Volume 00, No. 00
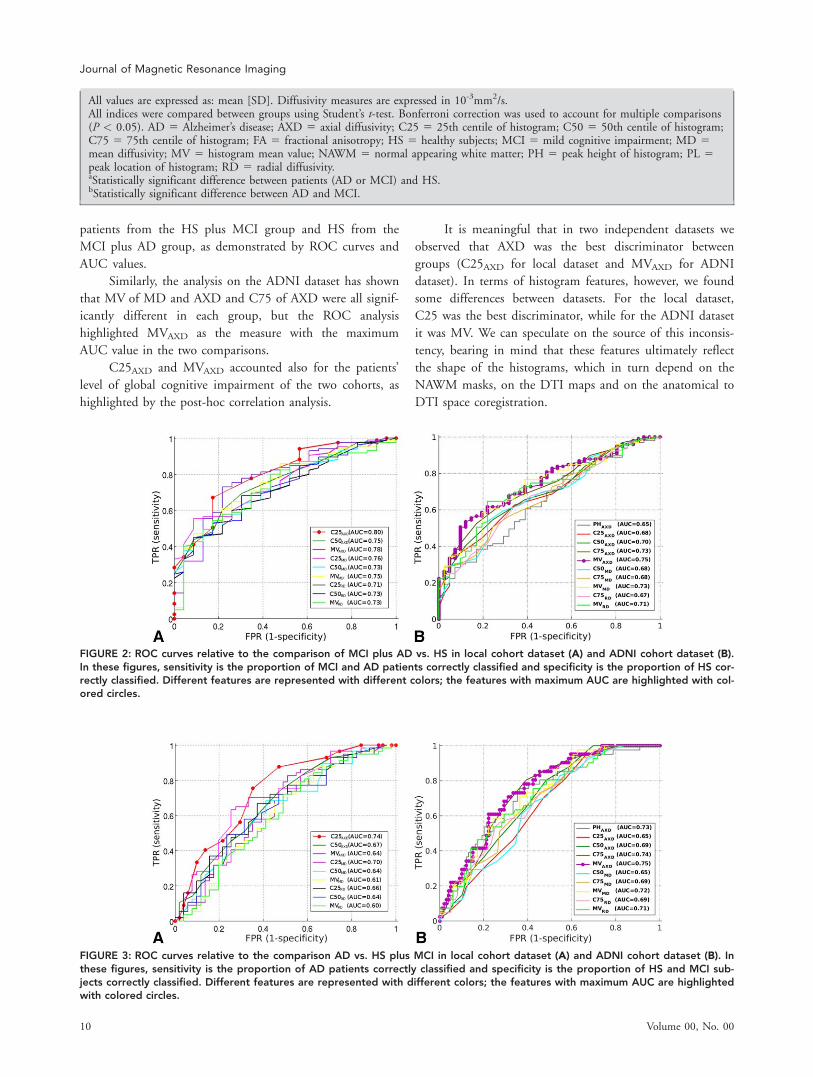
ROC analyses were thus performed on the following indi-
ces: C25, C50, and MV of AXD, RD, and MD.
C25AXD was the best between-group discriminator,
having a maximum AUC of 0.80 (95% confidence intervals
[CI]: 0.65–0.95) for MCI plus AD vs. HS (Fig. 2A) and of
0.74 (95% CI: 0.60–0.88) for AD vs. HS plus MCI com-
parison (Fig. 3A).
ADNI Cohort: As in the local cohort, no between-
group difference was found in any of the FA histogram-
derived metrics. Both AD and MCI, compared to HS,
showed higher C25, C50, C75, MV of AXD, C50, MV of
MD, and MV of RD. AD compared to HS also showed
lower PH of AXD and higher C75 of MD and RD. AD
compared to MCI had lower PH of AXD and higher C75
and MV of AXD and MV of MD (Table 3). The ROC
analyses were thus performed on the following indices: PH,
C25, C50, C75, and MV of AXD, C50, C75, and MV of
MD, and C75 and MV of RD.
MVAXD was the best between-group discriminator,
having a maximum AUC of 0.75 (95% CI: 0.62–0.87) for
MCI plus AD vs. HS (Fig. 2B) and of 0.75 (95% CI:
0.63–0.87) for AD vs. HS plus MCI (Fig. 3B) comparison.
Post-Hoc Correlation AnalysisLocal Cohort: In the patients group (MCI plus AD) we
found a significant Spearman partial correlation (adjusted
for age, gender, and education) equal to r 5 –0.34 (P 5
0.0016) between MMSE raw score and C25AXD.
ADNI Cohort: In the patients group (MCI plus AD)
a significant Spearman partial correlation (adjusted for age
and gender; education scores were not available) equal to r5 –0.30 (P 5 0.0079) between MMSE raw score and
MVAXD was found.
Discussion
In this study we assessed the ability of NAWM diffusivity
changes to classify patients at different stages of the clinical
course of AD and evaluated the suitability of histogram-
derived metrics for patient staging and monitoring disease
progression. Several previous studies attempted to define the
features of diffusivity changes in the advanced stages of
AD28 and to identify correlations with clinical evaluations
or measures of cognitive decline such as the MMSE score.7
However, it remains to be clarified whether a simple quanti-
fication of DTI parameters can support patient staging.
In the current study we used histogram analysis, which
is able to detect subtle global changes in the brain tissue
and is particularly indicated when dealing with a diffuse dis-
ease such as AD.29 Histograms summarize the information
derived from large portions of tissue (in our case, the whole
NAWM) into a curve, which can be characterized by simple
metrics. In this work we compared the diagnostic reliability
of a number of histogram metrics, computed for FA, MD,
AXD, and RD.
Our study strongly suggests that the information deliv-
ered by AXD of NAWM is the most informative DTI
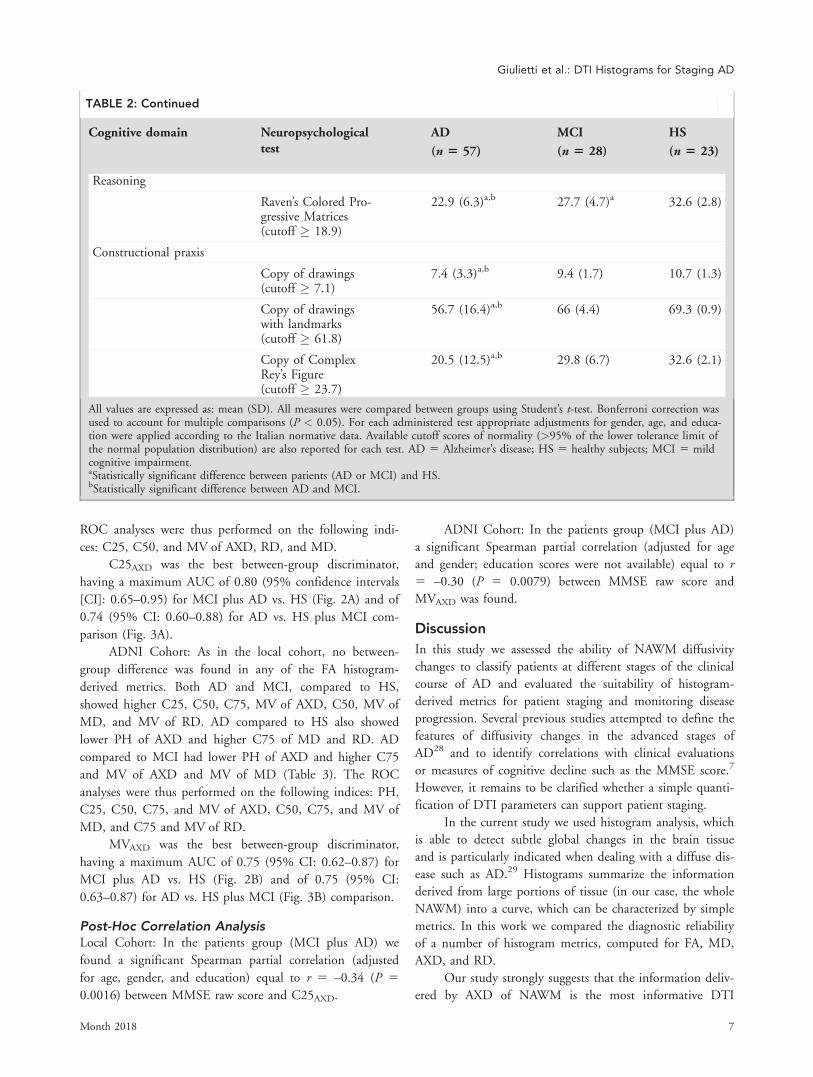
TABLE 2: Continued
Cognitive domain Neuropsychologicaltest
AD
(n 5 57)
MCI
(n 5 28)
HS
(n 5 23)
Reasoning
Raven’s Colored Pro-gressive Matrices(cutoff � 18.9)
22.9 (6.3)a,b 27.7 (4.7)a 32.6 (2.8)
Constructional praxis
Copy of drawings(cutoff � 7.1)
7.4 (3.3)a,b 9.4 (1.7) 10.7 (1.3)
Copy of drawingswith landmarks(cutoff � 61.8)
56.7 (16.4)a,b 66 (4.4) 69.3 (0.9)
Copy of ComplexRey’s Figure(cutoff � 23.7)
20.5 (12.5)a,b 29.8 (6.7) 32.6 (2.1)
All values are expressed as: mean (SD). All measures were compared between groups using Student’s t-test. Bonferroni correction wasused to account for multiple comparisons (P < 0.05). For each administered test appropriate adjustments for gender, age, and educa-tion were applied according to the Italian normative data. Available cutoff scores of normality (>95% of the lower tolerance limit ofthe normal population distribution) are also reported for each test. AD 5 Alzheimer’s disease; HS 5 healthy subjects; MCI 5 mildcognitive impairment.aStatistically significant difference between patients (AD or MCI) and HS.bStatistically significant difference between AD and MCI.
Giulietti et al.: DTI Histograms for Staging AD
Month 2018 7
measure regarding the biological evolution of AD in the
human brain. The data analysis identically performed on a
local dataset (108 subjects) and ADNI dataset (140 subjects)
has indeed found in both cases that AXD histogram-related
parameters had the best performance in distinguishing AD,
MCI, and HS.
In particular, with the post-hoc t-test analysis we
found that, for the local cohort dataset, C25, C50, MV of
MD, AXD and RD were able to distinguish patients
(MCI, AD) from healthy subjects. More interestingly,
C25AXD was as the only parameter different in each group
and the most sensitive parameter to differentiate either AD
FIGURE 1: Group-averaged histograms of FA, MD, AXD, and RD in NAWM of three groups: HS (green), MCI (black) and ADpatients (red). A: Local cohort dataset. B: ADNI cohort dataset.
Journal of Magnetic Resonance Imaging
8 Volume 00, No. 00
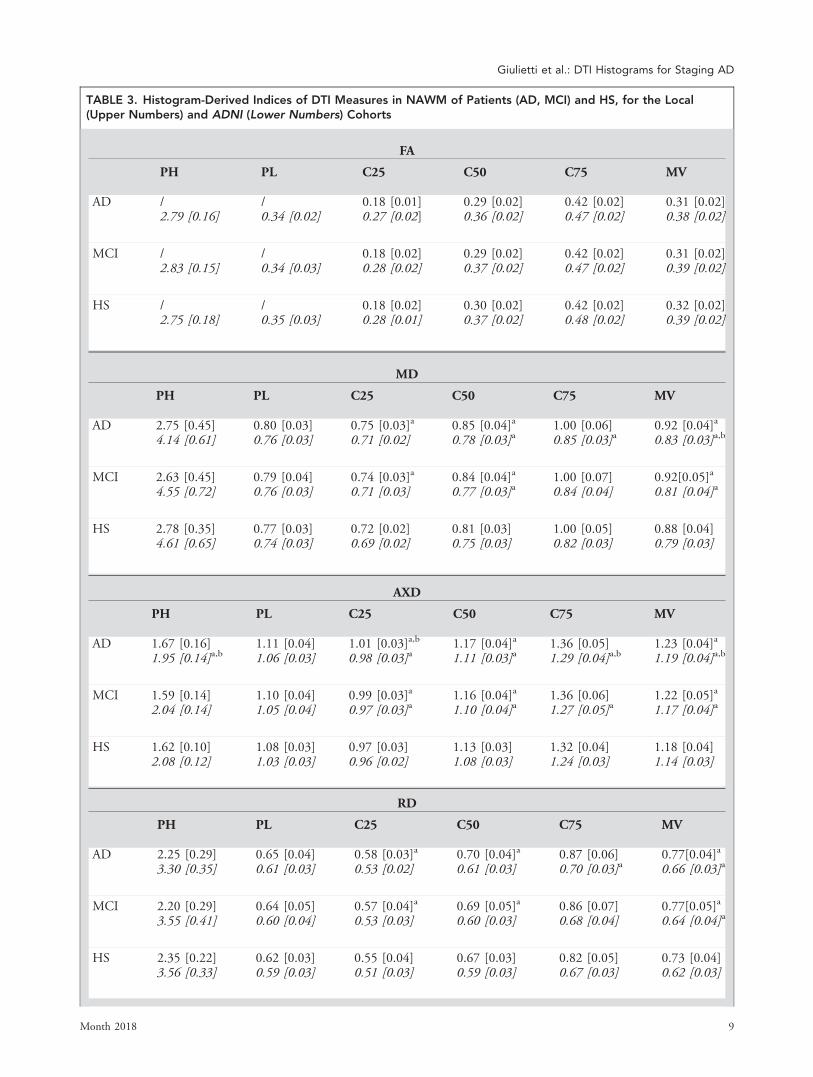
TABLE 3. Histogram-Derived Indices of DTI Measures in NAWM of Patients (AD, MCI) and HS, for the Local(Upper Numbers) and ADNI (Lower Numbers) Cohorts
FA
PH PL C25 C50 C75 MV
AD /2.79 [0.16]
/0.34 [0.02]
0.18 [0.01]0.27 [0.02]
0.29 [0.02]0.36 [0.02]
0.42 [0.02]0.47 [0.02]
0.31 [0.02]0.38 [0.02]
MCI /2.83 [0.15]
/0.34 [0.03]
0.18 [0.02]0.28 [0.02]
0.29 [0.02]0.37 [0.02]
0.42 [0.02]0.47 [0.02]
0.31 [0.02]0.39 [0.02]
HS /2.75 [0.18]
/0.35 [0.03]
0.18 [0.02]0.28 [0.01]
0.30 [0.02]0.37 [0.02]
0.42 [0.02]0.48 [0.02]
0.32 [0.02]0.39 [0.02]
MD
PH PL C25 C50 C75 MV
AD 2.75 [0.45]4.14 [0.61]
0.80 [0.03]0.76 [0.03]
0.75 [0.03]a
0.71 [0.02]0.85 [0.04]a
0.78 [0.03]a1.00 [0.06]0.85 [0.03]a
0.92 [0.04]a
0.83 [0.03]a,b
MCI 2.63 [0.45]4.55 [0.72]
0.79 [0.04]0.76 [0.03]
0.74 [0.03]a
0.71 [0.03]0.84 [0.04]a
0.77 [0.03]a1.00 [0.07]0.84 [0.04]
0.92[0.05]a
0.81 [0.04]a
HS 2.78 [0.35]4.61 [0.65]
0.77 [0.03]0.74 [0.03]
0.72 [0.02]0.69 [0.02]
0.81 [0.03]0.75 [0.03]
1.00 [0.05]0.82 [0.03]
0.88 [0.04]0.79 [0.03]
AXD
PH PL C25 C50 C75 MV
AD 1.67 [0.16]1.95 [0.14]a,b
1.11 [0.04]1.06 [0.03]
1.01 [0.03]a,b
0.98 [0.03]a1.17 [0.04]a
1.11 [0.03]a1.36 [0.05]1.29 [0.04]a,b
1.23 [0.04]a
1.19 [0.04]a,b
MCI 1.59 [0.14]2.04 [0.14]
1.10 [0.04]1.05 [0.04]
0.99 [0.03]a
0.97 [0.03]a1.16 [0.04]a
1.10 [0.04]a1.36 [0.06]1.27 [0.05]a
1.22 [0.05]a
1.17 [0.04]a
HS 1.62 [0.10]2.08 [0.12]
1.08 [0.03]1.03 [0.03]
0.97 [0.03]0.96 [0.02]
1.13 [0.03]1.08 [0.03]
1.32 [0.04]1.24 [0.03]
1.18 [0.04]1.14 [0.03]
RD
PH PL C25 C50 C75 MV
AD 2.25 [0.29]3.30 [0.35]
0.65 [0.04]0.61 [0.03]
0.58 [0.03]a
0.53 [0.02]0.70 [0.04]a
0.61 [0.03]0.87 [0.06]0.70 [0.03]a
0.77[0.04]a
0.66 [0.03]a
MCI 2.20 [0.29]3.55 [0.41]
0.64 [0.05]0.60 [0.04]
0.57 [0.04]a
0.53 [0.03]0.69 [0.05]a
0.60 [0.03]0.86 [0.07]0.68 [0.04]
0.77[0.05]a
0.64 [0.04]a
HS 2.35 [0.22]3.56 [0.33]
0.62 [0.03]0.59 [0.03]
0.55 [0.04]0.51 [0.03]
0.67 [0.03]0.59 [0.03]
0.82 [0.05]0.67 [0.03]
0.73 [0.04]0.62 [0.03]
Giulietti et al.: DTI Histograms for Staging AD
Month 2018 9
patients from the HS plus MCI group and HS from the
MCI plus AD group, as demonstrated by ROC curves and
AUC values.
Similarly, the analysis on the ADNI dataset has shown
that MV of MD and AXD and C75 of AXD were all signif-
icantly different in each group, but the ROC analysis
highlighted MVAXD as the measure with the maximum
AUC value in the two comparisons.
C25AXD and MVAXD accounted also for the patients’
level of global cognitive impairment of the two cohorts, as
highlighted by the post-hoc correlation analysis.
It is meaningful that in two independent datasets we
observed that AXD was the best discriminator between
groups (C25AXD for local dataset and MVAXD for ADNI
dataset). In terms of histogram features, however, we found
some differences between datasets. For the local dataset,
C25 was the best discriminator, while for the ADNI dataset
it was MV. We can speculate on the source of this inconsis-
tency, bearing in mind that these features ultimately reflect
the shape of the histograms, which in turn depend on the
NAWM masks, on the DTI maps and on the anatomical to
DTI space coregistration.
FIGURE 3: ROC curves relative to the comparison AD vs. HS plus MCI in local cohort dataset (A) and ADNI cohort dataset (B). Inthese figures, sensitivity is the proportion of AD patients correctly classified and specificity is the proportion of HS and MCI sub-jects correctly classified. Different features are represented with different colors; the features with maximum AUC are highlightedwith colored circles.
FIGURE 2: ROC curves relative to the comparison of MCI plus AD vs. HS in local cohort dataset (A) and ADNI cohort dataset (B).In these figures, sensitivity is the proportion of MCI and AD patients correctly classified and specificity is the proportion of HS cor-rectly classified. Different features are represented with different colors; the features with maximum AUC are highlighted with col-ored circles.
All values are expressed as: mean [SD]. Diffusivity measures are expressed in 10-3mm2/s.All indices were compared between groups using Student’s t-test. Bonferroni correction was used to account for multiple comparisons(P < 0.05). AD 5 Alzheimer’s disease; AXD 5 axial diffusivity; C25 5 25th centile of histogram; C50 5 50th centile of histogram;C75 5 75th centile of histogram; FA 5 fractional anisotropy; HS 5 healthy subjects; MCI 5 mild cognitive impairment; MD 5mean diffusivity; MV 5 histogram mean value; NAWM 5 normal appearing white matter; PH 5 peak height of histogram; PL 5peak location of histogram; RD 5 radial diffusivity.aStatistically significant difference between patients (AD or MCI) and HS.bStatistically significant difference between AD and MCI.
Journal of Magnetic Resonance Imaging
10 Volume 00, No. 00

NAWM masks and anatomical to DTI space warping
were carefully checked to assure accuracy. DTI data were
acquired with similar but not identical protocols, differing
in number of diffusion gradients and spatial resolution. The
number of gradients (61 vs. 41) should not substantially
influence the DTI diffusivity measures,30,31 but the in-plane
resolution (about 3 times lower in the local dataset) affects
the amount of partial volume effects. Comparing the histo-
gram shapes and the range of diffusivity values relative to
local and ADNI cohorts with the DTI values referred by
the literature32 confirms this hypothesis, as the histograms
of the local cohort dataset (suffering a greater partial volume
effect) tend to include more bins with low FA and high dif-
fusivity values. This observation accounts for both the FA
histogram not being unimodal and diffusivity histograms
having right tails with lower slope when compared to the
ADNI ones.
Nevertheless, the results of the two histogram analyses
converged in selecting axial diffusivity as the best discrimi-
nator, and yielded similar AUC values for C25AXD (for the
local cohort dataset) and MVAXD (for the ADNI cohort
dataset), therefore indicating a similar group discrimination
capability.
WM damage in AD has been interpreted on the basis
of two coexisting main pathophysiological mechanisms33:
neurodegeneration and myelin damage. The former mecha-
nism induces axonal damage caused by Wallerian degenera-
tion,34 secondary to the effect of cortical neuronal loss.
Concurrently, homeostatic repair mechanisms are activated
by demyelinating processes, with amyloid and tau accumu-
lating as by-products of these mechanisms. Evidence34 sug-
gests that in the early stage of the disease these pathological
processes coexist and are relatively independent, while at
later stages Wallerian degeneration seems to prevail.
Reduced AXD and increased RD have been proposed as
specific markers of axonal degeneration and demyelination,
respectively, based on animal models.34,35 However, this
interpretation in human brain data has been challenged.36
In particular, little evidence of reduced AXD has been
reported, with the majority of studies reporting increased
AXD in multiple conditions, including AD.37 A previous
study comparing these indices in patients with AD at differ-
ing stages38 showed increased axial diffusivity as the earliest
sign of white matter change. They speculated that these
changes could reflect early inflammatory events such as
microglial activation, which has been implicated in AD
pathophysiology.39 In accordance with these findings, we
found in both the local and ADNI datasets an increase of
MD, AXD, and RD in the NAWM of patients (MCI,
AD—probably driven by the latter) when compared with
healthy subjects, while only changes in AXD were able to
also distinguish MCI from AD.
The interpretation of increased AXD as a marker of
inflammation is very speculative, and alternative explana-
tions are possible, including some form of axonal degenera-
tion. This would fit with the hypothesis of Wallerian
degeneration secondary to distal cortical atrophy, as the neu-
ropathological process underlying WM damage in AD, par-
ticularly along the main cholinergic pathways. Currently,
our data do not allow us to draw a firm conclusion on the
substrate of the measured change.
Regardless of the pathological substrate, our data indi-
cate that AXD histogram-derived parameters are the most
promising indexes among the ones here investigated for
patient stratification. With regard to the potential clinical
impact of our study, the results of ROC analyses and post-
hoc correlation analysis are promising. Although these
results need to be confirmed by further studies on larger
patient populations and different MRI scanners and DTI
protocols, the ROC analyses results indicate that AXD fea-
tures in the NAWM have the capability of discriminating
between groups, while the post-hoc correlation results high-
light that AXD features account for the patients’ level of
global cognitive impairment, thus expressing the clinical
impact of brain involvement. These findings suggest that
histogram features of AXD might be reliable biomarkers to
be used in clinical trials (ie, patients’ staging and follow-up)
and, possibly, as a diagnostic tool in clinical settings. In
future work, it will be interesting to test if the classification
performance, and consequently the clinical usefulness, could
be improved by using a linear/nonlinear combination of
AXD features and/or exploiting more sophisticated classifi-
cation algorithms, such as those used in machine learning
(eg, Support Vector Machine, Random Forest).
One might argue that neuropsychological assessments
provide a comparable performance at a lower cost. However,
MRI is typically performed at the time of diagnosis, and
current DTI protocols (available on all clinical scanners)
would add only a few minutes to the basic clinical protocol.
The advantage of imaging biomarkers is that they are more
objective and might be more sensitive than MMSE at the
very early stages. Clearly, more validation is needed before
these tools can be translated into the clinic.
There were some limitations in our study. First, this
study lacked longitudinal data. Moreover, data for DTI
analysis are relatively easy to acquire; nevertheless, recent
development in microstructural imaging suggest that more
sophisticated approaches40 can provide more specific infor-
mation about WM. Future studies are warranted to investi-
gate whether more accurate biomarkers for AD progression
can be obtained by applying histogram analysis to indices
derived from these advanced models of diffusion. An impor-
tant observation is that the spatial resolution of DTI might
affect the results of histogram analysis. While further investi-
gations are required, the current recommendation would be
Giulietti et al.: DTI Histograms for Staging AD
Month 2018 11

to match the ADNI protocol. Another potential source of
bias is the different resolution of T1-weighted and T2-
weighted data, which were coregistered for the purpose of
obtaining the NAWM mask. While ideally one would
acquire data with similar geometry, in this case the sequen-
ces were optimized for brain segmentation and lesion seg-
mentation, respectively. Regarding lesion segmentation, it is
also legitimate to wonder whether, as patients tend to have
higher lesion load, this could introduce a bias. However, we
excluded participants with lesion volume larger than 25 ml
and all histograms were normalized by the total voxel count.
This implies that, for every participant, the number of total
lesion voxels was at least 20–30 times less than the number
of NAWM voxels. Including/excluding in the NAWM histo-
grams such a small amount of voxels would not affect the
shape of the histograms, which would be substantially
unchanged.
Finally, it should be noted that the local cohort groups
were well matched for age and gender, but the level of edu-
cation was higher in healthy controls compared to the
patients’ groups (education is not available for the ADNI
cohort). While this may introduce a potential bias, it is a
fairly common occurrence in this kind of study.
In conclusion, our findings suggest that histogram-
derived measures of AXD in NAWM might be a sensitive
marker of microstructural brain tissue changes occurring
during the course of AD and might be useful to predict the
rate of disease progression, and hopefully to be used as an
index of response to medication in pharmacological trials.
Acknowledgment
Contract grant sponsor: Italian Ministry of Health; contract
grant number: RF09.150; RF10.047 (to M.B.).
References1. Petersen RC, Aisen P, Boeve BF, et al. Criteria for mild cognitive
impairment due to Alzheimer’s disease in the community. Ann Neurol2013;74:199–208.
2. Dubois B, Feldman HH, Jacova C, et al. Revising the definition of Alz-heimer’s disease: a new lexicon. Lancet Neurol 2010;9:1118–1127.
3. Vemuri P, Whitwell JL, Kantarci K, et al. Antemortem MRI basedSTructural Abnormality iNDex (STAND)-scores correlate with postmor-tem Braak neurofibrillary tangle stage. Neuroimage 2008;42:559–567.
4. Patwardhan MB, McCrory DC, Matchar DB, Samsa GP, RutschmannetOT. Alzheimer disease: operating characteristics of PET. A meta-anal-ysis. Radiology 2004;231:73–80.
5. Ikonomovic MD, Klunk WE, Abrahamson EE, et al. Post-mortem corre-lates of in vivo PiB-PET amyloid imaging in a typical case of Alz-heimer’s disease. Brain 2008;131:1630–1645.
6. Fortea J, Vilaplana E, Alcolea D, et al. Cerebrospinal fluid b-amyloidand phosphor-tau biomarker interactions affecting brain structure inpreclinical Alzheimer disease. Ann Neurol 2014;76:223–230.
7. Frisoni GB, Fox NC, Jack CR, et al. The clinical use of structural MRIin Alzheimer disease. Nat Rev Neurol 2010;6:67–77.
8. Caso F, Agosta F, Filippi M. Insights into white matter damage in Alz-heimer’s disease: from postmortem to in vivo diffusion tensor MRIstudies. Neurodegen Dis 2016;16:26–33.
9. Tournier JD, Mori S, Leemans A. Diffusion tensor imaging andbeyond. Magn Reson Med 2011;65:1532–1556.
10. Bosch B, Arenaza-Urquijo EM, Rami L, et al. Multiple DTI index analy-sis in normal aging, amnestic MCI and AD. Relationship with neuro-psychological performance. Neurobiol Aging 2012;33:61–74.
11. Holtmannsp€otter M, Peters N, Opherk C, et al. Diffusion magneticresonance histograms as a surrogate marker and predictor of diseaseprogression in CADASIL: a two-year follow-up study. Stroke 2005;36:2559–2565.
12. Steffen–Smith EA, Sarlls JE, Pierpaoli C, et al. Diffusion tensor histo-gram analysis of pediatric diffuse intrinsic pontine glioma. BiomedRes Int 2014:647356.
13. Lema A, Bishop C, Malik O, et al. A comparison of magnetizationtransfer methods to assess brain and cervical cord microstructure inmultiple sclerosis. J Neuroimaging 2017;27:221–226.
14. McKhann GM, Knopman DS, Chertkow H, et al. The diagnosis ofdementia due to Alzheimer’s disease: recommendations from theNational Institute on Aging-Alzheimer’s Association workgroups ondiagnostic guidelines for Alzheimer’s disease. Alzheimers Dement2011;7:263–269.
15. American Psychiatric Association. Diagnostic and statistical manual ofmental disorders, 5th ed. Arlington, VA: American Psychiatric Associa-tion Publishing; 2013.
16. Hughes CP, Berg L, Danziger WL, Coben LA, Martin RL. A newclinical scale for the staging of dementia. Br J Psychiatry 1982;140:566–572.
17. Hachinski VC, Iliff LD, Zilhka E, et al. Cerebral blood flow in dementia.Arch Neurol 1975;32:632–637.
18. Iadecola C. The pathobiology of vascular dementia. Neuron 2013;80:844–866.
19. B€usch D, Hagemann N, Bender N. The dimensionality of the Edin-burgh Handedness Inventory: An analysis with models of the itemresponse theory. Laterality 2010;15:610–628.
20. Barletta-Rodolfi C, Gasparin F, Ghidoni E. Kit del neuropsicologo ital-iano. Milan, Italy: Dynamicom Edizioni, 2011.
21. Orsini A, Grossi D, Capitani E, Laiacona M, Papagno C, Vallar G. Ver-bal and spatial immediate memory span: Normative data from 1355adults and 1112 children. Ital J Neurol Sci 1987;8:539–548.
22. Miceli G, Laudanna A, Burani C, et al. Batteria per l’analisi dei deficitafasici. Associazione per lo sviluppo delle ricerche neuropsicologiche.Milan, Italy: Berdata; 1991.
23. Folstein MF, Folstein SE, McHugh PR. Mini-mental state. A practicalmethod for grading the cognitive state of patients for the clinician.J Psychiatr Res 1975;12:189–198.
24. Avants BB, Tustison NJ, Song G, et al. A reproducible evaluation ofANTs similarity metric performance in brain image registration. Neu-roimage 2011;54:2033–2044.
25. Leemans A, Jones DK. The B-matrix must be rotated when correctingfor subject motion in DTI data. Magn Reson Med 2009;61:1336–1349.
26. Tofts PS, Davies GR, Dehmeshki J. Histograms: Measuring subtle dif-fuse disease. In: Tofts P, editor. Quantitative MRI of the brain: Mea-suring changes caused by disease. Chichester, UK; John Wiley &Sons; 2003:581–610.
27. Fawcett T. An introduction to ROC analysis. Pattern Recogn Lett2006;27:861–874.
28. Hua X, Hibar DP, Ching CR, et al. Unbiased tensor-based morphome-try: improved robustness and sample size estimates for Alzheimer’sdisease clinical trials. Neuroimage 2013;66:648–661.
29. Cercignani M. Strategies for patient-control comparison of diffusionMR Data. In: Jones DK, editor. Diffusion MRI: Theory, methods, andapplications. Oxford, UK: Oxford University Press; 2010:485–499.
Journal of Magnetic Resonance Imaging
12 Volume 00, No. 00
30. Lebel C, Benner T, Beaulieu C. Six is enough? Comparison of diffu-sion parameters measured using six or more diffusion-encoding gradi-ent directions with deterministic tractography. Magn Reson Med2012;68:474–483.
31. Zhan L, Leow AD, Jahanshad N, et al. How does angularresolution affect diffusion imaging measures? Neuroimage 2010;49:1357–1371.
32. Palacios EM, Martin AJ, Boss MA, et al. Toward precision and repro-ducibility of diffusion tensor imaging: a multicenter diffusion phantomand traveling volunteer study. AJNR 2017;38:537–545.
33. O’Dwyer L, Lamberton F, Bokde ALW, et al. Using diffusion tensorimaging and mixed-effects models to investigate primary and second-ary white matter degeneration in Alzheimer’s disease and mild cogni-tive impairment. J Alzheimers Dis 2011;26:667–682.
34. Amlien IK, Fjell AM. Diffusion tensor imaging of white matter degen-eration in Alzheimer’s disease and mild cognitive impairment. Neuro-science 2014;276:206–215.
35. Song SK, Sun SW, Ramsbottom MJ, et al. Dysmyelination revealedthrough MRI as increased radial (but unchanged axial) diffusion ofwater. Neuroimage 2002;17:1429–1436.
36. Wheeler-Kingshott CA, Cercignani M. About “axial” and “radial” dif-fusivities. Magn Reson Med 2009;61:1255–1260.
37. Acosta-Cabronero J, Nestor PJ. Diffusion tensor imaging in Alz-heimer’s disease: insights into the limbic-diencephalic network andmethodological considerations. Front Aging Neurosci 2014;6:266.
38. Acosta-Cabronero J, Alley S, Williams GB, et al. Diffusion tensormetrics as biomarkers in Alzheimer’s disease. PLoS One 2012;7:e49072.
39. Bagyinszky E, Giau VV, Shim K, et al. Role of inflammatory moleculesin the Alzheimer’s disease progression and diagnosis.. J Neurol Sci2017;376:242–254.
40. Zhang H, Schneider T, Wheeler-Kingshott CA, Alexander DC. NODDI;practical in vivo neurite orientation dispersion and density imaging ofthe human brain. Neuroimage 2012;61:1000–1016.
Giulietti et al.: DTI Histograms for Staging AD
Month 2018 13