Embed Size (px)
Citation preview
0
100
200
300
400
500
600
700
800
900
2010 2011 2012 2013 2014 2015 2016Me
dia
n p
rice
in U
S d
oll
ars
pe
r p
ers
on
pe
r ye
ar
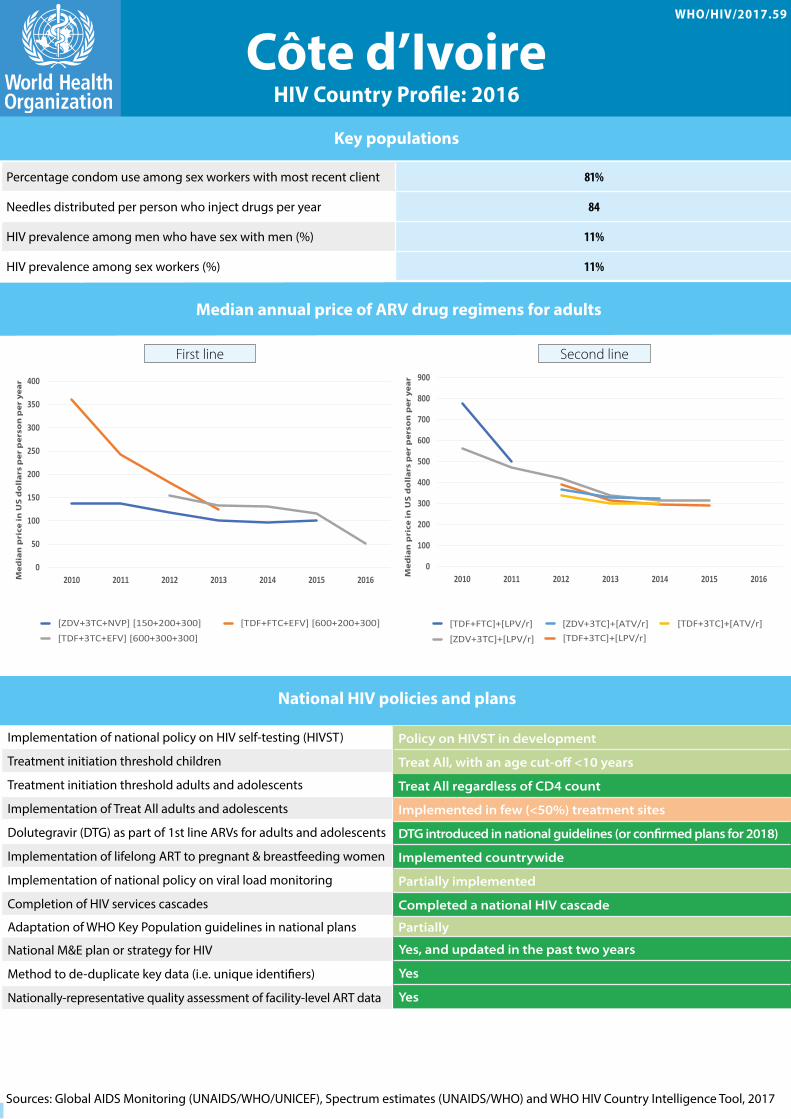
[TDF+FTC]+[LPV/r] [TDF+3TC]+[LPV/r] [ZDV+3TC]+[LPV/r]
[TDF+3TC]+[ATV/r]
0
50
100
150
200
250
300
350
400
2010 2011 2012 2013 2014 2015 2016
Me
dia
n p
rice
in U
S d
oll
ars
pe
r p
ers
on
pe
r ye
ar
[ZDV+3TC+NVP] [150+200+300] [TDF+FTC+EFV] [600+200+300] [TDF+3TC+EFV] [600+300+300]
Me
dia
n p
rice
in U
S d
oll
ars
pe
r p
ers
on
pe
r ye
ar
[ZDV+3TC]+[ATV/r]
HIV Country Profile: 2016
Estimated % of pregnant women living with HIV who received ARVs
for PMTCT
$
$
$
Total population (2016)
Life expectancy at birth (2015-2020)
GNI per capita, PPP (2015)
Estimated ART coveragechildren and adults
Health expenditure per capita (2014)
Health expenditure, total (% of GDP) (2014)
Maternal mortality per 100 000 live births (2015)
Trend since 2010
Human Development Index Value (2015)
0%
20%
40%
60%
80%
100%
PLHIV virally
suppressed
PLHIV receiving
ART
PLHIV diagnosed
0%
20%
40%
60%
80%
100%
PLHIV virally
suppressed
PLHIV receiving
ART
PLHIV diagnosed
0%
20%
40%
60%
80%
100%
PLHIV virally
suppressed
PLHIV receiving
ART
PLHIV diagnosed
Total fertility rate (births per woman) (2015-2020)
Number of births (thou-sands) (2015-2020)
Trend since 2010
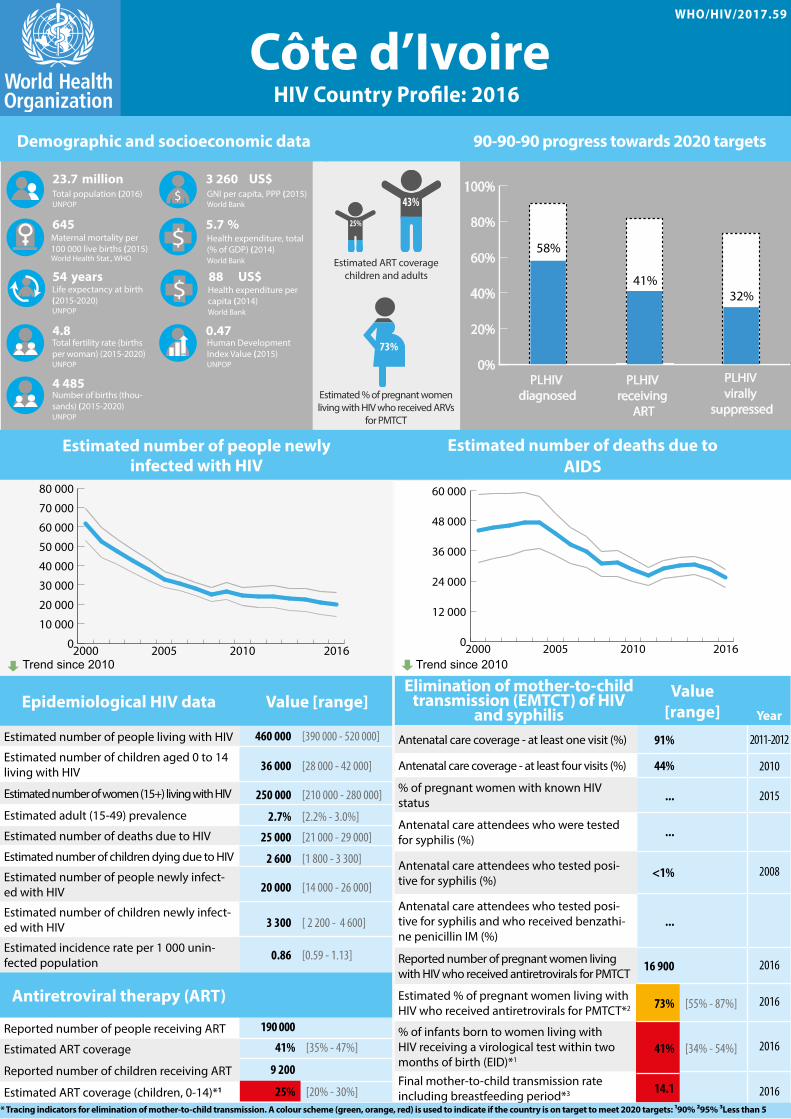
Epidemiological HIV data Value [range]
Estimated number of people living with HIV
Estimated number of children aged 0 to 14 living with HIV
Estimated number of women (15+) living with HIV
Estimated adult (15-49) prevalence
Estimated number of deaths due to HIV
Estimated number of children dying due to HIV
Estimated number of people newly infect-ed with HIV
Estimated number of children newly infect- ed with HIV
Estimated incidence rate per 1 000 unin-fected population
Antiretroviral therapy (ART)
Reported number of people receiving ART
Estimated ART coverage
Reported number of children receiving ART
Estimated ART coverage (children, 0-14)*1
Value [range] Year
Antenatal care coverage - at least one visit (%)
Antenatal care coverage - at least four visits (%)
% of pregnant women with known HIV status
Antenatal care attendees who were tested for syphilis (%)
Antenatal care attendees who tested posi- tive for syphilis (%)
Antenatal care attendees who tested posi- tive for syphilis and who received benzathi-ne penicillin IM (%)
Reported number of pregnant women living with HIV who received antiretrovirals for PMTCT
Estimated % of pregnant women living with HIV who received antiretrovirals for PMTCT*2
% of infants born to women living with HIV receiving a virological test within two months of birth (EID)*1
Final mother-to-child transmission rate including breastfeeding period*3
Elimination of mother-to-child transmission (EMTCT) of HIV
and syphilis
World Bank UNPOP
UNPOP UNPOP
World Health Stat., WHO World Bank
UNPOP World Bank
90-90-90 progress towards 2020 targetsDemographic and socioeconomic data
Estimated number of people newly infected with HIV
Estimated number of deaths due to AIDS
UNPOP
* Tracing indicators for elimination of mother-to-child transmission. A colour scheme (green, orange, red) is used to indicate if the country is on target to meet 2020 targets: ¹90% ²95% ³Less than 5
WHO/HIV/2017.59
million US$
%
years US$
460 000 [390 000 - 520 000]
36 000 [28 000 - 42 000]
250 000 [210 000 - 280 000]
2.7% [2.2% - 3.0%]
25 000 [21 000 - 29 000]
2 600 [1 800 - 3 300]
20 000 [14 000 - 26 000]
3 300 [ 2 200 - 4 600]
0.86 [0.59 - 1.13]
190 000
41% [35% - 47%]
9 200
25% [20% - 30%]
23.7 3 260
645 5.7
54 88
4.8 0.47
4 485
91%
44%
...
...
<1%
...
16 900
73% [55% - 87%]
41% [34% - 54%]
14.1
Côte d’Ivoire
22%
43%
25%
0
10 000
20 000
30 000
40 000
50 000
60 000
70 000
80 000
20162010200520000
12 000
24 000
36 000
48 000
60 000
2016201020052000
73%
0%
20%
40%
60%
80%
100%
PLHIV virally
suppressed
PLHIV receiving
ART
PLHIV diagnosed
58%
41%32%
2011-2012
2010
2015
2008
2016
2016
2016
2016
HIV Country Profile: 2016
Median annual price of ARV drug regimens for adults
Implementation of national policy on HIV self-testing (HIVST)
Treatment initiation threshold children
Treatment initiation threshold adults and adolescents
Implementation of Treat All adults and adolescents
Dolutegravir (DTG) as part of 1st line ARVs for adults and adolescents
Implementation of lifelong ART to pregnant & breastfeeding women
Implementation of national policy on viral load monitoring
Completion of HIV services cascades
Adaptation of WHO Key Population guidelines in national plans
National M&E plan or strategy for HIV
Method to de-duplicate key data (i.e. unique identifiers)
Nationally-representative quality assessment of facility-level ART data
National HIV policies and plans
0
100
200
300
400
500
600
700
800
900
2010 2011 2012 2013 2014 2015 2016Me
dia
n p
rice
in U
S d
oll
ars
pe
r p
ers
on
pe
r ye
ar
[TDF+FTC]+[LPV/r] [TDF+3TC]+[LPV/r] [ZDV+3TC]+[LPV/r]
[TDF+3TC]+[ATV/r]
0
50
100
150
200
250
300
350
400
2010 2011 2012 2013 2014 2015 2016
Me
dia
n p
rice
in U
S d
oll
ars
pe
r p
ers
on
pe
r ye
ar
[ZDV+3TC+NVP] [150+200+300] [TDF+FTC+EFV] [600+200+300] [TDF+3TC+EFV] [600+300+300]
Me
dia
n p
rice
in U
S d
oll
ars
pe
r p
ers
on
pe
r ye
ar
[ZDV+3TC]+[ATV/r]
First line Second line
Sources: Global AIDS Monitoring (UNAIDS/WHO/UNICEF), Spectrum estimates (UNAIDS/WHO) and WHO HIV Country Intelligence Tool, 2017
WHO/HIV/2017.59
* Tracing indicators for elimination of mother-to-child transmission. A colour scheme (green, orange, red) is used to indicate if the country is on target to meet 2020 targets: ¹90% ²95% ³Less than 5
WHO/HIV/2017.59
Key populations
91%
44%
...
...
<1%
...
16 900
73% [55% - 87%]
41% [34% - 54%]
14.1
0
100
200
300
400
500
600
700
800
900
2010 2011 2012 2013 2014 2015 2016Me
dia
n p
rice
in U
S d
oll
ars
pe
r p
ers
on
pe
r ye
ar
[TDF+FTC]+[LPV/r] [TDF+3TC]+[LPV/r] [ZDV+3TC]+[LPV/r]
[TDF+3TC]+[ATV/r]
0
50
100
150
200
250
300
350
400
2010 2011 2012 2013 2014 2015 2016
Me
dia
n p
rice
in U
S d
oll
ars
pe
r p
ers
on
pe
r ye
ar
[ZDV+3TC+NVP] [150+200+300] [TDF+FTC+EFV] [600+200+300] [TDF+3TC+EFV] [600+300+300]
Me
dia
n p
rice
in U
S d
oll
ars
pe
r p
ers
on
pe
r ye
ar
[ZDV+3TC]+[ATV/r]
Côte d’Ivoire
Policy on HIVST in development
Treat All, with an age cut-off <10 years
Treat All regardless of CD4 count
Implemented in few (<50%) treatment sites
DTG introduced in national guidelines (or confirmed plans for 2018)
Implemented countrywide
Partially implemented
Completed a national HIV cascade
Partially
Yes, and updated in the past two years
Yes
Yes
Percentage condom use among sex workers with most recent client 81%
Needles distributed per person who inject drugs per year 84
HIV prevalence among men who have sex with men (%) 11%
HIV prevalence among sex workers (%) 11%
2011-2012
2010
2015
2008
2016
2016
2016
2016
![WHO/HIV/2017.59 Namibia - freetoshineafrica.orgfreetoshineafrica.org/wp-content/uploads/2018/01/Country-profile... · [T D F+ FT C ]+ [LP V /r] Z D V+3T C ]LP /r [ [T D F+ 3T C ]+](https://img.pdfslide.us/doc/110x75/5c8e263309d3f218598c9a05/whohiv201759-namibia-t-d-f-ft-c-lp-v-r-z-d-v3t-c-lp-r-t-d.jpg)