Embed Size (px)
Citation preview
IZA DP No. 3081
Who Remits? The Case of Nicaragua
George S. Naufal
DI
SC
US
SI
ON
PA
PE
R S
ER
IE
S
Forschungsinstitutzur Zukunft der ArbeitInstitute for the Studyof Labor
September 2007
Who Remits?
The Case of Nicaragua
George S. Naufal American University of Sharjah
and IZA
Discussion Paper No. 3081 September 2007
IZA
P.O. Box 7240 53072 Bonn
Germany
Phone: +49-228-3894-0 Fax: +49-228-3894-180
E-mail: [email protected]
Any opinions expressed here are those of the author(s) and not those of the institute. Research disseminated by IZA may include views on policy, but the institute itself takes no institutional policy positions. The Institute for the Study of Labor (IZA) in Bonn is a local and virtual international research center and a place of communication between science, politics and business. IZA is an independent nonprofit company supported by Deutsche Post World Net. The center is associated with the University of Bonn and offers a stimulating research environment through its research networks, research support, and visitors and doctoral programs. IZA engages in (i) original and internationally competitive research in all fields of labor economics, (ii) development of policy concepts, and (iii) dissemination of research results and concepts to the interested public. IZA Discussion Papers often represent preliminary work and are circulated to encourage discussion. Citation of such a paper should account for its provisional character. A revised version may be available directly from the author.
IZA Discussion Paper No. 3081 September 2007
ABSTRACT
Who Remits? The Case of Nicaragua In this paper I use a unique data set from Nicaragua to asses the behavior of persons who send money back home. I estimate a heteroskedastic Tobit with a known form of variance to estimate the correlation of the remitting decisions of migrants. Working, residing in a developed country and belonging to the nuclear family positively affect remittances. The labor status and the level of education of the head of the household both affect remittances. The decision to participate in the remitting process appears to be positively related across migrants within the same receiving household. JEL Classification: F22, J61, O15 Keywords: migration, remittances, censored regression, decision making,
Central America, Nicaragua Corresponding author: George S. Naufal Department of Economics School of Business and Management American University of Sharjah P.O. Box 26666 Sharjah United Arab Emirates E-mail: [email protected]
2
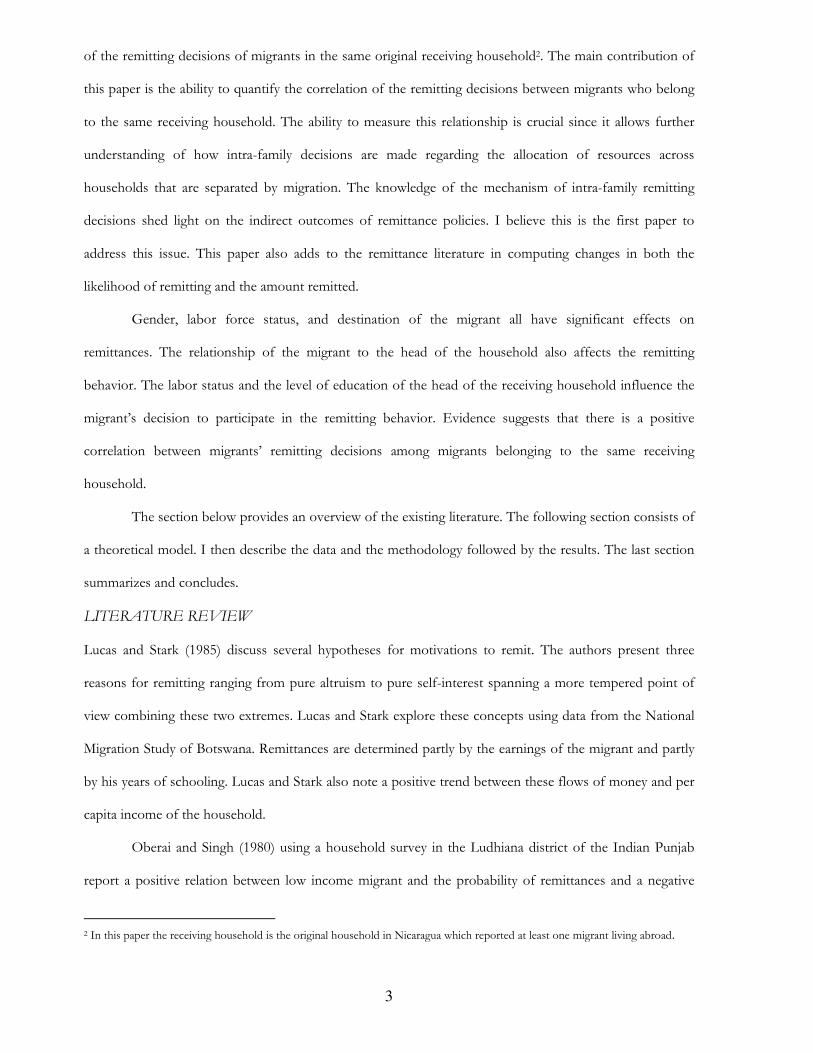
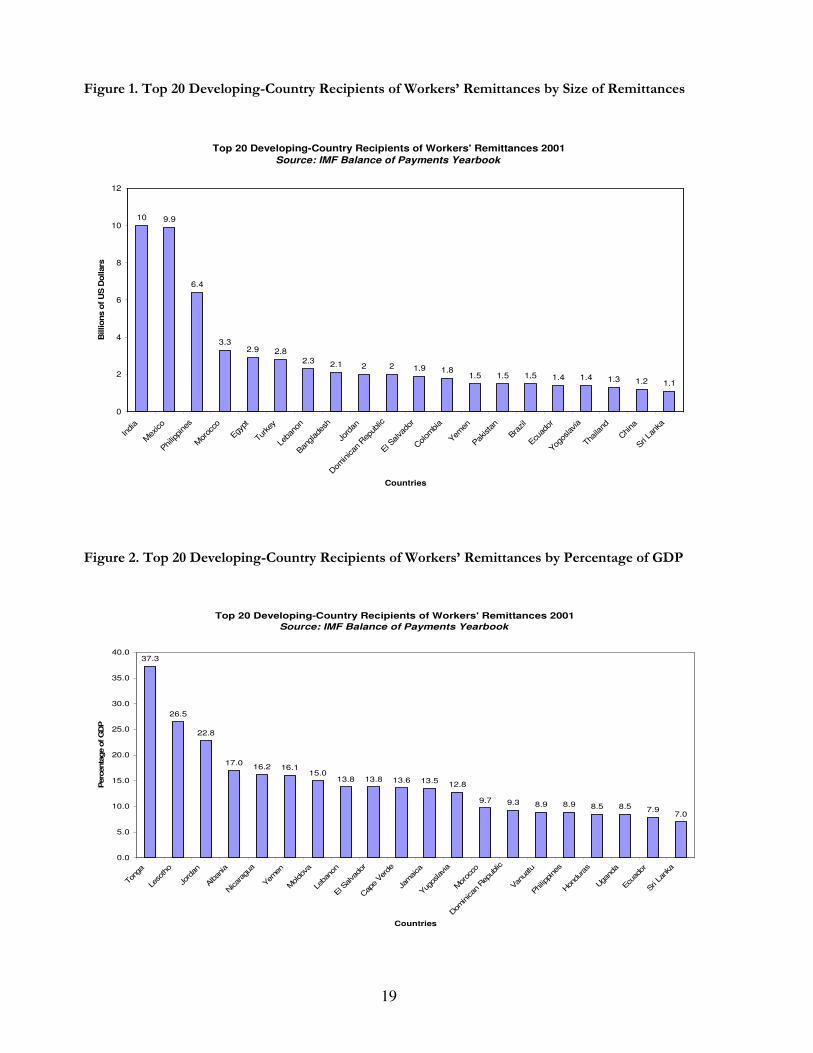
INTRODUCTION AND MOTIVATION International estimates of official remittances flows suggest that total remittances averaged around US$ 59
billion per year during the 1990s1 (World Bank). Figure 1 ranks the first 20 developing country recipients of
workers’ remittances by size of remittances received in 2001.
Out of the first 20 developing countries receiving remittances six are from Central and South
America with a total of US$ 18.5 billion. In some countries remittances constitute a significant share of
gross domestic product (GDP). Figure 2 ranks the first 20 developing country recipients of workers’
remittances by percentage of their GDP.
Remittances constitute more than 10% of the GDP in twelve developing countries. In Nicaragua,
the poorest country in the Western Hemisphere (World Bank Website www.worldbank.org/ni), remittances
constitute around 16% of its GDP, the fifth highest percentage among the developing country recipients of
workers’ remittances in 2001.
The growing importance of these transfers of money has produced a number of studies to explore
their dimensions, determinants, effects and the government policies designed to influence them. Migrant
remittances affect the performance of the economy. Glytsos (2002) shows that remittances have the
potential to substitute for foreign aid. Chami et al. (2003) find that remitting takes place under asymmetric
information and imply that remittances have a negative impact on economic growth. Amuedo-Dorantes
and Pozo (2004) find that workers’ remittances can reduce the international competitiveness of the
receiving countries’ export sector by appreciating the real exchange rate in the receiving economies.
Remittances also impact the behavior at the household level. Funkhouser (1992) finds opposite effects of
remittances inflows on the Nicaraguan and Salvadorian labor markets. Edwards and Ureta (2003) find that
remittances have a large effect on school retention. All these studies stress on better understanding the
remittance behavior in order to develop economic policies that take full advantage of these flows.
In this study I use a unique data set from Nicaragua to asses the characteristics of the individuals
who remit. I have information on the sender and the receiver from the same source. I estimate a
heteroskedastic Tobit with a known form of heteroskedasticity which allows me to examine the correlation
1 Most estimates of remittances are based on the balance of payments statistics reported to the International Monetary Fund (IMF). Note that these numbers are generally an underestimate of the actual remittances since they only include the official flows of this money into the receiving countries.
3
of the remitting decisions of migrants in the same original receiving household2. The main contribution of
this paper is the ability to quantify the correlation of the remitting decisions between migrants who belong
to the same receiving household. The ability to measure this relationship is crucial since it allows further
understanding of how intra-family decisions are made regarding the allocation of resources across
households that are separated by migration. The knowledge of the mechanism of intra-family remitting
decisions shed light on the indirect outcomes of remittance policies. I believe this is the first paper to
address this issue. This paper also adds to the remittance literature in computing changes in both the
likelihood of remitting and the amount remitted.
Gender, labor force status, and destination of the migrant all have significant effects on
remittances. The relationship of the migrant to the head of the household also affects the remitting
behavior. The labor status and the level of education of the head of the receiving household influence the
migrant’s decision to participate in the remitting behavior. Evidence suggests that there is a positive
correlation between migrants’ remitting decisions among migrants belonging to the same receiving
household.
The section below provides an overview of the existing literature. The following section consists of
a theoretical model. I then describe the data and the methodology followed by the results. The last section
summarizes and concludes.
LITERATURE REVIEW Lucas and Stark (1985) discuss several hypotheses for motivations to remit. The authors present three
reasons for remitting ranging from pure altruism to pure self-interest spanning a more tempered point of
view combining these two extremes. Lucas and Stark explore these concepts using data from the National
Migration Study of Botswana. Remittances are determined partly by the earnings of the migrant and partly
by his years of schooling. Lucas and Stark also note a positive trend between these flows of money and per
capita income of the household.
Oberai and Singh (1980) using a household survey in the Ludhiana district of the Indian Punjab
report a positive relation between low income migrant and the probability of remittances and a negative
2 In this paper the receiving household is the original household in Nicaragua which reported at least one migrant living abroad.

4
correlation between the number of household members working and this same likelihood. In addition, the
authors find that the level of education does not affect the decision whether or not to remit.
Based on a nationwide survey of households in Kenya, Knowles and Anker (1981) present
empirical evidence on issues related to remittances. The authors first stress that remittances are primarily
limited to members of the nuclear family. Moreover they conclude that migrant’s income of the sending
unit, education level, sex, ownership of a house back home and the fact of a spouse residing away all
positively affect the probability to remit. Knowles and Anker add that the length of time a migrant has
resided away negatively affect these chances. Also migrant’s schooling and income negatively influence the
level of remittances.
Funkhouser (1995) uses data from El Salvador and Nicaragua to investigate and compare the
determinants of remittances in both countries. Funkhouser applies a separable utility function that values
both absentee’s utility and the household utility. The author also follows a linear functional form in
estimating remittances. Funkhouser presents fairly similar findings for El Salvador and Nicaragua. In both
countries education is negatively related to the probability of remittances while it is positively associated to
the level of these money transfers. Using the Salvadoran data Funkhouser notes that age and gender do not
affect the likelihood and the level of remittances. In Nicaragua, age is adversely correlated with both the
probability and the amount of remittances. Furthermore, Funkhouser examines familial relationship and the
period of time spent abroad and their effects on remittances.
Rodriguez (1996) uses a data set from the Philippines to note a positive connection between the
age of the migrant, time since migration and the chance of remitting. However, equally to Knowles and
Anker this incidence decreases for long absences. Rodriguez also remarks that being a member of the
nuclear family increases the probability of remitting. Similarly to Oberai and Singh, Rodriguez does not find
a clear association relating education to remittances.
Lianos (1997) focuses on the remittances to Greece from Germany for a period of 30 years. Lianos
tests the significance of a set of factors in terms of their effects on remittances. The author finds that the
level of migrant’s income has a positive and major effect on remittances to Greece. Lianos also calculates
the elasticity of remittances with respect to income. This elasticity is greater than one suggesting a large
5
response of remittances for any small change in income. Furthermore, Lianos finds that household income
in the country of origin does not significantly influence the level of remittances.
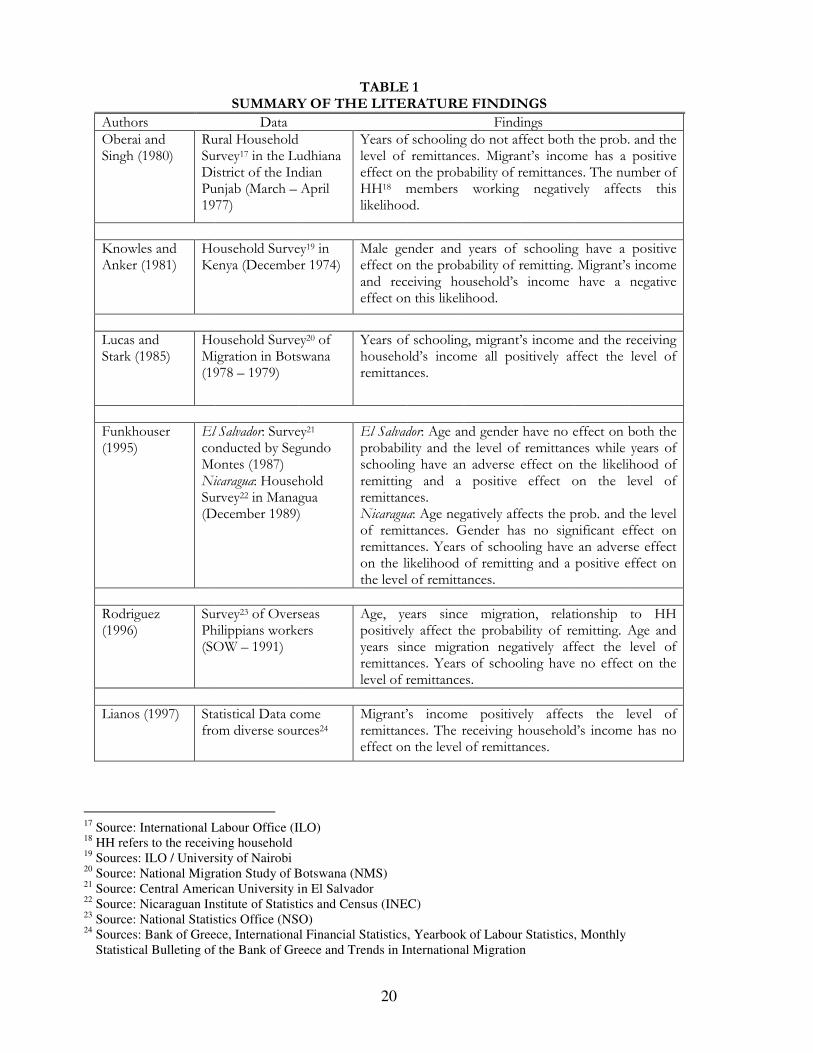
Clearly, the empirical evidence on the determinants of remittances is inconclusive. I summarize
these findings in table 1.
Both Oberai and Singh (1980) and Rodriguez (1996) find that education and remittances are not
related. Lucas and Stark (1985) along with Knowles and Anker (1981) find a relationship between these two
even though they do not agree on its direction. In addition, Lianos (1997) finds that household income is
uncorrelated with remittances while Lucas and Stark (1985) document a positive correlation. These results
support a need for more empirical studies on the determinants of remittances. The following section
outlines a theoretical model of remittance behavior.
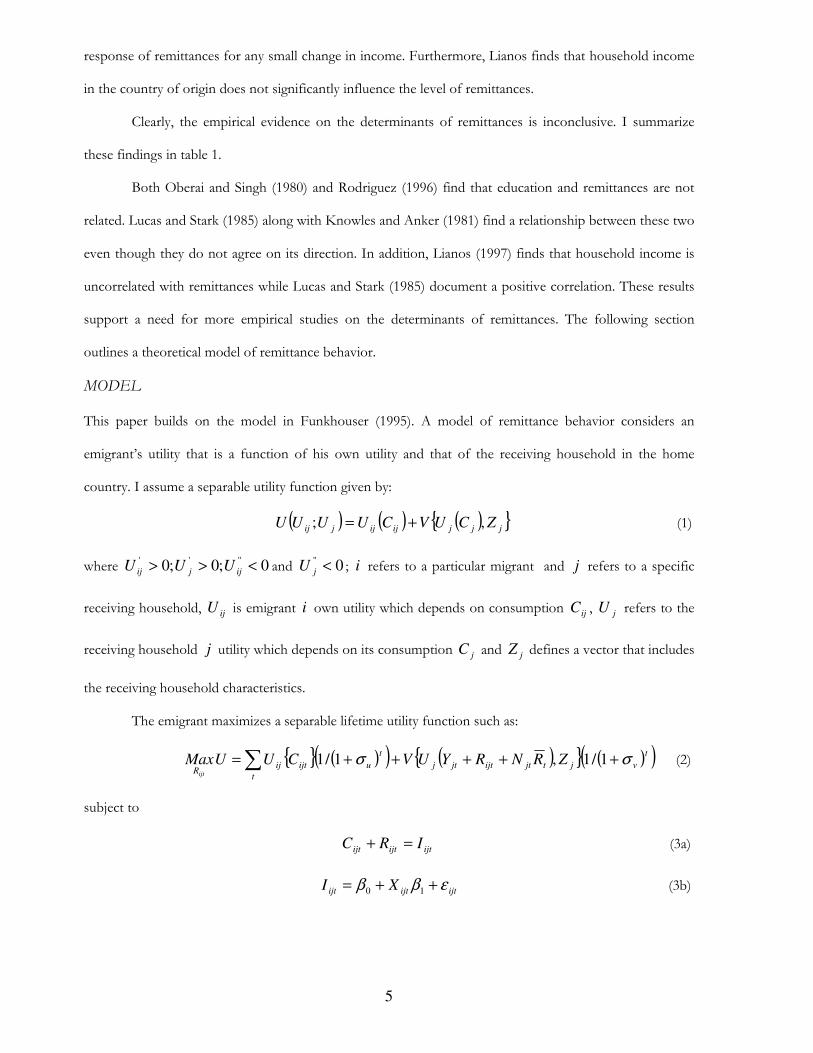
MODEL
This paper builds on the model in Funkhouser (1995). A model of remittance behavior considers an
emigrant’s utility that is a function of his own utility and that of the receiving household in the home
country. I assume a separable utility function given by:
( ) ( ) ( ){ }jjjijijjij ZCUVCUUUU ,; += (1)
where 0;0;0 '''' <>> ijjij UUU and 0'' <jU ; i refers to a particular migrant and j refers to a specific
receiving household, ijU is emigrant i own utility which depends on consumption ijC , jU refers to the
receiving household j utility which depends on its consumption jC and jZ defines a vector that includes
the receiving household characteristics.
The emigrant maximizes a separable lifetime utility function such as:
{ } ( )( ) ( ){ } ( )( )∑ +++++=t
t
vjtjtijtjtj
t
uijtijR
ZRNRYUVCUUMaxijt
σσ 1/1,1/1 (2)
subject to
ijtijtijt IRC =+ (3a)
ijtijtijt XI εββ ++= 10 (3b)

6
where ijtC is emigrant’s consumption at time t , jtY is household income earned by receiving household j
in the native country at time t , ijtR refers to remittances received by the receiving household j from
migrant i at time t , jtN identifies the number of other household emigrants at time t , jtR quantifies the
average remittances per other emigrant at time t , ijtI is the income of the emigrant i at time t , ijtX
describes a vector of emigrant’s characteristics at time t , ( )( )t
uσ+1/1 is a discount rate applied to
emigrant utility function, and ( )( )t
vσ+1/1 is a discount rate applied to the receiving household utility
function.
Solving this maximization problem leads to the first order condition for a positive level of
remittances at time t :
( ) ( )[ ] ( ) ( )[ ] 01/1/1/1 '' =+∂∂++− dRUUVdRUt
vjj
t
uij σσ (4)
Solving for the level of remittances yields an implicit remittance equation
( )jtjtjtijtvuijt RNYXRR ,,,,,σσ=∗
(5)
In a censored regression model equation (5) determines both the probability of remitting and the
level of remittances. I use a linear functional form given by:
uZXR +++=∗ πβα (6)
in which X is a vector that includes emigrants’ characteristics, Z is a vector that consists of household
characteristics in the recipient country; and u is a normally distributed error term u ~ ),0( 2σN . The
objective of exploring the determinants of remittances lies in estimating equation (6). The domain of the
dependent variable is censored since the observed remittances are never negative. Remittances are zero for
a large number of observations. I rewrite equation (6) to explicitly illustrate this:
+++
=0
ijjij
ij
uZXR
πβα if and only if
otherwise
uZX ijjij 0f+++ πβα
(7)
such that jki ,...1= ; Jj ,...1= and jk is the total number of migrants in household j and J is the total
number of receiving households.

7
In a nutshell, to explore the determinants of remittances I need to estimate equation (6).
Ordinary least squares (OLS) yield biased estimates because of the nature of the dependent variable. Two
alternative approaches are usually adopted to estimate equation (6). The first one is a Heckman (1979) two-
step procedure. This method requires that the decision to remit is a two-step decision: the likelihood of
remitting and the level of remittances. The second approach is a censored Tobit model. This model
assumes that the decision to remit is a one-step decision and therefore requires that all determinants have
the same sign effect on the likelihood and the level of remittances. In this paper the second approach is
dictated by equation (5) since it determines both the probability of remitting and the level of remittances.
DATA AND ESTIMATION METHOD
Data
The data set is from the 2001 Nicaraguan Encuesta Nacional de Hogares sobre Medición de Niveles de
Vida (EMNV). This is a nationally representative survey that was administered by the Nicaraguan Institute
for Statistics and Census. The national living standards measurement survey (LSMS) was established by the
World Bank in 1980. The LSMS collects data on many dimensions of the household well-being including
consumption, income, employment, education and migration. The data set contains 4001 households
including 22,810 household members. The survey was administered in 2001. Receiving household members
were asked about their age, education, property, income, occupation, businesses and any agricultural
activities. This survey includes a remittances model where a knowledgeable member of the receiving
household was asked about other household members who do not live in the household. All the
information about emigrants is extracted from their primary receiving household. I have information on
their destination, labor force status, age, education, their relationship to the head of the main household
and also their year of migration. The remittances module documents 897 migrants in total.
I have information on the sender and the recipient from the same source, the original receiving
household. One contribution of this paper is that I am able to track information on both sides of the
remittance behavior from the same source. This ability to identify each individual allows me to further
understand how intra-family decisions are made regarding the allocation of resources across households
that are separated by the migration of some of its members (Menjívar, 1995).
8
However even with this data set I can only precisely recognize the decision to remit of migrants. I
cannot identify the exact amount of remittances sent by each migrant3. This lack of information causes a
problem since I cannot identify the exact amount remitted by each migrant. To avoid this problem I
separate migrants into three categories based on their decision to participate in the remitting process. The
first category includes migrants who do not remit such that their remittances are zero. The second category
has migrants who remit but also who belong to households with only one migrant remitting ( 1=js
where js is the number of remitting migrants in household j ). Again I know the exact amount that these
migrants are sending. The third category consists of migrants who remit and who belong to multiple
remitting migrants’ households ( 1>js ). In this last category I do not observe the exact amount of
remittances for each migrant remitting. I average the total amount of remittances received by the original
household on all the migrants who remit. The following subsection explains in details the estimation
method.
Estimation Method
I re-write equation (6) as the following:
ijjijij uZXR +++= πβα (8)
I take the average of equation (8) by summing over migrants who are remitting within each receiving
household with multiple migrants remitting and then dividing by js . This leads to equation (9) which,
hereafter, I refer to as the average model:
∑∑∑===
+++==jjj s
i
ij
j
j
s
i
ij
j
j
j
s
i
ij
j
us
ZXs
Rs
Rs 111
1111πβα (9)
where jR is the total amount of remittances received by household j from all remitting migrants
belonging to household j and js is the number of migrants who remit in household j . If the number of
remitting migrants js is either zero or one then the model follows equation (8). Otherwise the model is
3 A knowledgeable member of the receiving household was asked whether migrant i remits or not. The same member was also
asked about the monetary value of remittances that the household received in the last 12 months.
9
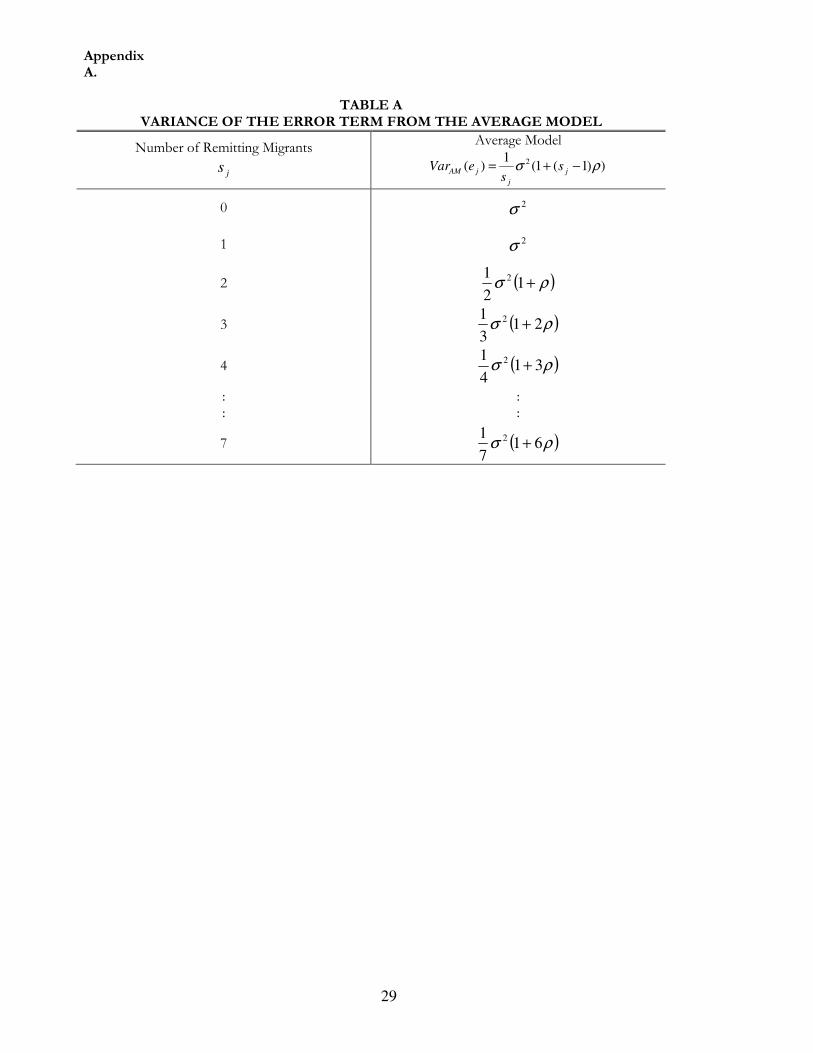
defined by equation (9). Also, since iju ~ ),0( 2σN then the new error term ∑=
=js
i
ij
j
j us
e1
1 is not
homoskedastic with je ~ ),0( 2
jN σ . Therefore, equation (9) defines a heteroskedastic Tobit with a known
form of heteroskdeasticity. In fact:
( ) ( )
++++=
= ∑
=jsjjj
j
s
i
ij
j
j j
j
uuuus
Varus
VareVar K321
1
11 (10)
Equation (10) holds for all households and can be rewritten as:
( )( ) ( ) ( )( ) 22 ))1(1(1
;cov11
;cov1
)( jj
j
sjijj
j
ijij
j
j ss
uuss
uus
eVar σρσ =−+=−+= (11)
where s is a migrant other than migrant i in household j , ( ) 2);cov( σ== ijijij uVaruu ,
jsjij uu σ=);cov( and ρ==)(*)(
);cov();(
sjij
sjij
sjijustdustd
uuuucorr . The variance of the new error term is a
function of the variance of the original model in equation (8), the number of remitting migrants within a
household and the correlation of the error terms of different remitting migrants who belong to the same
receiving household.
The correlation coefficient ρ measures the correlation between iju and sju 4. A positive ρ
suggests that if migrant i remits then migrant s also remits and both remittances amounts move in the
same direction. This suggests some competition between migrants within the same receiving household. A
less aggressive hypothesis proposes that migrants coming from the same receiving household share the
same background and behave in a similar manner. If migrant i sees a need to remit then migrant s sees the
same need and also remits and the latter is conditional on their abilities to remit. A negative ρ implies a
negative relationship between the error terms of the remitting migrants in the same household. This
indirect connection defines a crowding out effect. The fact that migrant i is remitting discourages other
migrants in the same receiving household from remitting. This negative relationship might also represent an
4 The following condition 1
1
−
−>
jsρ applies for 2≥js to insure a positive variance.
10
ex-ante agreement on the remitting behavior between all migrants within the same receiving household5.
Both of these cases indicate that remitting decisions among migrants belonging to the same receiving
household are interdependent. Finally, if ρ is equal to zero then migrants’ decisions to participate in the
remitting process are independent.
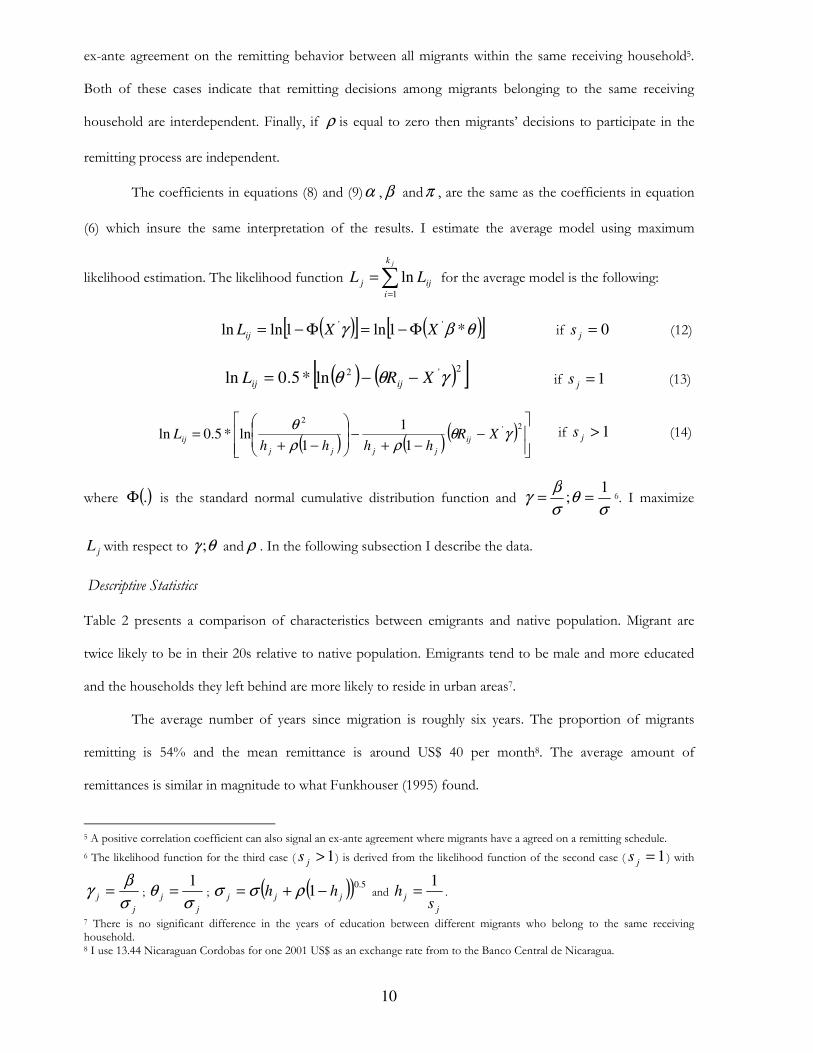
The coefficients in equations (8) and (9)α , β andπ , are the same as the coefficients in equation
(6) which insure the same interpretation of the results. I estimate the average model using maximum
likelihood estimation. The likelihood function ∑=
=jk
i
ijj LL1
ln for the average model is the following:
( )[ ] ( )[ ]θβγ *1ln1lnln ''XXLij Φ−=Φ−= if 0=js (12)
( ) ( )[ ]2'2ln*5.0ln γθθ XRL ijij −−= if 1=js (13)
( ) ( )
( )
−
−+−
−+=
2'2
1
1
1ln*5.0ln γθ
ρρ
θXR
hhhhL ij
jjjj
ij if 1>js (14)
where ( ).Φ is the standard normal cumulative distribution function and σ
θσ
βγ
1; == 6. I maximize
jL with respect to θγ ; and ρ . In the following subsection I describe the data.
Descriptive Statistics
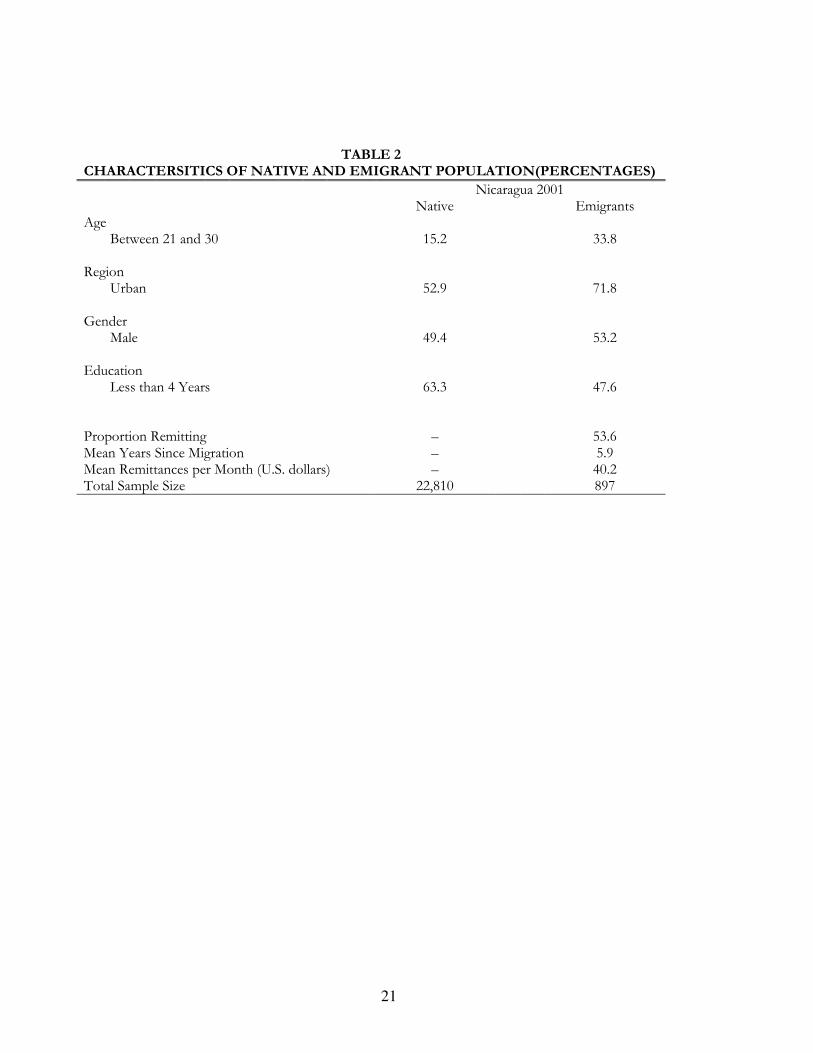
Table 2 presents a comparison of characteristics between emigrants and native population. Migrant are
twice likely to be in their 20s relative to native population. Emigrants tend to be male and more educated
and the households they left behind are more likely to reside in urban areas7.
The average number of years since migration is roughly six years. The proportion of migrants
remitting is 54% and the mean remittance is around US$ 40 per month8. The average amount of
remittances is similar in magnitude to what Funkhouser (1995) found.
5 A positive correlation coefficient can also signal an ex-ante agreement where migrants have a agreed on a remitting schedule.
6 The likelihood function for the third case ( 1>js ) is derived from the likelihood function of the second case ( 1=js ) with
j
jσ
βγ = ;
j
jσ
θ1
= ; ( )( ) 5.01 jjj hh −+= ρσσ and
j
js
h1
= .
7 There is no significant difference in the years of education between different migrants who belong to the same receiving household. 8 I use 13.44 Nicaraguan Cordobas for one 2001 US$ as an exchange rate from to the Banco Central de Nicaragua.
11
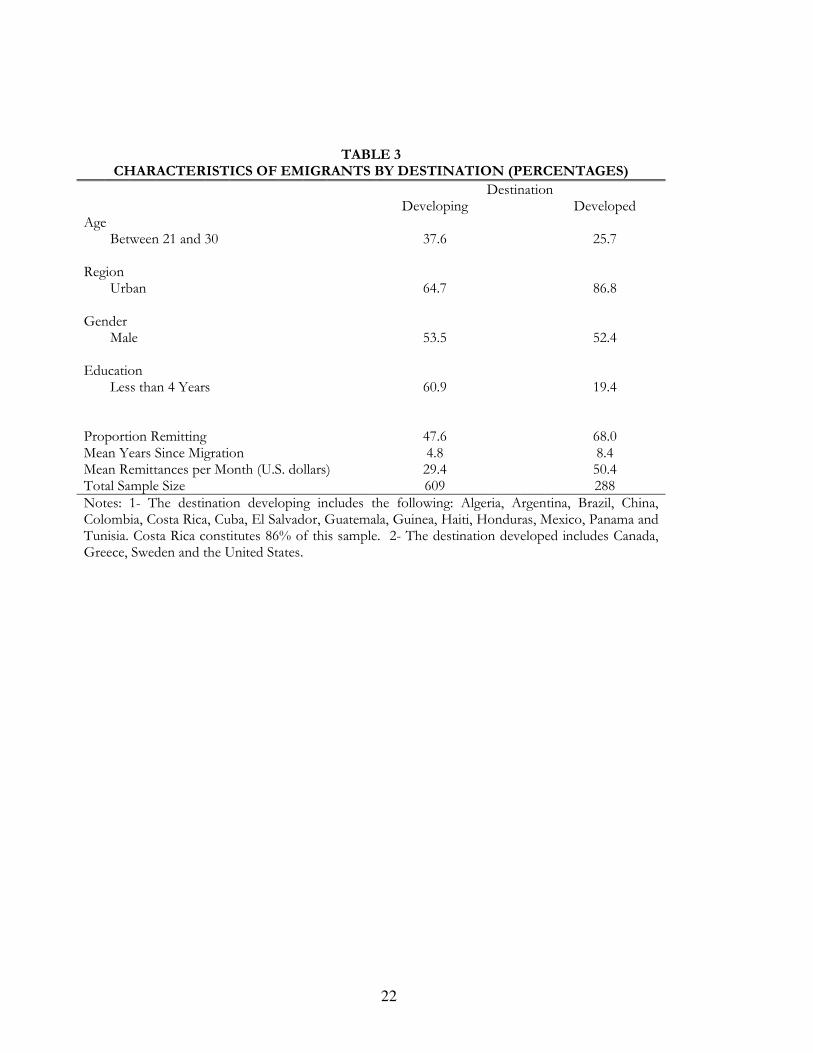
Table 3 presents characteristics of emigrants by destination. The main two destinations for
Nicaraguan migrants are Costa Rica and The United States. Costa Rica accounts for 58% share of the
Nicaraguan emigrants. The United States accounts for 28%. In table 3 I define two main subsets of
destinations and include all the developing countries under developing and all the developed countries
under developed9. Nicaraguan emigrants’ characteristics in developing countries are different from those in
developed countries for gender composition. Emigrants in developing countries come from different
regions, are less educated and tend to be more in their 20s compared to those in developed countries. The
highest proportion of remitting is by emigrants in developed countries with a 68%. The proportion of
emigrants remitting in developing countries is less than 50%. As expected, the average amount remitted per
month is higher for migrants living in developed countries. This figure is also higher than the mean of the
total sample. This is hardly surprising because in general developed countries offer higher standards of
living, higher wages and stronger currency denominations than any other developing country. Living in the
U.S. or Canada for example gives emigrants a stronger remitting power which translates into higher levels
of remittances.
I also stress on the significant difference between the mean years since migration. One plausible
explanation is that countries like the U.S. and Canada signal long term migration intentions due to
availability of opportunities and more stable economies10.
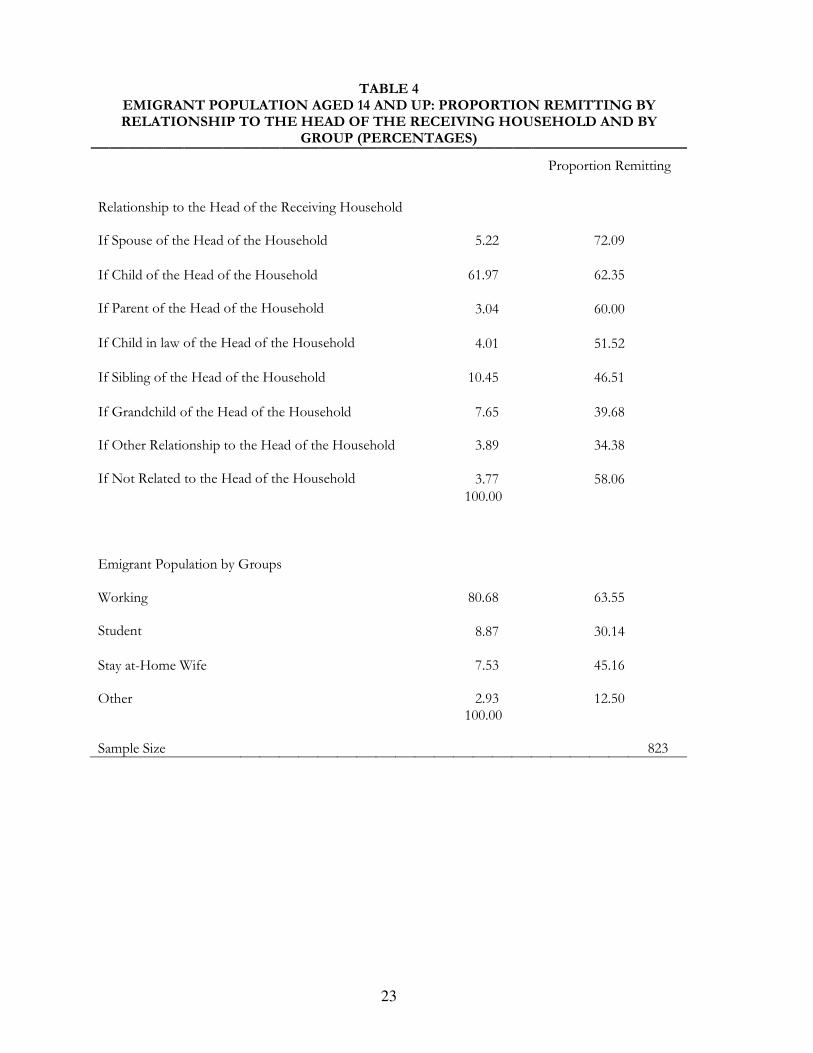
In the following I restrict the sample size to emigrants older than 1311. Table 4 describes the
proportion of migrants remitting by relationship to the head of the receiving household and by groups of
migrants. A large portion of emigrants are the offspring of the head of the household. Only about 5.2% of
the emigrants are spouses of the head of the household. Siblings to the head of the household form
approximately 10% of the total number of emigrants. These groups are ranked by the closeness of the
relationship between the migrant and the head of the household from closest to farthest. This ranking also
coincides with the ranking of the fraction of emigrants remitting except for the last group, not related,
9 For a complete list of countries please refer to table 3. 10 Migrants who belong to the same multiple migrant household seem to share the same destination country since 80 percent of receiving households report all their migrants living in the same country. 11 I limit the sample of emigrants in the household to those emigrants older than 13 because the minimum age for employment in the two most popular destinations for Nicaraguan emigrants is 15 in Costa Rica (The Costa Rican Constitution and The Labor Code) and 14 in the United States (Fair Labor Standards Act).
12
where I note a surprising 58% remitting. I suppose either a strong friendship or some investment
opportunities behind this high proportion.
Table 4 also separates the emigrant population into four subgroups. Approximately 80% of
emigrants have a job. Around 64% of the working emigrants send money back home. As expected the
proportion of students remitting is 30% much smaller than those migrants working.
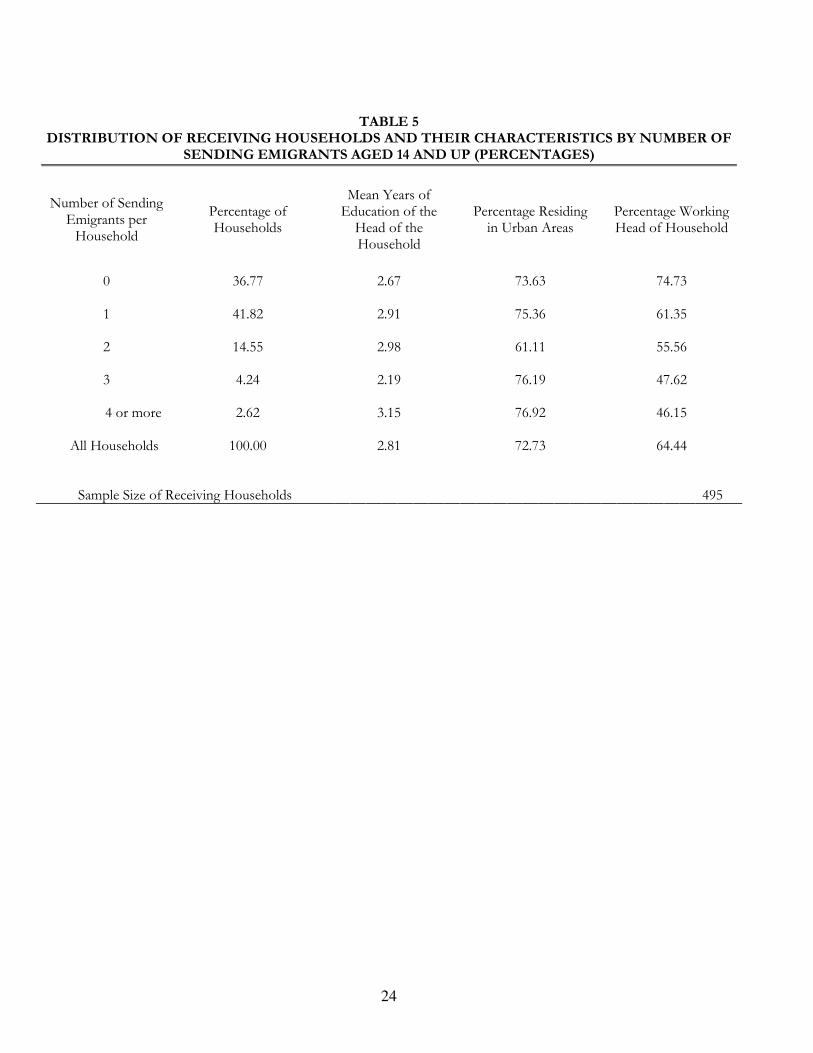
In table 5 I discuss the characteristics of the receiving households by number of remitting
emigrants per household. Out of 495 households that have at least one migrant living abroad, 41% have at
least one migrant remitting. It seems that there is a negative relationship between the number of remitting
migrants and the percentage of working head of households. The next section presents the results.
RESULTS
In this section I discuss the set of independent variables that form X and Z in equation (6). At the
remitting decision stage a migrant’s individual characteristics play a major role. I include migrants’ age,
gender, level of schooling, employment status, destination, years living abroad and the relationship to the
head of the receiving household. Likewise I expect the receiving household’s attributes to have an effect on
the migrant’s remitting decisions. I include the receiving household area of residence, the labor status and
the years of education of the head of the household.
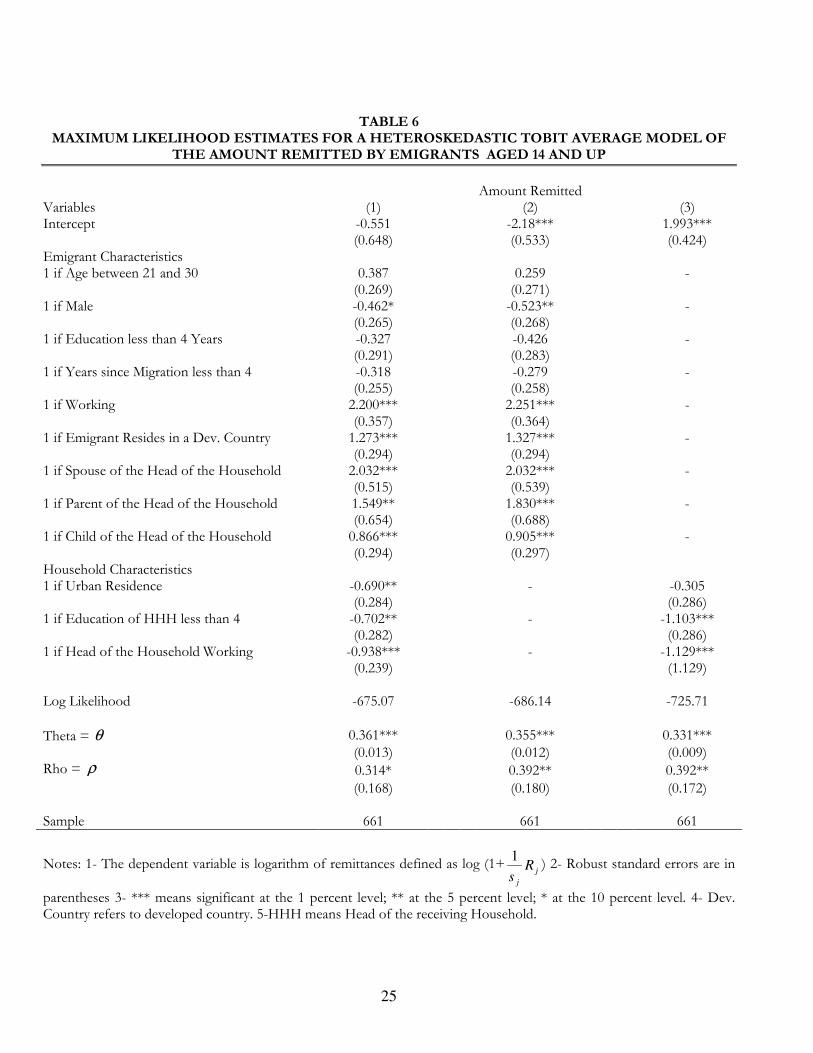
Table 6 outline three model specifications with different subset of independent variables for the
average model presented in section 4. Column (1) shows the maximum likelihood estimates of a
heteroskedastic Tobit on both emigrant and receiving household characteristics. Column (2) includes a set
of emigrant’s characteristics while column (3) includes the receiving household’s characteristics12. Migrant’s
gender, the labor force status, destination and the relationship to the head of the receiving household all
significantly affect the remitting behavior. The education level and the labor status of the head of the
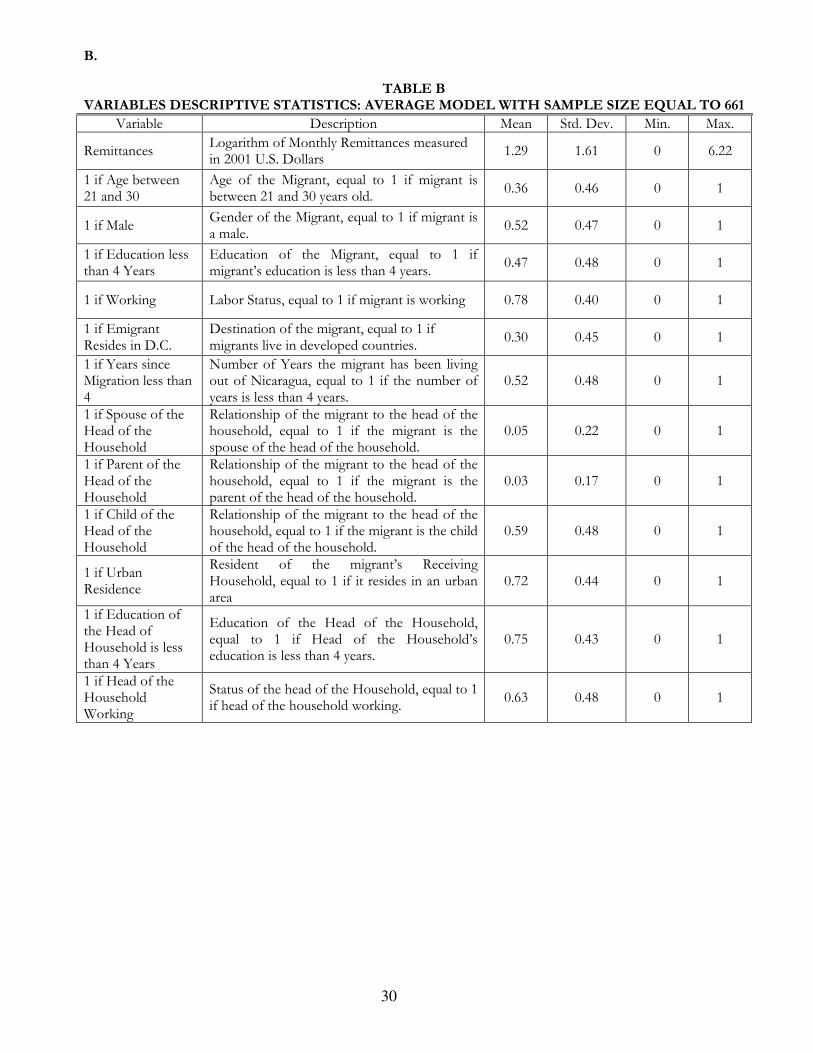
household also affect the remitting process13.
12 A list of definitions and descriptive statistics of the variables is in appendix B. All the independent variables are in discrete form. The dependent variable is the logarithm of monthly remittances measured in 2001 U.S. dollars. 13 The variables of migrant education and years since migration are defined around their median which is four years. The variable of head of household education is defined around four for comparison purpose with the migrant education variable (the median is three for this variable).
13
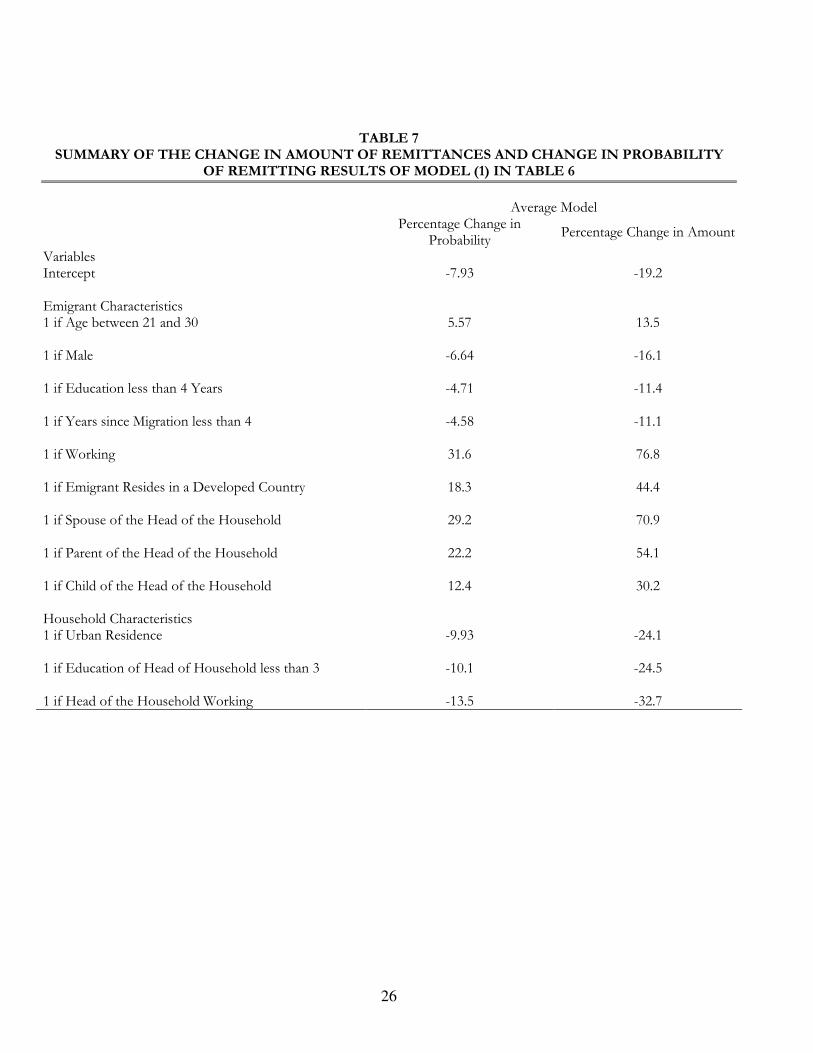
One of the contributions of this paper is quantifying the results. Table 7 decomposes the
heteroskedastic Tobit coefficients into two effects: a change in the probability of remitting and a percentage
change in the amount remitted.
Male migrants are less likely to remit. The probability of remitting decreases by around 7% for
male migrants. These findings strengthen the belief of gender differences in the remitting behavior.
Migrants who have a job are 32% more likely to remit than those who are not working. Also the percentage
change in the level of remittances is a large increase of 77% for working migrants. Living in the U.S. or
Canada increases both the probability (18%) and the percentage change in the amount of remittances
(44%). The labor status and the destination of the migrant seem to have a significant role in the remitting
behavior for Nicaraguans. Together they shape the remitting ability of migrants.
The probability and amount of remittances increase for migrants belonging to the nuclear family.
The increase in the probability and the amount is the largest for the migrants who are the spouse or the
parent (29% to 22% for the probability and 71% to 54% for the change in the amount) compared to
migrants who are the child of the head of the household (12% to 30%). The difference in these magnitudes
is most likely explained by the responsibility that spouses and parents share toward the receiving household.
Spouses and parents share the responsibility of providing for the receiving household while this
responsibility is not that evident for child migrants. Also the large difference of the percent change in the
amount between a migrant spouse and a migrant parent strengthens this hypothesis since it also illustrates
the difference between the roles of parents and spouses (Menjivar et al., 1998:104).
From the household characteristics, the likelihood of remitting and the percentage change in the
amount remitted decrease for migrants belonging to a receiving household with a head of household who
reports less than four years of education (10% and 25% respectively). The same results apply for receiving
households with a working head (14% and 33% respectively). A working head of the receiving household
signals a stable source of income and possibly less need for financial help.
The main contribution of the paper is quantifying the interaction among remitters within the same
receiving household. Social interactions and decision making are topics of huge interests for economists. In
fact, the literature on the interaction among members of the same household is extensive (see, for example,
Becker, 1974; Bergstorm, 1989). However, no paper has extended this literature into the theory of migrant
14
remittance behavior. I measure the remittance behavior between migrants belonging to the same
household. The correlation coefficient ρ is positive for all three regressions. This coefficient is
significantly different from zero at the 5% significance level and is around 0.39 for two of the three
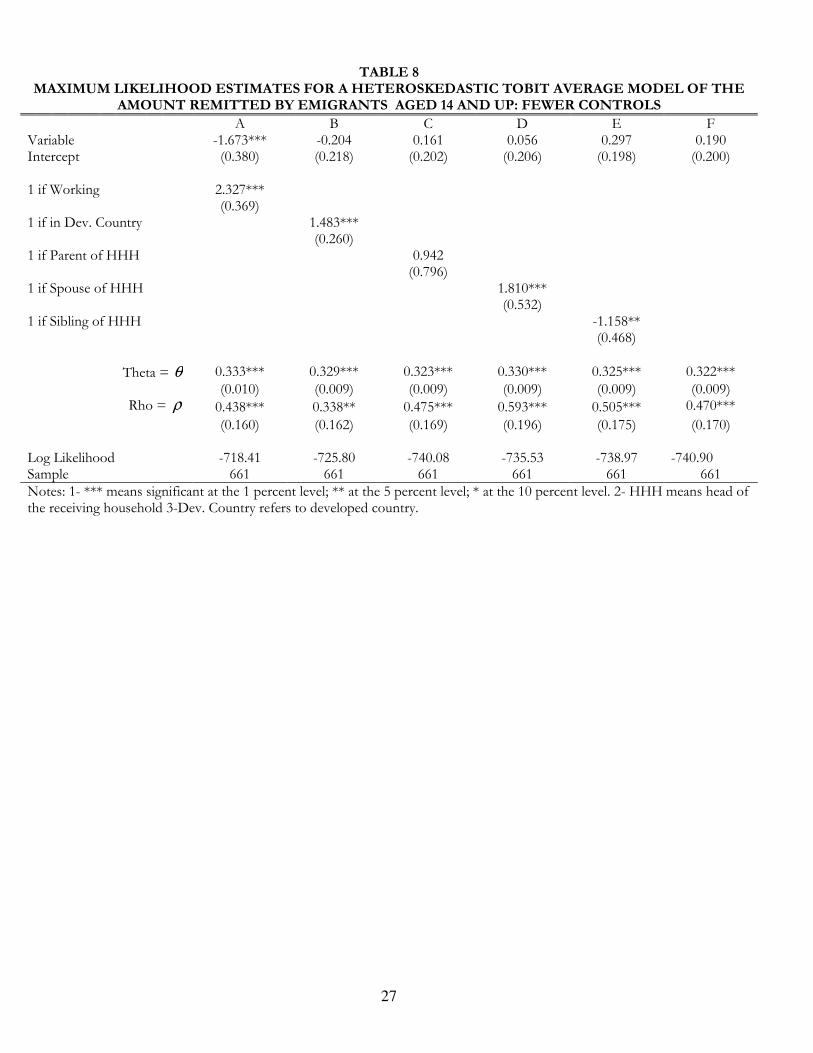
regressions. In order to measure ρ with more precision I re-estimate the average model with fewer
controls. Table 8 present six different specifications. For instance, column A includes the labor status of the
migrant while column B represents the average model controlling for migrant’s destination.
The correlation coefficient is significant at the 1 percent significance level for five of the six cases
and in all these cases the estimates of ρ are greater than the ones presented in table 6. Column F includes
no controls and estimates ρ to be around 0.47. I refer to this value as the benchmark value14.
The remitting decision of migrant i seems to be directly related to the remitting decision of
migrant s taken into consideration that both migrants belong to the same receiving household15. One can
say that migrants within the same receiving households compete through remittances. If migrant i remit
then migrant s remits and remits more. Migrants compete to get the attention of the receiving household.
Another hypothesis proposes that migrants belonging to the same receiving household share the
same background and therefore behave in the same manner. For instance, if migrant i sees a need to remit
then s sees the same need and also remits. Also one can think of an ex-ante agreement hypothesis between
migrants. Migrants agree on a predetermined schedule of remitting.
The relationship of the migrant to the head of the receiving household is not necessarily the same
for all migrants. The difference in the relationship to the head of the household can define a different
association with the receiving household and therefore a different approach towards remitting. I test this
suggestion by pooling on all migrants who are children of the head of the household. Migrants who are
children of the head of the household represent the largest group of emigrants.
14 Note that this model allows me to calculate the homoskedastic variance of the original model. From table 8 column F I find that
θ is equal to 0.322 which means that 2σ is around 9.64.
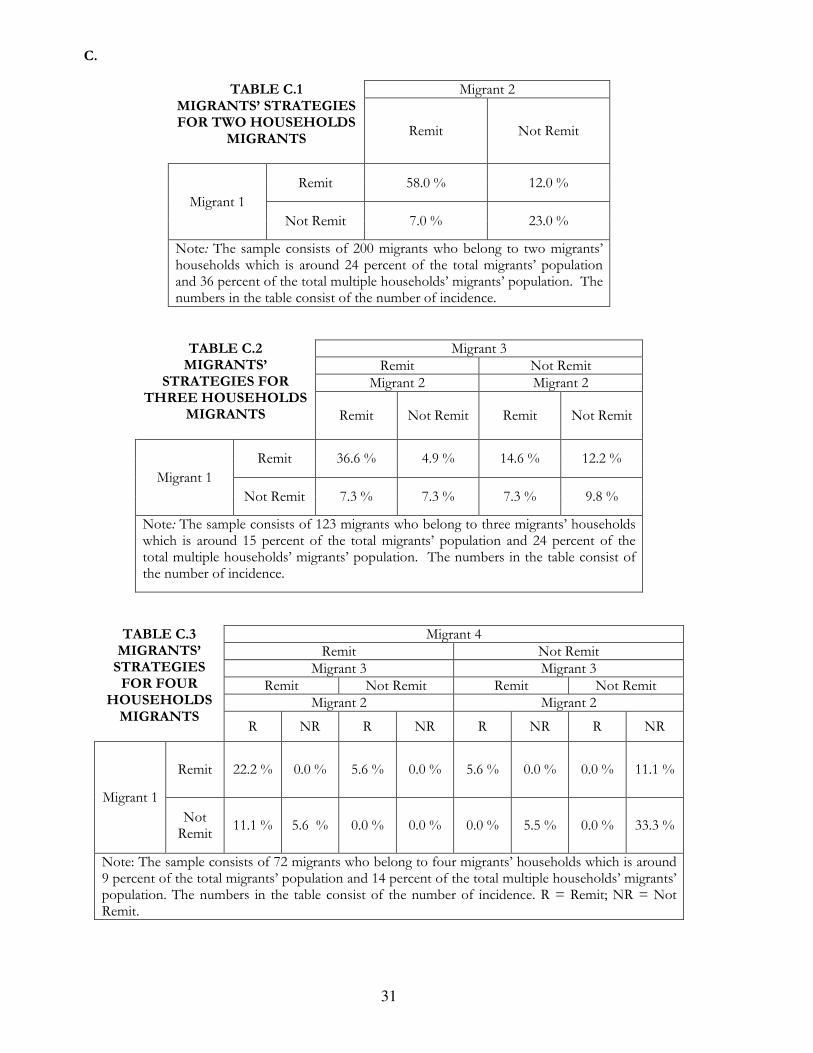
15 Moreover, tables C.1 through C.3 in the appendix provide the normal form for a supposed game between migrants within the same receiving household. Again evidence suggests that there is a positive relationship between the migrants remitting decisions in the same receiving household. Close to 80% of migrants who belong to two migrants’ receiving households share the same strategy concerning remitting. For households with three and four migrants this number goes down to 46.4% and 55.5% but is still the dominant habit.

15
Table 9 illustrates four equations with different sub-samples and no controls16. The first column
includes migrants who are the children of the head of the household. The other columns add more
restrictions on the children sample by labor status and destination. The correlation coefficient estimates do
not differ much from the benchmark value except for the migrants who are children and living in Costa
Rica. The estimate of ρ captures the highest correlation (0.70) in the remitting decisions among migrants
living in Costa Rica and who are siblings. The high correlation estimate might be explained by the fact that
many Nicaraguans migrate to Costa Rica to work in the coffee harvest and share the same remitting
behavior.
CONCLUSION
In recent years remittances have gained international spotlight. Migrant remittances can affect the
performance of the economy as a whole and can also impact the behavior at the household level. One way
to develop economic policies that take full advantage of these money flows is to understand the remitting
behavior.
This paper examines the remitting behavior of Nicaraguans. It presents three main contributions:
using a rich data set, quantifying the correlation of the remitting decisions and calculating the changes in the
likelihood and amount of remittances. I use a rich data set where I have information on the sender and the
receiver from the same source. I estimate a heteroskedastic Tobit with a known form of heteroskedasticity
to capture both the probability of remitting and the levels of remittances. Gender, labor force status and
destination of the migrant along with the nuclear family all have significant effects on the remitting
behavior. The labor force status and the education level of the head of the receiving household influence
the migrant’s decision to participate in the remitting behavior.
From policy perspective, it seems that foreign migration policies are likely to have significant
effects on remittances to Nicaragua since these policies are likely to affect the destination of Nicaraguan
migrants. Also any economic shocks in the destination countries affect the remittance process in Nicaragua
by affecting the labor status of the Nicaraguan migrant. On the other hand, domestic policies that affect the
composition of the emigrant pool through gender, receiving household characteristics and even the
16 An attempt was made to classify the relationships between migrants themselves based on the relationship to the head of the receiving household. This attempt leads to inaccurate classifications since I cannot exactly observe the link between multiple migrants.
16
relationship of the migrant to the head of the household are also likely to affect the amount of remittances
sent back to Nicaragua.
In addition, migrants belonging to the same receiving household seem to make decisions
concerning remittances in accordance with other migrants in the same household. I find evidence
supporting a positive correlation between migrants’ remitting decisions. For policy makers this is of great
significance. Remittance policies that directly target particular migrants are also expected to affect the
remittance decisions of other migrants belonging to the same receiving household. The full effect of such
policies can be separated into direct effect through the main policy objective and an indirect effect through
the significant correlation between the remitting decisions.
Also, this direct correlation introduces a set of hypotheses on the remitting decisions. Migrants
within the same receiving household might be competing, behaving in the same manner based on their
shared background or simply implementing an ex-ante agreement. It is not very clear from the results in
this paper which model of household behavior is supported (collective versus unitary) (Browning and
Chiappori, 1998). Also it is not obvious whether the remitting decisions of migrants belonging to the same
receiving household should be modeled as a cooperative process (ex-ante agreement). More evidence from
other data sets is needed in order to investigate this set of hypotheses. This approach forms the next step in
this line of research.
17
REFERENCES
Amuedo-Dorantes, C., and S Pozo 2004 “Worker’s Remittances and The Real Exchange Rate: Paradox of Gifts.” World Development 32(8): iiiiiiiiii 1407-1417. Becker, G iiiiiiiiii 1974 “A Theory of Social Interactions.” Journal of Political Economy 82(6): 1063-1093. Bergstorm, T 1989 “A Fresh Look at the Rotten Kid Theorem--and Other Households Mysteries.” Journal of Political iiiiiiiiii Economy 97(5):1138-1159. Browning, M., and P.A. Chiappori iiiiiiiiii 1998 “Efficient Intra-Household Allocations: A General Characterization and Empirical Tests.” iiiiiiiiii Econometrica 66(6): 1241-1278. Chami, R., C. Fullenkamp, and S, Jahjah iiiiiiiiii 2003 “Are Immigrant Remittance Flows a Source of Capital for Development?” IMF-Working Paper iiiiiiiiii No.WP/03/189. Edwards, A., and M. Ureta iiiiiiiiii 2003 “International Migration, Remittances and Schooling: Evidence from El-Salvador.” Journal of iiiiiiiiii Development Economics 72 (2): 429-461 Funkhouser, E iiiiiiiiii 1992 “ Migration from Nicaragua: Some Recent Evidence.” World Development 20(8): 1209-1218. Funkhouser, E iiiiiiiiii 1995 “Remittances from International Migration: A comparison of El Salvador and Nicaragua.” The iiiiiiiiii review of Economics and Statistics 77(1): 137-146. Glytsos, N iiiiiiiiii 2002 “The Role of Migrant Remittances in Development: Evidence from Mediterranean Countries.” iiiiiiiiii International Migration 40(1):5-26. Heckman, J. J. 1979 “Sample Selection Bias as a Specification Error.” Econometrica 47(1):153-162. Knowles, J., and L. Anker iiiiiiiiii 1981 “An Analysis of Income Transfers in a Developing Country: The Case of Kenya.” Journal of iiiiiiiiii Development Economics 8(2):205-226. Lianos, T.P iiiiiiiiii 1997 “Factors Determining Migrant Remittances: The Case of Greece.” International Migration Review iiiiiiiiii 31(1): 72-87. Lucas, R.., and O. Stark iiiiiiiiii 1985 “Motivations to Remit: Evidence from Botswana.” Journal of Political Economy 93(5): 901-918. Menjívar, C iiiiiiiiii 1995 “Immigrant Social Networks: Implications and Lessons for Policy.” Harvard Journal of Hispanic iiiiiiiiii Policy 8: 35-59. Menjívar, C., J. DaVanzo, L. Greenwell, and R. Burciaga Valdez
18
iiiiiiiiii 1998 “Remittance Behavior among Salvadoran and Filipino Immigrants in Los Angeles.” International iiiiiiiiii Migration Review 32(1):97-126. Oberai, A.S., and K.M. Singh iiiiiiiiii 1980 “Migration, Remittances and Rural Development: Findings of a case study in the Indian iiiiiiiiii Punjab.” International Labour Review 119(2): 229-241. Rodriguez, E.R. iiiiiiiiii 1996 “ International Migrant’s Remittances in the Philippines.” Canadian Journal of Economics 29(2): iiiiiiiiii S427-S432. World Bank www.worldbank.org
World Bank Nicaragua’s Webpage Accessed August 2007 www.worldbank.org/nic.
19
Figure 1. Top 20 Developing-Country Recipients of Workers’ Remittances by Size of Remittances
Top 20 Developing-Country Recipients of Workers' Remittances 2001
Source: IMF Balance of Payments Yearbook
10 9.9
6.4
3.32.9 2.8
2.3 2.1 2 2 1.9 1.81.5 1.5 1.5 1.4 1.4 1.3 1.2 1.1
0
2
4
6
8
10
12
India
Mex
ico
Philip
pine
s
Mor
occo
Egy
pt
Turk
ey
Leba
non
Ban
glad
esh
Jord
an
Dom
inican
Rep
ublic
El S
alva
dor
Colom
bia
Yem
en
Pak
ista
n
Bra
zil
Ecu
ador
Yog
oslavia
Thailand
China
Sri
Lank
a
Countries
Billio
ns o
f U
S D
ollars
Figure 2. Top 20 Developing-Country Recipients of Workers’ Remittances by Percentage of GDP
Top 20 Developing-Country Recipients of Workers' Remittances 2001
Source: IMF Balance of Payments Yearbook
37.3
26.5
22.8
17.016.2 16.1
15.013.8 13.8 13.6 13.5
12.8
9.7 9.3 8.9 8.9 8.5 8.5 7.97.0
0.0
5.0
10.0
15.0
20.0
25.0
30.0
35.0
40.0
Ton
ga
Leso
tho
Jord
an
Alban
ia
Nicarag
ua
Yem
en
Moldo
va
Leba
non
El S
alva
dor
Cap
e Verde
Jamaica
Yug
oslavia
Mor
occo
Dom
inican
Rep
ublic
Van
uatu
Philip
pine
s
Hon
duras
Uga
nda
Ecu
ador
Sri La
nka
Countries
Perc
enta
ge o
f G
DP
20
TABLE 1
SUMMARY OF THE LITERATURE FINDINGS
Authors Data Findings Oberai and Singh (1980)
Rural Household Survey17 in the Ludhiana District of the Indian Punjab (March – April 1977)
Years of schooling do not affect both the prob. and the level of remittances. Migrant’s income has a positive effect on the probability of remittances. The number of HH18 members working negatively affects this likelihood.
Knowles and Anker (1981)
Household Survey19 in Kenya (December 1974)
Male gender and years of schooling have a positive effect on the probability of remitting. Migrant’s income and receiving household’s income have a negative effect on this likelihood.
Lucas and Stark (1985)
Household Survey20 of Migration in Botswana (1978 – 1979)
Years of schooling, migrant’s income and the receiving household’s income all positively affect the level of remittances.
Funkhouser (1995)
El Salvador: Survey21 conducted by Segundo Montes (1987) Nicaragua: Household Survey22 in Managua (December 1989)
El Salvador: Age and gender have no effect on both the probability and the level of remittances while years of schooling have an adverse effect on the likelihood of remitting and a positive effect on the level of remittances. Nicaragua: Age negatively affects the prob. and the level of remittances. Gender has no significant effect on remittances. Years of schooling have an adverse effect on the likelihood of remitting and a positive effect on the level of remittances.
Rodriguez (1996)
Survey23 of Overseas Philippians workers (SOW – 1991)
Age, years since migration, relationship to HH positively affect the probability of remitting. Age and years since migration negatively affect the level of remittances. Years of schooling have no effect on the level of remittances.
Lianos (1997) Statistical Data come
from diverse sources24 Migrant’s income positively affects the level of remittances. The receiving household’s income has no effect on the level of remittances.
17
Source: International Labour Office (ILO) 18
HH refers to the receiving household 19
Sources: ILO / University of Nairobi 20
Source: National Migration Study of Botswana (NMS) 21
Source: Central American University in El Salvador 22
Source: Nicaraguan Institute of Statistics and Census (INEC) 23
Source: National Statistics Office (NSO) 24
Sources: Bank of Greece, International Financial Statistics, Yearbook of Labour Statistics, Monthly
Statistical Bulleting of the Bank of Greece and Trends in International Migration
21
TABLE 2
CHARACTERSITICS OF NATIVE AND EMIGRANT POPULATION(PERCENTAGES)
Nicaragua 2001 Native Emigrants Age Between 21 and 30 15.2 33.8 Region Urban 52.9 71.8 Gender Male 49.4 53.2 Education Less than 4 Years 63.3 47.6 Proportion Remitting – 53.6 Mean Years Since Migration – 5.9 Mean Remittances per Month (U.S. dollars) – 40.2 Total Sample Size 22,810 897
22
TABLE 3 CHARACTERISTICS OF EMIGRANTS BY DESTINATION (PERCENTAGES)
Destination Developing Developed Age Between 21 and 30 37.6 25.7 Region Urban 64.7 86.8 Gender Male 53.5 52.4 Education Less than 4 Years 60.9 19.4 Proportion Remitting 47.6 68.0 Mean Years Since Migration 4.8 8.4 Mean Remittances per Month (U.S. dollars) 29.4 50.4 Total Sample Size 609 288 Notes: 1- The destination developing includes the following: Algeria, Argentina, Brazil, China, Colombia, Costa Rica, Cuba, El Salvador, Guatemala, Guinea, Haiti, Honduras, Mexico, Panama and Tunisia. Costa Rica constitutes 86% of this sample. 2- The destination developed includes Canada, Greece, Sweden and the United States.
23
TABLE 4 EMIGRANT POPULATION AGED 14 AND UP: PROPORTION REMITTING BY RELATIONSHIP TO THE HEAD OF THE RECEIVING HOUSEHOLD AND BY
GROUP (PERCENTAGES)
Proportion Remitting
Relationship to the Head of the Receiving Household If Spouse of the Head of the Household 5.22 72.09
If Child of the Head of the Household 61.97 62.35 If Parent of the Head of the Household 3.04 60.00
If Child in law of the Head of the Household 4.01 51.52
If Sibling of the Head of the Household 10.45 46.51
If Grandchild of the Head of the Household 7.65 39.68 If Other Relationship to the Head of the Household 3.89 34.38 If Not Related to the Head of the Household 3.77 58.06
100.00
Emigrant Population by Groups Working 80.68 63.55 Student 8.87 30.14 Stay at-Home Wife 7.53 45.16 Other 2.93 12.50 100.00 Sample Size 823
24
TABLE 5 DISTRIBUTION OF RECEIVING HOUSEHOLDS AND THEIR CHARACTERISTICS BY NUMBER OF
SENDING EMIGRANTS AGED 14 AND UP (PERCENTAGES)
Number of Sending Emigrants per Household
Percentage of Households
Mean Years of Education of the
Head of the Household
Percentage Residing in Urban Areas
Percentage Working Head of Household
0 36.77 2.67 73.63 74.73 1 41.82 2.91 75.36 61.35 2 14.55 2.98 61.11 55.56 3 4.24 2.19 76.19 47.62 4 or more 2.62 3.15 76.92 46.15 All Households 100.00 2.81 72.73 64.44
Sample Size of Receiving Households 495
25
TABLE 6 MAXIMUM LIKELIHOOD ESTIMATES FOR A HETEROSKEDASTIC TOBIT AVERAGE MODEL OF
THE AMOUNT REMITTED BY EMIGRANTS AGED 14 AND UP
Amount Remitted Variables (1) (2) (3) Intercept -0.551 -2.18*** 1.993*** (0.648) (0.533) (0.424) Emigrant Characteristics 1 if Age between 21 and 30 0.387 0.259 - (0.269) (0.271) 1 if Male -0.462* -0.523** - (0.265) (0.268) 1 if Education less than 4 Years -0.327 -0.426 - (0.291) (0.283) 1 if Years since Migration less than 4 -0.318 -0.279 - (0.255) (0.258) 1 if Working 2.200*** 2.251*** - (0.357) (0.364) 1 if Emigrant Resides in a Dev. Country 1.273*** 1.327*** - (0.294) (0.294) 1 if Spouse of the Head of the Household 2.032*** 2.032*** - (0.515) (0.539) 1 if Parent of the Head of the Household 1.549** 1.830*** - (0.654) (0.688) 1 if Child of the Head of the Household 0.866*** 0.905*** - (0.294) (0.297) Household Characteristics 1 if Urban Residence -0.690** - -0.305 (0.284) (0.286) 1 if Education of HHH less than 4 -0.702** - -1.103*** (0.282) (0.286) 1 if Head of the Household Working -0.938*** - -1.129*** (0.239) (1.129) Log Likelihood -675.07 -686.14 -725.71
Theta = θ 0.361*** 0.355*** 0.331*** (0.013) (0.012) (0.009) Rho = ρ 0.314* 0.392** 0.392**
(0.168) (0.180) (0.172) Sample 661 661 661
Notes: 1- The dependent variable is logarithm of remittances defined as log (1+j
j
Rs
1) 2- Robust standard errors are in
parentheses 3- *** means significant at the 1 percent level; ** at the 5 percent level; * at the 10 percent level. 4- Dev. Country refers to developed country. 5-HHH means Head of the receiving Household.
26
TABLE 7 SUMMARY OF THE CHANGE IN AMOUNT OF REMITTANCES AND CHANGE IN PROBABILITY
OF REMITTING RESULTS OF MODEL (1) IN TABLE 6
Average Model Percentage Change in
Probability Percentage Change in Amount
Variables Intercept -7.93 -19.2 Emigrant Characteristics 1 if Age between 21 and 30 5.57 13.5 1 if Male -6.64 -16.1 1 if Education less than 4 Years -4.71 -11.4 1 if Years since Migration less than 4 -4.58 -11.1 1 if Working 31.6 76.8 1 if Emigrant Resides in a Developed Country 18.3 44.4 1 if Spouse of the Head of the Household 29.2 70.9 1 if Parent of the Head of the Household 22.2 54.1 1 if Child of the Head of the Household 12.4 30.2 Household Characteristics 1 if Urban Residence -9.93 -24.1 1 if Education of Head of Household less than 3 -10.1 -24.5 1 if Head of the Household Working -13.5 -32.7
27
TABLE 8
MAXIMUM LIKELIHOOD ESTIMATES FOR A HETEROSKEDASTIC TOBIT AVERAGE MODEL OF THE AMOUNT REMITTED BY EMIGRANTS AGED 14 AND UP: FEWER CONTROLS
A B C D E F Variable -1.673*** -0.204 0.161 0.056 0.297 0.190 Intercept (0.380) (0.218) (0.202) (0.206) (0.198) (0.200) 1 if Working 2.327*** (0.369) 1 if in Dev. Country 1.483*** (0.260) 1 if Parent of HHH 0.942 (0.796) 1 if Spouse of HHH 1.810*** (0.532) 1 if Sibling of HHH -1.158** (0.468)
Theta = θ 0.333*** 0.329*** 0.323*** 0.330*** 0.325*** 0.322*** (0.010) (0.009) (0.009) (0.009) (0.009) (0.009)
Rho = ρ 0.438*** 0.338** 0.475*** 0.593*** 0.505*** 0.470***
(0.160) (0.162) (0.169) (0.196) (0.175) (0.170) Log Likelihood -718.41 -725.80 -740.08 -735.53 -738.97 -740.90 Sample 661 661 661 661 661 661 Notes: 1- *** means significant at the 1 percent level; ** at the 5 percent level; * at the 10 percent level. 2- HHH means head of the receiving household 3-Dev. Country refers to developed country.

28
TABLE 9
MIGRANT REMITTING DECISIONS AMONG DIFFERENT SAMPLES: RELATIONSHIP OF THE MIGRANT TO THE HEAD OF THE HOUSEHOLD, LABOR STATUS AND
DESTINATION
Child Child and Working
Child and living in Costa Rica
Child and living in U.S. or Canada
Variable Intercept 0.445** 0.946*** 0.161 0.829** (0.234) (0.227) (0.301) (0.334) Theta = θ 0.349*** 0.355*** 0.360*** 0.317*** (0.012) (0.014) (0.017) (0.017) Rho = ρ 0.514** 0.254 0.701** 0.459*
(0.224) (0.164) (0.355) (0.264) Log Likelihood -459.94 -395.62 -291.67 -235.54 Sample 408 341 269 191 Notes: *** means significant at the 1 percent level; ** at the 5 percent level; * at the 10 percent level.
29
Appendix A.
TABLE A VARIANCE OF THE ERROR TERM FROM THE AVERAGE MODEL
Number of Remitting Migrants
js
Average Model
))1(1(1
)( 2 ρσ −+= j
j
jAM ss
eVar
0 2σ
1 2σ
2 ( )ρσ +12
1 2
3 ( )ρσ 213
1 2 +
4 ( )ρσ 314
1 2 +
: :
: :
7 ( )ρσ 617
1 2 +
30
B.
TABLE B VARIABLES DESCRIPTIVE STATISTICS: AVERAGE MODEL WITH SAMPLE SIZE EQUAL TO 661
Variable Description Mean Std. Dev. Min. Max.
Remittances Logarithm of Monthly Remittances measured in 2001 U.S. Dollars
1.29 1.61 0 6.22
1 if Age between 21 and 30
Age of the Migrant, equal to 1 if migrant is between 21 and 30 years old.
0.36 0.46 0 1
1 if Male Gender of the Migrant, equal to 1 if migrant is a male.
0.52 0.47 0 1
1 if Education less than 4 Years
Education of the Migrant, equal to 1 if migrant’s education is less than 4 years.
0.47 0.48 0 1
1 if Working Labor Status, equal to 1 if migrant is working 0.78 0.40 0 1
1 if Emigrant Resides in D.C.
Destination of the migrant, equal to 1 if migrants live in developed countries.
0.30 0.45 0 1
1 if Years since Migration less than 4
Number of Years the migrant has been living out of Nicaragua, equal to 1 if the number of years is less than 4 years.
0.52 0.48 0 1
1 if Spouse of the Head of the Household
Relationship of the migrant to the head of the household, equal to 1 if the migrant is the spouse of the head of the household.
0.05 0.22 0 1
1 if Parent of the Head of the Household
Relationship of the migrant to the head of the household, equal to 1 if the migrant is the parent of the head of the household.
0.03 0.17 0 1
1 if Child of the Head of the Household
Relationship of the migrant to the head of the household, equal to 1 if the migrant is the child of the head of the household.
0.59 0.48 0 1
1 if Urban Residence
Resident of the migrant’s Receiving Household, equal to 1 if it resides in an urban area
0.72 0.44 0 1
1 if Education of the Head of Household is less than 4 Years
Education of the Head of the Household, equal to 1 if Head of the Household’s education is less than 4 years.
0.75 0.43 0 1
1 if Head of the Household Working
Status of the head of the Household, equal to 1 if head of the household working.
0.63 0.48 0 1
31
C.
TABLE C.1 MIGRANTS’ STRATEGIES FOR TWO HOUSEHOLDS
MIGRANTS
Migrant 2
Remit Not Remit
Migrant 1
Remit 58.0 % 12.0 %
Not Remit 7.0 % 23.0 %
Note: The sample consists of 200 migrants who belong to two migrants’ households which is around 24 percent of the total migrants’ population and 36 percent of the total multiple households’ migrants’ population. The numbers in the table consist of the number of incidence.
TABLE C.2 MIGRANTS’
STRATEGIES FOR THREE HOUSEHOLDS
MIGRANTS
Migrant 3 Remit Not Remit
Migrant 2 Migrant 2
Remit Not Remit Remit Not Remit
Migrant 1
Remit 36.6 % 4.9 % 14.6 % 12.2 %
Not Remit 7.3 % 7.3 % 7.3 % 9.8 %
Note: The sample consists of 123 migrants who belong to three migrants’ households which is around 15 percent of the total migrants’ population and 24 percent of the total multiple households’ migrants’ population. The numbers in the table consist of the number of incidence.
TABLE C.3 MIGRANTS’ STRATEGIES FOR FOUR
HOUSEHOLDS MIGRANTS
Migrant 4 Remit Not Remit
Migrant 3 Migrant 3 Remit Not Remit Remit Not Remit
Migrant 2 Migrant 2
R NR R NR R NR R NR
Migrant 1
Remit 22.2 % 0.0 % 5.6 % 0.0 % 5.6 % 0.0 % 0.0 % 11.1 %
Not Remit
11.1 % 5.6 % 0.0 % 0.0 % 0.0 % 5.5 % 0.0 % 33.3 %
Note: The sample consists of 72 migrants who belong to four migrants’ households which is around 9 percent of the total migrants’ population and 14 percent of the total multiple households’ migrants’ population. The numbers in the table consist of the number of incidence. R = Remit; NR = Not Remit.