Embed Size (px)
Citation preview
American Political Science Review, Page 1 of 16
doi:10.1017/S0003055418000023 © American Political Science Association 2018. This is an OpenAccess article, distributed under the terms of the Creative Commons Attribution licence (http://creativecommons.org/licenses/by/4.0/), whichpermits unrestricted re-use, distribution, and reproduction in any medium, provided the original work is properly cited.
Who Punishes Extremist Nominees? Candidate Ideology and TurningOut the Base in US ElectionsANDREW B. HALL Stanford UniversityDANIEL M. THOMPSON Stanford University
Political observers, campaign experts, and academics alike argue bitterly over whether it is moreimportant for a party to capture ideologically moderate swing voters or to encourage turnoutamong hardcore partisans. The behavioral literature in American politics suggests that voters are
not informed enough, and are too partisan, to be swing voters, while the institutional literature suggeststhat moderate candidates tend to perform better. We speak to this debate by examining the link betweenthe ideology of congressional candidates and the turnout of their parties’ bases in US House races, 2006–2014. Combining a regression discontinuity design in close primary races with survey and administrativedata on individual voter turnout, we find that extremist nominees—as measured by the mix of campaigncontributions they receive—suffer electorally, largely because they decrease their party’s share of turnoutin the general election, skewing the electorate towards their opponent’s party. The results help show howthe behavioral and institutional literatures can be connected. For our sample of elections, turnout appearsto be the dominant force in determining election outcomes, but it advantages ideologically moderate can-didates because extremists appear to activate the opposing party’s base more than their own.
“The key data is this, and it’s important to reemphasizeif only to shut up the useless, overpaid political consul-tants who idiotically babble about ‘moving to the center’or‘compromising with the other side’...What matters is turn-ing out our voters. That’s it. The Democrats win when wefire up and turn out our base.”
—Blog post on Daily Kos1
“Democrats cannot win elections without capturing thevotes of independent-minded swing voters.”
—Commentary in the Wall Street Journal2
INTRODUCTION
The current state of American politics, charac-terized by high degrees of legislative polariza-tion, brinksmanship, and gridlock (e.g.,McCarty,
Andrew B. Hall is an Assistant Professor in the Department ofPolitical Science at Stanford University, Stanford, CA 94305-6044([email protected]), http://www.andrewbenjaminhall.com.
Daniel M. Thompson is a Ph.D. Student in the Departmentof Political Science at Stanford University, Stanford, CA 94305-6044 ([email protected]), http://www.danmthompson.com.
For helpful discussion, the authors thank Avi Acharya, Bob Erik-son, Jim Fearon, Anthony Fowler, Stephen Pettigrew, Kevin Quinn,Ken Shotts, Brad Spahn, Danielle Thomsen, and participants of theMIT American Politics Conference and the Emory Institutions andLawmaking Conference. For data, the authors thank Shigeo Hiranoand Jim Snyder. For guidance using voter file data, the authors es-pecially thank Brad Spahn. All remaining errors are the authors’sole responsibility. Replication files are available at the AmericanPolitical Science Review Dataverse: https://doi.org/10.7910/DVN/9ZYFBX.
Received: May 18, 2017; revised: November 27, 2017; accepted:January 29, 2018.
1 http://www.dailykos.com/story/2014/11/5/1342347/-CRUSH-the-GOP-don-t-compromise-with-em-how-to-win-in-2016-and-what-not-to-do.2 http://www.wsj.com/articles/SB10001424052702304252704575155942054483252
Poole, and Rosenthal 2006), has raised new questionsabout the interplay of ideology and electoral successin US elections. The study of candidate ideology andelectoral performance in US elections can be crudelydivided into two literatures that seem fundamentally atodds with each other.On one side is what wemight callthe institutional literature, which uses election data tosuggest that there is an electoral advantage for moder-ate candidates (e.g., Ansolabehere, Snyder, and Stew-art 2001; Canes-Wrone, Brady, and Cogan 2002; Erik-son 1971; Erikson and Wright 2000; Hall 2015). Thisliterature is often associated with the idea that candi-dates must appeal to “swing voters” to win office. Onthe other side is what wemight call the behavioral liter-ature, which uses survey evidence to suggest that manyvoters are uninformed and ideologically inconsistent,casting doubt on whether swing voters are relevant orwhether they even exist at all (e.g.,Campbell et al. 1960;Converse 1964; Lenz 2012; Miller and Stokes 1963).This latter literature is often associated with the ideathat turnout among the parties’ bases determines elec-tion outcomes.3 In the strongest version of this claim,voters are rigid partisans, “campaigns consist in largepart of reminding voters of their partisan identities—‘mobilizing’ them to support their group at the polls,”and more moderate candidates do no better than moreextreme candidates because “election outcomes are es-sentially random choices among the available parties”(Achen and Bartels 2016, 311–312).This disagreement rages on in the popular press, too,
where pundits and campaign practitioners debate therelative merits of hypothetical moderate candidateswho capture swing voters or ideologically committed
3 Hill (2016) is one interesting article at the intersection of theseliteratures. The article combines administrative data on individualvoter turnout with precinct-level vote returns to estimate swing vot-ing.Under the assumptions of the article’s model, partisan turnout isestimated to determine roughly twice as much of the vote share asswing voters are.
1
Dow
nloa
ded
from
htt
ps://
ww
w.c
ambr
idge
.org
/cor
e. IP
add
ress
: 73.
15.1
99.3
6, o
n 07
Mar
201
8 at
19:
10:0
9, s
ubje
ct to
the
Cam
brid
ge C
ore
term
s of
use
, ava
ilabl
e at
htt
ps://
ww
w.c
ambr
idge
.org
/cor
e/te
rms.
htt
ps://
doi.o
rg/1
0.10
17/S
0003
0554
1800
0023
Andrew B. Hall and Daniel M. Thompson
candidates who “fire up the base.” Consider, as a re-cent example, the 2016 Democratic presidential pri-mary race between Hillary Clinton, widely thought tobe the more pragmatic and moderate candidate, andBernie Sanders, the farther left progressive candidate.4Thom Hartmann, the progressive radio host, arguedthat Sanders wouldmake a better general-election can-didate than Clinton, saying: “the truth is, Democratswin when voter turnout is high. And voter turnout ishigh when voters have real progressive candidates anda truly progressive platform to support.”5 This is a sen-timent shared by many progressives, as the colorfulDaily Kos quote in the epigraph above suggests. For-mer member of Congress Barney Frank disagreed withthis idea, penning an op-ed telling readers that ‘wishfulthinkingwon’t win theWhiteHouse.”Frank continued,“[Sanders’s] very unwillingness to be confined by exist-ing voter attitudes...is both a very valuable contributionto the democratic dialogue and an obvious bar to win-ning support from the majority of these very voters inthe near term.”6 Similar arguments have beenmade forRepublican candidates and for elections up and downthe ballot. While the Clinton–Sanders example con-cerns the presidency, an office whose elections differfundamentally from the legislative electionswe study, ithelps highlight the more general argument about turn-ing out the base versus appealing to swing voters. Al-though the argument has gone on for decades, empir-ical evidence to resolve it has been scant. Do moreextreme legislative candidates actually galvanize theirown bases, and, if so, do they actually perform betterthan moderate candidates in elections?In this article, we attempt to answer these ques-
tions, and in so doing, we help connect the behavioraland institutional literatures. In particular, we combineelection data with survey data from the CooperativeCongressional Election Study (CCES), as well as com-prehensive administrative data on voters from Catal-ist, to show that more extreme candidates do worse,electorally, in part because they decrease their party’sshare of turnout in the general election. As a result,turnout among the parties’ bases is a mechanism forthe advantage of moderate candidates rather than aphenomenon at odds with selecting candidates of cer-tain ideologies.Extremist candidates do worse, because,contrary to rhetoric, they fail to galvanize their own baseand instead encourage the opposing party’s base to turnout more, on average. Put another way, the possibilitythat voters are tribal partisans, even if true, does notimply that more moderate candidates cannot outper-form extremist candidates. In a hypothetical world ofrigid partisanship, turnout still allows elections to haveideological consequences.
4 These are only relative terms and convey no normative opinion onour part. Many do not consider Clinton’s platform to be particularlymoderate, even if less extreme than Sanders; those who agree withSanders’ positions may not think his views are “extreme” in an abso-lute sense, also.5 http://www.thomhartmann.com/blog/2016/02/if-you-want-win-go-progressive.6 http://www.politico.com/magazine/story/2015/07/why-progressives-shouldnt-support-bernie-120484.
Our results therefore suggest that the institutionaland behavioral literatures on elections are both rightand both wrong.Moderate candidates do perform bet-ter, electorally, but their success depends largely ontheir ability to encourage their partisans to turn out—or, similarly, to discourage the other party’s partisansfrom turning out. As we will show, the estimates fromour regression discontinuity design are consistent withthe possibility that the bulk of the vote-share penaltyof extremist nominees comes from changes in turnout(though our tests cannot prove whether or not thereare also swing voters at play). A key point we wantto emphasize is that these effects on turnout need notbe the result of individual voters carefully processinginformation about candidates’ positions—for example,the effects could instead be the result of purely elite-driven behavior filtered through campaigns (e.g., en-dorsements, fundraising). We will not take a stanceone way or another on whether voters are informedor rational. The key takeaway from our results is thathowever individual voters process information, theirdecision to turn out to vote is systematically relatedto whether a more extreme or more moderate can-didate is running—an observation that helps to re-vise both the institutional and behavioral literatures onAmerican elections.We also link our study to a long political economy lit-
erature on candidate ideology and turnout (Adams andMerrill 2003; Adams, Dow, and Merrill 2006; Downs1957; Glaeser, Ponzetto, and Shapiro 2005; Hinich andOrdeshook 1969; Peress 2011). We make the simplepoint that, in a typical spatial model where voters haveconcave utility (and thus convex disutility), so that theyreceive increasingly large amounts of disutility fromcandidates further and further from their ideal point,it is the opposing party’s voters who should care themost about a party nominating an extremist instead ofa moderate.While the party’s base voters may prefer amore extreme nominee, the opposing party’s base vot-ers dislike this extreme nominee more than the party’sbase likes him or her. This is even more true if we con-sider more behavioral models of voter preferences, likeloss aversion, in which case voters might especially dis-like opposing-party extremists. Our empirical resultsare broadly consistent with ideas like these. While theparty’s base may or may not turn out more in responseto a more extreme nominee, extremist nominees doseem to galvanize turnout in the opposing party.Documenting these effects empirically requires
overcoming a number of issues of omitted variablesand selection bias, as well as problems of measurement.Places where more extreme candidates win nomina-tion and stand for office in the general election aresure to vary, systematically, from places where moremoderate candidates are nominated.To address this is-sue, we implement a regression discontinuity (RD) de-sign based on close primary elections. This approachensures, under plausible assumptions, that districts inwhich a more extreme candidate barely wins nomi-nation and runs in the general election are otherwiseidentical, in expectation, to those where a more mod-erate candidate barely wins the primary and runs in the
2
Dow
nloa
ded
from
htt
ps://
ww
w.c
ambr
idge
.org
/cor
e. IP
add
ress
: 73.
15.1
99.3
6, o
n 07
Mar
201
8 at
19:
10:0
9, s
ubje
ct to
the
Cam
brid
ge C
ore
term
s of
use
, ava
ilabl
e at
htt
ps://
ww
w.c
ambr
idge
.org
/cor
e/te
rms.
htt
ps://
doi.o
rg/1
0.10
17/S
0003
0554
1800
0023
Who Punishes Extremist Nominees?
general. Although the identifying assumption of theRDhas been challenged inUSHouse general elections(Grimmer et al. 2012; Caughey and Sekhon 2011), ourtests, in line with those of Hall (2015), strongly suggestthe design is valid in US House primaries.To implement the RD, we require a way to scale
candidates. Previous studies have mainly relied onroll-call votes, which indicate the ideology of incum-bents but cannot tell us anything about candidateswho have never served in office. We follow recentwork in using the mix of campaign contributions thatcandidates receive as an indicator of ideology (e.g.,Bonica 2013, 2014; Hall 2015; Thomsen 2014, 2016).These scalings are invaluable, because they inform usnot just about incumbents but also about candidateswho have never served in office. No other measureis available for studying questions about incumbentsand challengers at scale. That said, recent work, fo-cusing primarily on the CFScore scalings from Bonica(2014), raises questions about what the scalings actu-ally measure (Hill and Huber 2017; Tausanovitch andWarshaw 2017). Tausanovitch and Warshaw (2017), inparticular, shows that CFScores do not correlate wellwith DW-NOMINATE scores—a conventional mea-sure of roll-call-based ideology for sitting legislatorsfrom Poole and Rosenthal (1985)—within party. Wetake these concerns seriously, and we address themin several ways. First, we present all of our main re-sults using the contribution-based scalings developedin Hall and Snyder (2014) and used in Hall (2015).These scalings have a simple interpretation that em-phasizes their substantive meaning irrespective of roll-call-based ideology, and they also correlate fairly wellwith DW-NOMINATE within party. Finally, we alsoshow the robustness of our results to the use of avariety of contribution-based scalings, which run thegamut from not using information about roll-call votesat all to being setup explicitly to predict roll-call-basedscalings.The remainder of the article is organized as fol-
lows. In the following section, we discuss the similari-ties and differences between the institutional and be-havioral literatures on elections and ideology, and webriefly discuss formal theories of candidate ideologyand turnout. Following that, we discuss the data weuse to study these topics empirically. In the next sec-tion, we present regression-discontinuity results thatconsistently show that extremist candidates do worse,electorally, in part because they skew general-electionturnout away from their own party.Finally,we concludeby discussing how our findings help revise and connectbehavioral and institutional studies of elections and en-hance our understanding of ideology, electoral perfor-mance, and turnout.
THEORETICAL BACKGROUND: SWINGVOTERS AND TURNING OUT THE BASE
A large literature on American political institutionsfinds that legislative candidatesmeasured to havemoremoderate positions do better electorally (e.g., An-
solabehere, Snyder, and Stewart 2001; Canes-Wrone,Brady, and Cogan 2002;Erikson andWright 2000;Hall2015). An equally large literature on American voterbehavior, however, finds that many voters know littleabout candidates’ ideologies and do not report consis-tent ideological views (e.g.,Broockman 2016;Campbellet al. 1960;Converse 1964;Lenz 2012;Miller and Stokes1963). Furthermore, in surveys, voters do not seem toexpress support for candidates based on their ideolog-ical proximity (e.g., Tausanovitch and Warshaw 2015).For this reason, the political science literature has longviewed the idea that moderates do better electorallyand the idea that individual voters are uninformed andhighly partisan as fundamentally at odds. Consider thispassage from a recent op-ed by Professors ChristopherAchen and Larry Bartels in The New York Times:
Decades of social-scientific evidence show that voting be-havior is primarily a product of inherited partisan loyalties,social identities and symbolic attachments. Over time, en-gaged citizens may construct policy preferences and ide-ologies that rationalize their choices, but those issues areseldom fundamental.That is one key reason contemporary American politics isso polarized: The electoral penalty for candidates takingextreme positions is quitemodest because voters in the po-litical center do not reliably support the candidates closestto them on the issues.7
Building off of these arguments, some scholars andcampaign practitioners have concluded that elec-tions are much more about “turning out the base”—encouraging partisans who will vote for the party toturn out and vote—than they are about altering ideo-logical positions to appeal to swing voters.8 Reviewingprecisely these kinds of arguments in 2014, but witha logic that could apply in any year, Professor LynnVavreck wrote for The New York Times that “The 2014fight is not over swing voters. It’s for partisans.”9Each of these literatures has a clear strength and a
clear weakness. The strength of the institutional ap-proach is that it speaks confidently to overall electionresults. Because these articles study actual elections,they can make clear points about which types of can-didates actually win real elections. The weakness, ofcourse, is that finding this aggregate evidence does notgive us direct information about the mechanisms un-derlying it. Although institutional scholars have beentempted to take these empirical patterns as evidencethat moderate voters sway elections, there is, to ourknowledge at least, no direct evidence for this idea.Thestrength of the behavioral literature is that it can ex-amine these mechanisms directly. The main takeaway
7 http://www.nytimes.com/2016/05/23/opinion/campaign-stops/do-sanders-supporters-favor-his-policies.html, accessed August 15,2016.8 We are focused here on understanding the links between candidateideology, turnout, and swing voters—but it is worth noting that thisdebate also relates to the electoral strategies of parties. A large liter-ature studies the strategic dynamics of parties targeting swing votersor core supporters (Cox and McCubbins 1986; Cox 2009).9 http://www.nytimes.com/2014/04/23/upshot/the-myth-of-swing-voters-in-midterm-elections.html, accessed August 15, 2016.
3
Dow
nloa
ded
from
htt
ps://
ww
w.c
ambr
idge
.org
/cor
e. IP
add
ress
: 73.
15.1
99.3
6, o
n 07
Mar
201
8 at
19:
10:0
9, s
ubje
ct to
the
Cam
brid
ge C
ore
term
s of
use
, ava
ilabl
e at
htt
ps://
ww
w.c
ambr
idge
.org
/cor
e/te
rms.
htt
ps://
doi.o
rg/1
0.10
17/S
0003
0554
1800
0023
Andrew B. Hall and Daniel M. Thompson
is that, generally speaking, many voters do not seeminformed enough to make systematically ideologicalchoices in whom they support in the voting booth. Thisforces us to revise electoral theories that depend onswing voters in important ways. The weakness to thisapproach is that it is difficult to extrapolate from sur-veys to actual elections. While many respondents maystruggle to articulate coherent positions on a survey,we do not know how the electorate as a whole does ordoes not process ideological information. Even a rela-tively small number of well-informed voters, for exam-ple, could determine most election outcomes if the lessinformed voters are relatively evenly split between thetwo parties. One aim of our study is to address theseweaknesses by combining data on election outcomeswith survey data on individual voters, so that we can at-tempt to assess both aggregate electoral outcomes andindividual-level mechanisms in a single analysis.The second point we want to make is that the main
findings in the two literatures need not be at odds withone another. Moderate candidates may perform bet-ter, electorally, even in the extreme hypothetical whereswing voters do not exist, and even if most or all vot-ers are not well informed if turnout is a mechanismfor the support of moderate candidates. In particular,extremist candidates could turn off their own party’svoters from turning out to vote and/or galvanize vot-ers in the opposing party to turn out and vote. Al-though voter attention is one plausible mechanism foreffects of this kind, this idea does not depend on vot-ers being highly informed and learning the ideology ofeach party’s candidate—perhaps, for example, a partycoordinates more get-out-the-vote campaigning whenit has nominated a more moderate candidate versuswhen it has nominated an extremist. Perhaps newspa-pers cover moderates more favorably than extremists,inducing supporters to turn out more—or, conversely,perhaps newspapers slam extremists, exciting votersin the opposition party. There are many possible rea-sons that candidates of varying ideology could affectturnout and, as a result, could induce electoral effectseven if there are few or no swing voters. As a firstcontribution, our focus is on understanding the con-sequences of extreme versus moderate candidates inthe general election rather than on identifying whichof these mechanisms is most responsible for thoseconsequences.To explain the idea of how candidates of varying ide-
ology can affect turnout in more detail, we turn nowto considering formal theoretic ideas about candidateideology and voter turnout.
Formal Theories of Turnout
Although the formal theory literature on electionslargely builds on the median-voter theorem’s basicfoundation, a significant literature studies the ques-tion of candidate ideology and turnout directly (e.g.,Adams and Merrill 2003; Adams, Dow, and Merrill2006; Downs 1957; Glaeser, Ponzetto, and Shapiro2005; Hinich and Ordeshook 1969; Hortala-Vallve and
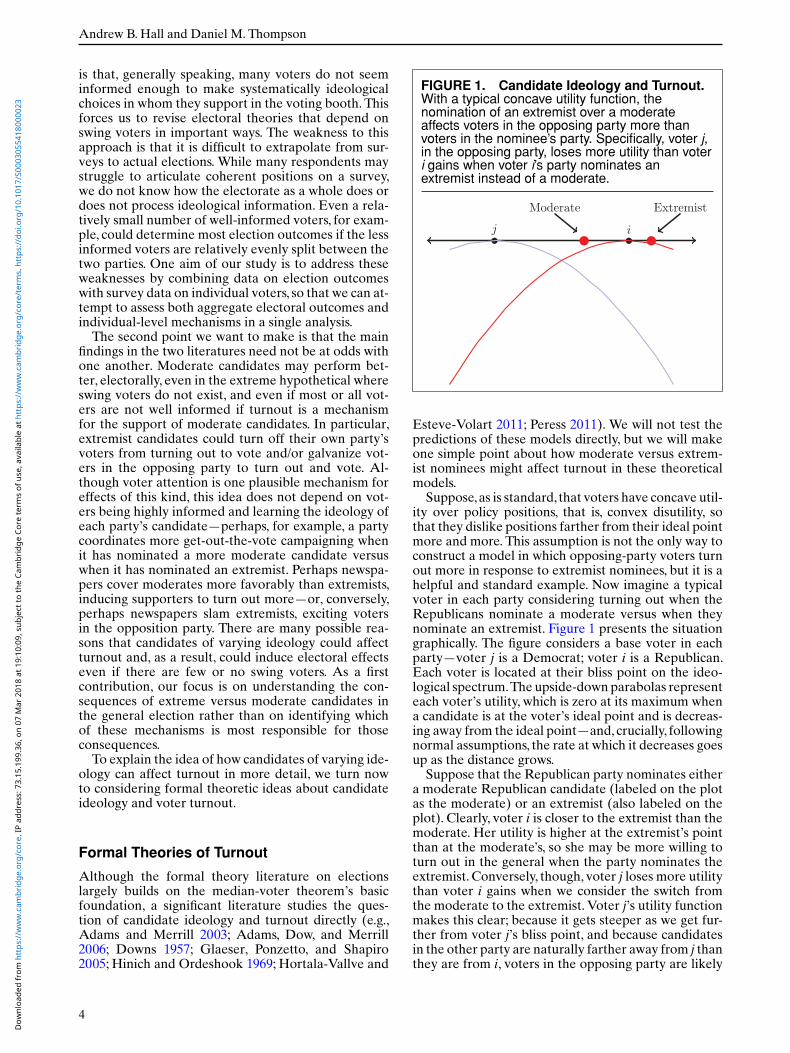
FIGURE 1. Candidate Ideology and Turnout.With a typical concave utility function, thenomination of an extremist over a moderateaffects voters in the opposing party more thanvoters in the nominee’s party. Specifically, voter j,in the opposing party, loses more utility than voteri gains when voter i’s party nominates anextremist instead of a moderate.
ExtremistModerate
j i
Esteve-Volart 2011; Peress 2011). We will not test thepredictions of these models directly, but we will makeone simple point about how moderate versus extrem-ist nominees might affect turnout in these theoreticalmodels.Suppose,as is standard, that voters have concave util-
ity over policy positions, that is, convex disutility, sothat they dislike positions farther from their ideal pointmore and more. This assumption is not the only way toconstruct a model in which opposing-party voters turnout more in response to extremist nominees, but it is ahelpful and standard example. Now imagine a typicalvoter in each party considering turning out when theRepublicans nominate a moderate versus when theynominate an extremist. Figure 1 presents the situationgraphically. The figure considers a base voter in eachparty—voter j is a Democrat; voter i is a Republican.Each voter is located at their bliss point on the ideo-logical spectrum.The upside-downparabolas representeach voter’s utility, which is zero at its maximum whena candidate is at the voter’s ideal point and is decreas-ing away from the ideal point—and, crucially, followingnormal assumptions, the rate at which it decreases goesup as the distance grows.Suppose that the Republican party nominates either
a moderate Republican candidate (labeled on the plotas the moderate) or an extremist (also labeled on theplot). Clearly, voter i is closer to the extremist than themoderate. Her utility is higher at the extremist’s pointthan at the moderate’s, so she may be more willing toturn out in the general when the party nominates theextremist.Conversely, though, voter j loses more utilitythan voter i gains when we consider the switch fromthe moderate to the extremist. Voter j’s utility functionmakes this clear; because it gets steeper as we get fur-ther from voter j’s bliss point, and because candidatesin the other party are naturally farther away from j thanthey are from i, voters in the opposing party are likely
4
Dow
nloa
ded
from
htt
ps://
ww
w.c
ambr
idge
.org
/cor
e. IP
add
ress
: 73.
15.1
99.3
6, o
n 07
Mar
201
8 at
19:
10:0
9, s
ubje
ct to
the
Cam
brid
ge C
ore
term
s of
use
, ava
ilabl
e at
htt
ps://
ww
w.c
ambr
idge
.org
/cor
e/te
rms.
htt
ps://
doi.o
rg/1
0.10
17/S
0003
0554
1800
0023
Who Punishes Extremist Nominees?
to be more horrified by an extremist nominee than theparty’s own base is pleased by one. If this fear drivesvoter turnout, then extremists will galvanize voters inthe opposing partymore than those in their own party’sbase.Another reason extremist nominees may galvanize
turnout in the opposing party has to do with “ratio-nal inattention,” an area of growing interest in politi-cal economy. Matejka and Tabellini (2017), for exam-ple, offers a model in which rational, forward-lookingvoters consider whether to invest effort in becominginformed about candidates. A key factor in their de-cision is what is at stake in the election—that is, it ismore valuable for voters to be informed if the potentialpolicy outcomes induced by the election are more con-sequential to them.Although it is not a specific predic-tion put forward in the article, opposing-party extrem-ist voters may have a particularly strong incentive tobecome informed when the opposing party nominatesan extremist.We suspect that rationally inattentive vot-ers are a promising recent literature to which our em-pirical tests will be relevant.The spatial model massively abstracts from the ac-
tual electoral process.As we have presented it, it omitsall of the nonideological factors that candidates pos-sess, as well as the effects of media, campaigns, andmore. We have also assumed that utility functionsare quadratic rather than, for example, Gaussian orasymmetric as in prospect theory (Carroll et al. 2013;Quattrone and Tversky 1988;Brady andAnsolabehere1989).10 Further, some research questions the ability ofvoters to process information about candidate ideol-ogy directly (e.g., Ahler, Citrin, and Lenz 2016; Tau-sanovitch andWarshaw 2013), leaving the task of trans-lating ideology into voter behavior to elites or factions(Snyder and Ting 2002), campaigns (Franklin 1991), orsome other mechanism. We do not claim our simplesketch captures all of these possibilities, but it helps il-lustrate the simple point that, while extremists mightgalvanize their own base, they could just as easily, ifnot more easily, galvanize voters in the opposing party.Having laid this idea out, we now turn to our empiricalanalyses of candidate ideology, electoral outcomes, andturnout.
DATA ON ELECTIONS, IDEOLOGY, ANDTURNOUT IN THE US HOUSE
To investigate these topics, we combine three maindatasets. The first is a dataset containing all US Houseprimary and general elections, 1980–2014, compiledfrom primary sources for a series of articles includingAnsolabehere et al. (2007) and extended to later yearsby the same authors.The second dataset comes from the CCES
(Schaffner and Ansolabehere 2015) and measurespartisan turnout in US House general elections for
10 The illustrative model produces roughly the same insight withquadratic loss as with prospect theory. The same effects can be re-covered if voters have Gaussian loss functions, but the location ofthe voter and candidates matters more in this case.
the years 2006–2014. For each respondent in theCCES, we rely on the validated turnout indicatorrather than the self-reported turnout. For this variable,each respondent’s turnout status is validated usingadministrative data compiled by Catalist. We defineDemocrats to be any respondent who reports identify-ing with the Democratic party in the seven-point partyidentification item, including strong Democrats, notvery strong, and leaners, and we define Republicansanalogously. This choice is consistent with the findingthat leaners and weak partisans behave in nearlyidentical ways (Abramowitz 2012; Keith et al. 1992;Pew Research Center 2014).11 We can then computetwo types of turnout rates from the CCES data: theshare of validated voters who identify as Democratsand the share of respondents who turn out brokenup by party. This first turnout share variable tells uswhether the electorate in the district skews towardsone party or another in a given election; the secondtells us whether members of a given party turnedout more or less than usual. For example, imagine adistrict in which 250 Democrats and 250 Republicansare sampled, and 100 Democrats and 200 Republicanshave validated turnout. In this district, the Democraticshare of validated votes is 100/(100+200) = 33%, theDemocratic turnout rate is 100/250 = 40%, and theRepublican turnout rate is 200/250 = 80%.
Response bias from the fact that taking surveys likethe CCES is voluntary is certainly a concern. Indeed,validated turnout rates in the CCES are substantiallyabove the population turnout rate (Ansolabehere andHersh 2012). To attempt to account for these kinds ofissues, we do two things. First, we only make compar-isons across CCES respondents (e.g., turnout for Re-publicans versus for Democrats in the same race) todifference out the fixed part of this bias. Second, andmore importantly, we replicate our main results usingCatalist voter-file data, directly. This alternative datacontains full voter files, removing all response bias (al-though it has other, unrelated, issues that we discussbelow).We find extremely similar point estimates usingthis data, suggesting that survey response bias does notaffect our conclusions.The third dataset contains the ideological scalings
of congressional candidates and comes from Hall andSnyder (2014). The Hall–Snyder scalings are createdin two stages. First, donors are given an imputed DW-NOMINATE score (hereafter, Nominate score) basedon the roll-call scalings of the incumbents towhom theydonate. Donors with more positive scalings are thusdonors that donate more to farther right incumbents;donors with more negative scalings donate more to farleft incumbents. In the second stage, candidates’ scoresare imputed based on the donors from whom they re-ceived contributions. A farther left candidate, in theHall–Snyder scaling, is one who receives more dona-tions from donors who tend to support farther left in-cumbents, for example.
11 In the Appendix, we report all relevant results using only strongand weak partisans and find that the estimates are consistent withour main findings.
5
Dow
nloa
ded
from
htt
ps://
ww
w.c
ambr
idge
.org
/cor
e. IP
add
ress
: 73.
15.1
99.3
6, o
n 07
Mar
201
8 at
19:
10:0
9, s
ubje
ct to
the
Cam
brid
ge C
ore
term
s of
use
, ava
ilabl
e at
htt
ps://
ww
w.c
ambr
idge
.org
/cor
e/te
rms.
htt
ps://
doi.o
rg/1
0.10
17/S
0003
0554
1800
0023
Andrew B. Hall and Daniel M. Thompson
Details on how we cleaned and merged thesedatasets can be found in the Appendix.
Considering Issues with Contribution-BasedCandidate Scalings
Recent literature has raised questions about what ex-actly contribution-based scalings reveal about candi-date positions.12 In particular, Tausanovitch and War-shaw (2017) shows that the CFScores developed inBonica (2014) do not correlate well with estimates ofcandidate ideology built from roll-call votes (like theNominate scalings from Poole and Rosenthal (1985)).The most important point for us to make is that theHall–Snyder scalings we use actually correlate fairlywell with Nominate within party; as Hall and Snyder(2014) shows, the Hall–Snyder scores correlate at 0.61with Nominate scores for Democrats and at 0.53 forRepublican Nominate scores. Since the Hall–Snyderscalings are built off of Nominate (though not intendedto predict them, necessarily), it is not surprising thatthey correlate with itmore highly thanCFScores,whichuse only the candidate-donor matrix to extract a di-mension of ideology.This raises a broader point about scaling candidates.
No scaling technique can isolate ideology, since it issuch a complicated object with different meanings indifferent contexts. Roll-call votes indicate one impor-tant aspect of the concept, the part related to the in-cumbent’s formal behavior in the legislature.13 Some-times, like when we are specifically studying roll-callvotes—one of the most important representative actsa legislator performs—it makes sense to focus on mea-sures that explicitly attempt to predict roll-call votesfor candidates who have not cast them. In other con-texts, the goal might not be specifically to predict roll-call votes. When voters, elites, and the media considerthe ideology of potential representatives, theymay con-sider a variety of factors. How will a potential candi-date shape legislation? What issues will she prioritize?Whose voices will she listen to? These activities includeroll-call voting but also many other items that are dis-tinct from roll-call voting. The mix of campaign con-tributions a candidate receives may tell us somethingabout who is extreme and who is moderate—in theprecise sense of what kinds of donors her portfolio isweighted towards—that is valuable and somewhat dis-tinct from roll-call voting. This is why it is not clearthat the goal of contribution-based scalings should beto perfectly recover the Nominate scaling.This is clear-est to us when considering the Hall–Snyder scalings.As described above, these scalings convey substantiveinformation on whether they correlate with Nominatescores. It is coherent to talk about an extremist—a
12 Hill and Huber (2017) show a low correlation between individualdonor’s issue positions and their CFScore scalings. Although this isan important issue, since we only use candidate-level scalings ratherthan donor scalings, we do not focus on this critique here.13 In some cases, we may be interested in ideology as represented byroll-call vote behavior on high stakes votes or for some other set ofvotes (Clinton 2006).
candidate who raises most of his of her money fromdonors who tend to donate to extreme members of thelegislature—in the context of these scalings.That being said, it is important to understand
whether our results depend on our choice of scalingmethod and the degree to which it accords with Nom-inate scores. After presenting our results using Hall–Snyder scores, which have a medium correlation withroll-call scores within party,we then present our resultswith three other possible scalings: CFScores and Dy-namic CFScores,which have very low correlations withNominate within party, and DW-DIME scores, whichare constructed to be as highly correlated with Nomi-nate within party as possible. Although these alterna-tive scalings have some problems for our design, be-cause they use posttreatment contributions, we thinkthey provide a useful range of estimates across therange of within-party correlation with roll-call-basedscores. As we show, we find results that are similar inmagnitude across all the scalings. In the end, our re-sults do not seem to depend on whether we use Nomi-nate scores as the ground truth for predicting candidateideology.
EFFECTS OF EXTREMIST NOMINEES ONTURNOUT: RD EVIDENCE
Domore extreme candidates do worse in general elec-tions? To isolate the effect of extremists on general-election turnout, we follow Hall (2015) in focusing onclose primary elections between a more extreme can-didate and a more moderate one. Districts that nomi-nate more or less extreme candidates will differ fromone another in general. However, the set of districtswhere an extreme candidate barely wins or barely losesa close primary race to a more moderate candidate willbe otherwise identical, on average.Consider again the rhetoric concerningmoremoder-
ate versus more extreme primary candidates. We wantto evaluate the consequences of nominating an extrem-ist instead of a more moderate candidate in the gen-eral election. Is it true that extremists increase turnoutamong the base? Or is it the case that more moder-ate candidates successfully secure swing voters? Moremoderate and more extreme candidates surely differfrom each other in other ways beyond ideology, butby systematically studying these types of choices, wecan learn about the electoral and representational con-sequences of voters’ decision to nominate more ex-treme ormoremoderate candidates,whatever themyr-iad mechanisms underlying these consequences.Whilethe RD estimates the effect of a “bundled” treatment,the bundle of all candidate characteristics correlatedwith being an extremist, these are precisely the bundlesvoters are constrained to choose between, and thus thequantity estimated is directly relevant.As this discussion makes clear, the goal is not
to isolate the “causal effect” of candidate positions,themselves. In fact, it is not even clear that thereis such a thing as a causal effect of candidate posi-tions. Like gender or race, ideology is probably a deep
6
Dow
nloa
ded
from
htt
ps://
ww
w.c
ambr
idge
.org
/cor
e. IP
add
ress
: 73.
15.1
99.3
6, o
n 07
Mar
201
8 at
19:
10:0
9, s
ubje
ct to
the
Cam
brid
ge C
ore
term
s of
use
, ava
ilabl
e at
htt
ps://
ww
w.c
ambr
idge
.org
/cor
e/te
rms.
htt
ps://
doi.o
rg/1
0.10
17/S
0003
0554
1800
0023
Who Punishes Extremist Nominees?
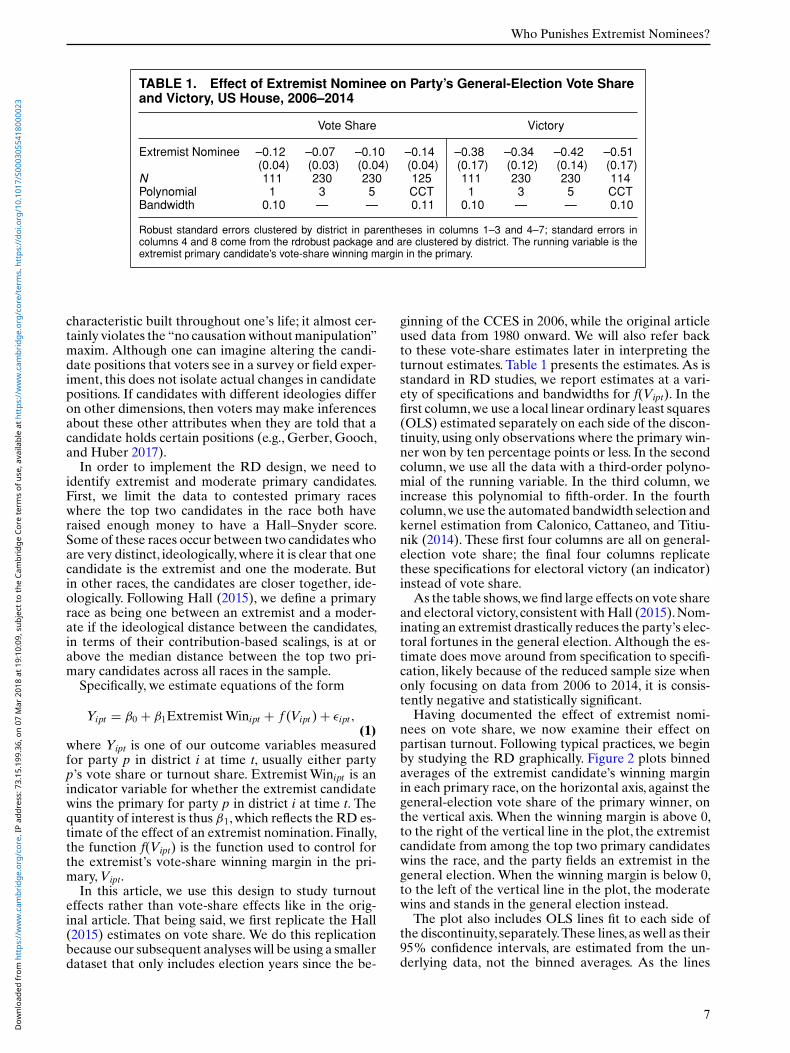
TABLE 1. Effect of Extremist Nominee on Party’s General-Election Vote Shareand Victory, US House, 2006–2014
Vote Share Victory
Extremist Nominee –0.12 –0.07 –0.10 –0.14 –0.38 –0.34 –0.42 –0.51(0.04) (0.03) (0.04) (0.04) (0.17) (0.12) (0.14) (0.17)
N 111 230 230 125 111 230 230 114Polynomial 1 3 5 CCT 1 3 5 CCTBandwidth 0.10 — — 0.11 0.10 — — 0.10
Robust standard errors clustered by district in parentheses in columns 1–3 and 4–7; standard errors incolumns 4 and 8 come from the rdrobust package and are clustered by district. The running variable is theextremist primary candidate’s vote-share winning margin in the primary.
characteristic built throughout one’s life; it almost cer-tainly violates the “no causationwithoutmanipulation”maxim. Although one can imagine altering the candi-date positions that voters see in a survey or field exper-iment, this does not isolate actual changes in candidatepositions. If candidates with different ideologies differon other dimensions, then voters may make inferencesabout these other attributes when they are told that acandidate holds certain positions (e.g., Gerber, Gooch,and Huber 2017).
In order to implement the RD design, we need toidentify extremist and moderate primary candidates.First, we limit the data to contested primary raceswhere the top two candidates in the race both haveraised enough money to have a Hall–Snyder score.Some of these races occur between two candidates whoare very distinct, ideologically,where it is clear that onecandidate is the extremist and one the moderate. Butin other races, the candidates are closer together, ide-ologically. Following Hall (2015), we define a primaryrace as being one between an extremist and a moder-ate if the ideological distance between the candidates,in terms of their contribution-based scalings, is at orabove the median distance between the top two pri-mary candidates across all races in the sample.Specifically, we estimate equations of the form
Yipt = β0 + β1ExtremistWinipt + f (Vipt ) + εipt,(1)
where Yipt is one of our outcome variables measuredfor party p in district i at time t, usually either partyp’s vote share or turnout share. ExtremistWinipt is anindicator variable for whether the extremist candidatewins the primary for party p in district i at time t. Thequantity of interest is thus β1,which reflects the RD es-timate of the effect of an extremist nomination. Finally,the function f(Vipt) is the function used to control forthe extremist’s vote-share winning margin in the pri-mary,Vipt.In this article, we use this design to study turnout
effects rather than vote-share effects like in the orig-inal article. That being said, we first replicate the Hall(2015) estimates on vote share. We do this replicationbecause our subsequent analyses will be using a smallerdataset that only includes election years since the be-
ginning of the CCES in 2006, while the original articleused data from 1980 onward. We will also refer backto these vote-share estimates later in interpreting theturnout estimates. Table 1 presents the estimates. As isstandard in RD studies, we report estimates at a vari-ety of specifications and bandwidths for f(Vipt). In thefirst column,we use a local linear ordinary least squares(OLS) estimated separately on each side of the discon-tinuity, using only observations where the primary win-ner won by ten percentage points or less. In the secondcolumn, we use all the data with a third-order polyno-mial of the running variable. In the third column, weincrease this polynomial to fifth-order. In the fourthcolumn,we use the automated bandwidth selection andkernel estimation from Calonico, Cattaneo, and Titiu-nik (2014). These first four columns are all on general-election vote share; the final four columns replicatethese specifications for electoral victory (an indicator)instead of vote share.As the table shows,we find large effects on vote share
and electoral victory, consistent withHall (2015).Nom-inating an extremist drastically reduces the party’s elec-toral fortunes in the general election. Although the es-timate does move around from specification to specifi-cation, likely because of the reduced sample size whenonly focusing on data from 2006 to 2014, it is consis-tently negative and statistically significant.Having documented the effect of extremist nomi-
nees on vote share, we now examine their effect onpartisan turnout. Following typical practices, we beginby studying the RD graphically. Figure 2 plots binnedaverages of the extremist candidate’s winning marginin each primary race, on the horizontal axis, against thegeneral-election vote share of the primary winner, onthe vertical axis. When the winning margin is above 0,to the right of the vertical line in the plot, the extremistcandidate from among the top two primary candidateswins the race, and the party fields an extremist in thegeneral election. When the winning margin is below 0,to the left of the vertical line in the plot, the moderatewins and stands in the general election instead.The plot also includes OLS lines fit to each side of
the discontinuity, separately.These lines,as well as their95% confidence intervals, are estimated from the un-derlying data, not the binned averages. As the lines
7
Dow
nloa
ded
from
htt
ps://
ww
w.c
ambr
idge
.org
/cor
e. IP
add
ress
: 73.
15.1
99.3
6, o
n 07
Mar
201
8 at
19:
10:0
9, s
ubje
ct to
the
Cam
brid
ge C
ore
term
s of
use
, ava
ilabl
e at
htt
ps://
ww
w.c
ambr
idge
.org
/cor
e/te
rms.
htt
ps://
doi.o
rg/1
0.10
17/S
0003
0554
1800
0023
Andrew B. Hall and Daniel M. Thompson
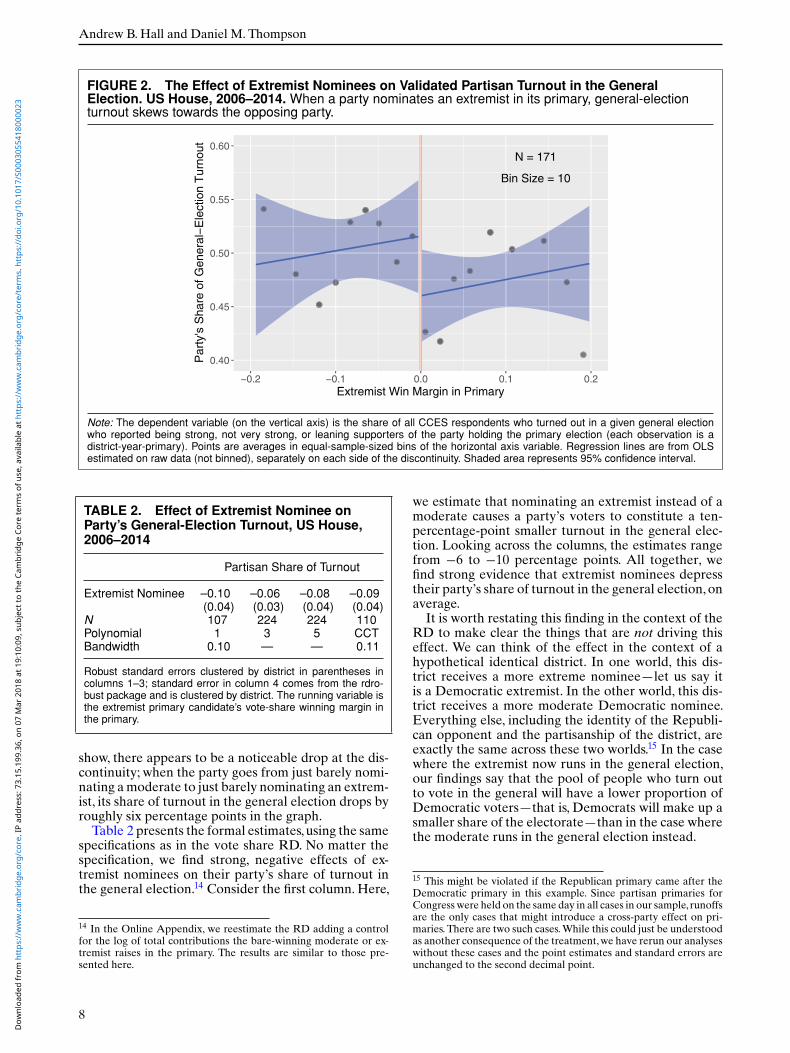
FIGURE 2. The Effect of Extremist Nominees on Validated Partisan Turnout in the GeneralElection. US House, 2006–2014. When a party nominates an extremist in its primary, general-electionturnout skews towards the opposing party.
N = 171
Bin Size = 10
0.40
0.45
0.50
0.55
0.60
−0.2 −0.1 0.0 0.1 0.2Extremist Win Margin in Primary
Par
ty's
Sha
re o
f Gen
eral
−E
lect
ion
Tur
nout
Note: The dependent variable (on the vertical axis) is the share of all CCES respondents who turned out in a given general electionwho reported being strong, not very strong, or leaning supporters of the party holding the primary election (each observation is adistrict-year-primary). Points are averages in equal-sample-sized bins of the horizontal axis variable. Regression lines are from OLSestimated on raw data (not binned), separately on each side of the discontinuity. Shaded area represents 95% confidence interval.
TABLE 2. Effect of Extremist Nominee onParty’s General-Election Turnout, US House,2006–2014
Partisan Share of Turnout
Extremist Nominee –0.10 –0.06 –0.08 –0.09(0.04) (0.03) (0.04) (0.04)
N 107 224 224 110Polynomial 1 3 5 CCTBandwidth 0.10 — — 0.11
Robust standard errors clustered by district in parentheses incolumns 1–3; standard error in column 4 comes from the rdro-bust package and is clustered by district. The running variable isthe extremist primary candidate’s vote-share winning margin inthe primary.
show, there appears to be a noticeable drop at the dis-continuity; when the party goes from just barely nomi-nating amoderate to just barely nominating an extrem-ist, its share of turnout in the general election drops byroughly six percentage points in the graph.Table 2 presents the formal estimates,using the same
specifications as in the vote share RD. No matter thespecification, we find strong, negative effects of ex-tremist nominees on their party’s share of turnout inthe general election.14 Consider the first column.Here,
14 In the Online Appendix, we reestimate the RD adding a controlfor the log of total contributions the bare-winning moderate or ex-tremist raises in the primary. The results are similar to those pre-sented here.
we estimate that nominating an extremist instead of amoderate causes a party’s voters to constitute a ten-percentage-point smaller turnout in the general elec-tion. Looking across the columns, the estimates rangefrom −6 to −10 percentage points. All together, wefind strong evidence that extremist nominees depresstheir party’s share of turnout in the general election,onaverage.It is worth restating this finding in the context of the
RD to make clear the things that are not driving thiseffect. We can think of the effect in the context of ahypothetical identical district. In one world, this dis-trict receives a more extreme nominee—let us say itis a Democratic extremist. In the other world, this dis-trict receives a more moderate Democratic nominee.Everything else, including the identity of the Republi-can opponent and the partisanship of the district, areexactly the same across these two worlds.15 In the casewhere the extremist now runs in the general election,our findings say that the pool of people who turn outto vote in the general will have a lower proportion ofDemocratic voters—that is, Democrats will make up asmaller share of the electorate—than in the case wherethe moderate runs in the general election instead.
15 This might be violated if the Republican primary came after theDemocratic primary in this example. Since partisan primaries forCongress were held on the same day in all cases in our sample, runoffsare the only cases that might introduce a cross-party effect on pri-maries. There are two such cases.While this could just be understoodas another consequence of the treatment,we have rerun our analyseswithout these cases and the point estimates and standard errors areunchanged to the second decimal point.
8
Dow
nloa
ded
from
htt
ps://
ww
w.c
ambr
idge
.org
/cor
e. IP
add
ress
: 73.
15.1
99.3
6, o
n 07
Mar
201
8 at
19:
10:0
9, s
ubje
ct to
the
Cam
brid
ge C
ore
term
s of
use
, ava
ilabl
e at
htt
ps://
ww
w.c
ambr
idge
.org
/cor
e/te
rms.
htt
ps://
doi.o
rg/1
0.10
17/S
0003
0554
1800
0023
Who Punishes Extremist Nominees?
These effects are substantial, and we might won-der how simply changing the identity of a US Housenominee could alter turnout so much. Below, we offersome analyses on possible mechanisms, and we suggestthat campaigning effects—the ways moderate nomi-nees run their general-election campaigns and the sup-port they get from party elites—probably drive someof the effect. Consistent with this possibility, our ef-fect estimates are quite similar to the estimates of theaggregated effects of presidential campaigns on localturnout.While individual get-out-the-vote (GOTV) in-terventions only seem to affect turnout by roughly apercentage point, on average (Green, McGrath, andAronow 2013), Enos and Fowler (2016) estimates thatthe stacked effects of many such interventions overthe course of a presidential campaign causes approx-imately an eight-percentage-point increase in turnout,squarely in the range of our estimates.Additionally, our own analyses suggest that House-
specific features of the electoral landscape can alterturnout more than might be expected if one thinksof turnout as mainly driven by presidential elections.To show this, in the Online Appendix we use data ondistrict-level House vote from 1980 to 2016.We use thewinning margin in the race to predict total votes cast.We include district and year fixed effects to accountfor the possibility that some districts and some electionyears have both higher turnout and more competitiveraces. Within districts, when a House race is morecompetitive, more people turn out, even relative toaverage turnout across the country in that year. Thisholds even when we only estimate the regressionwith presidential election years, and when we zoomup only on recent elections. The relationship is large,too. For example, using only the presidential elections2004, 2008, 2012, and 2016, we estimate that a ten-percentage-point increase in the House election winmargin is associated with roughly a seven-percentage-point reduction in total turnout, relative to turnout ina hypothetical tied race, on average (this associationis larger if we include earlier presidential elections,too.) These are substantial shifts in turnout that arenot driven by presidential voting.In interpreting our effects, we should also keep in
mind that the underlying “intervention” we are study-ing, changing the identity of a party’s nominee froma moderate to an extremist, is quite powerful, even ifwe are studying House rather than presidential elec-tions. GOTV effects are estimated conditional on theidentity of the candidates in the race, while the effectswe estimate here change who the candidate is. Sincecandidates appeal to voters in different ways, and rundifferent campaigns, it is plausible that our design couldestimate turnout effects that are much larger than theeffects of a single GOTV intervention.
Validating the RD’s Identifying Assumption
For the RD results above to be valid, and not con-founded by unobserved differences in the potentialoutcomes of the districts that nominate extremists ver-sus those that nominate moderates, it must be the case
that candidates cannot “sort” across the discontinuity.Past research has raised questions about the validity ofthis assumption in US House general elections, offer-ing evidence that candidates who just barely win differin observable ways (most notably, in terms of incum-bency status) from those that barely lose (Grimmeret al. 2012; Caughey and Sekhon 2011; Snyder 2005).However, Eggers et al. (2015) presents evidence thatthese concerns do not typically apply to most electoralRD designs, finding no evidence of such sorting in anyother electoral case.16 Hall (2015), using the same closeprimaries RD design as the present study, finds no evi-dence of sorting, either. Following these studies, in theOnline Appendix we present balance tests that suggestthere is no sorting in close US House primary elec-tions. Specifically, we reestimate the RD specificationsabove but using lagged turnout share as the dependentvariable (since this is our main outcome variable of in-terest). We find no evidence that treated and controldistricts differ from each other, on average, in terms oflagged turnout share.17
Replicating the RD with Administrative Dataon Turnout
The CCES data are useful because they provide awealth of additional information about individual vot-ers, such as their self-reported ideology and parti-sanship, that we will exploit below. Before doing so,though, we need to make sure that our results are notdriven by some of the undesirable aspects of the CCESsample. In particular, we might worry that the set ofpeople who are willing to answer an exhaustive sur-vey about politics are especially engaged individuals.Effects documented on this unusual sample of peoplemay not generalize to the whole electorate, especiallysince the number of voters per district in the CCESsample is not particularly large.To address this issue, we now reestimate the RD but
using data on turnout by party from Catalist, which as-sembles voter files for all 50 states.We estimate turnoutby party for 2014 using a 1% random sample of theCatalist database drawn in August 2015; for 2012 usinga 1% random sample of the Catalist database drawnin September 2013; and for 2006 through 2010 using a1% random sample drawn in November 2011. A fewimportant peculiarities of the samples bear mention-ing. First, both samples are random samples of regis-tered voters in a given state. This means that voterswho move across state borders are overrepresented inour data.The 2013 sample includes all observations forany sampled individual, so we can reweight the turnoutstatistics to remove this bias for the 2012 estimates, but
16 For further discussion of these issues, also see de la Cuesta andImai (2016), Erikson and Rader (2013), and Skovron and Titiunik(2015).17 Generally, researchers present balance tests on additional vari-ables in addition to the lagged outcome variable (although this isobviously the most important to show). Because Hall (2015) alreadypresents an exhaustive set of balance tests using the same data andsame design, finding no evidence of imbalance, we do not do so here.
9
Dow
nloa
ded
from
htt
ps://
ww
w.c
ambr
idge
.org
/cor
e. IP
add
ress
: 73.
15.1
99.3
6, o
n 07
Mar
201
8 at
19:
10:0
9, s
ubje
ct to
the
Cam
brid
ge C
ore
term
s of
use
, ava
ilabl
e at
htt
ps://
ww
w.c
ambr
idge
.org
/cor
e/te
rms.
htt
ps://
doi.o
rg/1
0.10
17/S
0003
0554
1800
0023
Andrew B. Hall and Daniel M. Thompson
TABLE 3. Effect of Extremist Nominee onParty’s General-Election Turnout, US House,2006–2014
Partisan Share of Turnout(Catalist)
Extremist Nominee –0.09 –0.05 –0.08 –0.12(0.05) (0.04) (0.05) (0.06)
N 110 227 227 101Polynomial 1 3 5 CCTBandwidth 0.10 — — 0.09
Robust standard errors clustered by district in parentheses incolumns 1–3; standard error in column 4 comes from the rdro-bust package and is clustered by district. The running variable isthe extremist primary candidate’s vote share winning margin inthe primary.
we are unable to use this technique in earlier years.Sec-ond,20 states do not include party information as a partof their voter registration process. For these states, weuse a modeled Democratic party propensity variablethat Catalist constructed to classify registrants in thesestates as Republicans andDemocrats.Last,Catalist be-gan gathering voter files between 2006 and 2008, sosome voters who moved between 2006 and 2008 maybe missing in the 2006 analysis.Table 3 presents the results. Although the estimates
are noisier, probably due to some of the data issues dis-cussed above,we obtain very similar estimateswhenweuse the full voter file instead of the CCES sample.
RD Results Similar across Possible ScalingTechniques
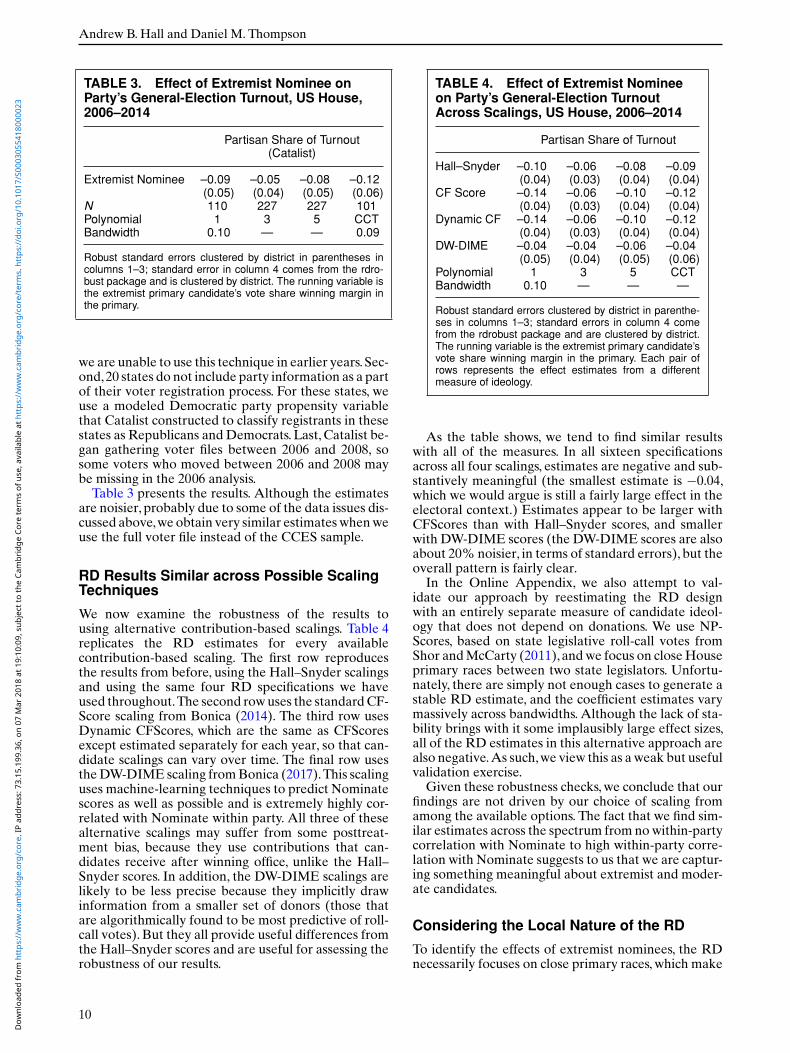
We now examine the robustness of the results tousing alternative contribution-based scalings. Table 4replicates the RD estimates for every availablecontribution-based scaling. The first row reproducesthe results from before, using the Hall–Snyder scalingsand using the same four RD specifications we haveused throughout.The second rowuses the standardCF-Score scaling from Bonica (2014). The third row usesDynamic CFScores, which are the same as CFScoresexcept estimated separately for each year, so that can-didate scalings can vary over time. The final row usestheDW-DIME scaling fromBonica (2017).This scalinguses machine-learning techniques to predict Nominatescores as well as possible and is extremely highly cor-related with Nominate within party. All three of thesealternative scalings may suffer from some posttreat-ment bias, because they use contributions that can-didates receive after winning office, unlike the Hall–Snyder scores. In addition, the DW-DIME scalings arelikely to be less precise because they implicitly drawinformation from a smaller set of donors (those thatare algorithmically found to be most predictive of roll-call votes). But they all provide useful differences fromthe Hall–Snyder scores and are useful for assessing therobustness of our results.
TABLE 4. Effect of Extremist Nomineeon Party’s General-Election TurnoutAcross Scalings, US House, 2006–2014
Partisan Share of Turnout
Hall–Snyder –0.10 –0.06 –0.08 –0.09(0.04) (0.03) (0.04) (0.04)
CF Score –0.14 –0.06 –0.10 –0.12(0.04) (0.03) (0.04) (0.04)
Dynamic CF –0.14 –0.06 –0.10 –0.12(0.04) (0.03) (0.04) (0.04)
DW-DIME –0.04 –0.04 –0.06 –0.04(0.05) (0.04) (0.05) (0.06)
Polynomial 1 3 5 CCTBandwidth 0.10 — — —
Robust standard errors clustered by district in parenthe-ses in columns 1–3; standard errors in column 4 comefrom the rdrobust package and are clustered by district.The running variable is the extremist primary candidate’svote share winning margin in the primary. Each pair ofrows represents the effect estimates from a differentmeasure of ideology.
As the table shows, we tend to find similar resultswith all of the measures. In all sixteen specificationsacross all four scalings, estimates are negative and sub-stantively meaningful (the smallest estimate is −0.04,which we would argue is still a fairly large effect in theelectoral context.) Estimates appear to be larger withCFScores than with Hall–Snyder scores, and smallerwith DW-DIME scores (the DW-DIME scores are alsoabout 20% noisier, in terms of standard errors), but theoverall pattern is fairly clear.In the Online Appendix, we also attempt to val-
idate our approach by reestimating the RD designwith an entirely separate measure of candidate ideol-ogy that does not depend on donations. We use NP-Scores, based on state legislative roll-call votes fromShor andMcCarty (2011), andwe focus on closeHouseprimary races between two state legislators. Unfortu-nately, there are simply not enough cases to generate astable RD estimate, and the coefficient estimates varymassively across bandwidths. Although the lack of sta-bility brings with it some implausibly large effect sizes,all of the RD estimates in this alternative approach arealso negative.As such,we view this as a weak but usefulvalidation exercise.Given these robustness checks,we conclude that our
findings are not driven by our choice of scaling fromamong the available options. The fact that we find sim-ilar estimates across the spectrum from nowithin-partycorrelation with Nominate to high within-party corre-lation with Nominate suggests to us that we are captur-ing something meaningful about extremist and moder-ate candidates.
Considering the Local Nature of the RD
To identify the effects of extremist nominees, the RDnecessarily focuses on close primary races, which make
10
Dow
nloa
ded
from
htt
ps://
ww
w.c
ambr
idge
.org
/cor
e. IP
add
ress
: 73.
15.1
99.3
6, o
n 07
Mar
201
8 at
19:
10:0
9, s
ubje
ct to
the
Cam
brid
ge C
ore
term
s of
use
, ava
ilabl
e at
htt
ps://
ww
w.c
ambr
idge
.org
/cor
e/te
rms.
htt
ps://
doi.o
rg/1
0.10
17/S
0003
0554
1800
0023
Who Punishes Extremist Nominees?
the resulting estimates “local” to this context. In thepresent study, we have good reasons to think that thislocal estimate is more generalizable than is often pos-sible. As Hall (2015) shows, close primary electionsoccur in a variety of districts. Unlike general-electionRDs, which by definition only take place in competi-tive districts, primary election RDs are able to utilizeboth competitive districts and safe districts, becausethe dominant party in safe districts often has com-petitive primaries. In the Online Appendix, we offersome descriptive evidence to suggest that the RD sam-ple is similar to the broader set of contested primaryraces, so we suspect that our estimates are not partic-ularly local. Finally, since we also present similar re-sults using the panel analysis (see Online Appendix),which relies on a much broader set of elections, weare relatively confident in the generalizability of theRD estimates.
WHO PUNISHES EXTREMISTS?EVALUATING MECHANISMS
Is the Penalty to Extremists Driven MostlyBy Turnout and Not Swing Voters?
Howmuch of the overall electoral penalty that extrem-ists receive comes purely from the overall turnout ef-fect, and howmuch comes from voters switching sides?There is no way to answer this conclusively without ob-serving individual vote choices, but we can conduct asuggestive test. If the RD-estimated effects on parti-san turnout share are very different from the effects onvote share, then we might have more reason to thinkswing voting is occurring.To make these ideas clear, suppose for starters that
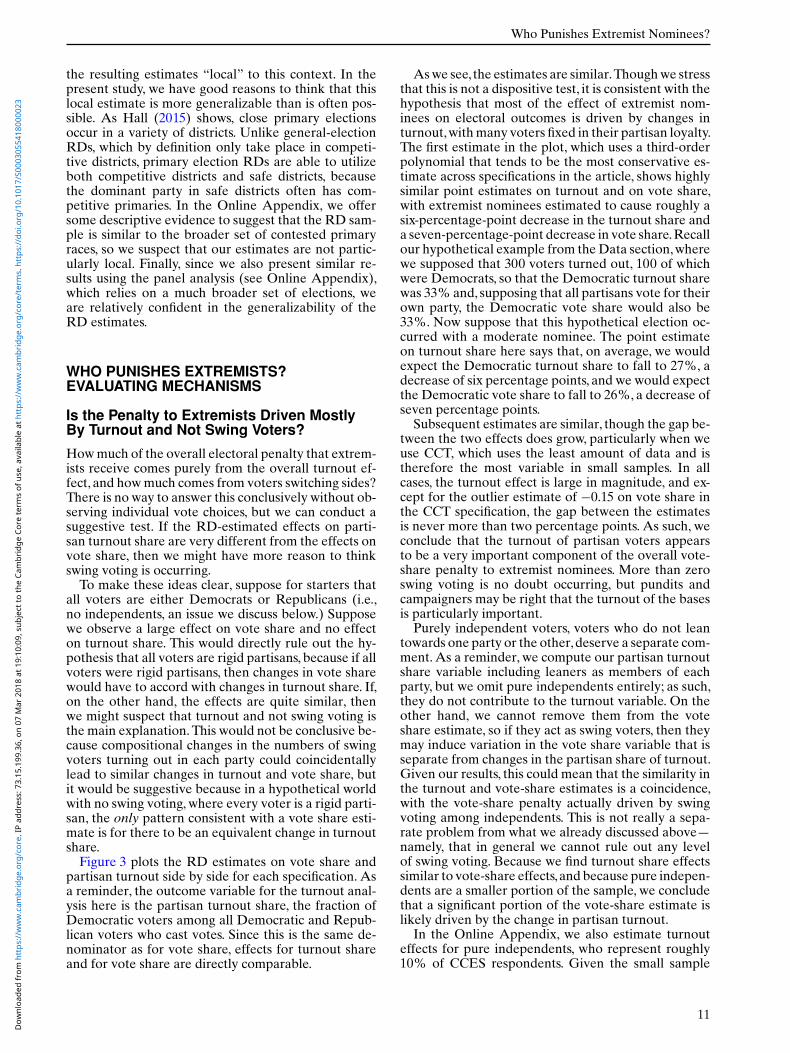
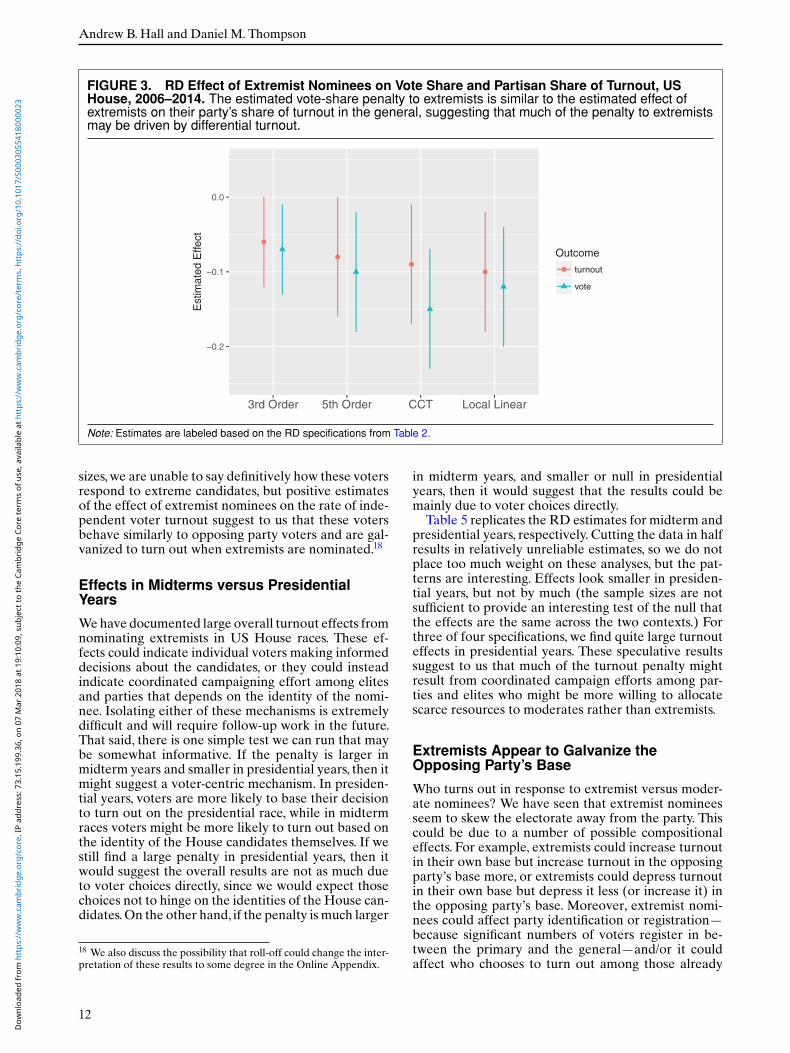
all voters are either Democrats or Republicans (i.e.,no independents, an issue we discuss below.) Supposewe observe a large effect on vote share and no effecton turnout share. This would directly rule out the hy-pothesis that all voters are rigid partisans, because if allvoters were rigid partisans, then changes in vote sharewould have to accord with changes in turnout share. If,on the other hand, the effects are quite similar, thenwe might suspect that turnout and not swing voting isthe main explanation.This would not be conclusive be-cause compositional changes in the numbers of swingvoters turning out in each party could coincidentallylead to similar changes in turnout and vote share, butit would be suggestive because in a hypothetical worldwith no swing voting,where every voter is a rigid parti-san, the only pattern consistent with a vote share esti-mate is for there to be an equivalent change in turnoutshare.Figure 3 plots the RD estimates on vote share and
partisan turnout side by side for each specification. Asa reminder, the outcome variable for the turnout anal-ysis here is the partisan turnout share, the fraction ofDemocratic voters among all Democratic and Repub-lican voters who cast votes. Since this is the same de-nominator as for vote share, effects for turnout shareand for vote share are directly comparable.
Aswe see, the estimates are similar.Thoughwe stressthat this is not a dispositive test, it is consistent with thehypothesis that most of the effect of extremist nom-inees on electoral outcomes is driven by changes inturnout,withmany voters fixed in their partisan loyalty.The first estimate in the plot, which uses a third-orderpolynomial that tends to be the most conservative es-timate across specifications in the article, shows highlysimilar point estimates on turnout and on vote share,with extremist nominees estimated to cause roughly asix-percentage-point decrease in the turnout share anda seven-percentage-point decrease in vote share.Recallour hypothetical example from theData section,wherewe supposed that 300 voters turned out, 100 of whichwere Democrats, so that the Democratic turnout sharewas 33% and, supposing that all partisans vote for theirown party, the Democratic vote share would also be33%. Now suppose that this hypothetical election oc-curred with a moderate nominee. The point estimateon turnout share here says that, on average, we wouldexpect the Democratic turnout share to fall to 27%, adecrease of six percentage points, and we would expectthe Democratic vote share to fall to 26%, a decrease ofseven percentage points.Subsequent estimates are similar, though the gap be-
tween the two effects does grow, particularly when weuse CCT, which uses the least amount of data and istherefore the most variable in small samples. In allcases, the turnout effect is large in magnitude, and ex-cept for the outlier estimate of −0.15 on vote share inthe CCT specification, the gap between the estimatesis never more than two percentage points. As such, weconclude that the turnout of partisan voters appearsto be a very important component of the overall vote-share penalty to extremist nominees. More than zeroswing voting is no doubt occurring, but pundits andcampaigners may be right that the turnout of the basesis particularly important.Purely independent voters, voters who do not lean
towards one party or the other,deserve a separate com-ment.As a reminder, we compute our partisan turnoutshare variable including leaners as members of eachparty, but we omit pure independents entirely; as such,they do not contribute to the turnout variable. On theother hand, we cannot remove them from the voteshare estimate, so if they act as swing voters, then theymay induce variation in the vote share variable that isseparate from changes in the partisan share of turnout.Given our results, this could mean that the similarity inthe turnout and vote-share estimates is a coincidence,with the vote-share penalty actually driven by swingvoting among independents. This is not really a sepa-rate problem from what we already discussed above—namely, that in general we cannot rule out any levelof swing voting. Because we find turnout share effectssimilar to vote-share effects,and because pure indepen-dents are a smaller portion of the sample, we concludethat a significant portion of the vote-share estimate islikely driven by the change in partisan turnout.In the Online Appendix, we also estimate turnout
effects for pure independents, who represent roughly10% of CCES respondents. Given the small sample
11
Dow
nloa
ded
from
htt
ps://
ww
w.c
ambr
idge
.org
/cor
e. IP
add
ress
: 73.
15.1
99.3
6, o
n 07
Mar
201
8 at
19:
10:0
9, s
ubje
ct to
the
Cam
brid
ge C
ore
term
s of
use
, ava
ilabl
e at
htt
ps://
ww
w.c
ambr
idge
.org
/cor
e/te
rms.
htt
ps://
doi.o
rg/1
0.10
17/S
0003
0554
1800
0023
Andrew B. Hall and Daniel M. Thompson
FIGURE 3. RD Effect of Extremist Nominees on Vote Share and Partisan Share of Turnout, USHouse, 2006–2014. The estimated vote-share penalty to extremists is similar to the estimated effect ofextremists on their party’s share of turnout in the general, suggesting that much of the penalty to extremistsmay be driven by differential turnout.
Note: Estimates are labeled based on the RD specifications from Table 2.
sizes,we are unable to say definitively how these votersrespond to extreme candidates, but positive estimatesof the effect of extremist nominees on the rate of inde-pendent voter turnout suggest to us that these votersbehave similarly to opposing party voters and are gal-vanized to turn out when extremists are nominated.18
Effects in Midterms versus PresidentialYears
Wehave documented large overall turnout effects fromnominating extremists in US House races. These ef-fects could indicate individual voters making informeddecisions about the candidates, or they could insteadindicate coordinated campaigning effort among elitesand parties that depends on the identity of the nomi-nee. Isolating either of these mechanisms is extremelydifficult and will require follow-up work in the future.That said, there is one simple test we can run that maybe somewhat informative. If the penalty is larger inmidterm years and smaller in presidential years, then itmight suggest a voter-centric mechanism. In presiden-tial years, voters are more likely to base their decisionto turn out on the presidential race, while in midtermraces voters might be more likely to turn out based onthe identity of the House candidates themselves. If westill find a large penalty in presidential years, then itwould suggest the overall results are not as much dueto voter choices directly, since we would expect thosechoices not to hinge on the identities of the House can-didates.On the other hand, if the penalty is much larger
18 We also discuss the possibility that roll-off could change the inter-pretation of these results to some degree in the Online Appendix.
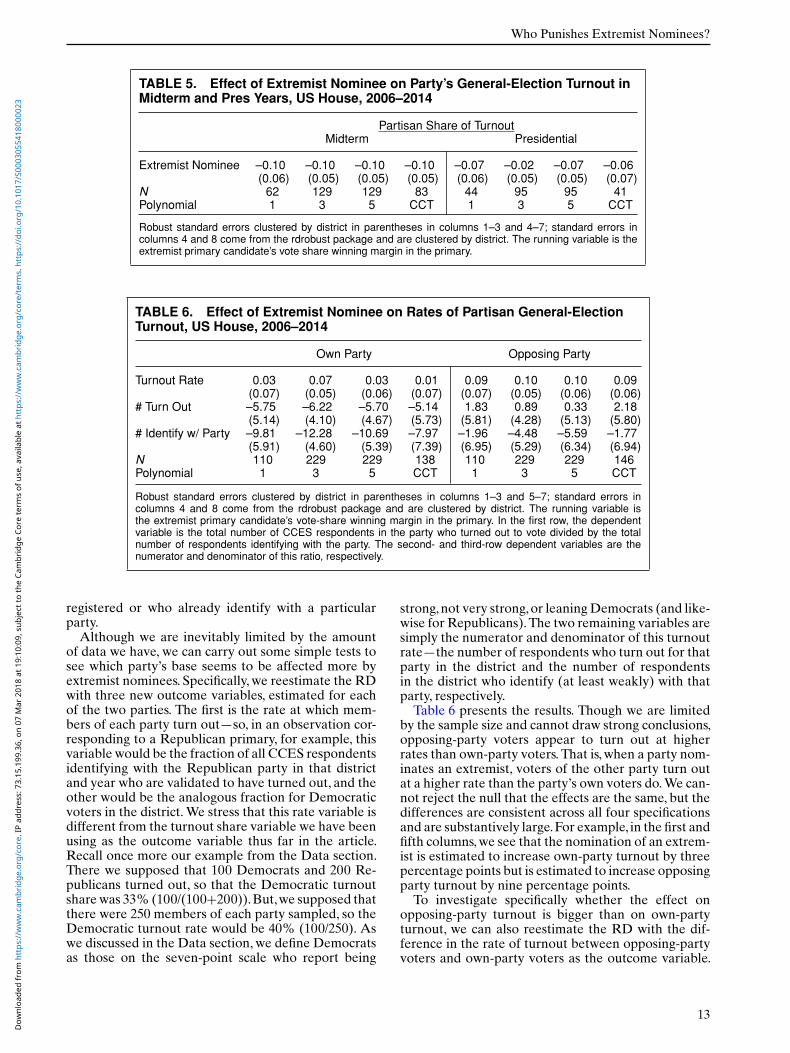
in midterm years, and smaller or null in presidentialyears, then it would suggest that the results could bemainly due to voter choices directly.Table 5 replicates the RD estimates for midterm and
presidential years, respectively. Cutting the data in halfresults in relatively unreliable estimates, so we do notplace too much weight on these analyses, but the pat-terns are interesting. Effects look smaller in presiden-tial years, but not by much (the sample sizes are notsufficient to provide an interesting test of the null thatthe effects are the same across the two contexts.) Forthree of four specifications, we find quite large turnouteffects in presidential years. These speculative resultssuggest to us that much of the turnout penalty mightresult from coordinated campaign efforts among par-ties and elites who might be more willing to allocatescarce resources to moderates rather than extremists.
Extremists Appear to Galvanize theOpposing Party’s Base
Who turns out in response to extremist versus moder-ate nominees? We have seen that extremist nomineesseem to skew the electorate away from the party. Thiscould be due to a number of possible compositionaleffects. For example, extremists could increase turnoutin their own base but increase turnout in the opposingparty’s base more, or extremists could depress turnoutin their own base but depress it less (or increase it) inthe opposing party’s base. Moreover, extremist nomi-nees could affect party identification or registration—because significant numbers of voters register in be-tween the primary and the general—and/or it couldaffect who chooses to turn out among those already
12
Dow
nloa
ded
from
htt
ps://
ww
w.c
ambr
idge
.org
/cor
e. IP
add
ress
: 73.
15.1
99.3
6, o
n 07
Mar
201
8 at
19:
10:0
9, s
ubje
ct to
the
Cam
brid
ge C
ore
term
s of
use
, ava
ilabl
e at
htt
ps://
ww
w.c
ambr
idge
.org
/cor
e/te
rms.
htt
ps://
doi.o
rg/1
0.10
17/S
0003
0554
1800
0023
Who Punishes Extremist Nominees?
TABLE 5. Effect of Extremist Nominee on Party’s General-Election Turnout inMidterm and Pres Years, US House, 2006–2014
Partisan Share of TurnoutMidterm Presidential
Extremist Nominee –0.10 –0.10 –0.10 –0.10 –0.07 –0.02 –0.07 –0.06(0.06) (0.05) (0.05) (0.05) (0.06) (0.05) (0.05) (0.07)
N 62 129 129 83 44 95 95 41Polynomial 1 3 5 CCT 1 3 5 CCT
Robust standard errors clustered by district in parentheses in columns 1–3 and 4–7; standard errors incolumns 4 and 8 come from the rdrobust package and are clustered by district. The running variable is theextremist primary candidate’s vote share winning margin in the primary.
TABLE 6. Effect of Extremist Nominee on Rates of Partisan General-ElectionTurnout, US House, 2006–2014
Own Party Opposing Party
Turnout Rate 0.03 0.07 0.03 0.01 0.09 0.10 0.10 0.09(0.07) (0.05) (0.06) (0.07) (0.07) (0.05) (0.06) (0.06)
# Turn Out –5.75 –6.22 –5.70 –5.14 1.83 0.89 0.33 2.18(5.14) (4.10) (4.67) (5.73) (5.81) (4.28) (5.13) (5.80)
# Identify w/ Party –9.81 –12.28 –10.69 –7.97 –1.96 –4.48 –5.59 –1.77(5.91) (4.60) (5.39) (7.39) (6.95) (5.29) (6.34) (6.94)
N 110 229 229 138 110 229 229 146Polynomial 1 3 5 CCT 1 3 5 CCT
Robust standard errors clustered by district in parentheses in columns 1–3 and 5–7; standard errors incolumns 4 and 8 come from the rdrobust package and are clustered by district. The running variable isthe extremist primary candidate’s vote-share winning margin in the primary. In the first row, the dependentvariable is the total number of CCES respondents in the party who turned out to vote divided by the totalnumber of respondents identifying with the party. The second- and third-row dependent variables are thenumerator and denominator of this ratio, respectively.
registered or who already identify with a particularparty.Although we are inevitably limited by the amount
of data we have, we can carry out some simple tests tosee which party’s base seems to be affected more byextremist nominees. Specifically, we reestimate the RDwith three new outcome variables, estimated for eachof the two parties. The first is the rate at which mem-bers of each party turn out—so, in an observation cor-responding to a Republican primary, for example, thisvariable would be the fraction of all CCES respondentsidentifying with the Republican party in that districtand year who are validated to have turned out, and theother would be the analogous fraction for Democraticvoters in the district.We stress that this rate variable isdifferent from the turnout share variable we have beenusing as the outcome variable thus far in the article.Recall once more our example from the Data section.There we supposed that 100 Democrats and 200 Re-publicans turned out, so that the Democratic turnoutsharewas 33% (100/(100+200)).But,we supposed thatthere were 250 members of each party sampled, so theDemocratic turnout rate would be 40% (100/250). Aswe discussed in the Data section, we define Democratsas those on the seven-point scale who report being
strong,not very strong,or leaningDemocrats (and like-wise for Republicans).The two remaining variables aresimply the numerator and denominator of this turnoutrate—the number of respondents who turn out for thatparty in the district and the number of respondentsin the district who identify (at least weakly) with thatparty, respectively.Table 6 presents the results. Though we are limited
by the sample size and cannot draw strong conclusions,opposing-party voters appear to turn out at higherrates than own-party voters. That is, when a party nom-inates an extremist, voters of the other party turn outat a higher rate than the party’s own voters do.We can-not reject the null that the effects are the same, but thedifferences are consistent across all four specificationsand are substantively large.For example, in the first andfifth columns,we see that the nomination of an extrem-ist is estimated to increase own-party turnout by threepercentage points but is estimated to increase opposingparty turnout by nine percentage points.To investigate specifically whether the effect on
opposing-party turnout is bigger than on own-partyturnout, we can also reestimate the RD with the dif-ference in the rate of turnout between opposing-partyvoters and own-party voters as the outcome variable.
13
Dow
nloa
ded
from
htt
ps://
ww
w.c
ambr
idge
.org
/cor
e. IP
add
ress
: 73.
15.1
99.3
6, o
n 07
Mar
201
8 at
19:
10:0
9, s
ubje
ct to
the
Cam
brid
ge C
ore
term
s of
use
, ava
ilabl
e at
htt
ps://
ww
w.c
ambr
idge
.org
/cor
e/te
rms.
htt
ps://
doi.o
rg/1
0.10
17/S
0003
0554
1800
0023
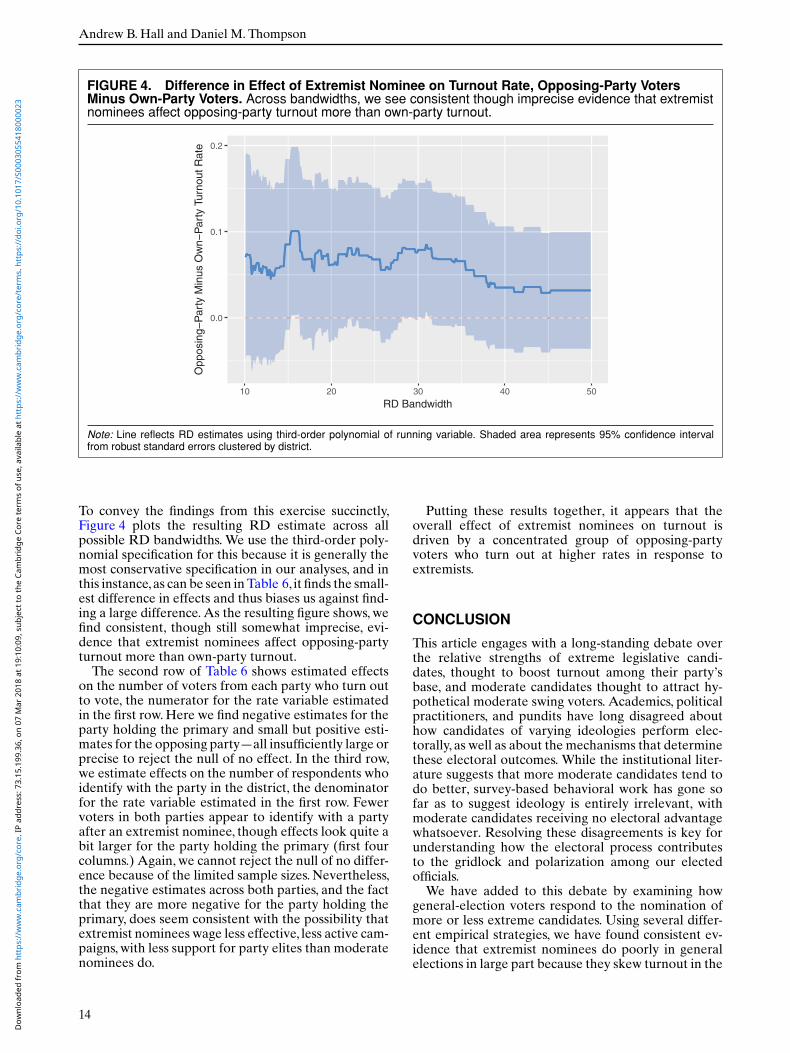
Andrew B. Hall and Daniel M. Thompson
FIGURE 4. Difference in Effect of Extremist Nominee on Turnout Rate, Opposing-Party VotersMinus Own-Party Voters. Across bandwidths, we see consistent though imprecise evidence that extremistnominees affect opposing-party turnout more than own-party turnout.
0.0
0.1
0.2
10 20 30 40 50
RD Bandwidth
Opp
osin
g−P
arty
Min
us O
wn−
Par
ty T
urno
ut R
ate
Note: Line reflects RD estimates using third-order polynomial of running variable. Shaded area represents 95% confidence intervalfrom robust standard errors clustered by district.
To convey the findings from this exercise succinctly,Figure 4 plots the resulting RD estimate across allpossible RD bandwidths. We use the third-order poly-nomial specification for this because it is generally themost conservative specification in our analyses, and inthis instance,as can be seen inTable 6, it finds the small-est difference in effects and thus biases us against find-ing a large difference.As the resulting figure shows, wefind consistent, though still somewhat imprecise, evi-dence that extremist nominees affect opposing-partyturnout more than own-party turnout.The second row of Table 6 shows estimated effects
on the number of voters from each party who turn outto vote, the numerator for the rate variable estimatedin the first row.Here we find negative estimates for theparty holding the primary and small but positive esti-mates for the opposing party—all insufficiently large orprecise to reject the null of no effect. In the third row,we estimate effects on the number of respondents whoidentify with the party in the district, the denominatorfor the rate variable estimated in the first row. Fewervoters in both parties appear to identify with a partyafter an extremist nominee, though effects look quite abit larger for the party holding the primary (first fourcolumns.) Again, we cannot reject the null of no differ-ence because of the limited sample sizes. Nevertheless,the negative estimates across both parties, and the factthat they are more negative for the party holding theprimary, does seem consistent with the possibility thatextremist nominees wage less effective, less active cam-paigns, with less support for party elites than moderatenominees do.
Putting these results together, it appears that theoverall effect of extremist nominees on turnout isdriven by a concentrated group of opposing-partyvoters who turn out at higher rates in response toextremists.
CONCLUSION
This article engages with a long-standing debate overthe relative strengths of extreme legislative candi-dates, thought to boost turnout among their party’sbase, and moderate candidates thought to attract hy-pothetical moderate swing voters. Academics, politicalpractitioners, and pundits have long disagreed abouthow candidates of varying ideologies perform elec-torally, as well as about the mechanisms that determinethese electoral outcomes. While the institutional liter-ature suggests that more moderate candidates tend todo better, survey-based behavioral work has gone sofar as to suggest ideology is entirely irrelevant, withmoderate candidates receiving no electoral advantagewhatsoever. Resolving these disagreements is key forunderstanding how the electoral process contributesto the gridlock and polarization among our electedofficials.We have added to this debate by examining how
general-election voters respond to the nomination ofmore or less extreme candidates. Using several differ-ent empirical strategies, we have found consistent ev-idence that extremist nominees do poorly in generalelections in large part because they skew turnout in the
14
Dow
nloa
ded
from
htt
ps://
ww
w.c
ambr
idge
.org
/cor
e. IP
add
ress
: 73.
15.1
99.3
6, o
n 07
Mar
201
8 at
19:
10:0
9, s
ubje
ct to
the
Cam
brid
ge C
ore
term
s of
use
, ava
ilabl
e at
htt
ps://
ww
w.c
ambr
idge
.org
/cor
e/te
rms.
htt
ps://
doi.o
rg/1
0.10
17/S
0003
0554
1800
0023
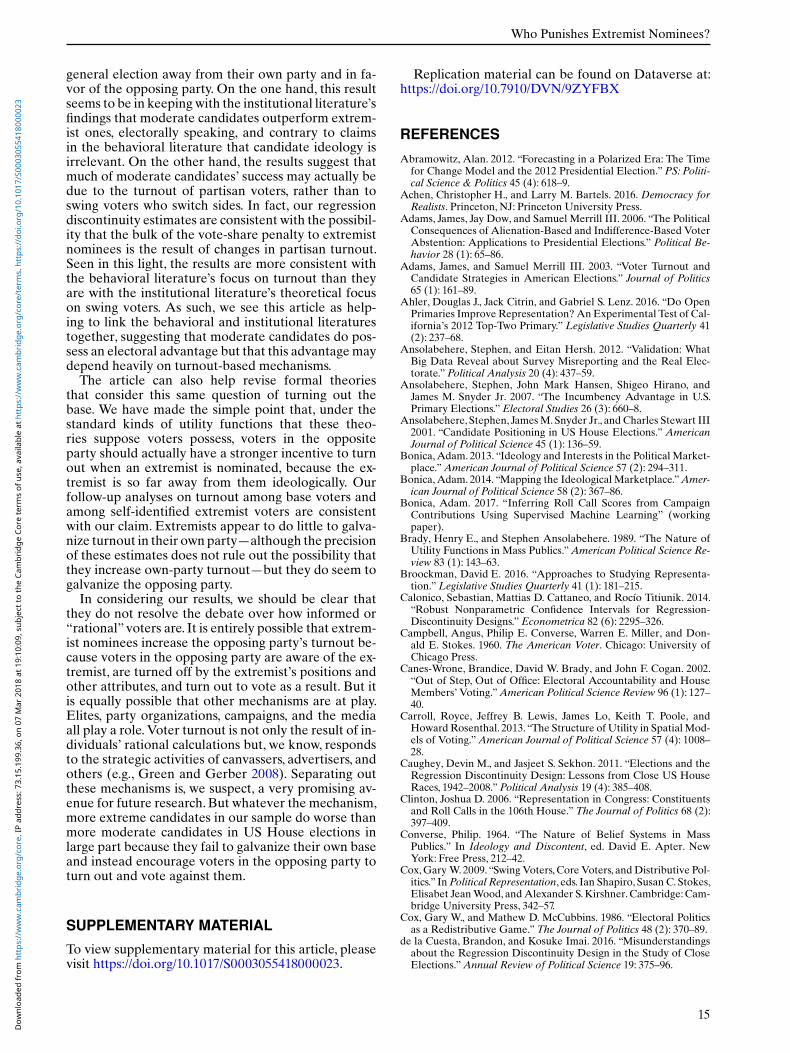
Who Punishes Extremist Nominees?
general election away from their own party and in fa-vor of the opposing party. On the one hand, this resultseems to be in keeping with the institutional literature’sfindings that moderate candidates outperform extrem-ist ones, electorally speaking, and contrary to claimsin the behavioral literature that candidate ideology isirrelevant. On the other hand, the results suggest thatmuch of moderate candidates’ success may actually bedue to the turnout of partisan voters, rather than toswing voters who switch sides. In fact, our regressiondiscontinuity estimates are consistent with the possibil-ity that the bulk of the vote-share penalty to extremistnominees is the result of changes in partisan turnout.Seen in this light, the results are more consistent withthe behavioral literature’s focus on turnout than theyare with the institutional literature’s theoretical focuson swing voters. As such, we see this article as help-ing to link the behavioral and institutional literaturestogether, suggesting that moderate candidates do pos-sess an electoral advantage but that this advantagemaydepend heavily on turnout-based mechanisms.The article can also help revise formal theories
that consider this same question of turning out thebase. We have made the simple point that, under thestandard kinds of utility functions that these theo-ries suppose voters possess, voters in the oppositeparty should actually have a stronger incentive to turnout when an extremist is nominated, because the ex-tremist is so far away from them ideologically. Ourfollow-up analyses on turnout among base voters andamong self-identified extremist voters are consistentwith our claim. Extremists appear to do little to galva-nize turnout in their own party—although the precisionof these estimates does not rule out the possibility thatthey increase own-party turnout—but they do seem togalvanize the opposing party.In considering our results, we should be clear that
they do not resolve the debate over how informed or“rational”voters are. It is entirely possible that extrem-ist nominees increase the opposing party’s turnout be-cause voters in the opposing party are aware of the ex-tremist, are turned off by the extremist’s positions andother attributes, and turn out to vote as a result. But itis equally possible that other mechanisms are at play.Elites, party organizations, campaigns, and the mediaall play a role.Voter turnout is not only the result of in-dividuals’ rational calculations but, we know, respondsto the strategic activities of canvassers, advertisers, andothers (e.g., Green and Gerber 2008). Separating outthese mechanisms is, we suspect, a very promising av-enue for future research.But whatever the mechanism,more extreme candidates in our sample do worse thanmore moderate candidates in US House elections inlarge part because they fail to galvanize their own baseand instead encourage voters in the opposing party toturn out and vote against them.
SUPPLEMENTARY MATERIAL
To view supplementary material for this article, pleasevisit https://doi.org/10.1017/S0003055418000023.
Replication material can be found on Dataverse at:https://doi.org/10.7910/DVN/9ZYFBX
REFERENCES
Abramowitz, Alan. 2012. “Forecasting in a Polarized Era: The Timefor Change Model and the 2012 Presidential Election.”PS: Politi-cal Science & Politics 45 (4): 618–9.
Achen, Christopher H., and Larry M. Bartels. 2016. Democracy forRealists. Princeton, NJ: Princeton University Press.
Adams, James, Jay Dow, and Samuel Merrill III. 2006. “The PoliticalConsequences of Alienation-Based and Indifference-Based VoterAbstention: Applications to Presidential Elections.” Political Be-havior 28 (1): 65–86.
Adams, James, and Samuel Merrill III. 2003. “Voter Turnout andCandidate Strategies in American Elections.” Journal of Politics65 (1): 161–89.
Ahler, Douglas J., Jack Citrin, and Gabriel S. Lenz. 2016. “Do OpenPrimaries Improve Representation?AnExperimental Test of Cal-ifornia’s 2012 Top-Two Primary.” Legislative Studies Quarterly 41(2): 237–68.
Ansolabehere, Stephen, and Eitan Hersh. 2012. “Validation: WhatBig Data Reveal about Survey Misreporting and the Real Elec-torate.”Political Analysis 20 (4): 437–59.
Ansolabehere, Stephen, John Mark Hansen, Shigeo Hirano, andJames M. Snyder Jr. 2007. “The Incumbency Advantage in U.S.Primary Elections.”Electoral Studies 26 (3): 660–8.
Ansolabehere, Stephen, JamesM.Snyder Jr., and Charles Stewart III2001. “Candidate Positioning in US House Elections.” AmericanJournal of Political Science 45 (1): 136–59.
Bonica,Adam. 2013. “Ideology and Interests in the Political Market-place.”American Journal of Political Science 57 (2): 294–311.
Bonica,Adam. 2014. “Mapping the Ideological Marketplace.”Amer-ican Journal of Political Science 58 (2): 367–86.
Bonica, Adam. 2017. “Inferring Roll Call Scores from CampaignContributions Using Supervised Machine Learning” (workingpaper).
Brady, Henry E., and Stephen Ansolabehere. 1989. “The Nature ofUtility Functions in Mass Publics.”American Political Science Re-view 83 (1): 143–63.
Broockman, David E. 2016. “Approaches to Studying Representa-tion.”Legislative Studies Quarterly 41 (1): 181–215.
Calonico, Sebastian, Mattias D. Cattaneo, and Rocío Titiunik. 2014.“Robust Nonparametric Confidence Intervals for Regression-Discontinuity Designs.”Econometrica 82 (6): 2295–326.
Campbell, Angus, Philip E. Converse, Warren E. Miller, and Don-ald E. Stokes. 1960. The American Voter. Chicago: University ofChicago Press.
Canes-Wrone, Brandice, David W. Brady, and John F. Cogan. 2002.“Out of Step, Out of Office: Electoral Accountability and HouseMembers’ Voting.”American Political Science Review 96 (1): 127–40.
Carroll, Royce, Jeffrey B. Lewis, James Lo, Keith T. Poole, andHoward Rosenthal. 2013. “The Structure of Utility in Spatial Mod-els of Voting.”American Journal of Political Science 57 (4): 1008–28.
Caughey, Devin M., and Jasjeet S. Sekhon. 2011. “Elections and theRegression Discontinuity Design: Lessons from Close US HouseRaces, 1942–2008.”Political Analysis 19 (4): 385–408.
Clinton, Joshua D. 2006. “Representation in Congress: Constituentsand Roll Calls in the 106th House.” The Journal of Politics 68 (2):397–409.
Converse, Philip. 1964. “The Nature of Belief Systems in MassPublics.” In Ideology and Discontent, ed. David E. Apter. NewYork: Free Press, 212–42.
Cox,Gary W.2009. “Swing Voters,Core Voters, andDistributive Pol-itics.” In Political Representation, eds. Ian Shapiro, Susan C.Stokes,Elisabet JeanWood, andAlexander S.Kirshner.Cambridge:Cam-bridge University Press, 342–57.
Cox, Gary W., and Mathew D. McCubbins. 1986. “Electoral Politicsas a Redistributive Game.”The Journal of Politics 48 (2): 370–89.
de la Cuesta, Brandon, and Kosuke Imai. 2016. “Misunderstandingsabout the Regression Discontinuity Design in the Study of CloseElections.”Annual Review of Political Science 19: 375–96.
15
Dow
nloa
ded
from
htt
ps://
ww
w.c
ambr
idge
.org
/cor
e. IP
add
ress
: 73.
15.1
99.3
6, o
n 07
Mar
201
8 at
19:
10:0
9, s
ubje
ct to
the
Cam
brid
ge C
ore
term
s of
use
, ava
ilabl
e at
htt
ps://
ww
w.c
ambr
idge
.org
/cor
e/te
rms.
htt
ps://
doi.o
rg/1
0.10
17/S
0003
0554
1800
0023
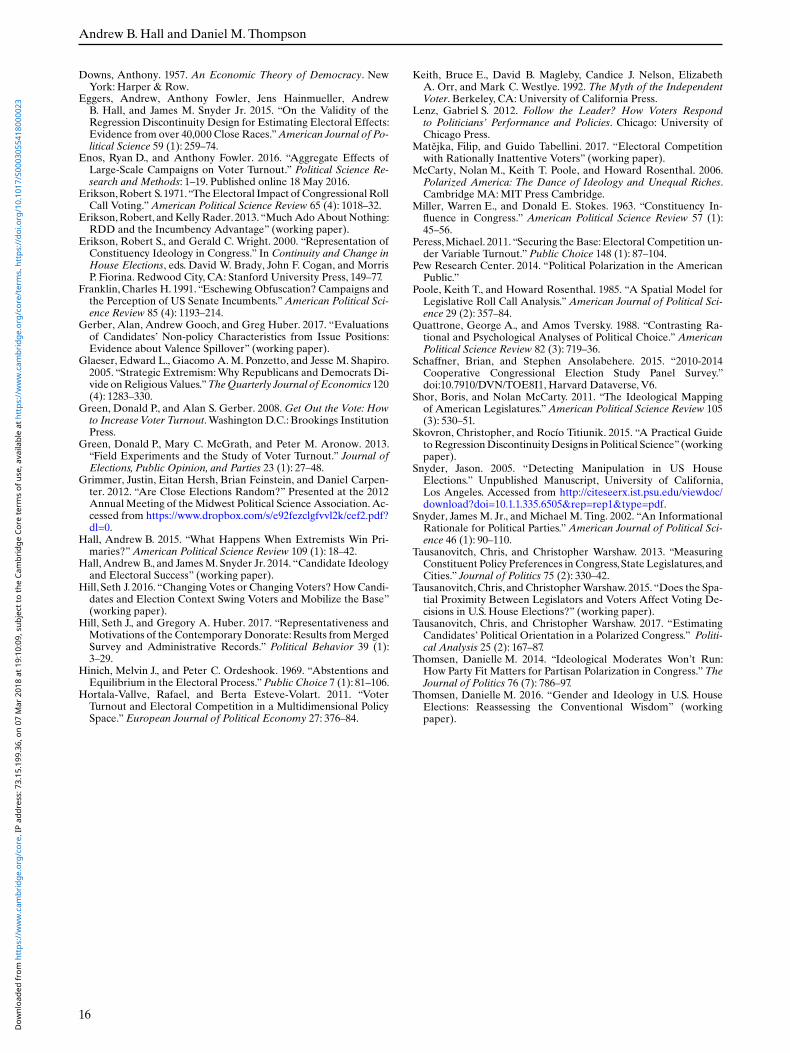
Andrew B. Hall and Daniel M. Thompson
Downs, Anthony. 1957. An Economic Theory of Democracy. NewYork: Harper & Row.
Eggers, Andrew, Anthony Fowler, Jens Hainmueller, AndrewB. Hall, and James M. Snyder Jr. 2015. “On the Validity of theRegression Discontinuity Design for Estimating Electoral Effects:Evidence from over 40,000 Close Races.”American Journal of Po-litical Science 59 (1): 259–74.
Enos, Ryan D., and Anthony Fowler. 2016. “Aggregate Effects ofLarge-Scale Campaigns on Voter Turnout.” Political Science Re-search and Methods: 1–19. Published online 18 May 2016.
Erikson,Robert S.1971.“TheElectoral Impact of CongressionalRollCall Voting.”American Political Science Review 65 (4): 1018–32.
Erikson,Robert, andKelly Rader. 2013. “MuchAdoAbout Nothing:RDD and the Incumbency Advantage” (working paper).
Erikson, Robert S., and Gerald C. Wright. 2000. “Representation ofConstituency Ideology in Congress.” In Continuity and Change inHouse Elections, eds. David W. Brady, John F. Cogan, and MorrisP. Fiorina. Redwood City, CA: Stanford University Press, 149–77.
Franklin,Charles H. 1991. “Eschewing Obfuscation? Campaigns andthe Perception of US Senate Incumbents.”American Political Sci-ence Review 85 (4): 1193–214.
Gerber, Alan, Andrew Gooch, and Greg Huber. 2017. “Evaluationsof Candidates’ Non-policy Characteristics from Issue Positions:Evidence about Valence Spillover” (working paper).
Glaeser, Edward L., Giacomo A.M. Ponzetto, and Jesse M. Shapiro.2005. “Strategic Extremism:Why Republicans and Democrats Di-vide onReligiousValues.”TheQuarterly Journal of Economics 120(4): 1283–330.
Green, Donald P., and Alan S. Gerber. 2008.Get Out the Vote: Howto Increase Voter Turnout.Washington D.C.: Brookings InstitutionPress.
Green, Donald P., Mary C. McGrath, and Peter M. Aronow. 2013.“Field Experiments and the Study of Voter Turnout.” Journal ofElections, Public Opinion, and Parties 23 (1): 27–48.
Grimmer, Justin, Eitan Hersh, Brian Feinstein, and Daniel Carpen-ter. 2012. “Are Close Elections Random?” Presented at the 2012Annual Meeting of theMidwest Political Science Association.Ac-cessed from https://www.dropbox.com/s/e92fezclgfvvl2k/cef2.pdf?dl=0.
Hall, Andrew B. 2015. “What Happens When Extremists Win Pri-maries?”American Political Science Review 109 (1): 18–42.
Hall,Andrew B., and JamesM.Snyder Jr. 2014. “Candidate Ideologyand Electoral Success” (working paper).
Hill, Seth J. 2016. “Changing Votes or Changing Voters? HowCandi-dates and Election Context Swing Voters and Mobilize the Base”(working paper).
Hill, Seth J., and Gregory A. Huber. 2017. “Representativeness andMotivations of the ContemporaryDonorate:Results fromMergedSurvey and Administrative Records.” Political Behavior 39 (1):3–29.
Hinich, Melvin J., and Peter C. Ordeshook. 1969. “Abstentions andEquilibrium in the Electoral Process.”Public Choice 7 (1): 81–106.
Hortala-Vallve, Rafael, and Berta Esteve-Volart. 2011. “VoterTurnout and Electoral Competition in a Multidimensional PolicySpace.”European Journal of Political Economy 27: 376–84.
Keith, Bruce E., David B. Magleby, Candice J. Nelson, ElizabethA. Orr, and Mark C. Westlye. 1992. The Myth of the IndependentVoter. Berkeley, CA: University of California Press.
Lenz, Gabriel S. 2012. Follow the Leader? How Voters Respondto Politicians’ Performance and Policies. Chicago: University ofChicago Press.
Matejka, Filip, and Guido Tabellini. 2017. “Electoral Competitionwith Rationally Inattentive Voters” (working paper).
McCarty, Nolan M., Keith T. Poole, and Howard Rosenthal. 2006.Polarized America: The Dance of Ideology and Unequal Riches.Cambridge MA:MIT Press Cambridge.
Miller, Warren E., and Donald E. Stokes. 1963. “Constituency In-fluence in Congress.” American Political Science Review 57 (1):45–56.
Peress,Michael. 2011. “Securing the Base:Electoral Competition un-der Variable Turnout.”Public Choice 148 (1): 87–104.
Pew Research Center. 2014. “Political Polarization in the AmericanPublic.”
Poole, Keith T., and Howard Rosenthal. 1985. “A Spatial Model forLegislative Roll Call Analysis.”American Journal of Political Sci-ence 29 (2): 357–84.
Quattrone, George A., and Amos Tversky. 1988. “Contrasting Ra-tional and Psychological Analyses of Political Choice.”AmericanPolitical Science Review 82 (3): 719–36.
Schaffner, Brian, and Stephen Ansolabehere. 2015. “2010-2014Cooperative Congressional Election Study Panel Survey.”doi:10.7910/DVN/TOE8I1, Harvard Dataverse, V6.
Shor, Boris, and Nolan McCarty. 2011. “The Ideological Mappingof American Legislatures.”American Political Science Review 105(3): 530–51.
Skovron, Christopher, and Rocío Titiunik. 2015. “A Practical GuidetoRegressionDiscontinuityDesigns in Political Science”(workingpaper).
Snyder, Jason. 2005. “Detecting Manipulation in US HouseElections.” Unpublished Manuscript, University of California,Los Angeles. Accessed from http://citeseerx.ist.psu.edu/viewdoc/download?doi=10.1.1.335.6505&rep=rep1&type=pdf.
Snyder, James M. Jr., and Michael M. Ting. 2002. “An InformationalRationale for Political Parties.”American Journal of Political Sci-ence 46 (1): 90–110.
Tausanovitch, Chris, and Christopher Warshaw. 2013. “MeasuringConstituent Policy Preferences in Congress,State Legislatures,andCities.” Journal of Politics 75 (2): 330–42.
Tausanovitch,Chris, and ChristopherWarshaw.2015. “Does the Spa-tial Proximity Between Legislators and Voters Affect Voting De-cisions in U.S. House Elections?” (working paper).
Tausanovitch, Chris, and Christopher Warshaw. 2017. “EstimatingCandidates’ Political Orientation in a Polarized Congress.” Politi-cal Analysis 25 (2): 167–87.
Thomsen, Danielle M. 2014. “Ideological Moderates Won’t Run:How Party Fit Matters for Partisan Polarization in Congress.”TheJournal of Politics 76 (7): 786–97.
Thomsen, Danielle M. 2016. “Gender and Ideology in U.S. HouseElections: Reassessing the Conventional Wisdom” (workingpaper).
16
Dow
nloa
ded
from
htt
ps://
ww
w.c
ambr
idge
.org
/cor
e. IP
add
ress
: 73.
15.1
99.3
6, o
n 07
Mar
201
8 at
19:
10:0
9, s
ubje
ct to
the
Cam
brid
ge C
ore
term
s of
use
, ava
ilabl
e at
htt
ps://
ww
w.c
ambr
idge
.org
/cor
e/te
rms.
htt
ps://
doi.o
rg/1
0.10
17/S
0003
0554
1800
0023