Embed Size (px)
DESCRIPTION
How changes in ownership concentration affect the investment behavior of financial institutions.
Citation preview

Electronic copy available at: http://ssrn.com/abstract=2641078
Working Paper Series 2015/60/FIN
A Working Paper is the author’s intellectual property. It is intended as a means to promote research to interested readers. Its content should not be copied or hosted on any server without written permission from [email protected] Find more INSEAD papers at http://www.insead.edu/facultyresearch/research/search_papers.cfm
Who is afraid of BlackRock?
Massimo Massa
INSEAD, [email protected]
David Schumacher McGill University, [email protected]
Corresponding author
Yan Wang Erasmus University, [email protected]
This version: August 2015
We use the merger of BlackRock with Barclays Global Investors (BGI) as an event to study how changes in ownership concentration affect the investment behavior of financial institutions and the cross-section of stocks worldwide. We find that other institutional investors re-balance away from stocks that experience a large increase in ownership concentration due to the pre-merger portfolio overlap between BlackRock and BGI. Over the same period, institutional ownership migrates towards comparable stocks not held by BGI funds prior to the merger. The re-allocation of institutional ownership has price impact. Stocks that experience large increases in ownership concentration due to the merger experience negative returns that do not fully revert. These stocks also become permanently less liquid and less volatile. We argue that the merger is exogenous with respect to the characteristics of the stocks held by BGI funds prior to the merger. This allows for a causal interpretation of the results and points to strong strategic complementarities associated with large, global asset management firms that may lead to financial fragility. We speculate that financial fragility is driven by fear of future, possibly idiosyncratic firm events and not necessarily by actual firm events per se. Keywords: Strategic Interactions, Asset Management Merger, Liquidity, Limits to Arbitrage. JEL Classification: G11, G12, G14, G15, G23.
Electronic copy available at: http://ssrn.com/abstract=2641078

Electronic copy available at: http://ssrn.com/abstract=2641078 Electronic copy available at: http://ssrn.com/abstract=2641078
1
“In 25 years, BlackRock has become the world’s biggest investor. Is its dominance a problem?”
Despite the ominous title, the cover story of the December 7, 2013 issue of The Economist took quite a
conciliatory tone arguing that “If the regulators’ concern is to avoid a repeat of the last crisis, they are
barking up the wrong tree. Unlike banks, whose loans and deposits go on their balance-sheets as assets
and liabilities, BlackRock is a mere manager of other people’s money. […] Whereas banks tumble if their
assets lose even a fraction of their value, BlackRock can pass on any shortfalls to its clients, and
withstand far greater shocks. In fact, by being on hand to pick up assets cheaply from distressed sellers,
an unleveraged asset manager arguably stabilizes markets rather than disrupting them.”
This logic is in line with the standard folk-theorem in finance. Since BlackRock does not invest on
its own account, but just indirectly on behalf of customers, there is little reason to associate BlackRock
with systemic risk.1 In this paper, we challenge this logic and argue that the emergence of BlackRock
impacts all the other investors who need to strategically account for the “big elephant in the pond” that
could potentially “rock the boat” in the future.
The sheer size of BlackRock means that the firm is now the single largest shareholder in a large
number of firms worldwide. Prior research has identified a number of possible effects that can follow
from such a large concentration of ownership. On the one hand, concentrated ownership can be associated
with higher stock volatility because idiosyncratic shocks to the concentrated investor base are not
diversified away once these shocks occur (Greenwood and Thesmar (2011)). On the other hand, if other
investors are aware of the possible impact of concentrated ownership, they will strategically take it into
account ex-ante. Strategic considerations of this kind can then lead to changes in the portfolio allocations
that may impact stock markets even in the absence of actual shocks.
For example, if a single investor accumulates a large stake in IBM, other investors may decide to
strategically change their exposure to IBM as well. They may decide to re-balance away from IBM in
order to avoid any future exposure to the idiosyncratic shocks of the single investor that could force a
large and sudden sale of IBM stock (a “fire sale”). While the actual occurrence of such a fire sale directly
impacts the stock price of IBM when it takes place, the mere “fear” of it can motivate investors to re-
balance, affecting the stock price of IBM already today.
While it has already been shown that concentrated ownership may lead to financial fragility
(Greenwood and Thesmar (2011)), not much evidence exists on the ex-ante impact of a change in
ownership concentration on the behavior of investors in the market. However, identifying the ex-ante
1 Indeed, traditionally, “systemic risk” has been considered the main reason to regulate “too big to fail”
institutions, typically banks.

2
effect is empirically challenging because it involves the identification of strategic interactions among
investors, which is plagued by endogeneity problems (Manski’s (1993) “reflection problem” 2).
In this paper, we overcome these issues by exploiting an exogenous shock to the concentration of
ownership in the cross-section of stocks worldwide. In 2009, BlackRock acquired Barclays Global
Investors (BGI) to become the world’s largest asset manager. This single merger fulfills all the criteria of
a natural experiment to study how a change in the degree of ownership concentration affects the behavior
of other investors and stock markets. First, the merger is unprecedented in scale. The combined entities
oversaw about $2.7 trillion in assets under management at that time. This makes the event impactful.
Second, the event affected a large number of global stocks to varying degrees, providing a necessary
source of cross-sectional variation. We estimate that stocks representing over 60% of world market
capitalization were directly affected because they were held in both BlackRock and BGI-managed
portfolios prior to the merger. Third, the acquisition was exogenous to the characteristics of the stocks
held in the portfolios of BlackRock and BGI funds. Barclays sold BGI in order to raise funds to
strengthen its balance sheet in the wake of the 2008 global financial crisis to avoid a possible future
bailout by the UK government. BlackRock acquired BGI in order to establish a foothold in the fast-
growing market of passive investment products (ETFs). This allows us to give a causal interpretation to
the merger-induced changes in ownership concentration and to the associated peer and stock market
effects.
We lay out two competing hypotheses. The first hypothesis, which we label the “fire sale risk
hypothesis”, is based on the strategic interactions among investors in financial markets that take into
account the possibility of future fire sales and the strategic complementarities associated with them. Such
complementarities arise when the actions of market players reinforce each other. 3 For example, they are
at the core of models on bank runs (e.g., Diamond and Dybvig (1983)) where the decision of one
depositor to withdraw funds induces other depositors to withdraw funds first for fear of depleting bank
reserves, leading to a bank run. The same intuition extends to asset management if a concentrated investor
experiences an idiosyncratic shock (e.g., large redemption requests) that induces a fire sale. Such a
situation can lead to strategic complementarities if other investors try to pre-empt the sale by selling first
or if the price impact of the initial sale forces other investors to follow suit. Therefore, in the presence of
2 The “reflection problem” captures the difficulty of identifying causality in peer behavior. For example, the
behavior of an individual could be caused by the behavior of some peer group, or the reverse, or none at all if all
behavior is caused by external, unobservable factors. 3 The decisions of two or more players are called strategic complements if they mutually reinforce one another,
and they are called strategic substitutes if they mutually offset one another (Bulow, Geanakoplos, and Klemperer
(1985)). For example, production decisions are strategic complements if an increase in the production of one
company increases the marginal revenues of the others, incentivizing them to increase production as well. In
contrast, production decisions are strategic substitutes if an increase in the production of one company decreases the
marginal revenues of the others, reducing their incentive to produce.

3
strategic interactions, a change in ownership concentration will induce other investors to re-balance away
from the affected stocks in order to hedge the risk of future fire sales.
This motive is especially true when the other investors face investment constraints (e.g., margin
constraints, short investment horizons, volatile flows, open-end structures, etc., Shleifer and Vishny
(1997))4 or when they hold the affected stocks primarily for liquidity reasons (i.e., when these other
investors are “liquidity” or “noise traders”). In these cases, they are especially vulnerable to potential
future fire sales. It is less true for investors who hold the affected stocks for information reasons
(“informed investors”). These will be more reluctant to re-balance as it would mean giving up their
information. As a result, under this hypothesis, changes in ownership concentration lead primarily to a
reduced presence of investors who assign a high importance to liquidity considerations. The literature has
traditionally called them as “liquidity” traders (or, more precisely, “strategic” or “discretionary” liquidity
traders, Spiegel and Subrahmanyam (1992)).
From this argument, the motive to strategically re-balance away from affected stocks should lead to a
negative price impact on the stocks. Further, the market microstructure literature has shown how a lower
presence of liquidity traders is associated with lower liquidity (because they trade for liquidity reasons
and not based on information) and lower volatility (because price changes due to liquidity trades impact
volatility rather than the mean of stock returns).5 Therefore, in the words of Bernardo and Welch (2004):
“Liquidity runs and crises are not caused by liquidity shocks per se, but by the fear of future liquidity
shocks.”
The alternative hypothesis is based on the informational role provided by concentrated ownership.
The presence of a large owner can send a positive signal about the quality of the firm (e.g., Kacperczyk,
Sialm and Zheng (2005)). In this case, other investors will re-balance towards the stock in order to copy
and benefit from the behavior of the concentrated owner. Under this alternative hypothesis, concerns
about future liquidity shock play a secondary role only, if at all. To the contrary, such a motive leads to
more market depth, higher liquidity and a positive price impact due to the increased buying pressure
triggered by the motive to re-balance. We will call this alternative hypothesis the “information
hypothesis”.
4 Indeed, a large variety of institutional investors is subject to such constraints. For example, the open-end
structure of mutual funds makes them vulnerable to fire sale problems as their structure imposes an externality on all
the investors in the fund should the fund face redemption requests. 5 Indeed, as in Kyle (1985) as well as in later studies (e.g., Kim and Verrecchia (1994)), asymmetric
information reduces stock liquidity. But equally, volatility is directly linked to price changes induced by noise
traders while informed investors largely affect the drift of the stock (e.g., Kyle (1985), Back (1992), Back, Cao and
Willard (2000)). Indeed, as Black (1986) points out: “noise trading is trading on noise as if it were information.” The
intuition is also very similar to the traditional microstructure literature’s intuition on “strategic liquidity trading”
(e.g., Subrahmanyam (1991), Spiegel and Subrahmanyam (1992), Chordia and Subrahmanyam (2004)).

4
These two hypothesis therefore differ both in their predictions on the investment responses of other
investors and in the resulting impact on stock returns, liquidity, and volatility. We test them against the
null hypothesis that changes in ownership concentration do not lead to strategic considerations by other
investors.
We start by documenting portfolio changes by institutional investors other than BlackRock or BGI in
response to the merger between the two entities. We find that, over the second half of 2009, institutional
investors re-balance away from stocks that experience a large increase in ownership concentration due to
the high institutional ownership attributable to BGI funds prior to the merger (“BGI-ownership”). As a
result, “residual institutional ownership” – i.e., the institutional ownership attributable to all institutions
except BlackRock or BGI – of stocks with high BGI-ownership drops relative to residual institutional
ownership of stocks with low BGI-ownership.
The effect is quantitatively sizeable. The growth rate of residual institutional ownership falls by
about 2%-age points per STD of BGI-ownership prior to the merger. This implies that residual
institutional ownership for stocks with low BGI-ownership prior to the merger (“bottom quintile stocks”)
grows more than twice as fast as residual institutional ownership for stocks with high BGI-ownership
prior to the merger (“top quintile stocks”) over the second half of 2009.6 We confirm this result in cross-
sectional regressions, a difference-in-difference design and various fixed effect specifications.
We find no evidence that this relative drop in residual institutional ownership reverts following the
completion of the merger, suggesting that the increase in ownership concentration due to the merger
reflects a permanent increase in the risk of future fire sales as opposed to a temporary effect caused by
front-running of competing institutions in anticipation of merger-induces portfolio rebalancing by
BlackRock.
Moreover, sample splits show that the effect is concentrated in stocks that were also held by
BlackRock funds prior to the merger. For stocks not held by BlackRock funds prior to the merger, the
effect is nil. Further, the effect is concentrated in illiquid stocks and in small-cap stocks – i.e., in stocks in
which liquidity considerations seem to play a larger role.
These initial findings give support to the “fire sale risk hypothesis”. We develop the hypothesis
further and ask two follow-up questions. First, which institutions respond more aggressively to the
merger? Second, where does residual institutional ownership migrate to?
First, we expect some degree of heterogeneity in how aggressive different institutional investors
respond to the changes in ownership concentration induced by the merger. For example, Chen, Goldstein
and Jiang (2013) show that strategic complementarities play a more important role for funds with illiquid
6 One STD of BGI-ownership prior to the merger corresponds to about 1.2% of institutional ownership
attributable to BGI funds. We find that residual institutional ownership grows on average in the second half of 2009,
more details in section III.

5
portfolios and performance-sensitive flows. We confirm this idea and find that the effect is stronger
among institutional investors with more volatile flows and higher flow-performance sensitivities. Also,
consistent with the notion that “liquidity traders” are more likely to re-balance away from affected stocks
than “informed investors”, we find that the effect is stronger for institutional investors with shorter
investment horizons and that are less likely informed.
Second, institutional investors are frequently subject to a mandate to stay invested and many are
benchmarked to broad market indices. This suggests that residual institutional ownership is likely re-
allocated to comparable stocks that were not held by BGI funds prior to the merger. We employ multiple
selection algorithms to identify potential matching stocks to the stocks affected by the merger and indeed
find that the matching stocks experience a disproportionate increase in institutional ownership over the
second half of 2009. The growth rate of residual institutional ownership is 2 to 11%-age points higher in
the matching stocks compared to the actual stocks. The difference is especially pronounced for the
matching stocks to the stocks that experience a large increase in ownership concentration due to the
merger (“top-quintile stocks”). For such stocks, the difference in the growth rate reaches up to 29%-age
points, implying that the growth rate in residual institutional ownership is about 10 times higher in the
matching stocks than in the actual stocks that are directly affected by the merger. This shows that fund
managers rebalance into stocks that are as close as possible to the ones they divest from, with only small
changes to their overall asset allocation strategy.
Next, we turn to the stock market effects of the BlackRock-BGI merger. We focus on the impact on
stock returns, liquidity, and volatility. The “fire sales risk hypothesis” predicts negative stock price effects
as well as both lower liquidity and lower volatility for stocks that experience an increase in ownership
concentration due to the merger. The “information hypothesis” predicts the opposite.
To test these predictions, we first refine our testing strategy. For the analysis of peer effects, we are
constrained by semi-annual holdings information for global institutions. For the analysis of stock market
effects, we do not face this restriction and therefore conduct the analysis at the monthly frequency. This
allows us to more precisely identify the periods when any stock market effects manifest themselves.
Therefore, we define three key moments in the evolution of the merger. The announcement in June 2009
that BlackRock is the designated buyer of BGI, the anti-trust approval by the European Commission in
September 2009 and the completion of the merger in December 2009. In section I, we give a more
detailed account of the evolution of the merger.
The results further support the “fire sales risk hypothesis”. We find strong negative effects on
returns, liquidity, and volatility of stocks that experience a large increase in ownership concentration due
to the merger. These effects mostly take place once the merger receives anti-trust approval from the
European Commission, i.e., they are concentrated in the period September to November 2009. The effects

6
are also economically sizeable: Risk-adjusted returns (liquidity, volatility) fall by 95 bps per month (0.1
STD per month, 0.07 STD per month) per STD of BGI-ownership prior to the merger in the period after
the merger receives anti-trust approval and before it completes.
None of these effects fully reverts after the merger completes. While the liquidity and volatility
effects are already detectable after the merger announcement, the return effect only manifests itself once
the merger receives anti-trust approval. Also, the effects are robust to multiple fixed effect specifications,
and, importantly, to controlling for the impact of residual institutional ownership. Consistent with the
previous results, the effects are concentrated in stocks held by BlackRock funds prior to the merger and in
illiquid and small-cap stocks.
These results contribute to several strands of the literature. First, we contribute to the literature on
strategic interactions in financial markets including the literature on strategic complementarities and
global games (e.g., Carlsson and Van Damme (1993), Morris and Shin (1998), Corsetti, Dasgupta,
Morris, and Shin (2004), Rochet and Vives (2004), Dasgupta (2004), Goldstein and Pauzner (2004,
2005)) as well as the literature on financial runs (e.g., Diamond and Dybvig (1983), Bernardo and Welch
(2004)). We provide direct evidence on strategic interactions that are empirically notoriously difficult to
identify, as acknowledged by Chen, Goldstein and Jiang (2013) who provide indirect evidence using
mutual fund flows.
Second, we contribute to the literature on the impact of concentrated ownership (e.g., Greenwood
and Thesmar (2011), Kacperczyk, Sialm and Zheng (2005)) on the stock market. Our experiment based
on the merger between BlackRock and BGI provides an exogenous source of variation of ownership
concentration in a global cross-section of stocks. This allows us to give a causal interpretation to the
documented effects and contributes to the debate on how concentrated ownership affects stock markets.
More importantly, the fact that we are able to observe the ex-ante strategic behavior of other investors
(i.e., before any idiosyncratic shocks to BlackRock or any fire sales occur) allows us to identify the ex-
ante impact of concentrated ownership on stock markets, clearly differentiating this paper from the
literature on financial fragility that focusses on the impact of actual fire sales, once they happen. Azar,
Schmalz and Tecu (2015) analyze the impact of common ownership on product market policies of
airlines. They also use the merger of BlackRock and BGI as an exogenous source of variation in
ownership concentration.
Third, we contribute to the literature on liquidity and liquidity-driven trading in financial markets
(e.g., Kyle (1985), Subrahmanyam (1991), Spiegel and Subrahmanyam (1992), Back (1992), Back, Cao
and Willard (2000), Amihud (2002), Chordia and Subrahmanyam (2004)) and to the literature on
financial fire sales and limits to arbitrage (e.g., Shleifer and Vishny (1997, 2011), Bernardo and Welch
(2004), Coval and Stafford (2007), Ellul, Jotikasthira and Lundblad (2010)). With respect to the first, we
7
provide direct evidence on the link between the behavior of investors and the resulting effects on liquidity
and volatility. With respect to the second, we clarify between the impact of financial fire sales when they
occur and the ex-ante response by investors who act in anticipation of such events.
Finally, our results have important normative implications. On the one hand, they suggest that
concentrated ownership need not exacerbate stock volatility but may in fact cause the opposite at the cost
of lower liquidity. On the other hand, they suggest that large asset managers may contribute to systemic
risk and that other market participants are aware of it and condition their actions accordingly.
We proceed as follows. In section I, we give a detailed account of the BlackRock-BGI merger. In
section II, we describe the data and main variables that we use and explain our empirical design. In
section III, we analyze peer effects and examine how the merger impacts the investment behavior of
global financial institutions. In section IV, we study the stock market effects of the merger. In section V,
we present further robustness tests and discussions. A brief conclusion follows.
I. The BlackRock-BGI Merger
In the wake of the 2008 financial crisis, the initial owner of Barclays Global Investors (“BGI”), the
UK-based bank Barclays PLC (“Barclays”), had to sustain large loan losses that substantially weakened
the bank’s balance sheet. In order to strengthen the bank’s capital ratios, calm investors, and avoid risking
a bailout by the UK government, Barclays announced on March 16, 2009 its intention to sell the iShares
unit of BGI. This unit was (and still is) the leading global provider of exchange-traded funds (“ETFs”).
On April 9, 2009, Barclays announced the sale of the iShares unit to the private equity group CVC
Capital (“CVC”) for $4.4 billion. However, the deal included a “go shop” provision that would allow
another bidder to make a higher offer for iShares within 45 days in exchange for a $175 million break-up
fee to be paid to CVC.
On June 11, 2009, BlackRock Inc. (“BlackRock”) announced that it had agreed to acquire all of BGI
for $13.5 billion. The deal would make BlackRock the world’s largest money manager with assets under
management of $2.7 trillion at that time. According to the “go shop” provision, the announcement left an
additional 5 days to CVC to make a counter offer with no additional bidder being allowed to submit
another competing offer.
On June 18, 2009, the “go-shop” period expired without a counter-offer from CVC.
On September 23, 2009, the European Commission cleared the proposed acquisition under the EU
Merger Regulation concluding “that the transaction would not significantly impede effective competition
in the European Economic Area (EEA) or any substantial part of it”.
On December 1, 2009, BlackRock announced the completion of the merger with BGI.
8
The main strategic reasons for the merger, according to the BlackRock press release from June 11,
2009, were to “bring together market leaders in active and index strategies to create the preeminent asset
management firm” with the “unique ability to combine active, quantitative and index strategies to develop
investment solutions for institutional clients worldwide” and to offer “BlackRock`s global mutual funds
alongside iShares [to] create an unmatched ability to tailor portfolios for retail investors”. Further, “the
combined firm will have unparalleled talent, analytical tools, and scale to deliver liquidity, global
presence, and local market insight to clients.” These considerations are summarized by BlackRock
Chairman and CEO Laurence D. Fink when he says that “We are incredibly excited about the potential to
significantly expand the scale and scope of our work with investors throughout the world.”
Indeed, from these quotes, it is clear that the main drivers behind the acquisition for BlackRock were
strategic motives to expand into the fast-growing segment of ETFs (for which iShares was and still is the
leading platform worldwide), to establish a more global presence as a firm and to reap economies of scale
by aggressively growing assets under management.
Importantly for this study, neither Barclays’ decision to sell BGI nor BlackRock’s decision to buy
BGI is likely caused by the holdings or the characteristics of the holdings of investment funds and ETFs
managed by BGI or BlackRock. Barclays sold BGI to raise capital for its balance sheet in order to
minimize the risk of a bailout by the UK government. BlackRock, and informal conversations with people
familiar with the merger proceedings confirm this, did not seek to merge with BGI in order to indirectly
establish control over firms held in the portfolios of BGI and BlackRock. In other words, BlackRock is
unlikely to have bought BGI in order to become a block-holder in a number of listed firms. Therefore, we
argue that the merger between BlackRock and BGI was exogenous to the aggregate portfolio holdings
and the characteristics of these holdings. This allows us to give a causal interpretation to the effects we
describe in this study.
[Figure I here]
As a first motivation of why the merger between BlackRock and BGI likely impacted stock markets,
we plot the cumulative risk-adjusted returns of stocks with above-median BGI-ownership prior to the
merger and the cumulative risk-adjusted returns of the matching stocks with similar characteristics (the
matching stocks we use in section III) together with the main event dates in figure I.
While the returns on those two portfolios do not significantly differ in the pre-merger period, they
start diverging once BlackRock announces the acquisition of BGI in June 2009. The divergence grows
markedly once the merger receives anti-trust approval. At that point, the returns of stocks with above-
median BGI-ownership prior to the merger drop markedly. After the merger completes in December
2009, the returns of the two portfolios revert to a parallel trend. This suggests that the merger had a strong
impact on stock markets that we will investigate in more detail.

9
II. Data, Main Variables and Empirical Design
A. Data Sources
We obtain our data from several sources. We collect semi-annual (January to June and July to
December) institutional holdings from the FactSet Ownership database. FactSet reports stock-level
holdings for a large variety of institutional investors, such as mutual funds, insurance funds, ETFs and
pension funds as well as the portfolio management company and the ultimate parent company for every
fund. For each semi-annual period, we identify all BlackRock funds as the funds with ultimate parent
“BlackRock Inc.” and Barclays funds as those with ultimate parent “Barclays PLC”.7 To identify BGI
funds that are involved in the merger, we select all funds with ultimate parent “Barclays PLC” in
December 2009 in FactSet that change affiliation and appear with ultimate parent “BlackRock Inc.” in
June 2010. We call these funds “BGI funds” and we cross-check their portfolio management companies
in FactSet in December 2009. We find that all funds are managed in one of eight management companies
with “Barclays Global Investors” in the company name.8 All other institutions and funds are defined to be
unaffiliated with either BlackRock or BGI, we refer to them as “residual institutions” or “residual funds”
and our measures of “residual institutional ownership” are based on this universe.
We complement the holdings information from FactSet with fund-level characteristics from the
Morningstar Global database, section global open-ended funds. The link between FactSet and
Morningstar is as in Chuprinin, Massa, and Schumacher (2015) and updated for the newer sample used
here. From Morningstar, we primarily rely on information on individual fund flows and performance that
we use in the construction of certain variables and tests that are described below.
Finally, we collect information on global stock returns, trading volume and accounting information
from the Thomson DataStream and WorldScope databases. For stock returns and trading volume, we
collect both daily and monthly information that we use in the construction of the different outcome and
explanatory variables.
B. Main Variables
For each stock held by BGI funds prior to the merger, we construct several measures of institutional
ownership. The institutional ownership attributable to BGI funds, 𝐼𝑂 𝐵𝐺𝐼𝑗,𝑡, is defined as the total number
of shares of stock j held by BGI funds in period t divided by shares outstanding of stock j in period t. The
7 We also verify all the direct and indirect subsidiaries of BlackRock using the annual report of subsidiaries of
registrant “BlackRock Inc.” from the SEC Edgar database. 8 Since management company and ultimate parent information is static in FactSet, we rely on multiple
downloads of the database in the years 2008, 2009 and 2010 to identify the correct affiliations over time. The eight
management companies with “Barclays Global Investors” in the company name are different regional subsidiaries
(e.g., North America, UK, Germany, etc.).

10
variable is updated every semi-annual period up to June 2009 but held constant afterwards for every stock
to capture the pre-merger institutional ownership of BGI funds. We refer to this variable as “BGI-
ownership”.
We then compute various measures of residual institutional ownership for stock j. For each residual
fund in each semi-annual period, we compute the change in portfolio weight in stock j as the difference in
portfolio weights between two periods scaled by the average values in these two periods. To aggregate
these portfolio-weight changes to the stock-level, we compute the weighted-average changes in portfolio
weights across all residual funds for each stock. We employ two alternative weighting schemes. First, we
compute the TNA-weighted-average of portfolio weight changes of all residual funds
(𝐶ℎ𝑎𝑛𝑔𝑒 𝐴𝑣𝑔. 𝑃𝑜𝑟𝑡. 𝑊𝑒𝑖𝑔ℎ𝑡𝑗,𝑡 (𝑇𝑁𝐴 𝑤𝑒𝑖𝑔ℎ𝑡𝑒𝑑)). Alternatively, we compute the fund-flow-volatility-
weighted-average of portfolio weight changes of all residual funds
( 𝐶ℎ𝑎𝑛𝑔𝑒 𝐴𝑣𝑔. 𝑃𝑜𝑟𝑡. 𝑊𝑒𝑖𝑔ℎ𝑡𝑗,𝑡 (𝑓𝑙𝑜𝑤 𝑤𝑒𝑖𝑔ℎ𝑡𝑒𝑑) ). Finally, we compute the changes in residual
institutional ownership of each stock as the difference in residual institutional ownership (i.e.,
institutional ownership across all institutions and funds excluding those affiliated with either BlackRock
or BGI) between two periods scaled by the average values of the two periods (𝐶ℎ𝑎𝑛𝑔𝑒 𝑅𝑒𝑠𝑖𝑑𝑢𝑎𝑙 𝐼𝑂𝑗,𝑡).
When we analyze stock market effects in section IV, we define a number of stock-level measures for
liquidity, volatility and returns. We consider three measures of stock returns. First,
𝑀𝑎𝑟𝑘𝑒𝑡 𝑎𝑑𝑗𝑢𝑠𝑡𝑒𝑑 𝑆𝑡𝑜𝑐𝑘 𝑅𝑒𝑡𝑢𝑟𝑛𝑠𝑗,𝑡 are defined as the per period stock return of stock j in excess of the
domestic market return over the same period. Second, 𝑀𝑎𝑟𝑘𝑒𝑡 𝐼𝑛𝑑𝑢𝑠𝑡𝑟𝑦 𝑎𝑑𝑗𝑢𝑠𝑡𝑒𝑑 𝑆𝑡𝑜𝑐𝑘 𝑅𝑒𝑡𝑢𝑟𝑛𝑠𝑗,𝑡 are
defined as the per period stock return of stock j in excess of the return of a domestic industry portfolio
that contains all stocks from the same country of origin and industry as stock j. We use the standard
DataStream industry classification to assign stocks to industries as in Bekaert et al. (2007, 2011). Third,
𝐷𝐺𝑇𝑊 𝑎𝑑𝑗𝑢𝑠𝑡𝑒𝑑 𝑆𝑡𝑜𝑐𝑘 𝑅𝑒𝑡𝑢𝑟𝑛𝑠𝑗,𝑡 are defined as the per period stock return of stock j in excess of the
return of a domestic characteristics-matched portfolio based on size, value and momentum as in Daniel,
Grinblatt, Titman and Wermers (1997).
Next, we consider three measures of stock liquidity. First, 𝐿𝑜𝑔 𝑇𝑟𝑎𝑑𝑖𝑛𝑔 𝑉𝑜𝑙𝑢𝑚𝑒𝑗,𝑡 is defined as the
log of total number of shares traded for stock j in period t multiplied by the beginning of period stock
price. Second, 𝑇𝑢𝑟𝑛𝑜𝑣𝑒𝑟𝑗,𝑡 is defined as the total number of shares traded for stock j in period t divided
by the beginning of period shares outstanding. Third, 𝐴𝑚𝑖ℎ𝑢𝑑𝑗,𝑡 is defined as the Amihud (2002)
measure of stock illiquidity that is computed from daily volume, price and returns data.
Finally, for stock volatility, we consider two measures. First, 𝑉𝑜𝑙𝑎𝑡𝑖𝑙𝑖𝑡𝑦𝑗,𝑡 is defined as the standard
deviation of daily stock returns of stock j in period t. Second, 𝐼𝑑𝑖𝑜𝑠𝑦𝑛𝑐𝑟𝑎𝑡𝑖𝑐 𝑉𝑜𝑙𝑎𝑡𝑖𝑙𝑖𝑡𝑦𝑗,𝑡 is defined as

11
the standard deviation of daily residuals from a first-stage regression of daily excess stock returns on
domestic market, size, value and momentum factors.
We also construct a number of stock level control variables as follows. 𝐶ℎ𝑎𝑛𝑔𝑒 𝐼𝑂 𝐵𝑙𝑎𝑐𝑘𝑅𝑜𝑐𝑘𝑗,𝑡 is
defined as change in institutional ownership in stock j in period t attributable to trades by BlackRock
funds. 𝐶ℎ𝑎𝑛𝑔𝑒 𝑀𝐶𝑎𝑝𝑗,𝑡 is computed as the change in portfolio weight of stock j in the global market
portfolio in period t where the global market portfolio is defined to include all stocks in the WorldScope
database. 𝐿𝑜𝑔 𝑀𝐶𝑎𝑝𝑗,𝑡 is the log of the beginning of period market capitalization of stock j.
𝑃𝑎𝑠𝑡𝑟𝑒𝑡𝑢𝑟𝑛𝑗,𝑡 is the 6-month trailing return of stock j. 𝐿𝑜𝑔 𝐵𝑇𝑀𝑗,𝑡 is the log of the book-to-market ratio
of stock j where we divide book value of equity of the most recent fiscal year end (at least one quarter
lagged) by the beginning of period market capitalization. 𝐷𝑖𝑣𝑖𝑑𝑒𝑛𝑑 𝑌𝑖𝑒𝑙𝑑𝑗,𝑡 is computed as the
percentage dividend yield of stock j. 𝑅𝑂𝐸𝑗,𝑡 is the return on equity of stock j, 𝐿𝑒𝑣𝑒𝑟𝑎𝑔𝑒𝑗,𝑡 is the total
leverage of firm j, and 𝐶𝑎𝑠ℎ𝑗,𝑡 are the total cash holdings of firm j divided by total assets.
[Table I here]
C. Descriptive statistics
In table I, we present descriptive statistics for the sample. In panel A, we report the stock ownership
covered by WorldScope, BlackRock and/or BGI funds prior to the merger. As of June 2009, we have
WorldScope information on 36,660 stocks worldwide; we declare these stocks to be the world market
portfolio for comparison purposes. 7,348 stocks are held by BGI funds prior to the merger (representing
about 69% of world market capitalization), 6,476 stocks are held by BlackRock funds prior to the merger
(representing about 65% of world market capitalization), and 5,497 stocks are held both by BlackRock
and BGI funds prior to the merger (representing about 63% of world market capitalization), all according
to the holdings that we can capture via FactSet. The global 7,348 stocks held by BGI funds prior to the
merger form the main sample on which we perform our tests.
In panel B, we report average stock characteristics – i.e., market capitalization, book-to-market ratio,
daily trading volume and return volatility – over the sample period from June 2008 to June 2010 for all
the stocks covered in WorldScope, the stocks held by BGI funds, the stocks held by BlackRock funds, or
the stocks held both by BGI and BlackRock funds. Comparing with an average stock in the complete
WorldScope universe, we find that the stocks held by either BlackRock funds or BGI funds exhibit
similar characteristics but are substantially larger, more heavily traded and somewhat less volatile
compared to the average stock in WoldScope.
The average stock in the WoldScope universe has a market capitalization of $1.3 billion while the
average stock held by BGI (BlackRock) funds has a market capitalization of $4.2 billion ($4.5 billion).
Likewise, the average WorldScope stock has a daily trading volume of $24 million while the stocks held

12
by BGI or BlackRock funds are more heavily traded with an average daily volume of $70 million and $78
million respectively. For return volatility, the difference is not as pronounced. The average WorldScope
has a daily return volatility of 4.1% while the average stock held by either BGI or BlackRock funds has a
daily return volatility of about 3.5%-3.6%. So overall, our baseline sample of stocks is tilted towards
global, liquid, large-cap stocks. For the sub-sample of stocks held by both BGI and BlackRock funds, we
find that this universe is even more tilted towards large, liquid stocks. The average stock in that sample
has a market capitalization of $5.0 billion and an average daily trading volume of $88 million.
In panel C, we provide descriptive statistics on the holdings coverage we can obtain for both
BlackRock and BGI funds as of June 2009, prior to the merger. For BlackRock, we are able to include
308 different investment funds in the sample. Out of these, only a small proportion is classified as “ETFs”
(30), the rest are classified as non-passive products (278), consistent with the perception that BlackRock
was predominantly a manager of active investment products prior to the merger. This stands in contrast to
BGI funds. We are able to include 333 BGI funds, 302 of which are classified as “ETFs” in FactSet and
only 31 as non-ETFs underlining that BGI was (and is) primarily a manager of passive investment
products.
In terms of assets under management (“AUM”), our coverage of BlackRock funds represents almost
$160 billion as of June 2009. Compared to BlackRock’s annual report, these $160 billion represent about
79% of end-of-2008 equity assets under BlackRock’s custody. For BGI, we capture $306 billion in equity
AUM, representing about 31% of end-of-2008 equity assets under BGI’s custody. Focusing only on
passive AUM associated with ETFs (iShare funds), we capture $267 billion, or about 90% of the June
2009 equity AUM of the iShares unit.
While we can capture the majority of BlackRock’s equity AUM via FactSet, we only capture about a
third of all BGI equity AUM via FactSet. Therefore, we verify this estimate using the 13F filings from
Thomson Reuters and we find the following. For BlackRock, we can capture only $125 billion AUM as
of June 2009 by using 13F filings, so we have a better global coverage of BlackRock holdings using
FactSet. For BGI, we find that BGI is not a filer in 13F. Instead, we can only identify Barclays PLC and
Barclays Bank as 13F filers. Combining these two entities, we are able to capture $530 billion AUM as of
June 2009 for Barclays as a whole.
Inspecting the time-series of Barclays AUM in 13F, we observe a drop in AUM of about $643
billion over the course of 2010 with an almost symmetric increase in AUM for BlackRock in the same
period, suggesting that a large fraction of the reported Barclays AUM in 13F is indeed managed by BGI.
However, while the total AUM of Barclays in 13F is about twice as large as the AUM of BGI in FactSet,
the number of distinct stocks that is covered in 13F is substantially smaller.

13
By using 13F holdings, we are only able to cover 4,664 stocks with Barclays / BGI-ownership as of
June 2009 while our sample based on FactSet ownership covers over 7,300 stocks. The difference is
primarily on the international dimension that we would lose when restricting ourselves to the 13F
universe of stocks. In addition, we find that our measure of BGI-ownership from FactSet holdings is 75%
correlated with the same measure constructed from 13F information in the overlapping sample of stocks
covered by both data sources. This indicates that the difference in coverage mostly affects the level of
institutional ownership. Consequently, we use the FactSet universe of ownership and stocks in our
baseline analysis and we present robustness tests of the main results using 13F data in section V. Overall,
we believe that our level of coverage is sufficiently broad to represent the changes in ownership
concentration that have taken place due to the merger.
D. Empirical Design
The main empirical design we employ in this study is a difference-in-difference estimation with a
continuous treatment variable. The unit of observation is a stock in a given time period and the treatment
is defined as institutional ownership attributable to BGI funds prior to the merger – i.e., as of June 2009 in
the baseline specification. In its most general form, we estimate the following model:
𝑦𝑗,𝑡 = 𝛽1𝐼𝑂𝑗,𝐵𝐺𝐼,2009 + 𝛽2𝐷𝑡 + 𝛽3𝐼𝑂𝑗,𝐵𝐺𝐼,2009 × 𝐷𝑡 + 𝛾1′ 𝑋𝑗,𝑡 + 𝛾2′(𝑋𝑗,𝑡 × 𝐷𝑡) + 𝛼𝑡 + 𝛼𝑗 + 𝜖𝑗,𝑡. (1)
The variable 𝑦𝑖,𝑡 is the outcome variable of interest for stock j in period t. These include measures of
residual institutional ownership, returns, liquidity, and volatility. The main explanatory variable is
𝐼𝑂𝑗,𝐵𝐺𝐼,2009, the institutional ownership attributable to BGI funds (“BGI-ownership”). The variable is
measured period-by-period at semi-annual frequency up to June 2009. For all observations following June
2009, the variable remains constant for every stock j (see explanation below). When the outcome variable
is a measure of institutional ownership, equation (1) is estimated at the semi-annual frequency because
holdings are available only every six months. When the outcome variable is another stock characteristic,
equation (1) is estimated at the monthly frequency.
The variable 𝐷𝑡 is a dummy (or a set of dummies) that indicate the different stages in the merger
process. Depending on the test, we define these periods with different degrees of granularity. Specifically,
to operationalize the timeline of events that led to the merger, we define a number of event periods that
we use in our regression designs. Figure II summarizes these different stages in the merger process.
[Figure II here]
In section III, where we examine the portfolio decisions of institutions other than BlackRock and
BGI and where we rely on semi-annual portfolio holdings, we use timelines 1 and 2 in the figure that are
based on semi-annual observations. In the coarsest specification (timeline 1), we split the time-series into
14
two equal parts in June 2009. We call the period prior to June 2009 the “Pre-merger” period and the
period after the “Post-merger” period. We refine timeline 1 by splitting both the pre- and the post-merger
periods in two equal parts. We label the period from June 2008 to December 2008 the “Pre-CVC” period,
the following six months to June 2009 the “CVC” period, the following six months to December 2009 the
“Merger” period and the final six months to June 2010 the “Completion” period.
In section IV, where we examine the impact of the merger on global stock characteristics at the
monthly frequency, we employ a more granular definition to capture the evolution of events. Timeline 3
in figure II displays this definition. We code the period from June 2008 to February 2009 as the “Pre-
merger” period, the month of March 2009 as the “iShares for Sale” period, the period of April 2009 to
May 2009 as the “CVC” period, the period from June 2009 to August 2009 as the “BlackRock offer”
period, the period September 2009 to November 2009 as the “Anti-trust approval” period, and the period
starting December 2009 until the end of the sample as the “Completion” period.
This granular specification will allow us to exactly capture when the different stock market effects
manifest themselves and to control for the evolution of market expectations as the nature of the likely
buyer and the resulting implications changed from the first designated buyer CVC (a private equity firm)
to the second and final buyer BlackRock (an asset management firm).
Since the BlackRock-BGI merger took place in 2009 and evolved over a period of almost 9 months,
we choose a baseline event window of 2 years (June 2008 to June 2010) for the estimation. This assures
that we have a meaningful pre-event period (June 2008 to March 2009) that is not contaminated by the
merger as well as a post event period (December 2009 to June 2009) that is sufficiently long to examine
post-event reversals. Choosing a shorter event window is likely problematic because of the lengthy
merger process and the need to compare the merger effects to a pre-merger period. In contrast, longer
event windows can be informative because a) the pre-merger period includes beginning of the 2008
financial crisis and b) any post-merger reversals could take more time to manifest themselves. We
therefore experiment with alternative event windows of either 3 years (January 2008 to December 2010)
or 5 years (January 2007 to December 2011). Our main conclusions are unchanged in these tests, they are
available on request.
The main coefficient of interest in equation (1) is 𝛽3 , the coefficient on the interaction term
𝐼𝑂𝑗,𝐵𝐺𝐼,2009 × 𝐷𝑡 . It measures the treatment effect. In the estimation, we also include a number of
covariates as control variables in the vector 𝑋𝑗,𝑡 as well as the interaction terms between these covariates
and the event indicators 𝐷𝑡. We also augment the specification with different fixed effects (time t, stock j
or, alternatively, country c and industry i) to ensure we are not measuring generic differences in the
outcome variables across stocks or time periods. Finally, to control for the impact of residual,
unobservable shocks that may affect stocks from the same country in the same industry in a given period,

15
we draw inference from standard errors that are clustered at the country-industry-period level. These are
all effective ways of controlling that any measured effect can be attributed to the main variable of interest.
The main treatment variable 𝐼𝑂𝑗,𝐵𝐺𝐼,2009, the institutional ownership attributable to BGI funds prior
to the merger, remains constant for every stock j after June 2009. We do this for a number of reasons.
First, we use the pre-merger value of this variable to capture the information that was likely available to
market participants at the time in order to assess the impact of the change in ownership concentration that
will take place once the merger completes. The institutional ownership attributable to BGI funds is
perhaps the most direct estimate by how much the institutional ownership of BlackRock in stock j is
going to increase after the merger.
Moreover, econometrically, the use of the pre-merger value of 𝐼𝑂𝑗,𝐵𝐺𝐼 is further desirable because
the variable is pre-determined and does not vary with common, unobservable shocks to the outcome
variable of stock j. This is especially useful in our analysis of peer effects in which the outcome variables
are measures of institutional ownership that exclude the ownership attributable to BGI or BlackRock. As
pointed out by Manski (1993), regressing group behavior on individual behavior (or vice versa) gives rise
to the reflection problem. Using a pre-determined regressor is one part of our strategy to address this
problem (Angrist and Pischke (2008), section 4.6.2).9
As argued above, the most important part of our identification strategy is the exclusion restriction
that BlackRock did not acquire BGI in order to increase its institutional ownership in the stocks common
to BlackRock and BGI portfolios or in anticipation of the investment behavior of competing investors or
the evolution of the stock characteristics that we examine. We believe that this is a plausible claim as the
main driver of the acquisition was Barclays’ need to raise capital and BlackRock’s motive to enter the
growing market for passive investment products (ETFs).
III. Peer Effects: The Responses of Institutional Investors to the Merger
The “fire sales risk hypothesis” predicts that institutions re-balance away from stocks that experience
a large increase in ownership concentration to avoid any future exposure to idiosyncratic shocks to
BlackRock (e.g., future fire sales). The alternative “information hypothesis” predicts that institutions re-
balance towards affected stocks because the increased presence of BlackRock sends a positive signal
about the quality of the firm. Therefore, we start by analyzing the investment responses of institutional
investors to the BlackRock-BGI merger. Then, we investigate the cross-sectional variation of this
9 In robustness tests, we define the institutional ownership attributable to BGI funds as of June 2008, a full year
prior to BlackRock’s announcement to acquire BGI. We find that our results hold even under this very conservative
specification, we discuss these tests in section V.

16
behavior for different institutional investors. Finally, we analyze if and how the re-balancing activities in
stocks held by BGI funds prior to the merger affects other stocks not held by BGI funds.
A. Peer Effects
Before estimating the full specification of equation (1), we start with a simple cross-sectional
analysis, in which we regress changes in residual institutional ownership for each stock j over the second
half of 2009 (June to December) on the level of institutional ownership attributable to BGI funds prior to
the merger (i.e., as of June 2009), a set of control variables, as well as fixed effects.
[Table II here]
The results are reported in table II, panel A. We find a strong negative correlation between the
change in institutional ownership around the event and the level of BGI-ownership prior to the merger.
This holds across specifications and is robust to the inclusion of control variables (column 2), fixed
effects (column 3) and different measures of residual institutional ownership (columns 4 and 5). These
simple specifications already indicate significant economic peer effects in the investment behavior of
institutional investors. The rate of change in the average portfolio weights of stocks falls by about 3.6
(column 3) to 4.7%-age points (column 4) points per STD of BGI-ownership prior to the merger. This
leads to a fall in the growth rate or residual institutional ownership of 2%-age points per STD of BGI-
ownership prior to the merger (column 5). This first result supports the “fire sales risk hypothesis” and
suggests that the fear of future fire sales induces institutions to re-balance away from stocks that
experience a large increase in ownership concentration due to the merger.
In panel B of table II, we estimate a full difference-in-difference specification of equation (1) on a
semi-annual panel. This panel regression includes four semi-annual periods and we employ timeline 1 of
figure II to split the time series into two equal parts. Specifically, the indicator variable Dt is labelled
“Post-Merger” and equals 1 for the two semi-annual periods after the merger (i.e., June 2009 to June
2010) and 0 otherwise. The estimates confirm and strengthen the results in panel A. We find that the
interaction term IO BGI x Post-Merger is negative and highly significant in all specifications. The
estimates in column (1) include interacted controls with the Post-Merger dummy, country and industry
fixed effects and confirm the effects from panel A. The rate of change in the average portfolio weights of
stocks falls by about 4.4%-age points per STD of BGI-ownership prior to the merger.
In column 2, we add time fixed effects to the specification in column 1. In column 3, we also interact
the country and industry fixed effects with the Post-Merger dummy in order to assess if the changes in the
post-merger period are not stock-specific but country- or industry-specific. The results remain intact. In
column 4, we replace the country and industry fixed effects by stock fixed effects and the results hold
again. Taken together, these results suggest that our findings are not driven by generic differences across

17
stocks, industries, countries or time periods. In column 5, when we use the flow-weighted measure of
institutional ownership, we find a fall in the rate of change of average portfolio weight of 7.2%-age points
per STD of BGI-ownership prior to the merger. Finally, column 6 shows that this translates into a 1.5%-
age points lower growth rate of residual institutional ownership, significant at the 1%-level.
In panel C of table II, we re-estimate equation (1) using the more granular timeline 2 of figure II in
order to better identify the period when the reduction in residual institutional ownership mostly takes
place. Across all the specifications, we find that the interaction term IO BGI x Merger is negative and
highly significant in all specifications. This is robust to different fixed effects specifications (columns 1 to
4) and different measures of residual institutional ownership (columns 5 and 6).
In the same panel, we test for reversals in institutional ownership by including the interaction term
IO BGI x Completion. Any evidence of reversals in residual institutional ownership could imply that the
documented effects are driven by e.g., front-running of competing institutions in anticipation of merger-
related rebalancing of BlackRock (e.g., motivated by internal risk-management reasons). We find no
evidence that the drop in residual institutional ownership reverses in the first six months of 2010, the
interaction term IO BGI x Completion is either negative or insignificant. Therefore, front running of
competing institutions in anticipation of possibly risk-management induced sales by BlackRock after
merger do not seem to explain our results.
The full difference-in-difference estimates also confirm the economic magnitude of the effect. The
rate of change in the average portfolio weights of stocks falls by about 4.1%-age points (column 4) per
STD of BGI-ownership prior to the merger in the period June to December 2009. In column 5, when we
use the flow-weighted measure of institutional ownership, we find that this decrease in the rate of change
reaches up to 9.7%-age points per STD of BGI-ownership, indicating that institutions with volatile flows
respond more aggressively to the event. Taken together, this leads to a fall in the growth rate or residual
institutional ownership of 2.5%-age points per STD of BGI-ownership prior to the merger (column 6),
significant at the 1%-level.
[Table III here]
In table III, we perform a number of sample splits to assess the robustness of our results. We
hypothesize that if institutions re-balance in order to avoid the risk of future fire sales, then the results of
table II should be concentrated in the stocks that are also held by BlackRock funds prior to the merger. In
columns 1 and 2, we indeed find such evidence. The effect is concentrated in stocks that are also held by
BlackRock funds, there is no effect in stocks that are not held by BlackRock funds prior to the merger.
This is in line with our expectation that the effect on institutional investors is triggered by the increase in
ownership concentration, not by the transfer of ownership.

18
In columns 3 and 4, we split the sample by the stocks in which BlackRock funds increased (did not
increased) their position prior the merger. We do this to verify our exclusion restriction that BlackRock
did not acquire BGI in anticipation of any capital market effects of the stocks held in BGI portfolios. We
find that the effects are concentrated in the stocks that are not bought by BlackRock before the merger,
which supports our exclusion restriction that BlackRock-BGI merger represents an exogenous event for
identifying increase in ownership concentration.
We further split our sample on the basis of median stock liquidity (measured by stock turnover) or
market capitalization. We expect that illiquid and small-cap stocks are more vulnerable to possible future
fire sales. Therefore, the re-balancing of institutional ownership should be more pronounced for illiquid
and small-cap stocks. And indeed, we find supporting evidence for this conjecture. The relative change in
portfolio weights is concentrated in illiquid stocks with low stock turnover (column 5 and column 6) and
in small-cap stocks (column 7 and column 8). These two splits further support the “fire sale risk
hypothesis” and are difficult to reconcile with the alternative “information hypothesis”.
B. Heterogeneity in the Responses Across Different Institutions
In this subsection, we examine how different institutional investors respond to the increases in
ownership concentration depending on their demand for liquidity, their investment horizon and their
informedness. We expect that institutional investors who hold the affected stocks for liquidity reasons are
more vulnerable to potential future fire sales and therefore respond more aggressively. Also, we expect
informed investors to be less likely to re-balance away from affected stocks as it would mean giving up
on their information.
To operationalize these conjectures, we define different measures to proxy for an investors’
sensitivity to potential future fire sales, the investment horizon and the level of informedness. To capture
institutional investors that have stronger demand for liquidity, we use two measures: fund-flow-volatility
and flow-performance-sensitivity. Fund-flow-volatility is computed as the standard deviation of fund
flows over the past 12 months. The flow-performance-sensitivity is estimated fund-by-fund by regressing
monthly flows on lagged fund performance (in excess of the benchmark), squared lagged fund
performance and standard fund controls. Our measure of flow-performance sensitivity is the coefficient
on lagged fund performance from these regressions.10
We conjecture that institutional investors with more
volatile flows or whose investors are more likely to redeem shares due to bad performance place a greater
emphasis to avoid the risk of future fire sales (Chen, Goldstein and Jiang (2013)). We therefore split
institutions by the median on these two measures.
10
For these two tests, we rely on fund performance and flows that we obtain from Morningstar.
19
To capture the investment horizon, we follow Gaspar, Massa and Matos (2005) and Yan and Zhang
(2009) who use portfolio turnover to measure investment horizon. We sort institutions in to short-term
and long-term institutions based on the median portfolio turnover. To capture the informedness of
institutional investors, we use portfolio concentration of funds (Kacperczyk, Sialm and Zheng (2005)).
We separate institutions into two groups based on the median value of their portfolio concentration.
[Table IV here]
The results are presented in table IV. They show that institutional investors with higher fund-flow-
volatility re-balance away more aggressively from the affected stocks. For institutional investors with
above-median volatility of flows, the negative effect of BGI-ownership on changes in portfolio weights is
more than twice as strong in the post-merger period compared to institutions with below-median volatility
of flows. In columns 3 and 4, we split institutional investors by their flow-performance sensitivity to
capture the same intuition. In line with our expectations, we find that institutional investors with high
flow-performance sensitivity respond more aggressively to changes in ownership concentration in their
portfolios. For such investors, the effect is over 50% stronger than for those with below-median levels of
flow-performance sensitivity.
In the remaining columns, we split institutions on the basis of investment horizon and informedness.
In columns 5 and 6, we find that institutions with a long-term investment horizon have a marginally
weaker response to changes in ownership concentration compared to short-term focused institutions. In
columns 7 and 8, we find that the re-balancing effect is concentrated in the sample of institutions with less
concentrated portfolios. Prior literature has shown how portfolio concentration is associated with superior
performance and information. As such, this sample split is in line with the intuition that informed
investors are less likely to give up their information on affected stocks.
C. Migration of Institutional Ownership
We now look at whether residual institutional ownership is re-allocated to comparable stocks that are
not held by BGI funds prior to the merger. We perform this test for two reasons. First, many institutions
have a mandate to stay invested. Therefore, re-balancing a position should lead to an offsetting action in
the near future as institutional investors are unlikely to simply accumulate cash holdings. Second, many
institutional investors are benchmarked to various market indices. Re-balancing a position could lead to a
larger tracking error relative to the benchmark. To avoid an unwanted tracking error, the investor will
need to reinvest the proceeds in a “similar” stock – i.e., one that that does not necessarily increase the
tracking error with respect to the benchmark. For these reasons, we speculate that the documented peer
effects of the previous subsections led to a migration of institutional ownership to comparable stocks.

20
To identify such comparable stocks, we employ three different matching algorithms. All matching
stocks come from the pool of stocks that are not held by any BGI fund prior to the merger (or are in the
lowest decile of BGI’s holdings). The first algorithm (“MATCH 1”) matches every stock held by BGI
funds prior to the merger with a corresponding stock from the same country of origin, within the same
industry, and that is closest in market capitalization in the same month. The second algorithm (“MATCH
2”) amends MATCH 1 by matching every stock held by BGI funds prior to the merger with a stock from
the same country of origin, within the same industry, that is closest in terms of market capitalization and
book-to-market using a distance measure. The third algorithm (“MATCH 3”) amends MATCH 2 by
adding the total institutional ownership in the distance measure to select the matching stock. 11
[Table V here]
We report the results in table V. We first sort all stocks held by BGI funds prior to the merger into
five quintiles based on the level of IO BGI and then we compare the average semi-annual change (from
June 2009 to December 2009) in each measure of residual institutional ownership of stocks held by BGI
funds with that of the matching stocks. In the column “Actual Stocks”, we report the results of the
average semi-annual change in residual institutional ownership for all stocks held by BGI funds, for the
quintile of lowest BGI-ownership and the quintile of highest BGI-ownership. The columns entitled
“Matched Stock” display the same average change for the matching stocks. Then, we test the difference
of change in residual ownership between “Actual Stocks” and “Matched Stocks” and report the testing
results in the column “Match – Actual”.
The results show institutional ownership generally increases in the second half of 2009, presumably
in the aftermath of the financial crisis when institutional investors started re-balancing back into stock
markets overall. However, matching stocks on average experience a much sharper increase in ownership
than “Actual Stocks” around the BlackRock-BGI merger (from June 2009 to December 2009). The
testing results confirm that the differences between matched stocks and actual stocks (“Match – Actual”)
are overwhelmingly positive and statistically significant across the three matches. The average difference
in the rate of change of residual institutional ownership between matched stocks and BGI stocks ranges
from 2.4 to 11.6%-age points.
Furthermore, the drastic differences between the two groups are mostly concentrated in the top
quintile of actual BGI-ownership (i.e., the rows labelled “High BGI IO Quintile”). For those stocks, the
differences range from 8 to 29%-age points, suggesting that institutional investors re-balance away more
aggressively from stocks in the top quintile of BGI-ownership than from those in the bottom quintile of
11
The distance measure for MATCH 2 (MATCH 3) is computed as follows, 𝐷𝑖𝑠𝑡𝑎𝑛𝑐𝑒 =(𝑆𝑖𝑧𝑒𝑠−𝑆𝑖𝑧𝑒𝑚)2
0.5 ×(𝑆𝑖𝑧𝑒𝑠+𝑆𝑖𝑧𝑒𝑚)+
(𝐵𝑀𝑠−𝐵𝑀𝑚)2
0.5×(𝐵𝑀𝑠+𝐵𝑀𝑚) (𝐷𝑖𝑠𝑡𝑎𝑛𝑐𝑒 =
(𝑆𝑖𝑧𝑒𝑠−𝑆𝑖𝑧𝑒𝑚)2
0.5 ×(𝑆𝑖𝑧𝑒𝑠+𝑆𝑖𝑧𝑒𝑚)+
(𝐵𝑀𝑠−𝐵𝑀𝑚)2
0.5×(𝐵𝑀𝑠+𝐵𝑀𝑚)+
(𝐼𝑂𝑠−𝐼𝑂𝑚)2
0.5×(𝐼𝑂𝑠+𝐼𝑂𝑚)).

21
BGI-ownership (for which we detect no differences in the changes in residual institutional ownership).
The migration of institutional ownership is in line with the “fire sales risk hypothesis” and further rejects
the alternative hypothesis that institutional investors re-balance towards stocks with high BGI-ownership
due to a signaling effect.
IV. Stock Market Effects: Returns, Liquidity, and Volatility
In this section, we examine the effects of the BlackRock-BGI merger on the stock market. The peer
effects we identify in the previous section are consistent with the “fire sales hypothesis”. Under this
hypothesis, the motive to re-balance away from stocks that experience an exogenous increase in
ownership concentration due to the merger is driven by fear of future, idiosyncratic shocks to BlackRock
(e.g., the risk of future fire sales). This should lead to a negative stock price reaction. Also, as argued
above, both stock liquidity and volatility should decline. The alternative “information hypothesis”
predicts the reverse effects.
We test these predictions by modifying equation (1) in three ways. First, we expand our panel to the
monthly frequency since we can observe global stock characteristics at a higher frequency. Second, we
employ the more granular monthly timeline 3 (see figure II) to more precisely capture the evolution of
events. Third, we use as outcome variables measures of stock returns, liquidity, and volatility.
A. Return Effects
The first stock characteristics that we study are risk-adjusted returns. We ask if the strategic re-
balancing away from affected stocks exerts negative price pressure on those stocks. To test the conjecture,
we use risk-adjusted stock returns as dependent variable in equation (1). We adjust monthly stock returns
by either subtracting domestic market returns (the variable Market-adjusted Stock Return), the return on a
domestic size-value-momentum characteristic-matched benchmark portfolio (the variable DGTW-
adjusted Return) or the return on a domestic industry portfolio (the variable Market-Industry adjusted
Return).
[Table VI here]
We present the results in table VI. Panel A uses the full sample of stocks. We find a strong negative
effect of the variable IO BGI in the months after the merger receives anti-trust approval (the coefficient
on IO BGI x Anti-trust is highly significant and negative). The effect is robust to country and industry
fixed effects (column 1), alternative stock fixed effects (column 2), as well as additional time fixed effects
(columns 3 and 4). This again means we are not picking up general differences in returns across countries,
industries, stocks, or time periods.

22
In column 5, we control for the impact of residual institutional ownership on stock returns
throughout the merger. This is an important control because our main variable of interest IO BGI could
simply be a noisy proxy for high overall institutional ownership in the stocks. If this were the case, the
significance on the interaction terms should migrate to the newly added control variables. We find that
this is not the case; the impact of the BlackRock-BGI merger on stock returns is robust.
In column 6, we test if the return effect is permanent in nature of if it reverts once the merger
completes. We add to the specification the interaction term IO BGI x Completion to test for potential
reversals in the period after the merger is completed. We find that returns do not significantly recover in
the period after the merger.
In column 7, we use the full set of event indicators, starting from the initial Barclays announcement
that the iShares unit is for sale up to the completion of the merger. Even this full set of controls does not
change the result that returns of high BGI-ownership stocks are low in the months after the merger
receives anti-trust approval from the European Commission.
Also, we find the effect not only statistically but also economically significant. From the estimates of
column 7, 8, or 9, we estimate an abnormal negative risk-adjusted return of between 61 bps and 95 bps
per month in the three months following the anti-trust approval per STD of BGI-ownership prior to the
merger. This corresponds to a cumulative abnormal negative return of up to 3% over a three-month period
that does not fully revert in the months following the completion of the merger.
In panel B of table VI, we present the same sample splits as above. The negative return effect is
entirely concentrated in stocks that were held by BlackRock funds prior to the merger (column 1 and
column 2), is present for stocks bought or not bought by BlackRock funds prior to the merger (columns 3
and 4) but almost twice as strong in illiquid stocks (columns 5 and 6) and 30% stronger in small-cap vs
large-cap stocks (columns 7 and 8).
B. Liquidity Effects
We now turn to the effect of the merger on stock liquidity. As baseline measure of stock liquidity we
use the Amihud (2002) measure of illiquidity that we construct using daily stock returns and trading
volume data. Alternatively, we use variable Turnover, defined as the total number of shares traded of
stock j in month t divided by beginning-of-month shares outstanding, or the log of total monthly dollar
trading volume in stock j in month t (the variable Log Trading Volume).
[Table VII here]
Table VII presents the results. Panel A of the table shows that stock liquidity deteriorates markedly
over the course of the merger for stocks that experience a large increase in ownership concentration. The

23
coefficients on the interaction terms IO BGI x BR Offer and IO BGI x Anti-trust are positive and highly
statistically significant, indicating higher levels of stock illiquidity based on the Amihud (2002) measure.
As before, this effect is robust to all the fixed effect specifications, controls of residual institutional
ownership or the most granular event timeline. In columns 8 and 9, we replace the measure of stock
liquidity and use stock turnover or trading volume as alternative measures. The two measures give
consistent results. Stock liquidity deteriorates during the merger process, primarily once BlackRock enters
the merger process. None of the measures detect any evidence of reversals in stock liquidity after the
merger completes.
The liquidity effects we estimate are not only statistically significant but also economically
meaningful. The estimates from columns 7 to 9 imply that liquidity deteriorates by about 0.10 STDs
(column 7, liquidity measure is Amihud), 0.04 STDs (column 8, liquidity measures is Turnover), or 0.06
STDs (column 8, liquidity measures is Log Trading Volume) per STD of BGI-ownership prior to the
merger.
In panel B of table VII, we perform the same sample splits as before. In columns 1 and 2, we split
the sample on pre-merger institutional ownership attributable to BlackRock funds. We find that the
deterioration in stock liquidity is only present in stocks for which there is overlap in the pre-merger
portfolios of BlackRock and BGI funds and for which ownership concentration effectively increased as a
result of the merger. For stocks not held by BlackRock funds prior to the merger, we find no effect on
stock liquidity. In columns 3 and 4, we split the sample by the stocks in which BlackRock funds increased
their position prior the merger. We find a negative liquidity effect in both subsamples. In the remaining
columns, we split the sample into high and low liquidity stocks (columns 5 and 6) and small- and large-
cap stocks (columns 7 and 8) with again stronger effects for small-cap and less liquid stocks.
C. Volatility Effects
Finally, we turn to the third stock characteristic: volatility. Under the “fire sales risk hypothesis”,
stock volatility should decrease following the merger because of a lower presence of liquidity traders that
re-balance away from the stock more than informed investors. The market microstructure literature
suggests that this leads to lower volatility.
[Table VIII here]
We present the result in table VIII. Columns 1 to 5 in panel A use as dependent variable Volatility,
defined as the standard deviation of daily stock returns during the month, while columns 6 to 9 use
Idiosyncratic Volatility, defined as the standard deviation of residuals from a regression of daily excess
stock returns on domestic market, size, value and momentum factors.

24
As in the previous subsection, the results support the “fire sale risk hypothesis”. Volatility declines
markedly throughout the merger process, and especially once BlackRock enters the picture in the second
half of 2009. This is consistent with the effect described in the market microstructure literature that links
stock volatility to the presence of liquidity traders and to our results in section III that show a decrease in
residual institutional ownership that is especially strong for institutions and funds with characteristics of
such liquidity traders. The specifications we present mirror the ones of the previous subsection. The
negative effect of the merger on the volatility of stocks that experience an exogenous increase in
ownership concentration is robust to the inclusion of fixed effects (country, industry, stock, or time), to
controlling for residual institutional ownership, possible reversals after the merger is completed, the
granular definition of the event timeline and to both measures of stock volatility.
The economic effect associated with the estimates in panel A is again economically sizeable. From
the estimates of column 5 (9), we estimate a 0.03 STDs (0.07 STDs) decrease in volatility (idiosyncratic
volatility) in the months after the merger receives anti-trust approval per STD of BGI-ownership prior to
the merger. However, the effect is already detectable in the two months prior to that when BlackRock
announces its offer to buy BGI.
In panel B of table VII, we present the same sample splits as in the previous table and find the same
patterns. The effect is concentrated in the stocks also held by BlackRock funds prior to the merger, is
present in both stocks that BlackRock funds bought or sold prior to the merger and is stronger in illiquid
and small-cap stocks.
V. Discussion and Robustness Tests
In this section, we present two additional robustness tests and further discuss our results. First, we
implement the main tests using alternative institutional ownership information from 13F filings as
indicated in section II. Second, we exploit the fact that our measure of BGI-ownership relies primarily on
passive holdings of iShares funds. This allows us to implement a more conservative specification in
which we define BGI-ownership as of June 2008, a full year prior to BlackRock’s offer for BGI.
A. Replication using 13F ownership information
As discussed in section II, we construct alternative proxies for institutional ownership due to
BlackRock or BGI funds using 13F filings. However, doing so has a few drawbacks. First, we have lower
coverage of BlackRock AUM in 13F relative to FactSet. Second, BGI itself is not a filer in 13F, only its
parent Barclays PLC (and Barclays Bank) that has various subsidiaries that could have holdings that are
not impacted by the merger. Third, the universe of stocks with BGI-ownership as of June 2009 covered in

25
13F is substantially smaller compared to our global sample from FactSet (4,664 stocks vs. over 7,300
stocks), primarily due to the lack of coverage of international stocks in 13F.
However, these alternative proxies also have potential benefits: the AUM of Barclays that we can
capture via 13F is about twice the AUM of BGI that we can capture via FactSet. Also, the time-series of
Barclays AUM in 13F suggests that most of the Barclays AUM can be attributed to institutional holdings
of BGI because Barclays AUM drops sharply in 2010 with an almost symmetric increase in BlackRock’s
AUM. Therefore, conditional on the stocks covered in 13F, we estimate a higher level of institutional
ownership (about twice as high given that we capture about twice the AUM), presumably because 13F
filings include all institutional holdings (including special and institutional accounts) while FactSet
mostly covers the holdings of iShares funds and a few active products.
However, as indicated in section II, we find that our measure of BGI-ownership constructed from
13F filings is 75% correlated with the same measure constructed from FactSet holdings. So the difference
between the two is largely in the level of ownership, suggesting that there is no systematic bias in the
composition ownership conditional on the stocks covered in 13F.
[Table IX here]
We present the results based on this alternative data source in table IX. We present estimates on the
overlapping sample between the universe of stocks we capture via FactSet and the universe we capture
via 13F (3,299 of stocks or about 82% of the market cap of the 13F sample of BGI-held stock as of June
2009).12
We find that all our main conclusions hold.
B. Defining BGI-ownership as of June 2008
In our second robustness tests, we exploit a benefit of the holdings information from FactSet. Since
we capture primarily the BGI-ownership due to iShares ETFs and since these ETFs are largely passive,
we compute the institutional ownership attributable to BGI funds as of June 2008 for each stock and hold
the measure constant for every stock throughout the entire sample period. We do this because the
portfolio composition of ETFs is fairly stable over time. Therefore, inflows or outflows into ETFs will
change the level of BGI-ownership but will have little impact on the cross-sectional variation of the
variable. This means that even a longer lag of BGI-ownership can serve as proxy for the changes in
ownership concentration that took place because of the merger. In addition, using BGI-ownership as of
June 2008, a full year prior to BlackRock’s announcement to purchase BGI, addresses any residual
concerns that unobservable common shocks could impact both our outcome and explanatory variables.
[Table X here]
12
The sample of stocks with BGI-ownership in 13F filings that we do not cover with FactSet holdings is tilted
towards small-cap stocks. Since all our sample splits indicate the results are stronger for small-cap stocks, we
believe that this robustness test is conservative.

26
We present these robustness tests in table X. The table is structured as the previous tests in table IX.
Again all our main results hold with the new definition of the explanatory variable IO BGI.
VI. Conclusion
We study how the investment behavior of institutional investors is affected by their strategic reaction
to changes in the degree of ownership concentration and how this affects the stock market. We argue that
investors are careful to hold stocks with concentrated ownership as these expose them to idiosyncratic
shocks of the large owner. Such positions expose investors to the risk of future fire sales. This
precautionary behavior is particularly pronounced for liquidity-driven investors who have a stronger
motive to re-balance away from such stocks. This leads to lower stock prices, liquidity, and volatility.
We test this hypothesis using the acquisition of Barclays Global Investors by BlackRock as an event
that exogenously changes the degree of ownership concentration in the global cross-section of stocks. We
provide evidence consistent with strategic investment behavior and its associated impact on the stock
market. Residual institutional ownership for stocks with a large increase in ownership concentration due
to the merger drops after the merger relative to other stocks and migrates to otherwise comparable stocks.
The same stocks also experience a decline in returns, liquidity, and volatility.
Our results have important implications because they clarify the impact of concentrated ownership
on stock markets and because they suggest that large asset managers may have systemic risk implications.
Our results suggest that the presence of large asset managers can reduce stock volatility at the expense of
lowering liquidity.

27
References
Angrist, Joshua D. and Joern-Steffen Pischke, 2008, Mostly Harmless Econometrics: An Empiricists Companion,
Princeton University Press.
Amihud, Yakov, 2002, Illiquidity and Stock Returns: Cross-Section and Time-Series Effects, Journal of Financial
Markets 5, 31-56.
Azar, Jose, Martin C. Schmalz, and Isabel Tecu, 2015, Anti-Competitive Effects of Common Ownership, Working
Paper, Ross School of Business. http://papers.ssrn.com/sol3/papers.cfm?abstract_id=2427345
Back, Kerry, 1992, Insider Trading in Continuous Time, Review of Financial Studies 5, 387–409.
Back, Kerry, Henry Cao, and Gregory Willard, 2000, Imperfect Competition among Informed Traders, Journal of
Finance 55, 2117–2155.
Bekaert, Geert, Campbell R. Harvey, Christian Lundblad, and Stephan Siegel, 2007, Global Growth Opportunities
and Market Integration, Journal of Finance 62, 1081-1137.
Bekaert, Geert, Campbell R. Harvey, Christian Lundblad, and Stephan Siegel, 2011, What segments equity markets,
Review of Financial Studies 24, 3841-3890.
Bernardo, Antonio E. and Ivo Welch, 2004, Liquidity and Financial Market Runs, Quarterly Journal of Economics
119, 135-158.
Black, Fisher, 1986, Noise, Journal of Finance 41, 529–543.
Bulow, Jeremy I., John D. Geanakoplos, and Paul D. Klemperer, 1985, Multimarket Oligopoly: Strategic Substitutes
and Complements, Journal of Political Economy 93, 488-511.
Carlsson, Hans and Eric van Damme, 1993, Global Games and Equilibrium Selection, Econometrica 61, 989-1018.
Chordia, Tarun and Avanidhar Subrahmanyam, 2004, Order Imbalance and Individual Stock Returns: Theory and
Evidence, Journal of Financial Economics 72, 485-518.
Chen, Qi, Itay Goldstein and Wei Jiang, 2010, Payoff Complementarities and Financial Fragility: Evidence from
Mutual Fund Outflows, Journal of Financial Economics, 97, 239-262.
Chuprinin, Oleg, Massimo Massa and David Schumacher, 2015, Outsourcing in the International Mutual Fund
Industry: An Equilibrium View, Journal of Finance, forthcoming.
Corsetti, Giancarlo, Amil Dasgupta, Stephen Morris, and Hyun S. Shin, 2004, Does One Soros Make a Difference?
A Theory of Currency Crises with Large and Small Traders, Review of Economic Studies 71, 87-113.
Coval, Joshua D. and Erik Stafford, 2007, Asset Fire Sales (and Purchases) in Equity Markets, Journal of Financial
Economics 86, 479-512.
Daniel, Kent, Mark Grinblatt, Sheridan Titman, and Russ Wermers, 1997, Measuring Mutual Fund Performance
with Characteristic-based Benchmarks, Journal of Finance 52, 1035-1058.
Dasgupta, Amil, 2004, Financial Contagion through Capital Connections: A Model of the Origin and Spread of
Bank Panics, Journal of the European Economic Association 2, 1049-1084.
Diamond, Douglas W. and Philip H. Dybvig, 1983, Bank Runs, Deposit Insurance, and Liquidity, Journal of
Political Economy 91, 401-419.
Ellul, Andrew, Pab Jotikasthira, and Christian T. Lundblad, 2010, Regulatory Pressure and Fire Sales in the
Corporate Bond Market, Journal of Financial Economics 101, 596-620.
Gaspar, Jose-Miguel, Massimo Massa, and Pedro Matos, 2005, Shareholder investment horizons and the market for
corporate control, Journal of Financial Economics 76, 135-165.
Goldstein, Itay, and Ady Pauzner, 2004, Contagion of Self-fulfilling Financial Crises Due to Diversification of
Investment Portfolios, Journal of Economic Theory 119, 151-183.

28
Goldstein, Itay, and Ady Pauzner, 2005, Demand-Deposit Contracts and the Probability of Bank Runs, Journal of
Finance 60, 1293-1328.
Greenwood, Robin and David Thesmar, 2011, Stock Price Fragility, Journal of Financial Economics 102, 471-490.
Kacperczyk, Marcin, Clemens Sialm, and Lu Zheng, 2005, On the Industry Concentration of Actively Managed
Equity Mutual Funds, Journal of Finance 60, 1983-2011.
Kim, Oliver and Robert E. Verrecchia, 1994, Market liquidity and volume around earnings announcements, Journal
of Accounting and Economics 17, 41-67.
Kyle, Albert, 1985, Continuous Auctions and Insider Trading, Econometrica 53, 1315-1335.
Manski, Charles F.,1993, Identification of Endogenous Social Effects: The Reflection Problem, Review of
Economic Studies 60, 531-542.
Morris, Stephen, and Hyun S. Shin, 1998, Unique Equilibrium in a Model of Self-fulfilling Currency Attacks,
American Economic Review 88, 587-597.
Rochet, Jean-Charles, and Xavier Vives, 2004, Coordination Failures and the Lender of Last Resort: Was Bagehot
Right After All?, Journal of the European Economic Association 2, 1116-1147.
Shleifer, Andrei and Robert W. Vishny, 1997, The Limits of Arbitrage, Journal of Finance 52, 35-55.
Shleifer, Andrei and Robert W. Vishny, 2011, Fire Sales in Finance and Macroeconomics, Journal of Economic
Perspectives 25, 29-48.
Spiegel, Matthew, and Avanidhar Subrahmanyam, 1992, Informed Speculation and Hedging in a Non-Competitive
Securities Market, Review of Financial Studies 5, 307-329.
Subrahmanyam, Avanidhar, 1991, Risk Aversion, Market Liquidity, and Price Efficiency, Review of Financial
Studies 4, 417-441.
Yan, Xuemin and Zhe Zhang, 2009, Institutional Investors and Equity Returns: Are Short-Term Institutions Better
Informed?, Review of Financial Studies 22, 893-924.

29
FIGURE I: STOCK RETURNS IN EVENT TIME
This figure presents the evolution of cumulative stock returns of stocks held by BGI funds prior to the merger. Daily stock returns are adjusted by subtracting the return on the domestic market portfolio. The solid black line displays the cumulative returns of stocks with above-median
institutional ownership attributable to BGI funds prior to the merger (i.e., in June 2009). The dotted lines displays the cumulative returns of stocks not held by BGI funds prior to the merger and that are similar in characteristics (from the same country and industry and close in size and
book-to-market). The vertical bars indicate the key event dates.
85
95
105
115
125
135
145
155
Market-adj. Return (High IO BGI - MATCH) Market-adj. Return (High IO BGI)
iShares
for Sale
CVC
BlackRock
Offer Anti-trust
Approval
Completion

30
FIGURE II: TIMELINE OF THE BLACKROCK-BGI MERGER
This figure presents the timeline of the evolution of the merger between BlackRock and BGI. Depending on the frequency of the data used in the different tables, we use 3 different timelines that differ
in the degree of granularity and the level of detail. Timeline 1 is the coarsest timeline and only splits the event window in a “Pre-” and a “Post-Merger” period as of June 2009. Timeline 2 is more
granular and considers every semi-annual period in the event window separately. Both the pre- and the post-merger period are split into equal parts. The pre-merger period is separated into the
“Pre-CVC” and the “CVC” periods, the post-merger period is separated into the “Merger” and “Completion” period. Timeline 3 is the most granular one and used in all regressions that are run at
monthly frequency. Timeline 3 takes detailed account of the evolution of events month by month. We define the “Pre-Merger” period as the period from June 2008 to February 2009, the “iShares for
Sale” period as March 2009, the “CVC” period as April 2009 to May 2009, the “BlackRock Offer” period as June 2009 to August 2009, the “Anti-trust Approval” period as September 2009 to
November 2009 and the “Completion” period as December 2009 to the end of the event window.
3
June
2008
December
2008
December
2009
June
2009
June
2010
Pre-Merger06/2008-02/2009
Completion12/2009-06/2010
Anti-trust
Approval
09/2009-
11/2009
iShares for Sale03/2009
CVC04/2009-
05/2009
BR
Offer
06/2009-
08/2009
Pre-Merger Post-Merger
Merger CompletionPre-CVC CVC
1
2

31
TABLE I: DESCRIPTIVE STATISTICS
This table presents descriptive statistics on the sample. Panel A reports stock ownership covered in the sample. Column 1 reports the number of distinct, active stocks in the WorldScope database prior to the merger (as of June 2009). Column 2 displays the number of distinct stocks held by
BGI funds as of June 2009 and the percentage of world market capitalization this corresponds to. Column 3 reports the same statistics for distinct stocks held by BlackRock funds as of June 2009 and column 4 reports the statistics for the stocks held by both BlackRock and BGI funds as of
June 2009. Panel B reports average stock characteristics over the entire sample period for the same four subsamples as in panel A. Panel C reports
summary statistics on the coverage of holdings of both BlackRock and BGI funds as of June 2009. The panel reports the number of distinct funds that are managed by BlackRock or BGI, the number of exchange-traded funds (ETFs) and non-ETFs, the total assets under management (AUM)
of those covered funds and the percentage these assets under management represent out of the estimated total Equity AUM (or alternatively
passive Equity AUM) that are obtained from the annual reports of BlackRock and Barclays in 2008.
Panel A: Stock Ownership by BlackRock and BGI funds prior to the merger (as of June 2009)
WorldScope BGI funds BlackRock funds BlackRock & BGI
funds
Number of distinct stocks 36,660 7,348 6,476 5,497
% of WorldScope World Market
Capitalization
100% 69% 65% 63%
Panel B: Stock characteristics
Mean Median P25 P75
Sample: WorldScope
Market Capitalization ($ million) 1,341.9 96.4 24.3 457.2
Book-to-Market Ratio 1.15 0.83 0.46 1.40 Daily Trading Volume ($ million) 24.27 0.37 0.04 4.24
Daily Volatility (%) 4.1 3.2 2.2 4.8
Sample: Stocks held by BGI funds prior to the merger
Market Capitalization ($ million) 4,222.8 800.8 294.4 2,607.3
Book-to-Market Ratio 0.90 0.72 0.44 1.13
Daily Trading Volume ($ million) 69.97 4.14 0.96 19.04
Volatility (%) 3.5 2.9 2.0 4.2
Sample: Stocks held by BlackRock funds prior to the merger
Market Capitalization ($ million) 4,500.3 879.2 253.0 2,968.8 Book-to-Market Ratio 0.89 0.69 0.42 1.09
Daily Trading Volume ($ million) 77.92 4.96 0.88 22.11
Volatility (%) 3.6 2.9 2.0 4.4
Sample: Stocks held by both BlackRock and BGI funds prior to the merger
Market Capitalization ($ million) 5,016.6 1,102.0 335.8 3,434.8 Book-to-Market Ratio 0.85 0.68 0.41 1.05
Daily Trading Volume ($ million) 88.09 6.64 1.42 26.75 Volatility (%) 3.6 2.9 2.0 4.3
Panel C: Coverage of BlackRock and BGI holdings as of June 2009
BlackRock funds BGI funds
Number of Funds covered 308 333 Number of ETFs 30 302
Number of non-ETFs 278 31
Total Assets under Management (AUM, $ billion) 159.8 306.3 Relative to 2008 Equity AUM1 79% 31%
ETF AUM relative to 6/2009 iShares equity AUM2 90%
1 These figures are calculated as follows: 2008 equity AUM for BlackRock, according to the BlackRock 2009 Annual Report amounted to $203.3 billion. We cover $159.8 billion equity AUM
via FactSet, or approximately 159.8/203.3=78.6%. We estimate 2008 equity AUM for BGI by applying the asset mix that BGI contributed to BlackRock in the 2009 Annual Report to the total
AUM of BGI that is reported in the Barclays 2008 Annual Report and which amounted to $1.495 as of December 2008 (p. 13 of the Barclays 2008 Annual Report, no break-up by asset class
reported). The BlackRock 2008 Annual Report states that the BGI transaction added $1.188 billion in equity assets (p. 14), $517 billion in fixed income assets (p. 16), $49 billion in alternative
assets (p. 18), and $59 billion in cash assets (p. 20) amounting to $1.813 billion in total out of which 65.5% are equity. Applying the same product mix to the 2008 AUM of BGI, we obtain an
estimate of 2008 BGI equity AUM of 65.5% * $1.495 billion = $979 billion of which we cover $306.3/$979=31.2%. 2 This figure is calculated as follows. The BlackRock 2009 Annual report states, on page 13, $495.5 billion AUM for iShares products, 77% ($495.5*0.77=$381.5 billion) of which in equity
offerings. Total iShares AUM grew by $169.6 between December 2008 and December 2009. Assuming linear growth in the same proportions for the different asset classes gives a June 2009
estimate for equity AUM in iShares products of $381.5 – 0.5*$169.6 = $296.7 billion out of which we capture $266.8 billion with the FactSet data, or 89.6%.

32
TABLE II: INSTITUTIONAL OWNERSHIP CHANGES AROUND THE BLACKROCK-BGI MERGER
This table presents regressions of changes in institutional ownership at the stock level around the BlackRock-BGI merger. The sample includes all stocks that are held by at least one BGI fund prior to the merger. Panel A presents a single cross-sectional regression where the dependent
variables are different measures of changes in institutional ownership of institutions excluding BlackRock or BGI (and their affiliates) over the second half of 2009 (June to December). The dependent variables are defined as follows: Change Avg. Port. Weight is the average change in the
portfolio weight of the stocks across all funds from institutions different from BlackRock or BGI (and their affiliates) in the FactSet database. The
average is weighted either by the TNA of the fund or by fund flow volatility. Change Residual IO is the change in residual institutional ownership of the stock. Residual institutional ownership is defined as total institutional ownership excluding the institutional ownership
associated with BlackRock or BGI funds. The main explanatory variable is (Pre-Merger) IO BGI which is the level of institutional ownership in
the stock attributable to BGI funds prior to the merger with BlackRock (i.e., as of June 2009). Additional control variables include Change IO BlackRock, defined as changes in portfolio weight of the stocks across all Blackrock funds, Change MCap as the change in portfolio weight of
the stock in the global market portfolio that includes all the stocks in the WorldScope database for a given month, Log MCap as the log of
beginning of period market capitalization of the stock, Pastreturn as the 6-month trailing stock return, Log BTM as the log of the book-to-market ratio, Dividend Yield as the percentage dividend yield of the stock, ROE as the return on equity, Leverage as total leverage, and Cash as the total
cash holdings divided by total assets. Panel B presents a difference-in-difference specification using a semi-annual panel including four
semi-annual periods: 2 periods before the event and 2 periods after the event (timeline 1 in figure II). In panel B, the variable Post-Merger is a dummy that equals one for the post-merger period in the regression and the variable of interest is the interaction between (Pre-merger) IO BGI
and Post-Merger. Panel C uses the more granular timeline 2 of figure II. The variable CVC is a dummy equal to 1 for the period December 2008
to June 2009 in which Barclays announces that iShares is for sale and in which the deal with CVC Capital Partners in announced, the variable Merger is a dummy equal to 1 for the period June 2009 to December 2009 in which BlackRock offers to buy BGI and receives Anti-trust
approval and the variable Completion is a dummy equal to 1 for the period December 2009 to the end of the sample in which the merger is
completed. The regressions include unreported interactions between the different event indicators and the remaining control variables (including interactions between the event indicators and the industry or country fixed effects) as indicated at the bottom of the panels. The use of fixed
effects is indicated in every panel, * / ** / *** indicate statistical significance at the 10% / 5% / 1% level respectively, computed from standard
errors that allow for clustering at the country-industry level in panel A and at the country-industry-period level in panels B and C.
Panel A: Single cross-sectional regression around the merger event (semi-annual holdings)
(1) (2) (3) (4) (5) Dependent Variable: Change Avg.
Port. Weight (TNA weighted)
Change Avg.
Port. Weight (TNA weighted)
Change Avg.
Port. Weight (TNA weighted)
Change Avg.
Port. Weight (flow weighted)
Change Residual
IO
(Pre-Merger) IO BGI -1.9186*** -1.3133* -3.0289*** -3.9417*** -1.7076***
(-2.78) (-1.84) (-5.05) (-2.74) (-5.30)
Change IO BlackRock 2.0807** 1.5398* 0.9282 0.6118*
(2.11) (1.73) (0.59) (1.68)
Change MCap 0.9094*** 0.7693*** 0.4997** 0.1782**
(3.88) (4.24) (1.97) (1.97)
Log MCap -0.0143*** -0.0099** 0.0040 -0.0063**
(-3.24) (-2.47) (0.58) (-2.20)
Pastreturn 0.1506*** 0.0617*** 0.0843*** 0.0657***
(5.76) (4.88) (3.96) (6.74)
Log BTM 0.0406*** 0.0837*** 0.1283*** 0.0052
(3.51) (8.17) (7.92) (0.61)
Dividend Yield 0.0044 -0.0010 0.0034 0.0001
(1.17) (-0.45) (0.85) (0.03)
ROE 0.0007* 0.0007 -0.0004 0.0001
(1.76) (1.58) (-1.08) (0.27)
Leverage 0.0148 0.1639*** 0.1921*** 0.0210
(0.35) (4.82) (3.22) (1.05)
Cash 0.0949 0.1781*** 0.1118 0.0661**
(1.61) (3.33) (1.52) (2.17)
Industry F.E.: N N Y Y Y Country F.E.: N N Y Y Y
Observations 7,321 5,648 5,648 5,636 5,202
Adjusted R2 0.003 0.0882 0.2450 0.1191 0.1061
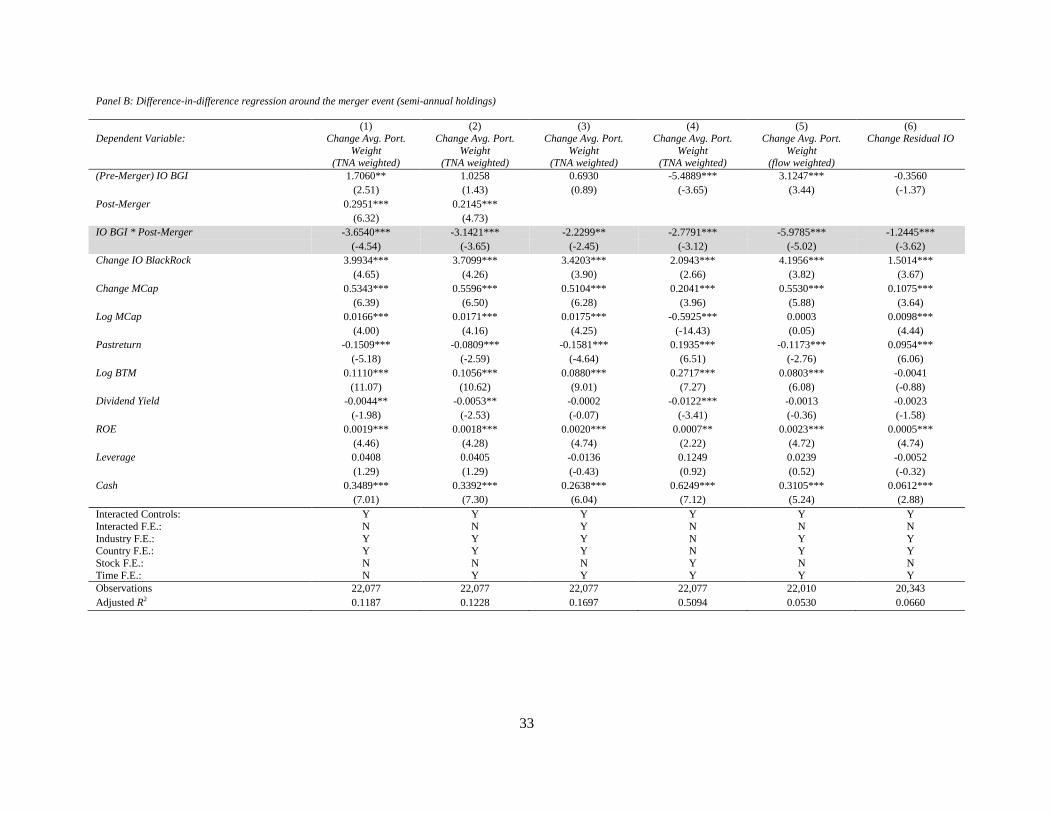
33
Panel B: Difference-in-difference regression around the merger event (semi-annual holdings)
(1) (2) (3) (4) (5) (6)
Dependent Variable: Change Avg. Port.
Weight (TNA weighted)
Change Avg. Port.
Weight (TNA weighted)
Change Avg. Port.
Weight (TNA weighted)
Change Avg. Port.
Weight (TNA weighted)
Change Avg. Port.
Weight (flow weighted)
Change Residual IO
(Pre-Merger) IO BGI 1.7060** 1.0258 0.6930 -5.4889*** 3.1247*** -0.3560
(2.51) (1.43) (0.89) (-3.65) (3.44) (-1.37)
Post-Merger 0.2951*** 0.2145***
(6.32) (4.73)
IO BGI * Post-Merger -3.6540*** -3.1421*** -2.2299** -2.7791*** -5.9785*** -1.2445***
(-4.54) (-3.65) (-2.45) (-3.12) (-5.02) (-3.62)
Change IO BlackRock 3.9934*** 3.7099*** 3.4203*** 2.0943*** 4.1956*** 1.5014***
(4.65) (4.26) (3.90) (2.66) (3.82) (3.67)
Change MCap 0.5343*** 0.5596*** 0.5104*** 0.2041*** 0.5530*** 0.1075***
(6.39) (6.50) (6.28) (3.96) (5.88) (3.64)
Log MCap 0.0166*** 0.0171*** 0.0175*** -0.5925*** 0.0003 0.0098***
(4.00) (4.16) (4.25) (-14.43) (0.05) (4.44)
Pastreturn -0.1509*** -0.0809*** -0.1581*** 0.1935*** -0.1173*** 0.0954***
(-5.18) (-2.59) (-4.64) (6.51) (-2.76) (6.06)
Log BTM 0.1110*** 0.1056*** 0.0880*** 0.2717*** 0.0803*** -0.0041
(11.07) (10.62) (9.01) (7.27) (6.08) (-0.88)
Dividend Yield -0.0044** -0.0053** -0.0002 -0.0122*** -0.0013 -0.0023
(-1.98) (-2.53) (-0.07) (-3.41) (-0.36) (-1.58)
ROE 0.0019*** 0.0018*** 0.0020*** 0.0007** 0.0023*** 0.0005***
(4.46) (4.28) (4.74) (2.22) (4.72) (4.74)
Leverage 0.0408 0.0405 -0.0136 0.1249 0.0239 -0.0052
(1.29) (1.29) (-0.43) (0.92) (0.52) (-0.32)
Cash 0.3489*** 0.3392*** 0.2638*** 0.6249*** 0.3105*** 0.0612***
(7.01) (7.30) (6.04) (7.12) (5.24) (2.88)
Interacted Controls: Y Y Y Y Y Y
Interacted F.E.: N N Y N N N
Industry F.E.: Y Y Y N Y Y Country F.E.: Y Y Y N Y Y
Stock F.E.: N N N Y N N
Time F.E.: N Y Y Y Y Y
Observations 22,077 22,077 22,077 22,077 22,010 20,343
Adjusted R2 0.1187 0.1228 0.1697 0.5094 0.0530 0.0660

34
Panel C: Difference-in-difference regression around the merger event (semi-annual holdings)
(1) (2) (3) (4) (5) (6)
Dependent Variable: Change Avg. Port.
Weight (TNA weighted)
Change Avg. Port.
Weight (TNA weighted)
Change Avg. Port.
Weight (TNA weighted)
Change Avg. Port.
Weight (TNA weighted)
Change Avg. Port.
Weight (flow weighted)
Change Residual IO
(Pre-Merger) IO BGI 5.8964*** 4.0591*** 5.5496*** -6.6343*** 3.1371** -0.3047
(3.11) (3.60) (6.27) (-3.34) (2.02) (-0.83)
CVC 0.1663*** -0.0121 -0.5209*** -0.3826*** -0.3828*** -0.0302 (7.40) (-0.16) (-3.69) (-6.05) (-3.27) (-0.84)
Merger 0.2507*** 0.3369*** 0.2637 -0.0325 -0.2916*** 0.1624***
(9.48) (4.49) (0.99) (-0.55) (-2.63) (4.97) Completion 0.1742*** 0.2280*** 0.0063 -0.0502 -0.1334 0.0778**
(8.48) (3.15) (0.05) (-0.77) (-1.16) (2.47)
IO BGI * CVC -6.2041*** -4.3927*** -7.5897*** 1.6447 0.2685 0.0090 (-2.85) (-3.09) (-6.70) (1.28) (0.13) (0.02)
IO BGI * Merger -8.0179*** -6.9812*** -8.5785*** -3.4507*** -8.0984*** -2.1122***
(-3.96) (-5.00) (-8.02) (-2.73) (-4.19) (-4.78) IO BGI * Post-Completion -5.7280*** -5.1292*** -5.7891*** -0.0384 -3.7309** -0.4989
(-2.86) (-3.77) (-5.57) (-0.03) (-2.04) (-1.07)
Change IO BlackRock 4.5104*** 4.2479*** 2.0183* 3.7638** 1.5009** (3.58) (3.02) (1.74) (2.21) (2.46)
Change MCap 0.6144*** 0.4405*** 0.2731*** 0.5995*** 0.0810***
(4.86) (5.03) (3.15) (4.50) (2.62) Log MCap 0.0160** 0.0138** -0.6107*** -0.0177** 0.0062**
(2.54) (2.19) (-15.49) (-1.98) (2.16) Pastreturn -0.0011 0.0724 0.1783*** 0.0543 0.1338***
(-0.02) (1.55) (4.47) (0.83) (5.97)
Log BTM 0.1134*** 0.0714*** 0.2515*** 0.0914*** 0.0039 (6.34) (4.51) (6.62) (3.89) (0.53)
Dividend Yield -0.0051 -0.0021 -0.0096* -0.0064 -0.0065***
(-1.11) (-0.46) (-1.96) (-1.12) (-3.12) ROE 0.0034*** 0.0034*** 0.0013*** 0.0039*** 0.0006***
(5.25) (5.96) (3.61) (4.61) (3.77)
Leverage -0.0577 -0.1813*** 0.0342 -0.0734 0.0021 (-1.15) (-4.18) (0.25) (-1.18) (0.10)
Cash 0.3149*** 0.2360*** 0.4658*** 0.2400** 0.0295
(3.62) (4.09) (4.34) (2.08) (1.09)
Interacted Controls: N Y Y Y Y Y Interacted F.E.: N N Y N N N
Industry F.E.: N Y Y N Y Y
Country F.E.: N Y Y N Y Y
Stock F.E.: N N N Y N N
Time F.E.: N/A N/A N/A N/A N/A N/A
Observations 26,345 22,077 22,077 22,077 22,010 20,343 Adjusted R2 0.0266 0.1385 0.2407 0.5170 0.0625 0.0699

35
TABLE III: INSTITUTIONAL OWNERSHIP CHANGES AROUND THE BLACKROCK-BGI MERGER – SAMPLE SPLITS BY STOCK CHARACTERISTICS
This table presents sample splits of the regression presented in table II, panel B, column 3 based on stock characteristics. In column 1(2), the sample includes only stocks that are also held (not held) by BlackRock funds prior to the merger with BGI. In column 3(4), the sample includes only stocks in which BlackRock funds increased (did not increase) their holdings in the period prior to the merger
with BGI. In column 5(6), the sample includes stocks with above (below) monthly turnover in sample and in column 7(8), the sample includes stocks with above (below) median market capitalization in sample. All regression include unreported control variables, country, industry and time fixed effects as well as interactions between Post-Merger and the control variables, the country and the industry
fixed effects. * / ** / *** indicate statistical significance at the 10% / 5% / 1% level respectively, computed from standard errors that allow for clustering at the country-industry-period level.
Sample Split:
Held by BlackRock pre-merger? Bought by BlackRock pre-merger? Stock Turnover Stock Market Cap.
No Yes No Yes High Low Large Small
(1) (2) (3) (4) (5) (6) (7) (8)
Dependent Variable: Change Avg.
Port. Weight (TNA weighted)
Change Avg.
Port. Weight (TNA weighted)
Change Avg.
Port. Weight (TNA weighted)
Change Avg.
Port. Weight (TNA weighted)
Change Avg.
Port. Weight (TNA weighted)
Change Avg.
Port. Weight (TNA weighted)
Change Avg.
Port. Weight (TNA weighted)
Change Avg.
Port. Weight (TNA weighted)
(Pre-Merger) IO BGI -3.1216 0.5421 0.5620 -0.4310 -0.8560 2.9163* 0.6996 -1.4130*
(-0.9210) (0.6769) (0.5324) (-0.5143) (-0.9915) (1.8650) (0.7570) (-1.9569)
IO BGI * Post-Merger 1.9067 -2.1084** -2.4547** -0.7158 -0.9056 -7.2289*** -1.6659 -1.7767**
(0.4267) (-2.2843) (-1.9983) (-0.7051) (-0.8747) (-3.9543) (-1.4834) (-2.0129)
Controls, Indicators & Interactions: Y Y Y Y Y Y Y Y
Fixed Effects: Country, Industry & Time
Observations 5,633 16,444 11,521 10,556 11,252 10,822 10,084 11,993
Adjusted R2 0.2070 0.1681 0.2043 0.1531 0.2035 0.1647 0.2725 0.3431

36
TABLE IV: INSTITUTIONAL OWNERSHIP CHANGES AROUND THE BLACKROCK-BGI MERGER – SAMPLE SPLITS BY INSTITUTION
CHARACTERISTICS
This table presents sample splits of the regression presented in table II, panel B, column 3 based on fund characteristics. In column 1(2), the dependent variable is computed using only funds with above-median (below-median) volatility of flows to proxy for the likely impact of future idiosyncratic shocks in stocks held. In column 3(4), the dependent variable is computed using only funds with
above-median (below-median) flow-performance sensitivity as an alternative proxy for the likely impact of future idiosyncratic shocks in stocks held. In column 5(6), the dependent variable is computed
using only funds with short (long) investment horizon based on the definition of Yan and Zhang (2009) who use portfolio turnover to measure the investment horizon. In column 7(8), the dependent variable is computed using only funds with above-median (below-median) portfolio concentration to proxy for how informed the institutions are. All regression include unreported control variables,
country, industry and time fixed effects as well as interactions between Post-Merger and the control variables, the country and the industry fixed effects. * / ** / *** indicate statistical significance at the
10% / 5% / 1% level respectively, computed from standard errors that allow for clustering at the country-industry-period level.
Sample Split:
Flow Volatility Flow Performance Sensitivity Investment Horizon Portfolio Concentration
High Low High Low Short Long High Low
(1) (2) (3) (4) (5) (6) (7) (8)
Dependent Variable: Change Avg. Port. Weight
(TNA weighted)
Change Avg. Port. Weight
(TNA weighted)
Change Avg. Port. Weight
(TNA weighted)
Change Avg. Port. Weight
(TNA weighted)
Change Avg. Port. Weight
(TNA weighted)
Change Avg. Port. Weight
(TNA weighted)
Change Avg. Port. Weight
(TNA weighted)
Change Avg. Port. Weight
(TNA weighted)
(Pre-Merger) IO BGI 1.3618* 0.6674 1.1469 0.7147 0.8384 0.5268 0.0867 0.6144
(1.7055) (0.8506) (1.5329) (0.7968) (0.8612) (0.6471) (0.0905) (0.7416)
IO BGI * Post-Merger -4.2049*** -1.6192* -3.2656*** -2.0860** -2.4192** -2.2960** -1.7634 -1.9401**
(-4.4142) (-1.7590) (-3.7214) (-2.0375) (-2.0376) (-2.3697) (-1.3946) (-2.0107)
Controls, Indicators & Interactions: Y Y Y Y Y Y Y Y
Fixed Effects: Country, Industry & Time
Observations 21,925 21,860 21,909 21,941 21,984 21,798 21,184 22,055
Adjusted R2 0.1016 0.1056 0.1186 0.1007 0.1080 0.1264 0.0737 0.1596

37
TABLE V: INSTITUTIONAL OWNERSHIP CHANGES AROUND THE BLACKROCK-BGI MERGER – MATCHING STOCK ANALYSIS
The table presents changes in institutional ownership at the stock level around the BlackRock-BGI merger. As in table II, institutional ownership is measured in 3 different ways: Change Avg. Port. Weight is the average change in the portfolio weight of the stock across all funds from institutions excluding BlackRock or BGI (and their affiliates) in the FactSet database. The average is weighted
either by the TNA of the fund or by fund flows. Change Residual IO is the change in residual institutional ownership of the stock. Residual institutional ownership is defined as total institutional ownership excluding the institutional ownership associated with BlackRock or BGI funds. The table compares these measures for the actual stocks that are held by at least one BGI fund with the
measures for a matching stock. Three different algorithms to select a matching stock are considered. All matching stocks come from the pool of stocks that are not held by any BGI fund prior to the
merger (or are in the lowest decile of BGI’s holdings). MATCH 1 matches every stock held by BGI funds prior to the merger with a corresponding stock from the same country of origin, within the same industry, that is closest in market capitalization. MATCH 2 amends MATCH 1 by matching every stock held by BGI funds prior to the merger with a stock from the same country of origin, within
the same industry, that is closest in terms of market capitalization and book-to-market using a distance measure defined in the text. MATCH 3 amends MATCH 2 by also considering the total
institutional ownership in the distance measure to select the matching stock. Cells in the columns entitled “Actual Stock” display the average semi-annual change in the measure of institutional ownership for the actual stock held by at least one BGI fund between June and December 2009. The columns entitled “Matched Stock” display the same average change for the matching stocks and the
columns entitled “Match – Actual” test the difference between the two changes. For every measure of institutional ownership, we test these differences for all BGI-held stocks, for the quintile of lowest
BGI ownership and the quintile of highest BGI ownership. * / ** / *** indicate statistical significance at the 10% / 5% / 1% level respectively (p-values reported).
Matching Stock:
MATCH 1 MATCH 2 MATCH 3
Measure Sample Actual
Stock
Matched
Stock
Match -
Actual
Actual
Stock
Matched
Stock
Match -
Actual
Actual
Stock
Matched
Stock
Match -
Actual
Change
Avg. Port.
Weight
(TNA
weighted)
All BGI 0.0605 0.0579 -0.0026 0.0622 0.1002 0.0380*** 0.0633 0.0873 0.0240***
Stocks [0.364] [0.000] [0.000]
Low BGI IO 0.0958 0.0901 -0.0057 0.1003 0.0985 -0.0018 0.1078 0.0949 -0.0129
Quintile [0.312] [0.437] [0.139]
High BGI IO 0.0210 0.1015 0.0805*** 0.0212 0.1819 0.1607*** 0.0216 0.1272 0.1056***
Quintile [0.000] [0.000] [0.000]
Change
Avg. Port.
Weight
(flow
weighted)
All BGI -0.0877 -0.0200 0.0676*** -0.1011 0.0154 0.1164*** -0.1068 -0.0071 0.0997***
Stocks [0.000] [0.000] [0.000]
Low BGI IO 0.0207 0.0414 0.0207 0.0174 0.0458 0.0284 0.0142 -0.0014 -0.0156
Quintile [0.191] [0.115] [0.265]
High BGI IO -0.1798 -0.0140 0.1658*** -0.2145 0.0381 0.2526*** -0.2367 0.0569 0.2936****
Quintile [0.000] [0.000] [0.000]
Change
Residual IO
All BGI 0.0499 0.0963 0.0465*** 0.0542 0.1215 0.0674*** 0.0539 0.0594 0.0055
Stocks [0.000] [0.000] [0.156]
Low BGI IO 0.0562 0.0584 0.0022 0.0648 0.0776 0.0128* 0.0616 0.0495 -0.0122*
Quintile [0.394] [0.089] [0.092]
High BGI IO 0.0234 0.2145 0.1911*** 0.0246 0.2469 0.2223*** 0.0264 0.1218 0.0954****
Quintile [0.000] [0.000] [0.000]

38
TABLE VI: STOCK RETURNS AROUND THE BLACKROCK-BGI MERGER
This table presents regressions of monthly stock returns on event-time indicators and interactions around the BlackRock-BGI merger. The sample includes all stocks that are held by at least one BGI fund prior to the merger. The data is structured as in panel B of table II but now expanded to monthly frequency. The dependent variables include measures of stock returns. Panel A reports regressions
on the full sample, panel B reports sample splits based on stock characteristics as in table III. In panel A, columns 1 to 7 use Market-adjusted Stock Returns as the dependent variable, defined as the monthly stock return in excess of the domestic market return. Column 8 uses DGTW-adjusted Returns as the dependent variable, defined as the monthly stock return in excess of the return on a domestic
size-value-momentum matched benchmark portfolio and column 9 uses Market-Industry-adjusted Returns as the dependent variable, defined as the monthly stock return in excess of the returns on a
domestic industry benchmark portfolio. The remaining specifications are as in table II with the exception that the granular timeline 3 of figure II is implemented. The main variables of interest are the interaction terms between the event-time indicators and (Pre-Merger) IO BGI. Columns 5 to 9 also include specifications with the additional variable Residual IO which measures the institutional
ownership of the stock not due to BlackRock or BGI funds as well as the interactions between Residual IO and the event-time indicators. Panel B reports the specification of column 6 of panel A for
same sample splits presented in table III. Unreported controls, interactions and the use of fixed effects are reported at the bottom of the panels. Interactions include interactions between the event indicators and the control variables, country and industry fixed effects where applicable. The set of unreported controls is the same as in table II. * / ** / *** indicate statistical significance at the 10% /
5% / 1% level respectively, computed from standard errors that allow for clustering at the country-industry-period level.
Panel A: Full sample estimates
(1) (2) (3) (4) (5) (6) (7) (8) (9)
Dependent Variable:
Market-adjusted Stock Returns DGTW-adj.
Returns
Mkt-Ind-adj.
Returns
(Pre-Merger) IO BGI 0.3424*** -0.4876 0.1345 -0.2367 0.1525 0.3562* 0.1752 0.1004 0.0825
(2.73) (-1.20) (1.22) (-0.69) (1.32) (1.93) (0.80) (0.54) (0.40)
IO BGI * For Sale 0.4848 0.5760 0.6279 (1.11) (1.48) (1.45)
IO BGI * CVC 0.4544 0.7248** 0.6856
(1.00) (1.96) (1.53) IO BGI * BR Offer -0.4344** -0.1886 -0.2263 -0.2382 -0.2693 -0.4730* -0.2920 -0.0295 -0.1533
(-2.06) (-0.77) (-1.11) (-1.02) (-1.20) (-1.78) (-1.00) (-0.12) (-0.54)
IO BGI * Anti-trust -0.8751*** -0.9691*** -0.6673*** -1.0190*** -0.7699*** -0.9736*** -0.7926*** -0.5092** -0.6549***
(-5.37) (-4.71) (-4.36) (-5.85) (-4.71) (-4.47) (-3.19) (-2.34) (-2.74)
IO BGI * Completion -0.1914 -0.0104 -0.0681 0.0798
(-0.95) (-0.04) (-0.33) (0.36) Residual IO -0.0066 -0.0247** -0.0192* -0.0212* -0.0191*
(-0.90) (-2.48) (-1.86) (-1.96) (-1.92)
Residual IO * For Sale -0.0807** -0.0567 -0.0387 (-2.34) (-1.62) (-1.10)
Residual IO * CVC 0.0089 0.0223 -0.0116
(0.25) (0.61) (-0.31) Residual IO * BR Offer -0.0025 0.0156 0.0101 0.0150 -0.0011
(-0.12) (0.68) (0.44) (0.69) (-0.05)
Residual IO * Anti-trust 0.0261** 0.0442*** 0.0387*** 0.0137 0.0342** (2.04) (3.06) (2.64) (0.86) (2.33)
Residual IO * Completion 0.0303** 0.0248* 0.0354** 0.0179
(2.34) (1.87) (2.50) (1.34)
Controls, Indicators & Interactions: Y Y Y Y Y Y Y Y Y
Country F.E.: Y N Y N Y Y Y Y Y
Industry F.E.: Y N Y N Y Y Y Y Y Stock F.E.: N Y N Y N N N N N
Time F.E.: N N Y Y Y Y Y Y Y
Observations 124,836 124,836 124,836 124,836 116,685 116,685 116,685 98,967 102,156
Adjusted R2 0.02 0.03 0.05 0.05 0.05 0.05 0.09 0.07 0.06

39
Panel B: Sample splits
Sample Split Held by BlackRock pre-merger? Bought by BlackRock
pre-merger?
Stock Turnover Stock Market Cap.
Yes No Yes No High Low Large Small
(1) (2) (3) (4) (5) (6) (7) (8) Dependent Variable:
Market-adjusted Stock Returns
(Pre-Merger) IO BGI 0.2704 -0.0982 0.4168** 0.2571 -0.1956 0.2412 0.2500 0.4807* (1.50) (-0.16) (2.05) (1.17) (-1.04) (0.77) (1.31) (1.85)
IO BGI * BR Offer -0.3979 -0.5173 -0.7779** -0.1922 -0.3642 -1.0531** -0.3016 -0.5670
(-1.43) (-0.48) (-2.21) (-0.63) (-1.05) (-2.43) (-1.00) (-1.38) IO BGI * Anti-trust -0.8048*** 0.5245 -1.1136*** -0.7377*** -0.5492** -1.0713*** -0.8211*** -1.0731***
(-3.67) (0.55) (-4.03) (-2.82) (-2.22) (-2.92) (-3.47) (-3.32)
IO BGI * Completion -0.1788 1.3135* -0.5164** 0.1002 0.1787 -0.4150 -0.0323 -0.5087* (-0.89) (1.68) (-2.17) (0.41) (0.79) (-1.24) (-0.15) (-1.69)
Residual IO -0.0243** -0.0145 -0.0303** -0.0198 -0.0466*** -0.0162 -0.0151 -0.0225
(-2.18) (-0.68) (-2.11) (-1.54) (-3.08) (-1.15) (-1.38) (-1.24) Residual IO * BR Offer 0.0095 0.0610 0.0159 0.0183 -0.0185 0.0099 0.0251 0.0109
(0.37) (1.39) (0.48) (0.70) (-0.58) (0.39) (1.14) (0.26)
Residual IO * Anti-trust 0.0442*** -0.0053 0.0414* 0.0474** 0.0277 0.0287 0.0436*** 0.0252 (2.77) (-0.14) (1.92) (2.51) (1.22) (1.39) (2.63) (0.96)
Residual IO * Completion 0.0272* 0.0164 0.0073 0.0429** 0.0290 0.0210 0.0149 0.0544**
(1.92) (0.55) (0.40) (2.53) (1.42) (1.24) (1.08) (2.26)
Controls, Indicators & Interactions: Y Y Y Y Y Y Y Y Fixed Effects: Country, Industry & Time
Observations 87,392 29,293 48,676 68,009 60,128 56,557 59,421 57,264
Adjusted R2 0.06 0.05 0.06 0.05 0.08 0.03 0.06 0.10

40
TABLE VII: STOCK LIQUIDITY AROUND THE BLACKROCK-BGI MERGER
This table presents regressions of monthly stock liquidity on event-time indicators and interactions around the BlackRock-BGI merger. The sample includes all stocks that are held by at least one BGI fund prior to the merger. The data is structured as table VI. The dependent variables include measures of stock liquidity. Panel A reports regressions on the full sample, panel B reports sample splits
based on stock characteristics as in table III. In panel A, columns 1 to 7 use Amihud as the dependent variable, defined as the Amihud (2002) measure of stock illiquidity calculated from daily data. Column 8 uses Turnover as the dependent variable, defined as the number of stock traded during the month divided by beginning-of-month shares outstanding and column 9 uses Log Trading Volume as
the dependent variable, defined as the log of total number of stocks traded multiplied by the beginning-of-month stock price. The main variables of interest are the interaction terms between the
event-time indicators and (Pre-Merger) IO BGI. Columns 5 to 9 also include specifications with the additional variable Residual IO which measures the institutional ownership of the stock not due to BlackRock or BGI funds as well as the interactions between Residual IO and the event-time indicators. Panel B reports the specification of column 6 of panel A for same sample splits presented in table
III. Unreported controls, interactions and the use of fixed effects are reported at the bottom of the panels. Interactions include interactions between the event indicators and the control variables, country
and industry fixed effects where applicable. The set of unreported controls is the same as in table II. * / ** / *** indicate statistical significance at the 10% / 5% / 1% level respectively, computed from standard errors that allow for clustering at the country-industry-period level.
Panel A: Full sample estimates
(1) (2) (3) (4) (5) (6) (7) (8) (9)
Dependent Variable:
Amihud Turnover Log Trading
Volume
(Pre-Merger) IO BGI -0.0143*** -0.0041*** -0.0145*** -0.0051*** -0.0142*** -0.0191*** -0.0184*** 0.0964*** 18.6165***
(-16.16) (-9.36) (-15.85) (-7.20) (-13.68) (-12.74) (-10.20) (6.75) (22.28)
IO BGI * For Sale -0.0140** -0.0322 -6.0478*** (-2.11) (-0.88) (-3.44)
IO BGI * CVC 0.0022 -0.0195 -5.3655***
(0.71) (-0.66) (-3.64) IO BGI * BR Offer 0.0056*** -0.0006 0.0058*** -0.0004 0.0065*** 0.0114*** 0.0107*** -0.0492** -8.1803***
(4.96) (-1.07) (5.06) (-0.63) (5.25) (6.93) (5.56) (-2.12) (-6.09)
IO BGI * Anti-trust 0.0084*** 0.0024*** 0.0086*** 0.0026*** 0.0084*** 0.0133*** 0.0127*** -0.0595*** -10.9644***
(8.30) (6.14) (8.29) (6.10) (7.36) (8.45) (6.77) (-2.83) (-7.27)
IO BGI * Completion 0.0148*** 0.0141*** -0.0812*** -11.1356***
(9.72) (7.74) (-4.44) (-9.65) Residual IO -0.0004*** -0.0006*** -0.0005*** 0.0251*** 3.2244***
(-5.30) (-4.96) (-3.93) (21.24) (50.54)
Residual IO * For Sale 0.0001 0.0047 0.1856 (0.14) (1.39) (1.01)
Residual IO * CVC -0.0001 0.0028 0.0755
(-0.20) (0.94) (0.50) Residual IO * BR Offer -0.0000 0.0001 0.0001 -0.0050** -0.0476
(-0.15) (0.70) (0.49) (-2.12) (-0.35)
Residual IO * Anti-trust 0.0002** 0.0004*** 0.0004** -0.0087*** 0.0512 (2.27) (3.00) (2.42) (-4.49) (0.38)
Residual IO * Completion 0.0003*** 0.0003** -0.0058*** -0.1826*
(2.89) (2.23) (-3.17) (-1.85)
Controls, Indicators & Interactions: Y Y Y Y Y Y Y Y Y
Country F.E.: Y N Y N Y Y Y Y Y
Industry F.E.: Y N Y N Y Y Y Y Y Stock F.E.: N Y N Y N N N N N
Time F.E.: N N Y Y Y Y Y Y Y
Observations 124,046 124,046 124,046 124,046 115,915 115,915 115,915 115,826 115,916
Adjusted R2 0.06 0.36 0.06 0.36 0.07 0.08 0.08 0.09 0.83

41
Panel B: Sample splits
Sample Split Held by BlackRock pre-merger? Bought by BlackRock
pre-merger?
Stock Turnover Stock Market Cap.
Yes No Yes No High Low Large Small
(1) (2) (3) (4) (5) (6) (7) (8) Dependent Variable:
Amihud
(Pre-Merger) IO BGI -0.0131*** 0.0221*** -0.0250*** -0.0150*** -0.0020*** -0.0243*** -0.0015*** -0.0035 (-11.42) (2.80) (-11.07) (-10.01) (-6.87) (-5.90) (-9.66) (-1.41)
IO BGI * BR Offer 0.0065*** -0.0198* 0.0183*** 0.0059*** 0.0009** 0.0207*** 0.0005** 0.0097***
(5.02) (-1.92) (7.52) (3.10) (2.01) (4.11) (2.34) (2.60) IO BGI * Anti-trust 0.0080*** -0.0129 0.0204*** 0.0074*** 0.0016*** 0.0188*** 0.0008*** 0.0039
(6.42) (-1.47) (8.78) (4.07) (5.39) (4.27) (4.22) (1.37)
IO BGI * Completion 0.0096*** -0.0117 0.0212*** 0.0100*** 0.0017*** 0.0214*** 0.0010*** 0.0052* (8.13) (-1.18) (9.35) (6.31) (5.62) (5.04) (6.18) (1.89)
Residual IO -0.0001** -0.0028*** -0.0004** -0.0006*** -0.0001*** -0.0022*** -0.0001*** -0.0008***
(-2.12) (-5.88) (-2.35) (-5.26) (-4.18) (-7.03) (-4.40) (-2.81) Residual IO * BR Offer -0.0001 0.0016*** 0.0004* -0.0001 0.0000 0.0006 0.0001* -0.0003
(-0.50) (2.77) (1.75) (-0.36) (1.11) (1.15) (1.85) (-0.50)
Residual IO * Anti-trust 0.0001 0.0019*** 0.0005** 0.0003* 0.0000** 0.0016*** 0.0001** 0.0005* (1.00) (3.93) (2.44) (1.94) (2.28) (4.58) (2.42) (1.66)
Residual IO * Completion -0.0000 0.0021*** 0.0004** 0.0002 0.0000*** 0.0015*** 0.0001** 0.0004
(-0.42) (4.28) (2.31) (1.64) (2.59) (4.54) (2.17) (1.43)
Controls, Indicators & Interactions: Y Y Y Y Y Y Y Y Fixed Effects: Country, Industry & Time
Observations 87,170 28,745 48,489 67,426 59,341 56,574 59,221 56,694
Adjusted R2 0.07 0.15 0.08 0.08 0.05 0.10 0.19 0.12

42
TABLE VIII: STOCK VOLATILITY AROUND THE BLACKROCK-BGI MERGER
This table presents regressions of monthly stock volatility on event-time indicators and interactions around the BlackRock-BGI merger. The sample includes all stocks that are held by at least one BGI fund prior to the merger. The data is structured as in table VI. The dependent variables include measures of stock volatility. Panel A reports regressions on the full sample, panel B reports sample splits
based on stock characteristics as in table III. In panel A, columns 1 to 5 use Volatility as the dependent variable, defined as the standard deviation of daily stock returns within the month, columns 6 to 9 use Idiosyncratic volatility as dependent variable, defined as the standard deviation of daily residuals from a regression of daily stock returns on a domestic market, size, value and momentum factor
each month. The main variables of interest are the interaction terms between the event-time indicators and (Pre-Merger) IO BGI. Columns 3 to 5 and 7 to 9 also include specifications with the additional
variable Residual IO which measures the institutional ownership of the stock not due to BlackRock or BGI funds as well as the interactions between Residual IO and the event-time indicators. Panel B reports the specification of column 6 of panel A for same sample splits presented in table III. Unreported controls, interactions and the use of fixed effects are reported at the bottom of the panels.
Interactions include interactions between the event indicators and the control variables, as well as country and industry fixed effects where applicable. The set of unreported controls is the same as in
table II. * / ** / *** indicate statistical significance at the 10% / 5% / 1% level respectively, computed from standard errors that allow for clustering at the country-industry-period level.
Panel A: Full sample estimates
(1) (2) (3) (4) (5) (6) (7) (8) (9) Dependent Variable:
Volatility Idiosyncratic Volatility
(Pre-Merger) IO BGI 0.0352** 0.3399*** 0.0503*** 0.1256*** 0.0747*** 0.2270*** 0.2583*** 0.4369*** 0.3487*** (2.36) (8.89) (3.36) (6.08) (3.02) (7.98) (8.98) (11.30) (7.36)
IO BGI * For Sale 0.2545*** 0.4989***
(4.51) (5.15) IO BGI * CVC 0.0816* 0.1154
(1.79) (1.44)
IO BGI * BR Offer -0.0656*** -0.1477*** -0.0610*** -0.1363*** -0.0853*** -0.1636*** -0.1637*** -0.3423*** -0.2541*** (-3.02) (-6.99) (-2.78) (-5.20) (-2.89) (-4.40) (-4.37) (-7.52) (-4.78)
IO BGI * Anti-trust -0.0379** -0.1708*** -0.0394** -0.1147*** -0.0637** -0.1278*** -0.1405*** -0.3191*** -0.2308***
(-2.02) (-7.80) (-2.04) (-4.78) (-2.31) (-3.67) (-3.94) (-7.25) (-4.45)
IO BGI * Completion -0.1294*** -0.0784*** -0.3635*** -0.2753***
(-5.63) (-2.94) (-8.68) (-5.50)
Residual IO -0.0053*** -0.0082*** -0.0069*** -0.0084*** -0.0136*** -0.0118*** (-5.01) (-5.73) (-4.13) (-4.65) (-5.49) (-4.06)
Residual IO * For Sale -0.0157*** -0.0251***
(-3.26) (-3.09) Residual IO * CVC 0.0013 0.0025
(0.42) (0.46)
Residual IO * BR Offer -0.0034 -0.0005 -0.0018 -0.0039 0.0012 -0.0006 (-1.61) (-0.21) (-0.73) (-1.18) (0.32) (-0.15)
Residual IO * Anti-trust -0.0001 0.0028 0.0015 0.0013 0.0064* 0.0046
(-0.05) (1.43) (0.71) (0.44) (1.91) (1.25) Residual IO * Completion 0.0036** 0.0023 0.0073*** 0.0055*
(2.17) (1.22) (2.63) (1.74)
Controls, Indicators & Interactions: Y Y Y Y Y Y Y Y Y
Country F.E.: Y N Y Y Y Y Y Y Y
Industry F.E.: Y N Y Y Y Y Y Y Y
Stock F.E.: N Y N N N N N N N Time F.E.: Y Y Y Y Y Y Y Y Y
Observations 122,327 122,327 114,537 114,537 114,537 122,320 114,531 114,531 114,531
Adjusted R2 0.51 0.64 0.51 0.53 0.54 0.54 0.54 0.56 0.58

43
Panel B: Sample splits
Sample Split Held by BlackRock pre-merger? Bought by BlackRock
pre-merger?
Stock Turnover Stock Market Cap.
Yes No Yes No High Low Large Small
(1) (2) (3) (4) (5) (6) (7) (8) Dependent Variable:
Volatility
(Pre-Merger) IO BGI 0.0964*** 0.3125*** 0.1029*** 0.1375*** -0.0387* 0.3133*** 0.0211 0.1634*** (4.81) (3.90) (4.56) (5.62) (-1.74) (9.30) (0.70) (6.96)
IO BGI * BR Offer -0.1347*** -0.0979 -0.1869*** -0.0870*** -0.0818** -0.3513*** -0.0627* -0.1362***
(-4.89) (-0.86) (-5.39) (-2.88) (-2.51) (-8.80) (-1.81) (-4.07) IO BGI * Anti-trust -0.1005*** -0.1080 -0.1366*** -0.1067*** -0.0285 -0.3287*** -0.0492 -0.1307***
(-4.25) (-1.08) (-4.85) (-3.71) (-1.06) (-8.27) (-1.48) (-4.38)
IO BGI * Completion -0.1085*** -0.2542*** -0.1290*** -0.1301*** -0.0336 -0.3308*** -0.0414 -0.1272*** (-4.81) (-2.71) (-4.87) (-4.75) (-1.29) (-9.16) (-1.31) (-4.35)
Residual IO -0.0118*** 0.0103*** -0.0096*** -0.0049*** -0.0148*** -0.0076*** 0.0040*** -0.0050**
(-8.02) (3.94) (-5.07) (-2.77) (-8.75) (-4.40) (2.75) (-2.21) Residual IO * BR Offer 0.0020 -0.0094** 0.0004 -0.0035 -0.0032 -0.0007 -0.0040* -0.0007
(0.80) (-2.23) (0.14) (-1.27) (-1.13) (-0.27) (-1.93) (-0.19)
Residual IO * Anti-trust 0.0059*** -0.0092** 0.0038 0.0013 0.0002 0.0016 -0.0031 0.0051 (2.86) (-2.45) (1.42) (0.56) (0.09) (0.64) (-1.63) (1.62)
Residual IO * Completion 0.0053*** -0.0047 0.0021 0.0035* 0.0001 0.0021 -0.0040** 0.0022
(3.12) (-1.35) (0.98) (1.68) (0.07) (1.04) (-2.37) (0.79)
Controls, Indicators & Interactions: Y Y Y Y Y Y Y Y Fixed Effects: Country, Industry & Time
Observations 86,530 28,007 48,105 66,432 59,117 55,420 58,357 56,180
Adjusted R2 0.56 0.45 0.55 0.51 0.55 0.55 0.60 0.49

44
TABLE IX: REPLICATION OF MAIN RESULTS USING 13F INFORMATION
This table presents robustness tests on the main results using institutional ownership information from 13F filings. The sample includes all stocks that are covered in 13F filings and that are in our baseline sample. Column 1 replicates the results of table II, panel B, column 6 and uses a
semi-annual panel. Columns 2, 3, and 4 use a monthly panel and replicate the results of table VI, panel A, column 7, table VII, panel A, column 7 and table VIII, panel A, column 9 respectively. The main explanatory variable is (Pre-Merger) IO BGI 13F which is the level of institutional
ownership in the stock attributable to Barclays institutional 13F filings prior to the merger with BlackRock (i.e., as of June 2009). In column 1,
the variable Post-Merger is a dummy that equals one for the post-merger period in the regression (as in timeline 1 of figure II) and the variable of interest is the interaction between (Pre-merger) IO BGI 13F and Post-Merger and the dependent variable is Change Residual IO 13F, defined as
the change in residual institutional ownership as per 13F filings. Columns 2 to 4 use the granular timeline 3 of figure II and include Residual IO
13F and interactions with the event indicators as explanatory variables. Unreported controls, interactions and the use of fixed effects are reported at the bottom of the panels. Interactions include interactions between the event indicators and the control variables. The set of unreported controls
is the same as in table II. * / ** / *** indicate statistical significance at the 10% / 5% / 1% level respectively, computed from standard errors that
allow for clustering at the country-industry-period level.
Specification: Semi-annual
panel
Monthly panel
(1) (2) (3) (4) Dependent Variable: Change
Residual IO
13F
Mkt.adj.
Returns
Amihud Idio.
Volatility
(Pre-Merger) IO BGI 13F -0.2882*** (Pre-Merger) IO BGI 13F 0.2925*** -0.0111*** 0.1583*** (-4.06) (2.82) (-10.91) (6.77)
IO BGI 13F * Post-Merger -0.2584** IO BGI 13F * BR Offer -0.2972 0.0065*** -0.1027***
(-2.43) (-1.61) (5.91) (-3.45) Change IO BlackRock -0.1975 IO BGI 13F * Anti-trust -0.6312*** 0.0072*** -0.0958***
(-0.93) (-4.55) (6.60) (-3.35)
Change MCap 0.0267*** IO BGI 13F * Completion -0.2030* 0.0082*** -0.0987*** (3.50) (-1.65) (7.92) (-3.73)
Log MCap 0.0065*** Residual IO 13F -0.0331*** -0.0003*** -0.0107*** (5.90) (-4.00) (-3.53) (-7.42)
Pastreturn 0.0148*** Residual IO 13F * BR Offer 0.0357* 0.0002** -0.0016
(2.94) (1.96) (2.46) (-0.53)
Log BTM -0.0048** Residual IO 13F * Anti-trust 0.0324** 0.0002*** 0.0035
(-2.14) (2.43) (2.77) (1.51)
Dividend Yield -0.0010** Residual IO 13F * Completion 0.0453*** 0.0002*** 0.0043** (-2.15) (4.04) (3.14) (2.14)
ROE 0.0002***
(4.15) Leverage -0.0165**
(-2.51)
Cash 0.0155* (1.92)
Controls & Interactions: Y Y Y Y
Country F.E.: Y Y Y Y
Industry F.E.: Y Y Y Y Stock F.E.: N N N N
Time F.E.: Y Y Y Y
Observations 9,758 58,572 58,520 58,486
Adjusted R2 0.1908 0.07 0.07 0.59

45
TABLE X: REPLICATION OF MAIN RESULTS DEFINING IO BGI AS OF JUNE 2008
This table presents robustness tests on the main results defining the explanatory variable (Pre-Merger) IO BGI as of June 2008 for every stock and holding it constant after. Column 1 replicates the results of table II, panel B, column 6 and uses a semi-annual panel. Columns 2, 3, and 4 use
a monthly panel and replicate the results of table VI, panel A, column 7, table VII, panel A, column 7 and table VIII, panel A, column 9 respectively. In column 1, the variable Post-Merger is a dummy that equals one for the post-merger period in the regression (as in timeline 1 of
figure II) and the variable of interest is the interaction between (Pre-merger) IO BGI 6/08 and Post-Merger. Columns 2 to 4 use the granular
timeline 3 of figure II and include Residual IO and interactions with the event indicators as explanatory variables. Unreported controls, interactions and the use of fixed effects are reported at the bottom of the panels. Interactions include interactions between the event indicators and
the control variables. The set of unreported controls is the same as in table II. * / ** / *** indicate statistical significance at the 10% / 5% / 1%
level respectively, computed from standard errors that allow for clustering at the country-industry-period level.
Specification: Semi-annual
panel
Monthly panel
(1) (2) (3) (4) Dependent Variable: Change
Residual IO
Mkt.adj.
Returns
Amihud Idio.
Volatility
(Pre-Merger) IO BGI 6/08 -0.0563 (Pre-Merger) IO BGI 6/08 0.5932*** -0.0187*** 0.5465***
(-0.18) (3.08) (-12.39) (12.40) IO BGI 6/08 * Post-Merger -1.7959*** IO BGI 6/08* BR Offer -0.2609 0.0066*** -0.4898***
(-4.77) (-0.67) (3.27) (-8.49)
Change IO BlackRock 1.4404*** IO BGI 6/08* Anti-trust -1.2180*** 0.0120*** -0.5438*** (3.44) (-4.26) (7.15) (-9.26)
Change MCap 0.1025*** IO BGI 6/08* Completion -0.2306 0.0139*** -0.6313***
(3.65) (-0.99) (10.30) (-11.54) Log MCap 0.0099*** Residual IO -0.0380*** -0.0004*** -0.0057**
(4.48) (-3.72) (-4.36) (-2.31)
Pastreturn 0.0964*** Residual IO * BR Offer 0.0424** 0.0000 -0.0131*** (6.08) (2.22) (0.06) (-3.84)
Log BTM -0.0031 Residual IO * Anti-trust 0.0447*** -0.0002* -0.0101*** (-0.69) (2.88) (-1.66) (-2.94)
Dividend Yield -0.0032** Residual IO * Completion 0.0420*** -0.0002*** -0.0126***
(-2.23) (3.06) (-2.73) (-4.14)
ROE 0.0005***
(4.61)
Leverage -0.0020 (-0.13)
Cash 0.0690***
(3.24)
Controls & Interactions: Y Y Y Y Country F.E.: Y Y Y Y
Industry F.E.: Y Y Y Y
Stock F.E.: N N N N Time F.E.: Y Y Y Y
Observations 18,878 107,490 106,947 105,730
Adjusted R2 0.0679 0.05 0.07 0.55