Embed Size (px)
Citation preview

Who Enters Teaching? Encouraging Evidence that the Status of Teaching is Improving
November 2014
Hamilton Lankford University of Albany
Susanna Loeb
Stanford University
Andrew McEachin North Carolina State University
Luke C. Miller (corresponding author)
University of Virginia
James Wyckoff University of Virginia
Corresponding author contact information:
Curry School of Education Center for Education Policy and Workforce Competitiveness
405 Emmet Street, P.O. Box 400277, Charlottesville, VA 22904 [email protected], (434) 924-0774, Fax (434) 924-1384
Abstract The relatively low status of teaching as a profession is often given as a factor contributing to
the difficulty of recruiting teachers, the middling performance of American students on international assessments, and the well-documented decline in the relative academic ability of teachers through the 1990s. Since the turn of the 21st century, however, a number of federal, state, and local teacher accountability policies have been implemented toward improving teacher quality over the objections of some who argue the policies will decrease quality. In this paper we analyze 25 years of data on the academic ability of teachers in New York State and document that since 1999 the academic ability of both individuals certified and those entering teaching has steadily increased. These gains are widespread and have resulted in a substantial narrowing of the differences in teacher academic ability between high and low poverty schools and between white and minority teachers. We interpret these gains as evidence that the status of teaching is improving.
We are grateful to the College Board and the New York State Education Department for the data employed in this paper. We also appreciate financial support from the National Center for the Analysis of Longitudinal Data in Education Research (CALDER). CALDER is supported by IES Grant R305A060018. The research was also supported by the Institute of Education Sciences, U.S. Department of Education, through Grant R305B100009 to the University of Virginia. We thank David Deming, Joseph Frey, Dan Goldhaber, Betheny Gross, Morgan Polikoff, and three anonymous reviewers for the many helpful comments they provided on earlier versions of this paper. The views expressed in the paper are solely those of the authors and may not reflect those of the funders. Any errors are attributable to the authors.

1
Who Enters Teaching? Encouraging Evidence that the Status of Teaching is Improving
American society has lamented, debated, and joked about teachers for well over a century. In
some circles, it has become conventional wisdom that U.S. teachers embody Shaw’s (1903)
quotation: “He who can, does. He who cannot, teaches.” While teachers may be well respected
individually (Bushaw & Lopez, 2011), teaching as a profession is of lower status than other skilled
and licensed professions such as medicine, law, and engineering (Ingersoll & Mitchell, 2011). This
lower status feeds off of and reinforces a sense that anyone can be a teacher whereas only the
brightest can be a doctor, lawyer, or engineer. Educational leaders have long been concerned about
the professional standing of teachers due to the effect of teaching’s lower status on who chooses to
enter the profession, the subsequent quality of teaching, and student achievement (Allen, 1926).
Many attribute the middling standing of U.S. students on international achievement tests relative to
countries like Finland and Singapore (OECD, 2014) in part to the lower status of teaching in the
U.S. (Paine & Schleicher, 2011; Ripley, 2013; Schleicher, 2012).
The various federal and state teacher accountability policies implemented over the last
fifteen years intended to improve the quality of entering teachers may have raised the profession’s
status. Policies that increase the requirements to become a teacher, proponents assert, will
emphasize the specialized knowledge and skills required to deliver high quality instruction and
ensure that only well-prepared, highly abled individuals enter the classroom, thereby raising the
quality of the teacher workforce (American Federation of Teachers, 2000; The National
Commission on Teaching & America’s Future, 1996). Others, however, argue these policies will
have the opposite impact because they increase the barriers, or costs, of entry causing high ability
individuals to opt out of teaching (Angrist & Guryan, 2008; Ballou & Podgursky, 1998). With the
ultimate goal of increasing teacher quality, New York State (NYS) implemented many such policies
targeting the selection of individuals into the profession beginning in the late 1990s. In this paper we

2
present findings from an analysis of whether this coincided with changes in the academic abilities of
incoming teachers, an indicator of the status of the teaching profession.
Significant attention has been given to how to increase the status (or professionalism) of
teaching. In addition to focusing on the licensing and training of teachers (Darling-Hammond, Wise,
& Klein, 1999), proposals to raise the status of teaching have also identified issues of compensation
and working conditions (Firestone & Bader, 1992; Odden & Kelley, 2001) and the distribution of
power, authority, and control over issues such as curriculum, evaluation, and budgets (Ingersoll,
2003). The extent to which these proposals can raise the status of teaching rests with how they
influence the three dimensions of status: occupational prestige, occupational status, and occupational
esteem (Hoyle, 2001). To raise teaching’s occupational prestige, the general public’s perception of
teaching must increase relative to other professions. Teaching’s occupational status will increase as
particular knowledgeable groups such as other professionals, who are themselves held in high regard
by the general public, give teaching their stamp of approval as a profession rather than merely an
occupation. Finally, teaching’s occupational esteem will improve as the public’s perception of teacher’s
job performance, specifically, the dedication, competence, and care teachers exhibit, grows more
favorable.
Increases in teachers’ academic ability signals the status of teaching may be improving
(Barber & Mourshed, 2007; Hargreaves, 2009; Paine & Schleicher, 2011) as it is an indicator that
teaching’s occupational prestige and esteem are on the rise. As more high-ability individuals choose
teaching over other professions, more people will view teaching as an occupation for those who do
rather than those that can’t, turning Shaw’s quotation on its head, and raising the occupational
prestige of teaching. To the extent greater academic ability assists teachers with their job
performance, recruiting more academically abled individuals to teaching will also raise teaching’s
occupational esteem. Academic or cognitive ability is one of the few observable teacher

3
characteristics prior research has shown to be positively and consistently (though not strongly)
associated with student achievement (Clotfleter, Ladd, & Vigdor, 2007; Ehrenberg & Brewer, 1995;
Greenwald, Hedges, & Laine, 1996; Hanushek, 1986). Given the central role recruitment plays in
determining the composition of the teacher labor force, an understanding of trends in the academic
ability of individuals entering the profession is important.
Extant research makes clear that the average academic abilities of individuals who entered
teaching in the U.S. were not high relative to other professions and consistently fell over the last
third of the 20th century. Several analyses conducted prior to 2000 document cross-sectional
evidence that college graduates with higher SAT or ACT scores are less likely to enter teaching
(Goldhaber & Liu, 2003; Hanushek & Pace, 1995; Manski, 1985; Vegas, Murnane & Willett, 2001).
More recently longitudinal analyses document the decline in the cognitive abilities of entering
teachers from 1960 through 2000 (Bacolod, 2007; Corcoran, Evans, & Schwab, 2004; Podgursky,
Monroe, & Watson, 2004). For example, Corcoran et al. (2004) find that in the 1960s, women in the
top ability decile were almost twice as likely to enter teaching as the average high school graduate; by
2000, they were only slightly more likely to teach than the average graduate. Podgursky et al. (2004)
examine the ACT scores of Missouri novice teachers from 1990 to 2000 and show teachers’ scores
remain relatively constant, but decline relative to the average high school senior over this period.
Bacolod (2007) and Murnane and colleagues (1991), examining somewhat different time periods,
produce similar evidence. For example, among college graduates born between 1941 and 1945, and
thus entering the labor force in the mid-1960s, Bacolod finds that approximately 50 percent of
women in the top quintile of test scores became teachers, while for those born in 1963 and 1964
(labor-force entry in mid-1980s) this figure declined to under 20 percent. Each of these descriptive
studies ascribes these changes to the shift in the norms and expectations of women in the workforce

4
and the professions open to them. They perceived teaching as a comparatively lower status
profession.
The abilities of teachers have received far greater scrutiny since the late 1990s, the result of
increased emphasis on student achievement in federal, state, and local policy and greater recognition
of the key role of teachers (Figlio & Loeb, 2011). Many states have increased teacher licensure
requirements intending to prevent the least qualified individuals from entering the profession. The
federal government as part of No Child Left Behind (NCLB) has required that school districts
receiving Title I funds ensure that all teachers of any core academic subjects meet the Highly
Qualified Teacher (HQT) provision starting with academic year 2006-07. To be highly qualified, a
teacher must hold a bachelor’s degree, be fully state-certified, and demonstrate competency in the
core subject(s) taught by earning a major or equivalent in the subject or passing a subject-matter test
(Loeb & Miller, 2009). In addition to increasing teacher quality overall, many of these policies also
seek a more equitable distribution of teacher quality such that it is no longer the case that teachers in
some schools, especially difficult-to-staff high-poverty schools, are lower quality (as defined by these
policies) than teachers in other schools.
With these changes in mind, Goldhaber and Walch (2013) examine whether the academic
ability of novice teachers increased following the introduction of NCLB using three Baccalaureate
and Beyond (B&B) survey waves. They find that the average SAT percentile ranking of teachers fell
from 45 in 1994 to 42 in 2001 but increased to 50 by 2009. Goldhaber and Walch also find that
prior to 2009 there was a strong negative relationship between academic ability and the decision to
apply to teach. In 2009 this relationship was insignificant, suggesting a greater interest in teaching
among more academically able college students than in the past. This analysis is a step forward in
understanding recent changes in the academic abilities of entering teachers, but data limitations leave
a number of questions unanswered. First, since B&B only has one wave of data following NCLB, it

5
is not possible to infer post-NCLB trends. Second, because B&B is a relatively small sample of
entering teachers, it cannot provide detailed information on how shifts in teacher characteristics
varied across different types of schools and teachers, which is important for understanding the
potential equity effects of recent shifts.
In this paper we document how the relationship between academic ability and the decision
to become a teacher changed over the 25 years between 1985-86 and 2009-10 using rich annual
teacher-level data which includes SAT scores (an important albeit imperfect measure of academic
ability) and a number of other attributes for all public school teachers in NYS from 1986 to 2010.
These data, while specific to one state, provide many advantages over the nationally-representative
data used in the prior literature. For instance, we are better positioned to assess the impact of NCLB
given we have many more than one post-NCLB observation. Also, with data on the population of
NYS public school teachers rather than a sample as well as data on what and where they teach, we
are able to conduct an in-depth analysis into potential variation in trends in academic ability. NYS,
with its roughly 700 districts and its racial, economic, and geographic diversity, make it a very
important state in which to explore changes in the relationship between academic ability and the
decision to become a teacher.
We find that the academic ability of both individuals certified and those entering teaching
has increased since 1999, with the increase much larger for those hired to teach (24 percent of a
standard deviation increase in SAT scores). This gain largely reflects a substantial increase in the
portion of teachers drawn from the top third of the SAT distribution. These gains are signals that
the status of teaching may be improving, particularly among those making early career choices. To
assess the degree to which these improvements are widespread, as envisioned by many policies, we
explore whether these improvements differ across labor markets, subjects, and grade levels as well as
with teacher and school characteristics. We find broad-based improvements and, in particular, a

6
substantial narrowing of the differences in average teacher academic ability between high and low
poverty schools and between white and minority teachers. Given space constraints, we have placed
supplemental, though important, information on our analytic sample of teachers and additional
results in an appendix and reference it throughout the text below.
Background
Regulations governing teacher preparation and certification in NYS changed substantially
beginning in 1998 with the release of the Board of Regents’ new teaching policy Teaching to Higher
Standards: New York’s Commitment (The NYS Board of Regents and The NYS Education Department,
1998). The policy document laid out a series of reforms designed to recruit, train, and retain the high
quality teachers needed to help students meet the higher standards of achievement adopted several
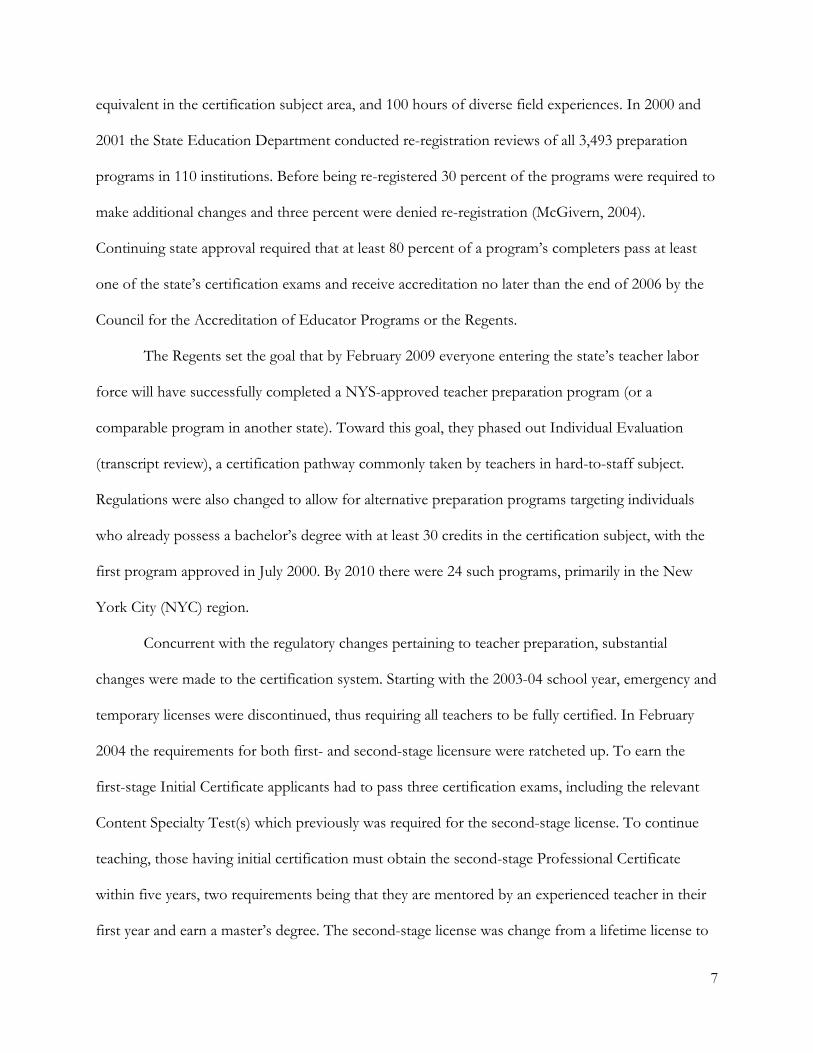
years earlier. The timeline in Exhibit 1 summarizes this and subsequent policy changes intended to
increase the requirements needed to teach in NYS.
Timeline Policy Event 7/1998 NYS Board of Regents enacted a new teaching policy.
7/2000 Regents approve the first alternative teacher certification program.
12/2001 All teacher education programs reviewed and reregistered.
9/2003 Temporary teaching licenses eliminated with few exceptions.
2/2004 First- and second-stage licenses given new requirements.
9/2005 Federal HQT requirement takes effect.
12/2006 All preparation programs required to be accredited.
EXHIBIT 1. Timeline of teacher accountability policies in New York State
The initial focus was on strengthening teacher preparation through new coursework and
accreditation requirements. Coursework requirements for certification were increased to include the
completion of a broad core of courses in liberal arts and sciences, a pedagogical core, a major or
7
equivalent in the certification subject area, and 100 hours of diverse field experiences. In 2000 and
2001 the State Education Department conducted re-registration reviews of all 3,493 preparation
programs in 110 institutions. Before being re-registered 30 percent of the programs were required to
make additional changes and three percent were denied re-registration (McGivern, 2004).
Continuing state approval required that at least 80 percent of a program’s completers pass at least
one of the state’s certification exams and receive accreditation no later than the end of 2006 by the
Council for the Accreditation of Educator Programs or the Regents.
The Regents set the goal that by February 2009 everyone entering the state’s teacher labor
force will have successfully completed a NYS-approved teacher preparation program (or a
comparable program in another state). Toward this goal, they phased out Individual Evaluation
(transcript review), a certification pathway commonly taken by teachers in hard-to-staff subject.
Regulations were also changed to allow for alternative preparation programs targeting individuals
who already possess a bachelor’s degree with at least 30 credits in the certification subject, with the
first program approved in July 2000. By 2010 there were 24 such programs, primarily in the New
York City (NYC) region.
Concurrent with the regulatory changes pertaining to teacher preparation, substantial
changes were made to the certification system. Starting with the 2003-04 school year, emergency and
temporary licenses were discontinued, thus requiring all teachers to be fully certified. In February
2004 the requirements for both first- and second-stage licensure were ratcheted up. To earn the
first-stage Initial Certificate applicants had to pass three certification exams, including the relevant
Content Specialty Test(s) which previously was required for the second-stage license. To continue
teaching, those having initial certification must obtain the second-stage Professional Certificate
within five years, two requirements being that they are mentored by an experienced teacher in their
first year and earn a master’s degree. The second-stage license was change from a lifetime license to

8
one renewable every five years conditional on having completed 175 hours of professional
development.
New York initiated these efforts almost four years before the federal HQT provision was
authorized as part of NCLB in January 2002. Many of the changes in New York’s certification
requirements announced in 1998 ensured new teachers would be deemed HQT. In 2004-05, 92.1
percent of elementary and 93.1 percent of secondary core academic classes in New York were taught
by HQTs. In 2009-10, these statistics had improved to 98.6 and 97.0 percent, respectively (USDOE,
2005 and 2010). Almost all this improvement occurred in high poverty schools where the
percentages increased from 82.0 to 96.9 percent in elementary schools and from 80.0 to 91.8 percent
in secondary schools (USDOE, 2005 and 2010). The rates at low poverty schools increased roughly
2 to 3 percentage points to over 99 percent.
Some of these policies had much greater impacts on hiring in some districts than others due
to differences in pre-reform district hiring practices and applicant pools. A good example is the
combined effects of eliminating emergency and temporary licenses and the introduction of
alternative certification. As detailed elsewhere (Boyd, Lankford, Loeb, Rockoff, & Wyckoff, 2008),
prior to 2001, about 50 percent of all new teachers in NYC had temporary licenses. On average
these teachers had lower qualifications on measures such as undergraduate college selectivity and
SAT scores than did certified teachers. To replace the roughly 2,500 temporary-licensed teachers
NYC had been hiring each year, the NYC Department of Education established its own alternative
certification program, the NYC Teaching Fellows. Admission to the program is very competitive:
teaching fellows have qualifications that substantially exceed those of the temporarily licensed
teachers they effectively replaced as well as traditionally prepared teachers. More recently, alternative
certificate programs have opened in other regions of the state.

9
Data and Methods
Our outcome measures are the math and reading SAT scores of individuals who completed
certification to teach in NYS, which made them eligible to be hired, and individuals who eventually
were hired to teach in NYS public schools from 1985-86 through 2009-10. We benchmark teachers’
SAT scores against the distribution of SAT scores for all SAT takers enrolled in a public school in
NYS between 1979-80 and 2007-08. Given its wide-spread use and sound psychometric properties,
the SAT provides useful insight into ability although it may systematically misreport the ability of
specific population subgroups owing to its high stakes use in college admissions raises concerns
(Steele & Aronson, 1995). We therefore also explore the competitiveness of the undergraduate
institutions teachers attended (i.e., the Barron’s ratings).
The remaining data come from the NYS Education Department which allow us to link test-
takers to their high school and community characteristics: licensure files list all certification areas in
which an individual has been certified to teach, personnel files provide course-level assignments for
all public school teachers, and school files provide characteristics of all public schools.1 When
individuals are found in multiple databases they are linked using a unique identifier. We observe
220,332 individuals receiving their first entry-level certificate and 151,747 early career teachers placed
in their first teaching position.2
Much of our analysis examines trends in SAT scores standardized by test-taking year. Thus
we are examining whether those certified to teach and those hired to teach are drawn from different
portions of the SAT distribution over time. Our use of standardized rather than raw SAT scores
allows us to compare these two groups to all SAT-takers in the same high school cohorts directly 1 School characteristics for 2009-10 are pulled from the Common Core of Data. 2 Entry-level certificates include the Initial certificate, the Transitional certificate (for persons participating in an alternative preparation program), and emergency/temporary licenses. Entering teachers include all persons with an entry-level certificate observed in their first teaching assignment plus any first-year teacher not, for whatever reason, observed in the certificate data (1.6 percent of all entering teachers). We exclude from both groups teaching assistants, adult education teachers, coaches, and non-classroom administrators. Additional information on the analytic sample is included in the appendix.

10
using a single statistic. It should be noted that the story of how SAT scores have changed over time
changes little when we use raw scores (see footnote 7). We group certified individuals and entering
teachers into cohorts by the year they earned their first entry-level certificate.3
An important consideration is whether our findings are distorted by compositional changes
over time. If the proportion of students taking the SAT increased and the “new” test-takers on
average had lower scores, then those individuals certified to teach as well as those entering teaching
could have relatively higher SAT scores even if they were no more able than those from earlier
cohorts. However, this concern appears unwarranted. Annual mean combined math and verbal SAT
scores for all test takers show no consistent pattern over the 1980 to 2008 period and never deviate
from the grand mean across all years by more than 11 combined SAT points or about 5 percent of a
standard deviation (appendix Figure A1). Likewise, we observe only a modest increase in the
variance of combined SAT scores over the period. These trends provide evidence that changes we
might observe in the percentile rankings of teachers are unlikely to be an artifact of changes in the
overall composition of our SAT sample.
In a typical year we observe SAT scores for somewhat more than 50 percent of all
individuals who are initially certified or employed as teachers in NYS public schools (appendix Table
A1).4 SAT scores are missing for three categories of individuals: i) those enrolled in NYS private
schools and taking the SAT in 2002 or later, ii) those taking the test outside of NYS, and iii) persons
not taking the SAT. This SAT-score-missingness will not pose a problem if each of these three
categories of individuals are either a small share of the full populations (certified individuals, entering
teachers, and their high school peers) or the unobserved trends in their academic abilities are
3 Throughout our analysis, unless noted otherwise, we report years as the spring of the academic year in which an individual received her first entry-level certification, which is typically 5 years following taking of the SAT exam and 1 year prior to when most teachers first become employed as a teacher. Entering teachers not observed in the certification data are assigned the certification cohort one year prior to their first year as a teacher. 4 We observe SAT scores for more than half of certified individuals in 13 of the 25 cohort and for entering teachers in 16 of the 25 cohorts.

11
consistent with the trends in the academic abilities of those for whom we have SAT scores. Our
exploration of the missingness leaves us confident the trends in academic abilities of our analytic
sample are representative of the full population, a full treatment of which is provided in the
appendix. First, we rerun our main analysis using a sample restricted to all NYS students taking the
SAT between 1980 and 2001, a period over which we have SAT scores from both NYS public and
private schools. The results show we are somewhat underestimating the change in academic ability
as a result of excluding individuals who attended NYS private schools when taking the SAT
(appendix Figures A3 and A4). Second, in the appendix we report results from an analysis of an
alternative measure of academic ability – the selectivity of the colleges attended (Barron’s ratings) by
those certified to teach and those entering teaching. This is useful because our college-selectivity
measure has substantially fewer missing values (roughly 12 percent) and a pattern of missing data
that is quite different from that for SAT scores. Most important, college selectivity is both a direct
measure of academic ability, a useful proxy for missing SAT scores, and may pick up variation in
individuals’ academic ability not captured by SAT scores. The trends in college selectivity among
certified individuals and entering teachers between those with SAT scores and those missing SAT
scores for any reason are very similar and indicate we are likely underestimating the increase in
academic abilities after 2002 (appendix Figure A5).
Results
How has the academic ability of entering teachers changed?
We find that the academic ability of individuals who were certified or entered teaching
declined relative to the overall distribution of SAT scores from 1986 through 1999, as shown in
Figure 1.5 This decline is consistent with prior research employing a variety of national samples
along with a variety of measures of academic and cognitive ability. The trend is reversed after 1999
5 In a typical cohort about 70 percent of all individuals receiving certification eventually teach in a NYS public school.

12
with those receiving certification and those entering teaching improving substantially. The overall
patterns of the relative abilities of those certified and those entering teaching are similar. However,
these trends reflect some important differences.
{Insert Figure 1 about here}
Both certified individuals and entering teachers experience roughly the same decline in
average academic ability from 1986 to 1999 – declining about 13 percent of a standard deviation of
combined SAT scores. However, entering teachers hired in 2010 have combined SAT scores that are
more than 27 percent of a standard deviation higher than those hired in 1999 compared to an
increase of 9 percent of a standard deviation for the pool of individuals newly certified.6 These
patterns suggest that the supply of candidates navigating licensure requirements improved
meaningfully but that the demand for more academically-abled teachers exerted an even larger
influence.7 Given that both the status of the teaching profession and student achievement are
affected more by who enters teaching (rather than those certified but who fail to teach) and given
that entering teachers had the much larger improvement in the academic ability, compared to those
certified individuals, we focus our remaining analyses on understanding the dynamics of
improvement for entering teachers.8
The increases in the average relative scores of new teachers may mask important
distributional changes. Recall that Bacolod (2007) finds that during the 1970s and 1980s the overall
6 The bump in average SAT scores for the 2005 and 2006 certification cohort reflects the unusually smaller size of these cohorts because the 2004 cohort is unusually large as individuals rushed into the teacher labor market just prior to the additional testing requirements (see appendix Table A1). By 2007, cohorts have returned to their pre-requirement-change size. 7 We find the same pattern if we consider trends in the raw SAT scores, providing further evidence compositional changes are not driving our results. The average raw scores of both certified individuals and entering teachers decrease by roughly a third of a standard deviation by 1999 (33 points to a score of 1003 and 33 points to a score of 999, respectively). Between 1999 and 2010, however, average scores for those certified increases 27 points to a score of 1030 but the average score for entering teachers increases 65 points to a score of 1064. 8 The average relative SAT scores for certified individuals and entering teachers in 2010 are statistically different from the average scores in 1999 and 1986 (p<.01). The within group differences between 1999 and 1986 are also statistically significant (p<.01). While the decline in SAT scores among entering teachers between 1986 and 1999 is not statistically different from the decline for certified individuals, SAT scores for entering teachers improved more between 1999 and 2010 than certified individuals (p<.01).

13
decline is primarily driven by decreases in the portion of teachers drawn from the top quintiles of
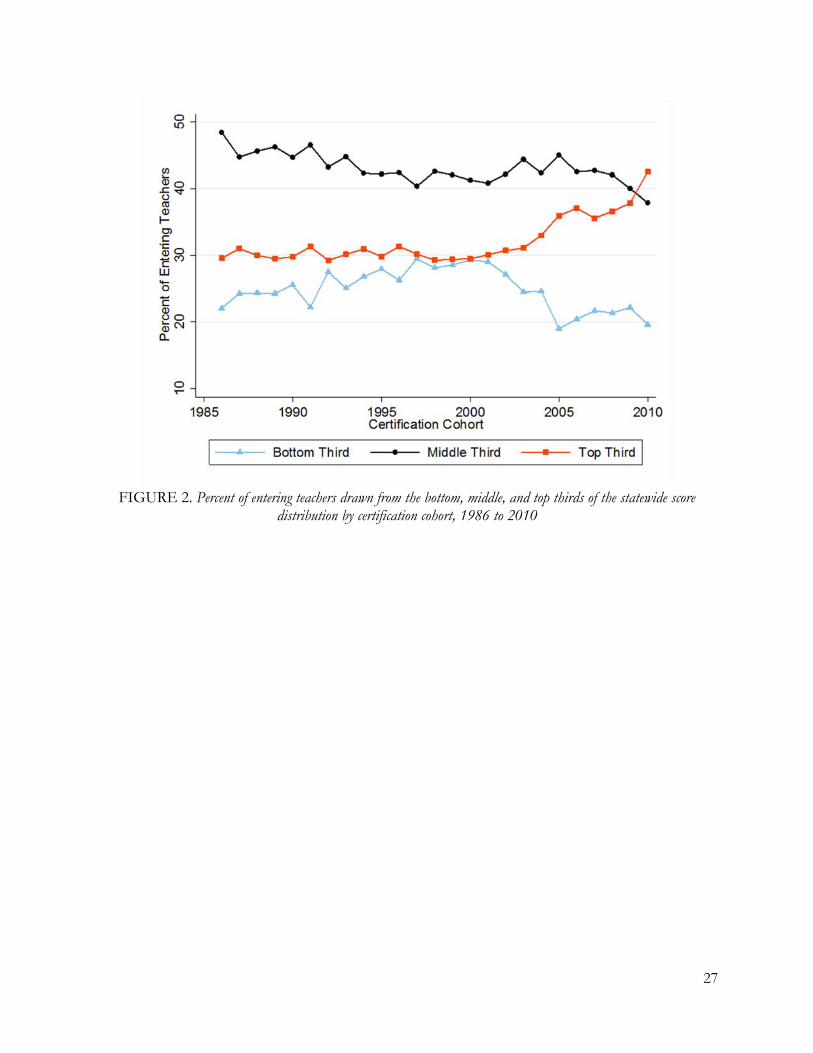
ability. In NYS, as shown in Figure 2, the decrease in the average relative scores of entering teachers
between 1986 and 1999 is driven by a nearly 7 percentage point increase in the share of teachers
drawn from the bottom third of the SAT score distribution while the share from the top third
remains a relatively constant 30 percent. After 1999, however, the proportion of entrants drawn
from the bottom third decreases almost 7 percentage points and the share from the top third
increases by over 13 percentage points to over 40 percent by 2010. This is a remarkable change and
suggests the status of teaching as a career has increased.
{Insert Figure 2 about here}
We also find the selectivity of the undergraduate institutions attended by entering teachers
increases between 1999 and 2005, the last cohort for which we have good information. The share of
entering teachers who attended the most competitive undergraduate institutions increases 3.6
percentage points to 17 percent, and the share who attended competitive colleges increases 3.1
percentage points to 28 percent (appendix Figure A6). Over the same period, there are declines in
the shares of entering teachers who attended less competitive colleges (down 4 percentage points to
46 percent) and non-competitive colleges (down 2.7 percentage points to 9 percent). There are also
considerable increases in academic ability within these four collegiate groups with the percent of
entering teachers coming from the top third of the SAT score distribution increasing (2 to 8
percentage points depending on competitiveness level) and the proportion from the bottom third
decreasing (4 to 17 percentage points depending on competitiveness level) (appendix Table A2).9
9 Goldhaber and Walch find no changes in college selectivity.

14
Are the improvements widespread throughout or narrowly concentrated within the state?
The score increases shown in Figures 1 and 2 are yearly averages and do not provide
information on how widespread the changes are across regions, subjects, and grades. We explore
this variation below.
Regional Changes. We find directionally similar trends across all regions of the state, with
more dramatic changes in some regions. Improvements among NYC teachers are larger and begin
somewhat earlier than for the other 700 school districts in New York. Between 1999 and 2010
average SAT scores of individuals from NYC receiving certification increase by 18 percent of a
standard deviation and those of individuals newly hired to teach in NYC improve by 49 percent of a
standard deviation (appendix Figure A6). Here again, average quality of likely teacher applicants has
improved, with schools becoming more selective, hiring relatively more academically able
individuals. The nature of this improvement reflects a dramatic change in the position of NYC
teachers in the overall SAT distribution.
In 1999, 43 percent of individuals hired to teach in NYC are drawn from the bottom third of
the SAT distribution; by 2010, 24 percent are (Figure 3). In 1999, 21 percent of novice NYC
teachers have SAT scores in the top third; by 2010 this figure increases to 40 percent. Most of this
change occurs between 1999 and 2005. For example, all of the decline in the share of teachers drawn
from the bottom third of the SAT distribution that occurs between 1999 and 2010 occurred by 2005
as well as 84 percent of the increase in the share coming from the top third of the distribution.
{Insert Figure 3 about here}
Trends in teacher academic ability in the other school districts in NYS are, on average, a
muted version of the transition that occurred in NYC, although the timing is delayed a bit. Outside
of NYC average SAT scores continued to fall until 2004. From 2004 to 2010 the average combined
SAT scores of new teachers improves by 18 percent of a standard deviation, a substantial increase

15
but smaller than in NYC (appendix Figure A7). As indicated in Figure 4, 24 percent of new teachers
in 2004 have SAT scores that place them in the bottom third of all SAT takers; by 2010 that figure
has fallen to 17 percent. Over the same period the share of entering teachers from the top third has
increased from 33 percent to 44 percent.
{Insert Figure 4 about here}
Further dividing schools outside NYC into city, suburb, town, and rural categories using the
U.S. Department of Education’s urban-centric locale codes (n.d.), we find very similar patterns—
improvements in entering teachers’ SAT scores of between 14 and 29 percent of a standard
deviation between 1999 and 2010 (appendix Figure A8). These results provide evidence that the
phenomenon of improving academic ability is prevalent across most districts.
Grade and Subject. The skills and subject-matter knowledge required to teach some hard-
to-staff subjects such as mathematics and science, particularly to high school students, are also in
high demand in other professions. Some would argue these higher opportunity costs combined with
the stricter enter requirements would cause teacher academic ability in these subjects to decrease
relative to other grades and subjects. We explore this possibility by examining the trends in academic
ability of three groups of teachers: elementary, hard-to-staff subjects (mathematics, science, special
education, and bilingual education), and other subjects and find similar patterns overall (appendix
Table A3). Improvements between 1999 and 2010 are more pronounced for entering teachers in
hard-to-staff subjects (25 percent of a standard deviation versus 23 and 17 percent for elementary
teachers or teachers of other subjects, respectively). Again, these patterns hold for teachers entering
NYC and the rest of the state (results available upon request).
School Poverty. A primary motivation for changes in policies pertaining to teacher quality
has been the desire to equalize teacher quality across student subpopulations, with success requiring
greater improvements among the novice teachers entering high poverty schools. To assess what the

16
trends in academic ability signal as to the progress made toward this goal, we group NYS public
schools into quintiles based on student poverty separately for elementary and middle and high
schools.10 As shown in Figure 5, the academic ability of entering teachers improves for both rich and
poor schools with greater improvements in schools enrolling relatively more poor students. The
average SAT score of entering teachers in the poorest 20 percent of schools (top quintile) decreases
15 percent of a standard deviation, more than in the three least poor quintiles, but then increases 50
percent of a standard deviation by 2010, substantially more than any other quintile. In contrast, the
average SAT score of entering teachers at the richest schools increases 32 percent of a standard
deviation throughout the full period. After growing from 1986 to 1999, there is a striking reduction
in the teacher academic ability gap between schools with more and fewer poor students so that
between 2007 and 2010 it is 27 percent smaller than what it was between 1986 and 1989. Similar, but
larger, changes characterize middle and high schools compared to elementary schools and for NYC
schools compared to schools in the rest of the state (appendix Figure A9).
{Insert Figure 5 about here}
Teacher Race and Ethnicity. Finally, we explore whether the overall improvements in
teacher academic ability come at the expense of another goal – recruiting a more diverse teacher
workforce. Non-white, non-Asian entering teachers grow from less than 16 percent of our sample in
1999 to 24 percent by 2010.11 NYS does not achieve these gains by hiring minority teachers with
lower academic ability (appendix Table A3). In fact, the average SAT score of entering minority
teachers increases 40 percent of a standard deviation between 1999 and 2010 compared to a 26
percent of a standard deviation increase among entering white and Asian teachers. The status of
teaching as perceived by those choosing careers appears to be increasing for all races and ethnicities.
10 Schools are grouped into quintiles using the average annual percent of the student body eligible for free or reduced-price lunch between 1994 and 2010. 11 Among all entering teachers (those with and without SAT scores), the percent black or Hispanic increases from 13 to 20 percent.

17
What may be driving these changes?
What accounts for this remarkable turnaround? We are not in a position to ascribe cause, but
can generate hypotheses by examining the timing and nature of the changes in policies governing
teacher qualifications and accountability pressure and the timing and nature of improvements in
academic ability. As discussed above, the early reforms in NYS involved the creation of alternative
preparation programs and the elimination of emergency licenses. For these reforms to have driven
the turnaround, the effects should be larger in NYC than the rest of the state, because NYC relied
heavily on emergency certified teachers and employs the majority of the state’s alternatively prepared
teachers. And in fact, our results show the turnaround in teacher ability begins in NYC when the
first alternative preparation program opens and then accelerates when emergency licenses are
abolished. In the rest of the state, however, the turnaround does not begin until 2005, after the
state’s certification testing requirements and the federal HQT provisions that emphasize subject
matter mastery are put in place. The likely effect of the increased emphasis on content knowledge is
also evidenced in the trends for elementary and hard-to-staff subject teachers. Whereas both begin
to improve with the introduction of alternative preparation programs and the cancellation of
emergency certificates, the average SAT scores of teachers of hard-to-staff subjects increases twice
as much as the scores for elementary teachers between 2004 and 2010 (17 versus 8 percent of a
standard deviation) who are arguably less affected by these requirements. Furthermore, the trends
are not driven solely by the recruitment of teachers through the alternative preparation programs
such as Teach for America. The average SAT score among entering teachers completing traditional
preparation programs increases 17 percent of a standard deviation between 1999 and 2010 after
declining 9 percentage points between 1986 and 1999 (appendix Table A3).
To bolster the evidence that teacher accountability policies drove the turnaround in the
average academic ability of teachers, we examine and subsequently rule out the competing

18
hypothesis that these trends could perhaps result from changes in the characteristics of the teacher
labor market such as the size of the market or salaries. For example, as salaries increase, the quality
of the teacher supply should increase. Similarly, if the market demands fewer teachers, schools
should be better able to restrict their hiring to the higher end of the ability distribution. While these
labor market changes (themselves influenced by the macroeconomic cycle and declines in
enrollment) are likely behind some of the changes in academic ability, they are probably not the
dominant driver. There are too many inconsistences with the known recessions during this period.
For example, there was a reduction in the hiring of new teachers in 1992 and 1993 following the
1991 recession, but there wasn’t a reduction following the 2001 recession. And while the 44 percent
reduction in new teacher hiring in 2010 relative to 2009 contributes to the increase in academic
ability in that year, the trend is present for almost a decade before.
We also test this hypothesis statistically. We estimate models predicting each of the trends
presented in Figures 1 through 5 controlling for proxies for changes in the local labor market (i.e.,
the district’s enrollment, percentages of teachers by race/ethnicity, starting salaries, and number of
inexperienced and experienced teachers hired plus district fixed effects). The regression-adjusted
trends, however, while suggesting macroeconomic factors were largely responsible for the early
declines in academic ability, continue to show marked improvement in teacher academic ability after
1999. By way of illustration, we show in Figure 6 the regression-adjusted trend in standardized SAT
scores of entering teachers along with the unadjusted trend which is the same as shown in Figure 1.
Changes in the teacher labor market explain very little of the increases in academic ability after 1999.
We provide both a more thorough description of these models and the regression-adjusted version
of the Figures 2-5 in the appendix (see Figures A11-A14). This provides evidence that the
turnaround in the ability of entering teachers is unlikely to be driven by changes in local labor
19
market characteristics alone and is consistent with the timing of New York and U.S. policies that
attempt to increase the qualifications of teachers.
{Insert Figure 6 about here}
Discussion
A variety of studies document a 30-year decline between the 1960s and 1990s in the
academic abilities of entering public school teachers, which corresponded to diminished respect for
teachers and for public schooling. This paper provides robust evidence of a reversal of these trends
across NYS, an important state in which to examine these trends given its roughly 700 districts and
its racial, economic, and geographic diversity. Our findings are consistent with the more limited
national evidence provided by Goldhaber and Walch (2013), and thus lend support to the
generalizability of our findings. Since about 1999 the academic ability of teachers has improved and
in many cases improved dramatically. Our evidence suggests gains in the academic ability of
individuals certified to teach (+9 percent of a standard deviation) but especially strong gains among
entering teachers (+27 percent of a standard deviation). These gains have occurred across the entire
state and particularly in high poverty schools such that differences in the academic abilities of
teachers hired at low and high poverty schools narrowed substantially. Entering teachers in NYS
also have been increasingly drawn from more competitive undergraduate institutions, another
measure of academic ability. Teaching is attracting more able applicants, and public schools are
hiring among the most academically able of these applicants.
Our results suggest that a package of policies most likely led to these improvements. The
differences in the timing and magnitude of the gains across regions of the state, grade and subject,
and school poverty levels are consistent with the increased policy scrutiny on teacher quality at the
federal level through the HQT provision of NCLB, at the state level through teacher licensure and
teacher preparation requirements, and at the local level through hiring policies and practices. The

20
results also demonstrate a key role for the state’s traditional teacher preparation programs which
trained and graduated more academically abled teachers as well as provided the classroom-based
training for the state’s alternative preparation programs. Although space constraints do not permit a
full treatment of the retention of these more academically able teachers, the fact that they are not all
being recruited through alternative preparation programs such as Teach for America suggests they
are not all leaving after a couple of years in the classroom.
While proposals to increase the status of the teaching profession call for reform in several
important areas in addition to more rigorous standards for teacher training and licensure like those
implemented in NYS, the increase in the academic ability of entering teachers is a strong signal that
the status of the teaching profession is increasing. Academic ability speaks to two of the three
dimensions of status—occupational prestige and esteem (Hoyle, 2001). When teachers are
increasingly drawn from the lower end of the SAT distribution, as was true during most of the
1990s, teaching’s occupational prestige diminishes as the public loses respect for teachers, teaching,
and public education. The sustained decline in the academic ability of teachers from the 1960s
through the 1990s likely contributed to a message that able individuals should not seek out a career
in public education, further perpetuating this decline. Since 2000, however, individuals choosing
careers are receiving a different message with more academically able individuals choosing to enter
teaching rather than another highly regarded profession. The increased academic ability of entering
teachers also indicates teaching’s occupational esteem is on the rise to the extent academic ability
positively correlates to classroom effectiveness (Boyd et al., 2008; Clotfelter et al., 2007) and thus the
public’s perception of teacher’s job performance. The reversal of the trends in academic ability over
the last decade signals a resurgence of interest in teaching in public schools as a respected and
worthy career and the rising status of the teaching profession.

21
References
Allen, Ira M. (1926). Improving the Professional Status of Teachers. The Elementary School Journal, 26,
430-440.
American Federation of Teachers (2000). Building a profession: Strengthening teacher preparation and
induction. Washington, DC: American Federation of Teachers.
Angrist, Joshua D., & Guryan, Jonathan (2008). Does teacher testing raise teacher quality? Evidence
from state certification requirements. Economics of Education Review, 27, 483-403.
Bacolod, Marigee P. (2007). Do alternative opportunities matter? The role of female labor markets
in the decline of teacher quality. The Review of Economics and Statistics, 89, 737-751.
Ballou, Dale, & Podgursky, Michael (1998). The case against teacher certification. National Affairs,
132, 17-29.
Barber, Michael, & Mourshed, M. (2007). How the world’s best-performing school systems come out on top.
New York: McKinsey & Company.
Boyd, Donald, Lankford, Hamilton, Loeb, Susanna, Rockoff, Jonah, & Wyckoff, James (2008). The
narrowing gap in New York City teacher qualifications and its implications for student
achievement in high-poverty schools. Journal of Policy Analysis and Management, 27, 793-818.
Bushaw, William J., & Lopez, Shane J. (2011). Betting on Teachers: The 43rd Annual Phi Delta
Kappa/Gallup Poll of the Public’s Attitudes Toward the Public Schools. Phi Delta Kappan,
93(1), 8-26.
Clotfleter, Charles, T., Ladd, Helen, F., & Vigdor, Jacob (2007). Teacher credentials and student
achievement: Longitudinal analysis with student fixed effects. Economics of Education Review,
26, 673-682.
Corcoran, Sean P., Evans, William N., & Schwab, Robert M. (2004). Women, the labor market, and
the declining relative quality of teachers. Journal of Policy Analysis and Management, 23, 449-470.

22
Darling-Hammond, Linda, Wise, Arthur E., & Klein, Stephen P. (1999). A license to teach: Raising
standards for teaching. San Francisco: Jossey-Bass Publishers.
Ehrenberg, Ronald G., & Brewer, Dominic J. (1995). Did teachers’ verbal ability and race matter in
the 1960s? Coleman revisited. Economics of Education Review, 14, 1-21.
Figlio, David, & Loeb, Susanna (2011). School accountability. In E.A. Hanushek, S. Machin, and L.
Woessmann (Eds.), Handbooks in economics: economics of education (pp. 383-421). The
Netherlands: North-Holland.
Firestone, William A., & Bader, Beth D. (1992). Redesigning teaching: Professionalism or bureaucracy?
Albany, NY: State University of New York Press.
Goldhaber, Dan, & Liu, Albert (2003). Occupational Choices and the Academic Proficiency of the
Teacher Workforce. In W.J. Fowler (Ed.), Developments in School Finance 2001–02 (pp. 53-75).
Washington, DC: National Center for Education Statistics.
Goldhaber, Dan, & Walch, Joe (2013). Rhetoric versus reality: Is the academic caliber of the teacher workforce
changing? CEDR Working Paper 2013-4. Seattle, WA: University of Washington.
Greenwald, Rob, Hedges, Larry V., & Laine, Richard D. (1996). The effect of school resources on
student achievement. Review of Educational Research, 66, 361-396.
Hanushek, Eric A. (1986). The economics of schooling: Production and efficiency in public schools.
Journal of Economic Literature, 24, 1141-1177.
Hanushek, Eric A., & Pace, Richard R. (1995). Who chooses to teach (and why)? Economics of
Education Review, 14, 101-117.
Hargreaves, Linda (2009). The status and prestige of teachers and teaching. In. L.J. Saha and A.G.
Dworkin (Eds.), International handbook of research on teachers and teaching (pp. 217-229). New
York: Springer.
23
Hoyle, Eric (2001). Teaching: prestige, status and esteem. Educational Management, Administration, and
Leadership, 29, 139-152.
Ingersoll, Richard M. (2003). Who controls teachers’ work? Power and authority in America’s schools.
Cambridge: Harvard University Press.
Ingersoll, Richard M., & Mitchell, Elizabeth (2011). The Status of Teaching as a Profession. In J.
Ballantine and J. Spade (Eds.), Schools and society: A sociological approach to education, 4th Edition
(pp. 185-189). California: Pine Forge Press/Sage Publications.
Loeb, Susanna, & Miller, Luke C. (2009). A Federal Foray into Teacher Certification: Assessing the
“Highly Qualified Teacher” Provision of NCLB. In M. Rebell and J. Wolff (Eds.), NCLB at
the crossroads: Reexamining the federal effort to close the achievement gap (pp. 199-229). New York:
Teachers College Press.
Manski, Charles F. (1985). “Academic Ability, Earnings, and the Decision to Become a Teacher:
Evidence from the National Longitudinal Study of the High School Class of 1972,” NBER
working paper no. 1539. Cambridge, MA: NBER.
McGivern, Diane O. (2004, February 3). Update: Regents 1998 Teaching Policy [Letter to the Honorable
Members of the Board of Regents]. Albany, New York: New York State Education
Department.
Murnane, Richard J., Singer, Judith D., Willett, John B., Kemple, James J., & Olsen, Randall J.
(1991). Who will teach? Policies that matter. Cambridge, MA: Harvard University Press.
The National Commission on Teaching & America’s Future (1996). What matters most: Teaching for
America’s future. New York, New York: NCTAF.
The New York State Board of Regents and The New York State Education Department (1998). New
York’s commitment: Teaching to higher standards. Albany, New York: New York State Education
Department.

24
Odden, Allan, & Kelley, Carolyn (2001). Paying teachers for what they know and do: New and smarter
compensation strategies to improve schools (2nd Edition). Thousand Oaks: Corwin Press, Inc.
OECD (2014). PISA 2012 results: What students know and can do – student performance in mathematics,
reading and science (Volume I, Revised edition, February 2014). Paris: PISA, OECD Publishing.
DOI: 10.1787/9789264208780-en.
Paine, Steven L., & Schleicher, Andreas (2011). What the U.S. can learn from the world’s most successful
education reform efforts. New York: McGraw-Hill Research Foundation.
Podgursky, Michael, Monroe, Ryan, & Watson, Donald (2004). The academic quality of public
school teachers: an analysis of entry and exit behavior. Economics of Education Review, 23, 507-
518.
Ripley, Amanda (2013). The smartest kids in the world: and how they got that way. New York, New York:
Simon & Schuster.
Schleicher, Andreas (Ed.) (2012). Preparing teachers and developing school leaders for the 21st Century: Lessons
from around the world. Paris: OECD Publishing.
Shaw, Bernard (1903). Man and superman. Cambridge, Massachusetts: The University Press.
Steele, Claude M., & Aronson, Joshua (1995). Stereotype threat and the intellectual test performance
of African Americans. Journal of Personality and Social Psychology, 69, 797-811.
U.S. Department of Education, National Center for Education Statistics (Not dated). Common Core
of Data (CCD). “Identification of Locales,” http://nces.ed.gov/ccd/rural_locales.asp.
U.S. Department of Education (2005). Consolidated state performance report: Part I for state formula grant
programs under the Elementary and Secondary Education Act as amended by the No Child Left Behind
Act of 2001, for reporting on school year 2004-05, New York. Washington, DC: U.S. Department
of Education.

25
U.S. Department of Education (2010). Consolidated state performance report: Part I for state formula grant
programs under the Elementary and Secondary Education Act as amended by the No Child Left Behind
Act of 2001, for reporting on school year 2009-10, New York. Washington, DC: U.S. Department
of Education.
Vegas, Emiliana, Murnane, Richard J., & Willett, John B. (2001). From high school to teaching:
Many steps, who makes it? Teachers College Record, 103, 427-449.

26
FIGURE 1. Averaged standardized combined SAT score of certified individuals and entering teachers by
certification cohort, 1986 to 2010
27
FIGURE 2. Percent of entering teachers drawn from the bottom, middle, and top thirds of the statewide score
distribution by certification cohort, 1986 to 2010

28
FIGURE 3. Percent of entering teachers in New York City schools drawn from the bottom, middle, and top thirds of
the statewide score distribution by certification cohort, 1986 to 2010

29
FIGURE 4. Percent of entering teachers in non-New York City schools drawn from the bottom, middle, and top
thirds of the statewide score distribution by certification cohort, 1986 to 2010

30
FIGURE 5. Averaged standardized combined SAT score of entering teachers by school poverty level and certification
cohort, 1986 to 2010

31
FIGURE 6. Unadjusted and regression-adjusted averaged standardized combined SAT score of entering teachers by
certification cohort, 1986 to 2010
32
Appendix: Supplemental Material
Analytic Sample
Our benchmark population consists of all public high school students in New York who
took the SAT between 1979-80 and 2007-08. Although, the number of students taking the exam
increased by almost 7 thousand students (roughly 0.3 percentage points annually) over this period,
we find no significant compositional changes in this population that might complicate the
interpretation of the results. There is little movement in the annual mean combined scores (verbal
plus math) (Figure A1). The annual means bounce around the overall mean score of 1001 in no clear
pattern and never deviate more than 11 points, or 5 percent of the overall standard deviation. One
noticeable feature of the trend is the 14 point decline in the mean score between 2005 and 2007 that
coincided with the introduction of the writing test. Very few of individuals from these cohorts
become certified and placed as teachers during our observation period. The standard deviation of
scores increases slightly, about 5 percent, with almost all that increase occurring in the early years.

33
FIGURE A1. Mean combined SAT scores and standard deviation among all known public school SAT-takers,
1980 to 2008
And although the spread has increased, the additional spread is fairly even around the mean
(Figure A2). The average score in the bottom third of the distribution decreases about 15 points
around a mean of 764. The average score in the top third of the distribution increases about 14
points around a mean of 1245.

34
FIGURE A2. Mean combined SAT scores among the bottom and top scores among known public school SAT-
takers, 1980 to 2008
Our analysis focuses on the labor markets for entry-level teachers in NYS between 1986 and
2010. We focus on individuals granted their first entry-level NYS teaching certificate and all first-
time employed teachers in any of the state’s public schools. Between 1986 and 2010, the annual
number of individuals initially certified to teach increases more than 150 percent from just under
eight to just over 20 thousand, with two noticeable discontinuities in this trend: 1992 when separate
certification programs in NYC and Buffalo school systems are eliminated and replaced by the NYS
system and 2004 when several certification requirements are changed including the addition of a
third certification exam. The number of entering teachers in NYS public schools increases rather
steadily from almost 9.5 thousand teachers in 1986 to more than 15 thousand in 2008, the last year
before the Great Recession. Just two years later hiring levels plummet more than 50 percent to 7.5
35
thousand, 21 percent below their 1986 level. The impact of the recession of the early 1990s on
hiring can be seen in the 24 percent reduction in hires for 1992 relative to 1991.
In order to explore trends in the academic ability of this population, as measured by SAT
scores, we reorganize this population into certification cohorts based on when they are first certified
(or the year before they were placed in the classroom for teachers with no observed initial
certificate). The coverage of SATs among this population increases over the period. We observe
SAT scores for at least 40 percent of the certified individuals and entering teacher subpopulations
beginning with the 1990 cohort and at least 50 percent for 13 cohorts of certified individuals and 16
cohorts of entering teachers.
We pull an analytic sample from this population that consists of those individuals with
observed SAT scores from a public high school within NYS (Table A1). The share of the population
drawn into our sample increases from 29 percent of the 1986 cohort to 48 percent of the 2010
cohort, peaking at 56 percent in 2006 (column three).

36
Table A1 Analytic Sample Size Coverage and Composition by Certification Cohort, 1986 to 2010
Sample Certification Subsample
Placement Subsample Certified and Placed
Subsample
Cohort N % of
Pop. N
% of Sub-Pop.
% of Sample
N % of Sub-Pop.
% of Sample
N % of Sub-Pop.
% of Sample
1986 2,837 29.4 2,742 33.6 96.7 2,017 29.1 71.1 1,922 35.2 67.7
1987 3,617 33.7 3,463 36.7 95.7 2,642 34.3 73.0 2,488 38.9 68.8
1988 4,056 36.1 3,940 38.5 97.1 2,850 36.3 70.3 2,734 39.9 67.4
1989 4,791 38.2 4,607 40.6 96.2 3,416 39.1 71.3 3,232 42.7 67.5
1990 5,584 40.9 5,455 42.8 97.7 3,852 41.6 69.0 3,723 44.5 66.7
1991 5,539 46.3 5,441 48.1 98.2 3,573 49.4 64.5 3,475 52.8 62.7
1992 6,902 42.5 6,871 43.1 99.6 4,618 42.9 66.9 4,587 43.8 66.5
1993 8,595 46.3 8,560 46.8 99.6 5,838 47.6 67.9 5,803 48.4 67.5
1994 8,967 48.3 8,932 49.0 99.6 6,050 50.2 67.5 6,015 51.4 67.1
1995 7,952 51.3 7,931 52.3 99.7 5,620 53.0 70.7 5,599 54.5 70.4
1996 8,233 53.1 8,213 53.6 99.8 5,844 55.0 71.0 5,824 55.8 70.7
1997 9,556 51.5 9,507 52.1 99.5 7,101 53.2 74.3 7,052 54.0 73.8
1998 9,751 51.5 9,700 52.2 99.5 7,420 53.0 76.1 7,369 54.0 75.6
1999 10,993 53.0 10,928 53.8 99.4 8,494 55.1 77.3 8,429 56.2 76.7
2000 11,382 52.8 11,322 53.2 99.5 8,865 54.9 77.9 8,805 55.5 77.4
2001 12,207 53.0 12,078 53.6 98.9 9,540 55.3 78.2 9,411 56.2 77.1
2002 12,014 54.6 11,832 55.4 98.5 9,608 56.7 80.0 9,426 57.9 78.5
2003 12,740 53.3 12,586 54.2 98.8 9,779 55.1 76.8 9,625 56.5 75.5
2004 16,251 52.9 16,140 53.3 99.3 11,245 55.2 69.2 11,134 55.9 68.5
2005 7,779 55.4 7,670 56.3 98.6 5,752 56.3 73.9 5,643 57.7 72.5
2006 9,129 55.5 8,985 56.6 98.4 6,583 56.5 72.1 6,439 58.1 70.5
2007 12,329 55.0 12,205 55.9 99.0 7,993 55.6 64.8 7,869 57.1 63.8
2008 11,213 48.7 11,078 49.3 98.8 6,603 52.9 58.9 6,468 54.3 57.7
2009 10,581 47.1 10,461 47.4 98.9 4,508 50.2 42.6 4,388 51.0 41.5
2010 9,725 47.6 9,685 47.8 99.6 1,936 46.7 19.9 1,896 47.5 19.5
Note. Years span from July 1st to June 30th and are referenced by the spring of the year.
SAT scores are missing for three categories of individuals: i) those enrolled in NYS private
schools and taking the SAT in 2002 or later, ii) those taking the test outside of NYS, most likely in a
neighboring state – Vermont, Massachusetts, Connecticut, New Jersey, or Pennsylvania, and iii)
persons not taking the SAT. With such missing scores it is important to consider the question of
external validity: do the trends in the academic abilities of those for whom we have SAT scores
37
reflect the unobserved overall trends for all entering teachers, all individuals certified, and their high-
school peers? We consider the three categories in turn.
Scores of SAT-takers enrolled in NYS private schools are missing post 2001 – individuals
most of whom did not graduate from college until 2005 or later. This would be problematic if the
gap in academic abilities between entering teachers and their high-school peers were smaller or
reversed for those attending NYS private schools than for those attending public schools. Under
this scenario, including SAT scores for such individuals taking the SAT prior to 2002 but not after,
due to scores being missing, would result in the trends in SAT scores of all of those for whom we
have scores overstating the relative improvement in the academic abilities of all entering teachers
and all those certified, after approximately 2005. We avoid any problem associated with the SAT
coverage of those attending NYS private schools by excluding them from our analysis.
Over the years for which we have SAT scores for all NYS students, roughly 16 percent of
certified individuals and entering teachers attended private schools when taking the SAT. We assess
the impact of this exclusion by rerunning our main analysis using the sample of all NYS students
taking the SAT between 1980 and 2001. (We continue to not be concerned about compositional
change in test-takers over this period with distributional changes over time closely mirroring those in
our analytic sample. The annual means bounce around the overall mean score of 1000 in no clear
pattern and never deviates more than 9 points.) The results suggest we are underestimating the
change in academic abilities of certified individuals and entering teachers. Average relative academic
ability among both certified individuals and entering teachers decreased 3 and 3.5 percent of a
standard deviation more, respectively, by 1999 compared to our main results (comparing Figure A3
to Figure 1). Ability then increases half a percent of a standard deviation more by 2006 when public
and private test-takers are included, compared to public test-takers alone. We find similar differences

38
in trends between the two samples when examining the share of entering teachers from each tertile
of the SAT score distribution. Prior to 1999, there is a larger increase in the share drawn from the
bottom third of the distribution (1.6 percentage points) and a larger decrease in the share drawn
from the top third of the distribution (2.2 percentage points) (comparing Figure A4 to Figure 2).
After 1999, there is a larger decrease in the share recruited from the bottom of the distribution (1
percentage point) but also a smaller increase in the proportion from the top of the distribution (1
percentage point).
FIGURE A3. Averaged standardized combined SAT score of certified individuals and entering teachers from public
and private NYS schools by certification cohort, 1986 to 2006

39
FIGURE A4. Percent of entering teachers drawn from the bottom, middle, and top thirds of the statewide public and
private school score distribution by certification cohort, 1986 to 2006
Next we consider SAT scores missing for those who took the SAT outside NYS or took
another entrance exam in lieu of the SAT. This would be problematic if the trends in the relative
academic performance of certified individuals, entering teachers and their high-school peers taking
the SAT outside NYS or taking another entrance exam meaningfully differed from trends for the
respective groups taking the SAT in NYS. We see no reason why this is likely to be the case, but
cannot rule out the possibility. We also are unable to directly assess trends in the relative academic
abilities of those certified and those entering teaching who did not take any college entrance exam.
The bulk of college graduates not taking an entrance exam likely enrolled in the City University of
New York system as it did not require entrance exam scores prior to the late 1990s. While it is
possible that this change in policy could contribute somewhat to the trends we observed for NYC,

40
we can rule out any substantive effect outside NYC as most individuals take teaching jobs quite
close to where they attended high school and college (Boyd, Lankford, Loeb, & Wyckoff, 2005).
Even though we cannot carry out a direct empirical assessment of the effects of not
observing SAT scores for those who took the SAT outside NYS or did not take the SAT, as we did
for NYS students attending private schools, a rather revealing indirect analysis is possible. In
particular, we explore the trends using an alternative measure of academic ability – the selectivity of
the colleges attended by those certified to teach and those entering teaching. This is useful because
our college-selectivity measure has substantially fewer missing values (less than 12 percent of
observations between 1986 and 2005) and a pattern of missing data that is quite different from that
for SAT scores. (We trace trends through 2005 because the NYS changed their data collection
procedures such that we do not observe the undergraduate institution attended by over 50 percent
of the population of certified individuals and entering teachers for the 2006 cohort and later.) In
particular, we have data on college selectivity for 85 percent of observations having missing SAT
scores. Not only is college selectivity a direct measure of academic ability, it is also a useful proxy for
missing SAT scores. For example, among individuals in our data with both SAT scores and college-
selectivity observed the mean SAT scores for those who attended most competitive and competitive
institutions were 0.71 and 0.22 percent of a standard deviation above the average score, respectively,
while mean SAT scores for those who attended the less competitive and not competitive institutions
were 8 and 36 percent of a standard deviation below the average score. Regressing SAT scores on
dummies reflecting the four selectivity categories, we find that these measures alone explain 15
percent of the total variation in SAT scores. Thus, comparing trends in college selectivity can be
quite informative in assessing whether the trends in the academic abilities of those observations
having SAT scores differ from those missing SAT scores for any reason.

41
As shown in Figure A5, the trends for the two groups of entering teachers are remarkably
similar through 2002, after which the increase in the selectivity of the colleges entering teachers
attended was meaningfully greater for those having missing SAT scores. The trends for those
certified are similar (results available upon request). We view this as compelling evidence that our
analysis of trends in SAT scores, somewhat underestimates the relative gains in the academic ability
of all individuals certified and all those entering teaching.

42
FIGURE A5. Percent of entering teachers by competitiveness of undergraduate institution attended among those with and without observed SAT scores by
certification cohort, 1986 to 2005
0.2
.4.6
Prop
ortio
n of
Tea
cher
s
1985 1990 1995 2000 2005Cohort Year Anchored to certification cohort
Missing SAT Observed SAT
Most Competitive
0.2
.4.6
Prop
ortio
n of
Tea
cher
s
1985 1990 1995 2000 2005Cohort Year Anchored to certification cohort
Missing SAT Observed SAT
Competitive
0.2
.4.6
Prop
ortio
n of
Tea
cher
s
1985 1990 1995 2000 2005Cohort Year Anchored to certification cohort
Missing SAT Observed SAT
Less Competitive
0.2
.4.6
Prop
ortio
n of
Tea
cher
s1985 1990 1995 2000 2005
Cohort Year Anchored to certification cohort
Missing SAT Observed SAT
Not Competitive

43
Additional Results
How has the academic ability of entering teachers changed?
SAT scores are correlated with the competitiveness of undergraduate institutions individuals
attend. At the same time average standardized SAT scores of entering teachers are increasing,
entering teachers are also being drawn from more selective colleges and universities (Figure A6).
FIGURE A6. Percent of entering teachers by competitiveness of undergraduate attended by certification cohort, 1999
to 2005
These overall trends mask increases in SAT scores within each level of competitiveness. The
share of entering teachers drawn from the top third of the SAT score distribution increase in each
level of competitiveness and the share drawn from the bottom third decrease in each (Table A2).

44
Table A2 Percent of Entering Teachers Drawn from the Bottom, Middle, and Top Thirds of the
Statewide Score Distribution by Competitiveness of Undergraduate Institution Attended and Certification Cohort, 1999 to 2005
Certification Cohort1999 2000 2001 2002 2003 2004 2005
Most Competitive
Bottom third 7.9 7.6 8.1 5.9 4.5 4.0 3.5
Middle third 27.0 26.4 25.7 27.2 27.3 25.7 25.6
Top third 65.1 65.9 66.2 66.9 68.2 70.3 70.8
Competitive
Bottom third 20.7 19.4 21.6 21.1 17.2 15.0 13.3
Middle third 44.6 44.5 43.8 45.0 45.9 45.7 45.8
Top third 34.7 36.1 34.6 33.8 36.9 39.4 40.9
Less Competitive
Bottom third 33.2 34.1 34.9 32.6 30.9 31.8 25.1
Middle third 46.0 45.9 44.8 47.2 49.9 46.8 52.4
Top third 20.8 20.0 20.3 20.3 19.2 21.4 22.5
Not Competitive
Bottom third 51.6 54.9 48.9 48.2 42.8 41.1 34.9
Middle third 36.7 32.4 34.8 36.4 42.9 40.1 45.4
Top third 11.7 12.7 16.3 15.4 14.3 18.8 19.8
Are the improvements widespread throughout or narrowly concentrated within the state?
Statewide the average academic ability of certified individuals and entering teachers increases
meaningfully after 1999 following a long period of decline. The trends presented in the next two
figures show the improvement in academic ability that occurs both in NYC (Figure A7) and the rest
of the state (Figure A8). As we have done elsewhere, we group entering teachers by the school in
which they are first employed. Certified individuals are grouped by the high school they attended
when they took the SAT. In Figure A9, we further subdivide entering teachers at schools outside
NYC into four regions – city, suburb, town, and rural – and show the turnaround occurs across
regions.

45
FIGURE A7. Averaged standardized combined SAT score of certified individuals from and entering teachers in
New York City by certification cohort, 1986 to 2010

46
FIGURE A8. Averaged standardized combined SAT score of certified individuals from and entering teachers in
schools outside New York City by certification cohort, 1986 to 2010

47
FIGURE A9. Averaged standardized combined SAT score of entering teachers by school region and certification
cohort, 1986 to 2010
In Table A3 we provide the average SAT scores for various subgroups of teachers. To
explore whether the turnaround in the academic ability of entering teachers is concentrated among
specific race/ethnicities and subjects taught. We also provide the averages for teachers completing
traditional preparation programs. We find the same general pattern – decline then increase – among
teachers entering belonging to all these subgroups.

48
Table A3 Average Standardized SAT Scores for Various Subgroups of Entering Teachers by
Certification Cohort, 1986 to 2010
Cohort Subject Area Taught Race/Ethnicity College
RecommendedElementary Hard-to-
Staffa All
Others White and
Asian Other
Minority
1986 0.012 0.209 0.162 0.184 -0.321 0.139
1987 -0.040 0.213 0.151 0.174 -0.307 0.105
1988 -0.040 0.212 0.101 0.170 -0.493 0.082
1989 -0.048 0.175 0.132 0.162 -0.481 0.087
1990 -0.056 0.147 0.141 0.147 -0.461 0.080
1991 0.017 0.205 0.200 0.181 -0.322 0.097
1992 -0.100 0.141 0.083 0.168 -0.627 0.101
1993 -0.055 0.137 0.162 0.162 -0.494 0.096
1994 -0.075 0.136 0.126 0.153 -0.429 0.085
1995 -0.108 0.109 0.104 0.125 -0.506 0.058
1996 -0.095 0.125 0.188 0.158 -0.517 0.075
1997 -0.119 0.088 0.057 0.127 -0.472 0.022
1998 -0.099 0.082 0.062 0.154 -0.555 0.072
1999 -0.147 0.107 0.081 0.154 -0.535 0.052
2000 -0.119 0.089 0.095 0.150 -0.484 0.066
2001 -0.114 0.065 0.140 0.144 -0.469 0.053
2002 -0.056 0.109 0.115 0.167 -0.437 0.068
2003 -0.051 0.142 0.176 0.182 -0.267 0.058
2004 -0.062 0.187 0.229 0.183 -0.179 0.048
2005 0.058 0.270 0.328 0.263 -0.042 0.168
2006 0.010 0.283 0.341 0.273 -0.109 0.152
2007 -0.017 0.275 0.236 0.244 -0.219 0.135
2008 -0.036 0.257 0.289 0.279 -0.258 0.132
2009 -0.024 0.261 0.260 0.312 -0.250 0.129
2010 0.022 0.360 0.306 0.412 -0.133 0.226 a Hard-to-staff subjects are mathematics, science, special education, and English as Second Language/bilingual education
In Figure 5 in the text, we show how the difference in the average academic ability of
teachers between those placed in the richest and poorest schools narrows after 1999 following a
period over which it widens. We show the trends in Figure A10 separately for entering elementary
teachers statewide, entering middle and high school teachers statewide, entering teachers in NYC
schools, and entering teachers in schools outside NYC.

49
A. Elementary Schools B. Middle and High Schools
C. NYC Schools D. Non-NYC Schools
FIGURE A10. Averaged standardized combined SAT score of entering elementary and middle and high school teachers and teachers in NYC and non-NYC schools by school poverty level and certification cohort, 1986 to 2010

50
Exploring the role of labor market characteristics
To investigate whether the turnaround in average teacher academic ability shown in Figure 1
in the text is driven by changes in the local labor market (defined as the school district in which the
entering teachers’ are first employed), we estimate the following regression to obtain regression
adjusted trends in entering teachers’ standardized SAT scores: SAT = τ + β ln (Total_Enrollment) ( ) + β (% American Indian) ( ) + β (% Black) ( )+ β (% Asian) ( ) + β (% Hispanic) ( ) + β (Mean_Salary) ( )+ β (# Inexperienced Hires) ( ) + β (# Experienced Hires) ( ) + γ + α + ε
where SAT is the combined SAT scored, standardized within year, for individual i in certification
cohort c working in district d. The main coefficients of interest are, τ , a vector of cohort fixed-
effects which capture the regression adjusted mean standardized combined SAT scores for entering
teachers certified in year c. The regression controls for the entering teachers’ districts’ natural log of
enrollment; the districts’ percent of American Indian, Black, Asian, and Hispanic students with
White students as the holdout group; the districts’ mean salary for teachers with a Bachelor’s degree
and at most three years of experience; and the number of inexperienced and experienced teachers
hired. We also include a set of district fixed-effects to account for any time-invariant differences
among districts that could affect the local teacher labor market (e.g., geographic preferences). The
local labor market conditions included as predictors are pulled from the year prior to entry.
Lastly, we include a set of time-to-certification fixed-effects, γ , which capture the amount
of time between when an individual completed the SAT and obtained a certification to teach in New
York. Typically the amount of time between taking the SAT and obtaining a certification is five
years. If individuals with higher SAT scores obtain certification shortly after graduating from college,
then the positive trends the 2000s may be biased downwards from our left-censored data. For

51
example, we only observe the teachers in the 1986 certification cohort who completed the SAT in
1980 or 1981; however, we observe teachers in the 2010 certification cohort who completed the
SAT between 1980 and 2005. The time-to-certification fixed-effects therefore compare teachers with
the same time gap between the SAT and obtaining a teacher certification (e.g., 6 years) regardless of
their certification cohort (e.g., 1989 versus 2010). In an alternative specification, we estimate the
above model only for those who took between five and seven years after the SAT to obtain a
teaching certification. The results are very similar and available upon request.
To conduct the same test of the trends shown in Figures 2 through 4, we convert this model
to a multinomial logistic regression model to generate regression adjusted predicted probabilities for
each individual. Specifically, we use as our new dependent variable a categorical variable that takes a
“1” if the entering teacher is in the bottom tertile of the within-year SAT distribution, a “2” if the
entering teacher is in the middle tertile of the within-year SAT distribution, and a “3” if the entering
teacher is in the top tertile of the within-year SAT distribution. The estimates of interest in this
model are the yearly average predicted probabilities that a given teacher is drawn from one of three
SAT tertiles with the independent variables held at their means.
As shown in Figures A11 through A14, the findings reported in the paper continue to hold
when differences in labor market fundamentals across cohorts are taken into account.

52
FIGURE A11. Predicted probability of entering teachers being drawn from the bottom, middle, and top thirds of the
statewide score distribution by certification cohort, 1986 to 2010

53
FIGURE A12. Predicted probability of entering teachers in New York City being drawn from the bottom, middle,
and top thirds of the statewide score distribution by certification cohort, 1986 to 2010
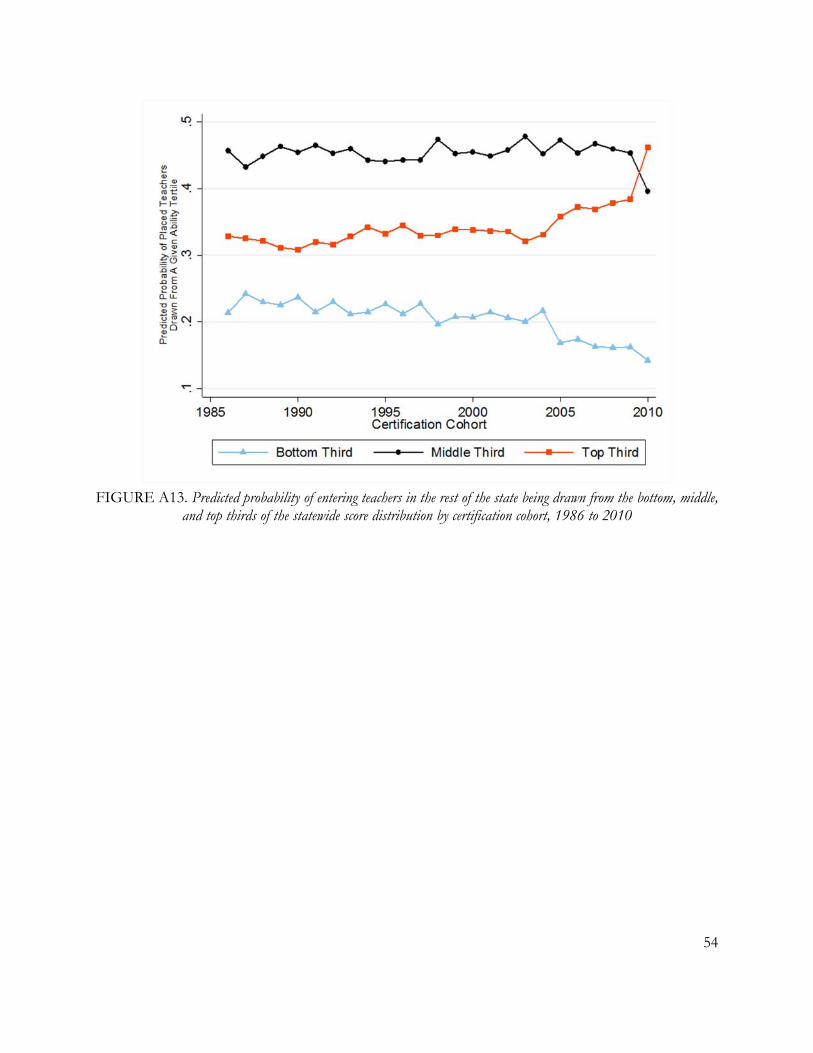
54
FIGURE A13. Predicted probability of entering teachers in the rest of the state being drawn from the bottom, middle,
and top thirds of the statewide score distribution by certification cohort, 1986 to 2010
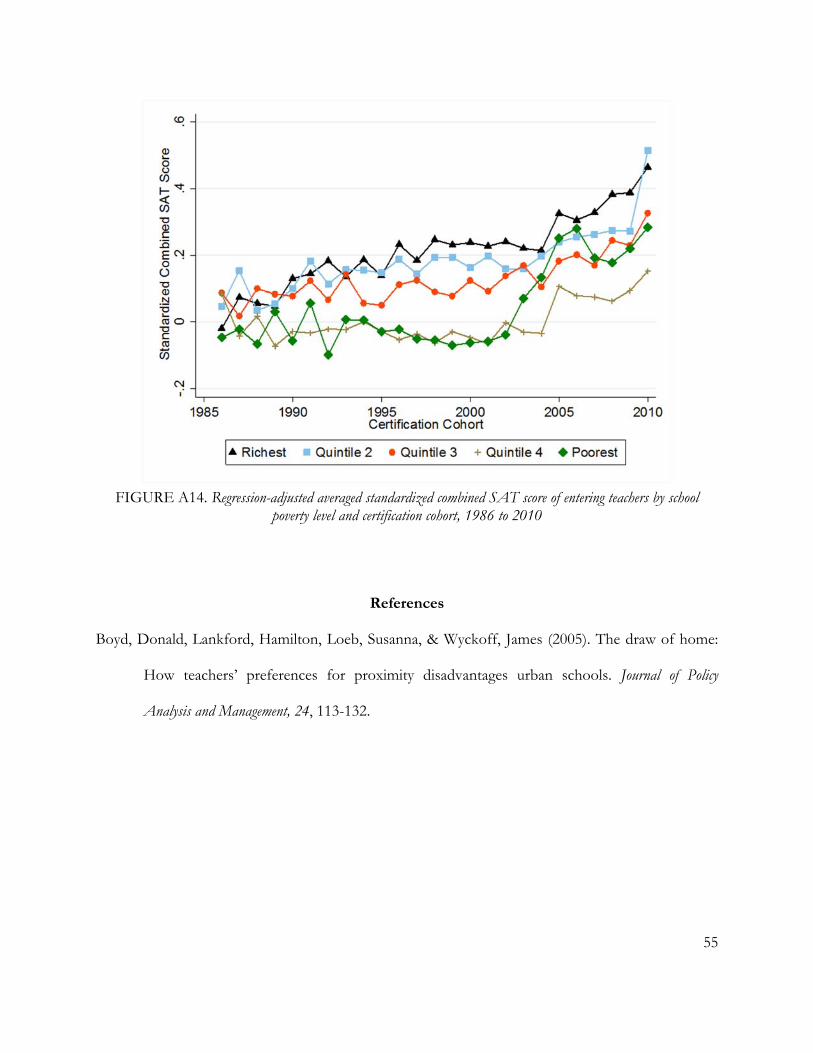
55
FIGURE A14. Regression-adjusted averaged standardized combined SAT score of entering teachers by school
poverty level and certification cohort, 1986 to 2010
References
Boyd, Donald, Lankford, Hamilton, Loeb, Susanna, & Wyckoff, James (2005). The draw of home:
How teachers’ preferences for proximity disadvantages urban schools. Journal of Policy
Analysis and Management, 24, 113-132.