Embed Size (px)
Citation preview

Who Buys What and HowAn overview of 2012-13 Western Australian Government PurchasingAppendices

2 Who Buys What and How
Appendix 1: List of agenciesAnimal Resources CentreArmadale Redevelopment AuthorityBotanic Gardens and Parks AuthorityBuilders’ Registration Board of Western AustraliaBurswood Park BoardC.Y. O’Connor InstituteCentral Institute of TechnologyChallenger Institute of TechnologyChemCentreCommissioner for Children and Young PeopleCorruption and Crime CommissionCurriculum CouncilDepartment for Child ProtectionDepartment for CommunitiesDepartment of Agriculture and FoodDepartment of CommerceDepartment of Corrective ServicesDepartment of Culture and the ArtsDepartment of EducationDepartment of Environment and ConservationDepartment of Finance Department of Fire and Emergency ServicesDepartment of FisheriesDepartment of HealthDepartment of HousingDepartment of Indigenous AffairsDepartment of Local GovernmentDepartment of Mines and PetroleumDepartment of Planning
Department of Racing, Gaming and LiquorDepartment of Regional Development and LandsDepartment of Sport and RecreationDepartment of State DevelopmentDepartment of the Attorney GeneralDepartment of the Premier and CabinetDepartment of the Registrar - WA Industrial Relations CommissionDepartment of Training and Workplace DevelopmentDepartment of TransportDepartment of TreasuryDepartment of WaterDisability Services CommissionDrug and Alcohol OfficeDurack Institute of TechnologyEast Perth Redevelopment AuthorityEconomic Regulation AuthorityEqual Opportunity CommissionForest Products CommissionGascoyne Development CommissionGovernment Employees Superannuation BoardGold CorporationGoldfields Esperance Development CommissionGreat Southern Development CommissionGreat Southern Institute of TechnologyHealthwayHeritage Council of Western AustraliaInsurance Commission of Western AustraliaKimberley College of TAFEKimberley Development Commission

3 Who Buys What and How
LandgateLaw Reform Commission of Western AustraliaLotteries Commission of Western Australia (Lotterywest)Main Roads Western AustraliaMetropolitan Cemeteries BoardMid West Development CommissionMidland Redevelopment AuthorityOffice of EnergyOffice of the Auditor GeneralOffice of the Director of Public ProsecutionsOffice of the Information CommissionerOffice of the Inspector of Custodial ServicesOffice of the Public Sector Standards CommissionerParliamentary Commissioner for Administrative InvestigationsPeel Development CommissionPerth Market Authority (Market City)Pilbara Development CommissionPilbara TAFEPolytechnic WestPublic Sector CommissionPublic Transport AuthorityPublic TrusteeRottnest Island AuthorityRural Business Development CorporationSettlement Agents Supervisory BoardSmall Business Development CorporationSouth West Development CommissionSouth West Institute of TechnologySubiaco Redevelopment AuthoritySwan River TrustTourism Western AustraliaWest Coast Institute of Training
Western Australia PoliceWestern Australian Electoral CommissionWestern Australian Planning CommissionWestern Australian Sports Centre TrustWestern Australian Treasury CorporationWheatbelt Development CommissionWorkcover Western AustraliaZoological Parks Authority

4 Who Buys What and How
Appendix 2: List of Common Use Arrangements
Common Use Arrangement CUA #Advertising Services 15907Agricultural Chemicals, Fertilisers and Fencing Products 47909Audio Visual Solutions AVS2012Audit Services and Financial Advice 23706Business Machines and Business Machine Consumables 25307Cleaning, Kitchen and Bathroom Products 42309Courier Services 28109Data Centre Facilities and Associated Management Services 169209Debt Recovery Services DRS2013ADocument Transfer Services 58810Financial, Human Resources and Payroll Solutions FHPS2012Freight Transport Services 40110Fuel - Bowser, Bulk and Drum FUE2013Furniture FRN2012Gases - Domestic LPG, Medical, Industrial and Specialty 49009 Groceries (Bulk) and Fresh Produce 44409Hardware and Related Products 11310Human Resources - Investigation Services 14610Human Resources - Services 10410Human Resources - Temporary Personnel Services 22008ICT Equipment Disposal 47110ICT Services 14008Information Security Management Services CS14998
Integrated Human Resource Management Information System and Services 127800
Common Use Arrangement CUA #Interpreting and Translating Services ITS2012IT Servers and Data Storage Devices 13010Microsoft Licenses 150910Motor Vehicle Fleet Services 19510Motor Vehicle Rental Services 10708
Motor Vehicles - Acquisition of Passenger and Light Commercial Vehicles 37804
Notebook and Personal Computers 25708
Payment Services - Over the Counter and Associated Ancillary Services 65910
Postal Article Services 15605Purchasing Card Services and Expense Management System 35308Removalist Services REM2013Remuneration Packaging Services 20505Stationery (Office and School), Copy Paper and Envelopes 28209Stationery (Printed), Printed Record Files and Short Run Document Copying Services 00303
Storage, Retrieval and Destruction Services for Paper and Electronic Records
34504 and 123499
Telecommunication Services 56808Training Courses TRA2012Travel Reservations and Associated Services 44107Uniforms - Total Apparel Management Services 34304Cat1Uniforms 69610
Waste Disposal (General) and Recycling Services 36309

5 Who Buys What and How
Goods/Services Description Code Expenditure $ %Water and Wastewater Treatment Supply and Disposal 4710 $1,533 <1%Industrial Laundry and Dry Cleaning Equipment 4711 $259,348 <1%Janitorial Equipment 4712 $4,018 <1%Cleaning and Janitorial Supplies 4713 $20,599,530 21%
Decontamination Services 7610 $74,319 <1%
Cleaning and Janitorial Services 7611 $77,086,378 79%
$98,025,126GROUP TOTAL
Group C: Cleaning
Appendix 3: Detailed expenditure at family level in UNSPSCSpend information is displayed at the family level of UNSPSC. To identify major areas of expenditure, ‘family’ codes have been grouped together.
The following table also show expenditure between goods and services within these groups. The percentage shown at the UNSPSC family level is based on the total spend occurring within each group. Sections in Green denote goods, sections in Yellow are services.
UNSPSC family description UNSPSC family code
Total expenditure associated with
family item
Total expenditure for the group
Per cent of family expenditure based on total expenditure for
the group

6 Who Buys What and How
The Departments of Education and Housing spent $8.1 million (55 per cent) of the total spend for the Horticulture group.
The Department of Education accounted for $2.5 million (70 per cent) of the spend in the Animal Feed group.
The Department of Environment and Conservation accounted for $1.3 million (95 per cent) of the spend in the Pest Control Products group.
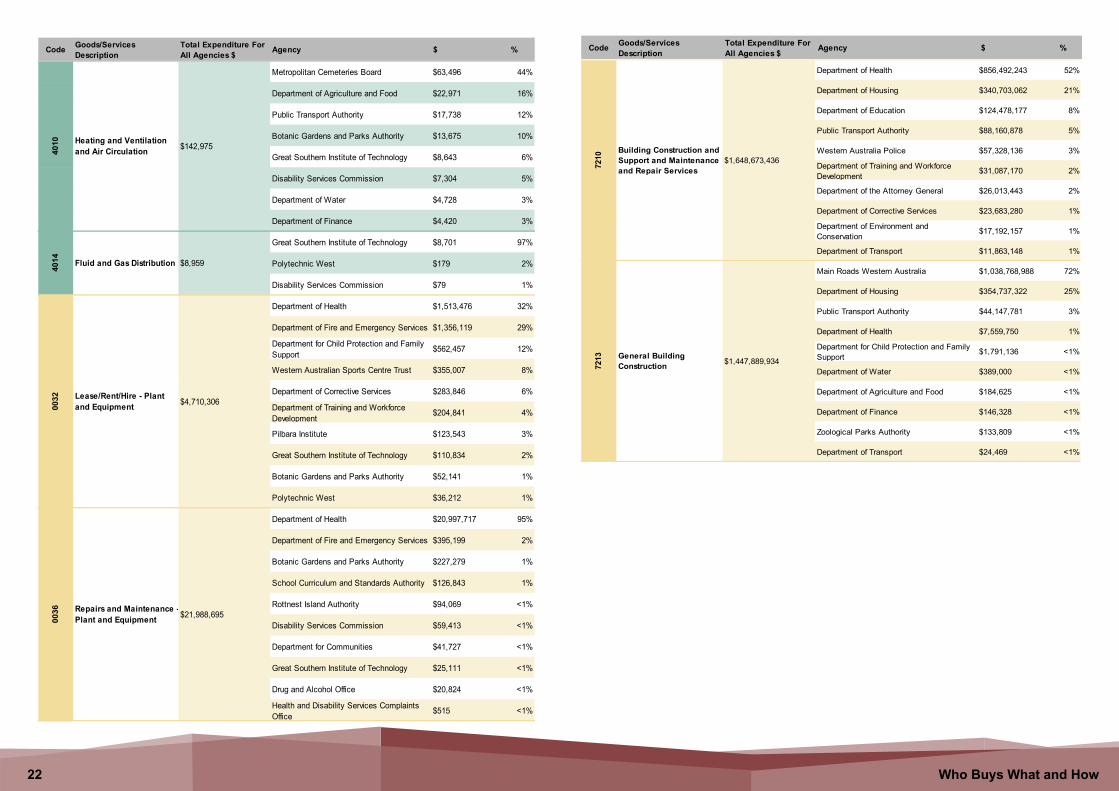
The Department of Health accounted for $856.5 million (52 per cent) of the spend in the Building Construction and Support and Maintenance and Repair Services group.
The Western Australian Sports Centre Trust and the Department of Education spent $1.22 billion (78 per cent) of the total spend for the Permanent Structures group.
The Department of Housing accounted for $148.2 million (77 per cent) of the spend in the Land group.
Goods/Services Description Code Expenditure $ %
Live Animals 1010 $797,358 3%
Domestic Pet Products 1011 $82 <1%
Animal Feed 1012 $3,597,342 14%
Animal Containment and Habitats 1013 $332,137 1%
Seeds and Bulbs and Seedlings and Cuttings 1015 $1,182,552 5%
Floriculture and Silviculture Products 1016 $141,612 <1%
Fertilizers and Plant Nutrients and Herbicides 1017 $2,812,474 11%
Pest Control Products 1019 $1,386,336 5%
Non Edible Animal Products 1113 $3,350 <1%
Agricultural and Forestry and Landscape Machinery and Equipment
2110 $175,345 <1%
Veterinary Equipment and Supplies 4212 $63,108 <1%
Veterinary Nutritional Supplement 5125 $23,991 <1%
Horticulture 7011 $14,834,068 58%
Livestock Services 7012 $123,431 <1%
Crop Production and Management and Protection 7014 $28,228 <1%
Wildlife and Flora 7016 $224,153 <1%
GROUP TOTAL $25,725,566
Group A: Agriculture, Horticulture, Plants and AnimalsGoods/Services Description Code Expenditure $ %
Land 0004 $192,137,336 4%
Plant and Machinery 0019 $14,625,429 <1%
Earth and Stone 1111 $1,627,617 <1%
Heavy Construction Machinery and Equipment 2210 $3,318,267 <1%
Structural Materials and Basic Shapes 3010 $996,916 <1%
Concrete and Cement and Plaster 3011 $93,347 <1%
Roads and Landscape 3012 $13,844,913 <1%
Structural Building Products 3013 $7,129,612 <1%
Insulation 3014 $700 <1%
Exterior Finishing Materials 3015 $2,350,451 <1%
Interior Finishing Materials 3016 $85,930 <1%
Doors and Windows and Glass 3017 $48,283 <1%
Plumbing Fixtures 3018 $27,528 <1%
Construction and Maintenance Support Equipment 3019 $54,414 <1%
Prefabricated Structures 3020 $49,272,092 <1%
Permanent Structures 3022 $1,561,416,994 31%
Heating and Ventilation and Air Circulation 4010 $142,975 <1%
Fluid and Gas Distribution 4014 $8,959 <1%
Lease/Rent/Hire - Plant and Equipment 0032 $4,710,306 <1%
Repairs and Maintenance - Plant and Equipment 0036 $21,988,695 <1%
Building Construction and Support and Maintenance and Repair Services
7210 $1,648,673,436 33%
General Building Construction 7213 $1,447,889,934 29%
GROUP TOTAL $4,970,444,134
Group B: Building and Construction
7 Who Buys What and How
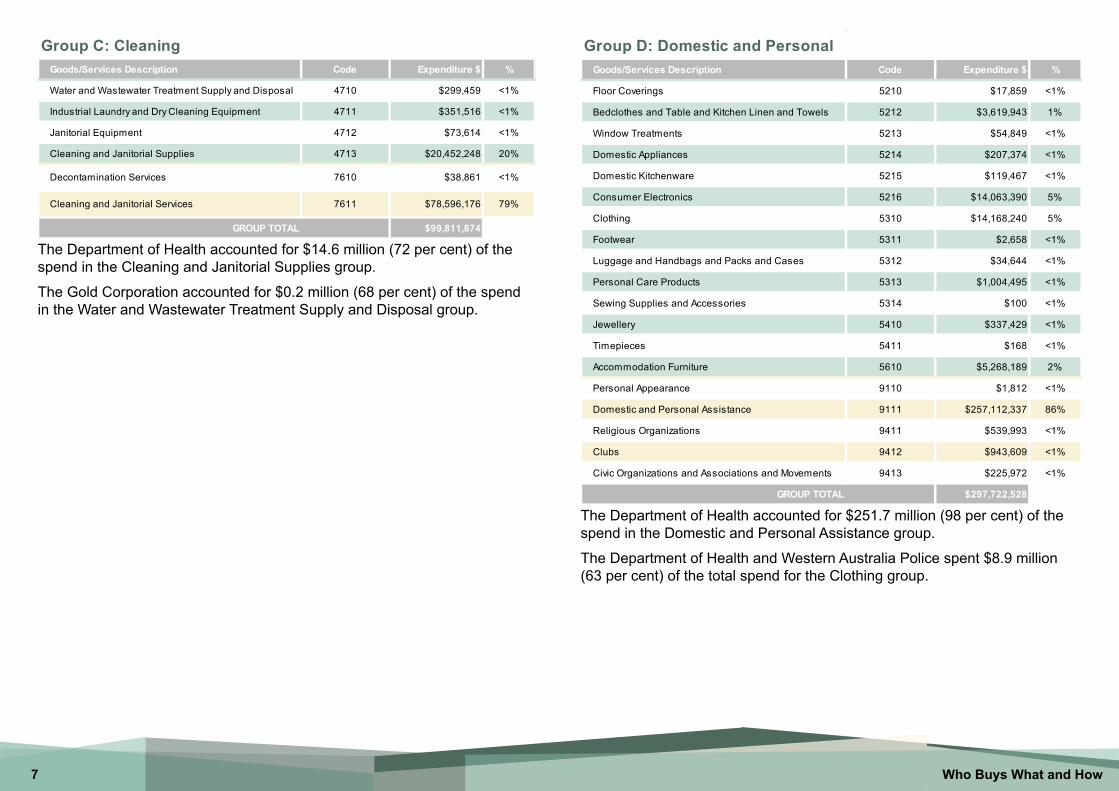
The Department of Health accounted for $14.6 million (72 per cent) of the spend in the Cleaning and Janitorial Supplies group.
The Gold Corporation accounted for $0.2 million (68 per cent) of the spend in the Water and Wastewater Treatment Supply and Disposal group.
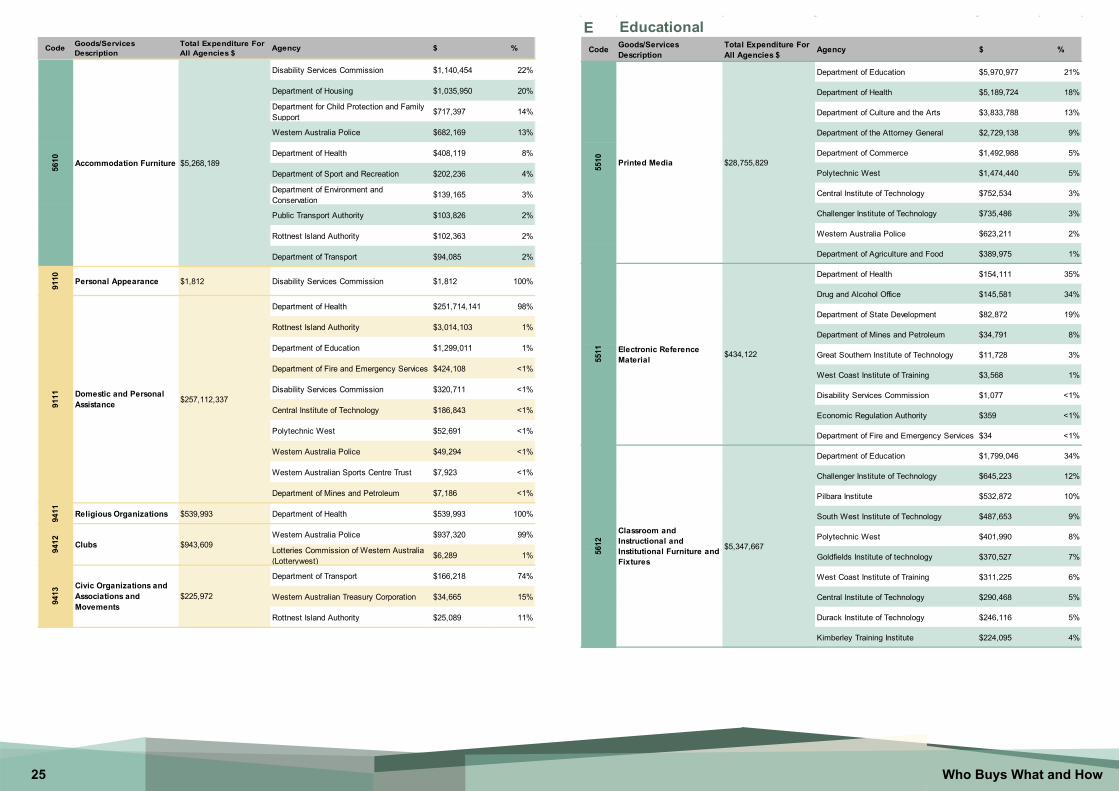
The Department of Health accounted for $251.7 million (98 per cent) of the spend in the Domestic and Personal Assistance group.
The Department of Health and Western Australia Police spent $8.9 million (63 per cent) of the total spend for the Clothing group.
Goods/Services Description Code Expenditure $ %
Water and Wastewater Treatment Supply and Disposal 4710 $299,459 <1%
Industrial Laundry and Dry Cleaning Equipment 4711 $351,516 <1%
Janitorial Equipment 4712 $73,614 <1%
Cleaning and Janitorial Supplies 4713 $20,452,248 20%
Decontamination Services 7610 $38,861 <1%
Cleaning and Janitorial Services 7611 $78,596,176 79%
GROUP TOTAL $99,811,874
Group C: Cleaning Goods/Services Description Code Expenditure $ %
Floor Coverings 5210 $17,859 <1%
Bedclothes and Table and Kitchen Linen and Towels 5212 $3,619,943 1%
Window Treatments 5213 $54,849 <1%
Domestic Appliances 5214 $207,374 <1%
Domestic Kitchenware 5215 $119,467 <1%
Consumer Electronics 5216 $14,063,390 5%
Clothing 5310 $14,168,240 5%
Footwear 5311 $2,658 <1%
Luggage and Handbags and Packs and Cases 5312 $34,644 <1%
Personal Care Products 5313 $1,004,495 <1%
Sewing Supplies and Accessories 5314 $100 <1%
Jewellery 5410 $337,429 <1%
Timepieces 5411 $168 <1%
Accommodation Furniture 5610 $5,268,189 2%
Personal Appearance 9110 $1,812 <1%
Domestic and Personal Assistance 9111 $257,112,337 86%
Religious Organizations 9411 $539,993 <1%
Clubs 9412 $943,609 <1%
Civic Organizations and Associations and Movements 9413 $225,972 <1%
GROUP TOTAL $297,722,528
Group D: Domestic and Personal

8 Who Buys What and How
The Department of Education accounted for $160.9 million (98 per cent) of the spend in the Developmental and Professional Teaching Aids and Materials and Accessories and Supplies group.
It also accounted for $15.2 million (82 per cent) of the spend in the Educational Institutions group.
Goods/Services Description Code Expenditure $ N/A
Printed Media 5510 $28,755,829 11%
Electronic Reference Material 5511 $434,122 <1%
Classroom and Instructional and Institutional Furniture and Fixtures
5612 $5,347,667 2%
Developmental and Professional Teaching Aids and Materials and Accessories and Supplies
6010 $164,628,719 65%
Vocational Training 8610 $34,134,859 13%
Alternative Educational Systems 8611 $49,733 <1%
Educational Institutions 8612 $18,429,740 7%
Specialized Educational Services 8613 $135 <1%
Educational Facilities 8614 $1,786,377 <1%
GROUP TOTAL $253,567,181
Group E: EducationalGoods/Services Description Code Expenditure $ %
Printed Circuits and Integrated Circuits and Microassemblies
3210 $1,046 <1%
Electronic Hardware and Component Parts and Accessories
3213 $97,603 <1%
Lamps and Lightbulbs and Lamp Components 3910 $517 <1%
Lighting and Fixtures and Accessories 3911 $343,546 <1%
Electrical Equipment and Components and Supplies 3912 $2,450,678 <1%
Communications Devices and Accessories 4319 $7,284,464 <1%
Components for Information Technology or Broadcasting or Telecommunications
4320 $1,616,366 <1%
Computer Equipment and Accessories 4321 $79,529,038 10%
Data Voice or Multimedia Network Equipment or Platforms and Accessories
4322 $4,570,150 <1%
Software 4323 $65,966,727 8%
Lease/Rent/Hire - Computer Hardware & Software 0029 $3,963,435 <1%
Lease/Rent/Hire - Communications 0033 $5,243 <1%
Software Licences 0038 $14,830,176 2%
Computer Services 8111 $479,574,949 61%
Telecommunications Media Services 8311 $126,588,278 16%
GROUP TOTAL $786,822,213
Group F: IT, Telecommunications, Electronic and Electrical
In the Computer Services category, the Department of Housing ($115 million, 24 per cent) and the Public Transport Authority ($99 million, 20 per cent) recorded the greatest spend.
They were followed by the Department of Education with $46 million or 9.6 per cent and the Western Australian Police which spent $41 million or 9 per cent of total spend.

9 Who Buys What and How
The Forest Products Commission accounted for $68.7 million (100 per cent) of the spend in the Forestry group and $1.4 million (60 per cent) of the spend in the Land and Soil Preparation and Management and Protection group.
The Departments of Health and Education spent $10.3 million (68 per cent) of the total spend for the Refuse Disposal and Treatment group.
Goods/Services Description Code Expenditure $ %
Land and Soil Preparation and Management and Protection
7013 $2,292,556 2%
Forestry 7015 $68,733,387 69%
Water Resources Development and Oversight 7017 $438,734 <1%
Refuse Disposal and Treatment 7612 $15,237,804 15%
Toxic and Hazardous Waste Cleanup 7613 $79,572 <1%
Environmental Management 7710 $8,473,244 9%
Environmental Protection 7711 $1,840,936 2%
Pollution Tracking and Monitoring and Rehabilitation 7712 $2,108,060 2%
GROUP TOTAL $99,204,292
Group G: Environment and Waste Disposal

10 Who Buys What and How
Goods/Services Description Code Expenditure $ %
The Department of Health accounted for $403 million (99 per cent) of the spend in the Comprehensive Health Services group and $361.1 million (92 per cent) of the spend in the Medical Practice group.
It also accounted for $89.2 million (almost 100 per cent) of the spend in the Orthopedic and Prosthetic and Sports Medicine Products group.
Goods/Services Description Code Expenditure $ %
Laboratory and Scientific Equipment 4110 $8,092,541 <1%
Measuring and Observing and Testing Instruments 4111 $23,290,219 2%
Laboratory Supplies and Fixtures 4112 $2,555,511 <1%
Medical Apparel and Textiles 4213 $4,246,190 <1%
Patient Care and Treatment Products and Supplies 4214 $1,730,541 <1%
Dental Equipment and Supplies 4215 $2,352,860 <1%
Dialysis Equipment and Supplies 4216 $239,295 <1%
Emergency and Field Medical Services Products 4217 $989,634 <1%
Patient Exam and Monitoring Products 4218 $3,830 <1%
Medical Facility Products 4219 $723,392 <1%
Medical Diagnostic Imaging and Nuclear Medicine Products
4220 $3,946,083 <1%
Independent Living Aids for The Physically Challenged 4221 $20,162,974 2%
Clinical Nutrition 4223 $18,896 <1%
Orthopaedic and Prosthetic and Sports Medicine Products
4224 $89,246,801 7%
Physical and Occupational Therapy and Rehabilitation Products
4225 $10,950 <1%
Respiratory and Anaesthesia and Resuscitation Products
4227 $230,573 <1%
Medical Sterilization Products 4228 $2,783 <1%
Surgical Products 4229 $122,733,526 10%
Medical Training and Education Supplies 4230 $12,320 <1%
Wound Care Products 4231 $29,135,335 2%
Anti Infective Drugs 5110 $1,888,080 <1%
Agents Affecting Water and Electrolytes 5119 $136,921 <1%
Immunomodulating Drugs 5120 $30,288,600 2%
Miscellaneous Drug Categories 5121 $11,271,268 <1%
Group H: Health and MedicineMedical Equipment - Repairs and Maintenance 0002 $23,912,201 2%
Lease/Rent/Hire - Medical 0035 $516,399 <1%
Comprehensive Health Services 8510 $407,770,213 32%
Disease Prevention and Control 8511 $86,336,675 7%
Medical Practice 8512 $390,344,318 30%
Medical Science Research and Experimentation 8513 $22,810,383 2%
Food and Nutrition Services 8515 $2,163 <1%
GROUP TOTAL $1,285,001,477

11 Who Buys What and How
The Gold Corporation accounted for $1.2 million (over 90 per cent) of the spend in the Manufacturing Support Services group and for $0.4 million (62 per cent) of the spend in the Machining and Processing Services group.
The Department of Mines and Petroleum accounted for $0.1 million (54 per cent) of the spend in the Manufacture of Electrical Goods and Precision Instruments group.
The Department of Health spent $19.7 million (almost 100 per cent) of expenditure in the Additives group.
The Public Transport Authority accounted for $1.9 million (92 per cent) of the spend in the Electrical Wire and Cable and Harness group.
Goods/Services Description Code Expenditure $ %
Plastic and Chemical Industries 7310 $904 <1%
Metal and Mineral Industries 7312 $376,829 15%
Fibers and Textiles and Fabric Industries 7314 $7,803 <1%
Manufacturing Support Services 7315 $1,310,932 51%
Machinery and Transport Equipment Manufacture 7316 $59,523 2%
Manufacture of Electrical Goods and Precision Instruments
7317 $143,731 6%
Machining and Processing Services 7318 $663,899 26%
GROUP TOTAL $2,563,622
Group I: Industrial ServicesGoods/Services Description Code Expenditure $ %
Non Edible Plant and Forestry Products 1112 $346,287 1%
Scrap and Waste Materials 1114 $150 <1%
Fibres and Threads and Yarns 1115 $486 <1%
Fabrics and Leather Materials 1116 $137,904 <1%
Explosive Materials 1213 $32,562 <1%
Elements and Gases 1214 $1,558,160 5%
Additives 1216 $19,680,635 64%
Colorants 1217 $15,597 <1%
Compounds and Mixtures 1235 $2,216,005 7%
Rubber and Elastomers 1310 $40 <1%
Resins and Rosins and Other Resin Derived Materials 1311 $4,962 <1%
Industrial Use Papers 1412 $460 <1%
Lubricants and Oils and Greases and Anti Corrosives 1512 $63,492 <1%
Electrical Wire and Cable and Harness 2612 $2,045,951 7%
Castings 3110 $26,601 <1%
Rope and Chain and Cable and Wire and Strap 3115 $16,054 <1%
Hardware 3116 $4,224,848 14%
Bearings and Bushings and Wheels and Gears 3117 $3,018 <1%
Adhesives and Sealants 3120 $85 <1%
Paints and Primers and Finishes 3121 $166,472 <1%
Machined Raw Stock 3123 $108,785 <1%
Industrial Optics 3124 $169 <1%
Stampings and Sheet Components 3128 $36,069 <1%
Magnets and Magnetic Materials 3138 $8 <1%
Group Total $30,684,800
Group J: Industrial Components

12 Who Buys What and How
The Public Transport Authority accounted for $3.1 million (94 per cent) of the spend in the Material Handling Machinery and Equipment group, while the Gold Corporation spent $1.5 million (55 per cent) in the Workshop Machinery and Equipment and Supplies group.
The Department of Housing accounted for $0.3 million (57 per cent) of the spend in the Batteries and Generators and Kinetic Power Transmission group.
The Department of Health accounted for $153.3 million (53 per cent) of the spend in the Public Order and Safety group, while the Department of the Attorney General accounted for $28.6 million (54 per cent) of the spend in the Security and Personal Safety group and the Public Transport Authority accounted for $10.2 million (93 per cent) of the spend in the Public Safety and Control group.
Group K: Industrial MachineryGoods/Services Description Code Expenditure $ %
Lapidary Machinery and Equipment 2313 $4 <1%
Industrial Process Machinery and Equipment and Supplies
2315 $283,696 3%
Foundry Machines and Equipment and Supplies 2316 $355,888 4%
Workshop Machinery and Equipment and Supplies 2317 $2,732,009 27%
Industrial Food and Beverage Equipment 2318 $22,719 <1%
Sawmilling and Lumber Processing Machinery and Equipment
2323 $15,232 <1%
Material Handling Machinery and Equipment 2410 $3,281,486 32%
Power Sources 2610 $255,685 3%
Batteries and Generators and Kinetic Power Transmission
2611 $484,203 5%
Power Generation 2613 $174,571 2%
Hand Tools 2711 $1,502,005 15%
Hydraulic Machinery and Equipment 2712 $80,135 <1%
Pneumatic Machinery and Equipment 2713 $3,547 <1%
Automotive Specialty Tools 2714 $26,000 <1%
Industrial Pumps and Compressors 4015 $434,517 4%
Printing and Publishing Equipment 4510 $479,334 5%
GROUP TOTAL $10,131,031
Goods/Services Description Code Expenditure $ %
Light Weapons and Ammunition 4610 $1,479,907 <1%
Law Enforcement 4615 $971,019 <1%
Public Safety and Control 4616 $11,014,980 3%
Security Surveillance and Detection 4617 $3,207,319 <1%
Personal Safety and Protection 4618 $11,170,679 3%
Fire Protection 4619 $2,493,561 <1%
Public Order and Safety 9210 $287,060,852 78%
Security and Personal Safety 9212 $52,699,323 14%
GROUP TOTAL $370,097,639
Group L: Law, Order and SafetyGroup L: Law, Order and Safety

13 Who Buys What and How
The Gold Corporation accounted for $5.67 billion (100 per cent) of the spend in the Minerals and Ores and Metals group.
The Public Transport Authority accounted for $1,000 dollars (89 per cent) of the spend in the Oil and Gas Data Management and Processing Services group.
The Departments of Education and Health spent a combined $33.4 million (66 per cent) of the total spend for the Office Supplies group.
They also accounted for $11.2 million (64 per cent) of the total spend for the Commercial and Industrial Furniture group.
The Department of Education and the Western Australian Sports Centre Trust spent $15.8 million (62 per cent) of the total spend for the Office Machines and their Supplies and Accessories group.
Goods/Services Description Code Expenditure $ %
Minerals and Ores and Metals 1110 $5,673,662,597 100%
Oil and Gas Data Management and Processing Services
7115 $1,119 <1%
GROUP TOTAL $5,673,663,716
Group M: MiningGoods/Services Description Code Expenditure $ %
Paper Products 1411 $6,882,081 5%
Office Machines and Their Supplies and Accessories 4410 $25,391,973 18%
Office and Desk Accessories 4411 $320,432 <1%
Office Supplies 4412 $50,835,268 36%
Audio and Visual Presentation and Composing Equipment
4511 $3,245,242 2%
Photographic or Filming or Video Equipment 4512 $417,416 <1%
Photographic and Recording Media 4513 $337,148 <1%
Photographic Filmmaking Supplies 4514 $33,287 <1%
Signage and Accessories 5512 $20,195,613 14%
Commercial and Industrial Furniture 5611 $17,548,482 12%
Merchandising Furniture and Accessories 5613 $21,916 <1%
Office Equipment - Repairs and Maintenance 0001 $14,307,929 10%
Furniture Fixtures & Fittings - Repairs and Maintenance 0012 $1,653,820 1%
Lease/Rent/Hire - Furnishing and Fitting 0030 $34,481 <1%
Lease/Rent/Hire - Office Items 0034 $660,605 <1%
GROUP TOTAL $141,885,693
Group O: Office and Commercial

14 Who Buys What and How
Goods/Services Description Code Expenditure $ %
The Department of Training and Workforce Development and the Disability Services Commission spent $1.11 billion (58 per cent) of the total spend for the Public Administration and Finance Services group.
The Department of Child Protection and Family Support accounted for $232.5 million (78 per cent) of the spend in the Community and Social Services group.
Goods/Services Description Code Expenditure $ %
Research and Development 0007 $656,715 <1%
Professional/Technical Services - Other 0027 $36,476,876 <1%
Lease/Rent/Hire - Other 0028 $14,044,739 <1%
Management Advisory Services 8010 $318,740,347 8%
Human Resources Services 8011 $224,870,485 6%
Legal Services 8012 $17,731,386 <1%
Real Estate Services 8013 $479,545,499 12%
Marketing and Distribution 8014 $53,743,626 1%
Trade Policy and Services 8015 $221,907 <1%
Business Administration Services 8016 $55,200,011 1%
Professional Engineering Services 8110 $103,965,582 3%
Economics 8112 $733,923 <1%
Statistics 8113 $8,032,080 <1%
Manufacturing Technologies 8114 $20,584,110 <1%
Earth Science Services 8115 $5,115,457 <1%
Advertising 8210 $54,719,627 1%
Writing and Translations 8211 $7,871,082 <1%
Reproduction Services 8212 $24,832,197 <1%
Photographic Services 8213 $3,061,260 <1%
Graphic Design 8214 $3,678,798 <1%
Professional Artists and Performers 8215 $1,719,799 <1%
Information Services 8312 $383,789 <1%
Development Finance 8410 $4,056,719 <1%
Accounting and Auditing 8411 $55,460,562 1%
Banking and Investment 8412 $35,006,218 <1%
Insurance and Retirement Services 8413 $123,827,571 3%
Credit Agencies 8414 $227,336 <1%
Political Systems and Institutions 9310 $6,790 <1%
Group P: ProfessionalInternational Relations 9312 $131,378 <1%
Humanitarian Aid and Relief 9313 $1,046,516 <1%
Community and Social Services 9314 $297,938,810 8%
Public Administration and Finance Services 9315 $1,932,227,080 49%
Taxation 9316 $10,115,609 <1%
Work Related Organizations 9410 $14,422,118 <1%
GROUP TOTAL $3,910,396,002

15 Who Buys What and How
The Departments of Health and Education spent $22 million (58 per cent) of the total spend for the Hotels and Lodging and Meeting Facilities group, while Education alone accounted for $2.7 million (66 per cent) of the spend in the Prepared and Preserved Foods group.
Goods/Services Description Code Expenditure $ %
Institutional Food Services Equipment 4810 $2,601,192 4%
Gambling or Wagering Equipment 4812 $33,107 <1%
Collectibles and Awards 4910 $1,104,657 2%
Camping and Outdoor Equipment and Accessories 4912 $764 <1%
Watersports Equipment 4914 $83,413 <1%
Fitness Equipment 4920 $413,549 <1%
Sports Equipment and Accessories 4922 $139 <1%
Recreation and Playground and Swimming and Spa Equipment and Supplies
4924 $4,708 <1%
Fruits and Vegetables and Nuts and Seeds 5010 $290,054 <1%
Meat and Poultry Products 5011 $681,450 <1%
Seafood 5012 $15,665 <1%
Dairy Products and Eggs 5013 $246,946 <1%
Edible Oils and Fats 5015 $2,498 <1%
Chocolate and Sugars and Sweeteners and Confectionary Products
5016 $38,247 <1%
Seasonings and Preservatives 5017 $5,000 <1%
Bread and Bakery Products 5018 $361,764 <1%
Prepared and Preserved Foods 5019 $4,136,811 6%
Beverages 5020 $982,523 1%
Cereal and Pulse Products 5022 $13,000 <1%
Arts and Crafts Equipment and Accessories and Supplies
6012 $4,412,768 6%
Musical Instruments and Parts and Accessories 6013 $339,832 <1%
Toys and Games 6014 $337,823 <1%
Restaurants and Catering 9010 $14,129,436 21%
Hotels and Lodging and Meeting Facilities 9011 $37,749,142 55%
Performing Arts 9013 $50,613 <1%
Commercial Sports 9014 $87,600 <1%
Entertainment Services 9015 $193,018 <1%
GROUP TOTAL $68,315,717
Group R: Recreational, Catering, Food and Hospitality

16 Who Buys What and How
The Department of Health accounted for $2.1 million (88 per cent) of the spend in the Packing Supplies group and $0.5 million (79 per cent) of the spend in the Material Packing and Handling group.
The Public Transport Authority accounted for $402.1 million (more than 65 per cent) of the spend in the Passenger Transport group and $157.4 million (almost 100 per cent) of the spend in the Railway and Tramway Machinery and Equipment group.
Goods/Services Description Code Expenditure $ %
Containers and Storage 2411 $2,187,493 18%
Packaging Materials 2412 $21,187 <1%
Industrial Refrigeration 2413 $1,727 <1%
Packing Supplies 2414 $2,417,209 20%
Material Packing and Handling 7812 $695,598 6%
Storage 7813 $6,846,590 56%
GROUP TOTAL $12,169,805
Group S: StorageGoods/Services Description Code Expenditure $ %
Fuels 1510 $29,494,979 3%
Gaseous Fuels and Additives 1511 $5,006,382 <1%
Motor Vehicles 2510 $112,987,262 10%
Marine Transport 2511 $3,592,331 <1%
Railway and Tramway Machinery and Equipment 2512 $157,404,425 15%
Aircraft 2513 $28,313,808 3%
Non Motorized Cycles 2516 $588 <1%
Transportation Components and Systems 2517 $15,785,114 1%
Vehicle Bodies and Trailers 2518 $405,181 <1%
Transportation Services Equipment 2519 $2,219,071 <1%
Mail and Cargo Transport 7810 $76,269,872 7%
Passenger Transport 7811 $617,465,903 57%
Transport Operations 7814 $2,643,643 <1%
Transportation Repair or Maintenance Services 7818 $29,114,895 3%
Travel Facilitation 9012 $1,485,293 <1%
GROUP TOTAL $1,082,188,747
Group T: Travel and Transportation
17 Who Buys What and How
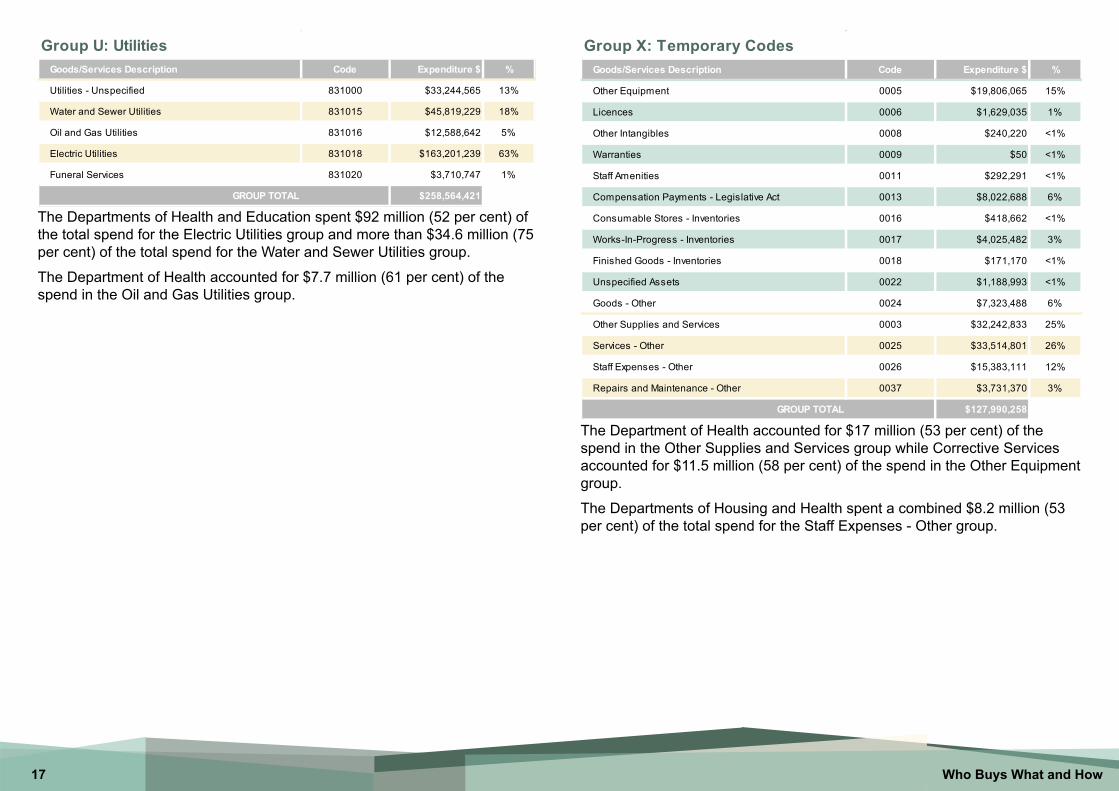
The Departments of Health and Education spent $92 million (52 per cent) of the total spend for the Electric Utilities group and more than $34.6 million (75 per cent) of the total spend for the Water and Sewer Utilities group.
The Department of Health accounted for $7.7 million (61 per cent) of the spend in the Oil and Gas Utilities group.
The Department of Health accounted for $17 million (53 per cent) of the spend in the Other Supplies and Services group while Corrective Services accounted for $11.5 million (58 per cent) of the spend in the Other Equipment group.
The Departments of Housing and Health spent a combined $8.2 million (53 per cent) of the total spend for the Staff Expenses - Other group.
Goods/Services Description Code Expenditure $ %
Utilities - Unspecified 831000 $33,244,565 13%
Water and Sewer Utilities 831015 $45,819,229 18%
Oil and Gas Utilities 831016 $12,588,642 5%
Electric Utilities 831018 $163,201,239 63%
Funeral Services 831020 $3,710,747 1%
GROUP TOTAL $258,564,421
Group U: UtilitiesGoods/Services Description Code Expenditure $ %
Other Equipment 0005 $19,806,065 15%
Licences 0006 $1,629,035 1%
Other Intangibles 0008 $240,220 <1%
Warranties 0009 $50 <1%
Staff Amenities 0011 $292,291 <1%
Compensation Payments - Legislative Act 0013 $8,022,688 6%
Consumable Stores - Inventories 0016 $418,662 <1%
Works-In-Progress - Inventories 0017 $4,025,482 3%
Finished Goods - Inventories 0018 $171,170 <1%
Unspecified Assets 0022 $1,188,993 <1%
Goods - Other 0024 $7,323,488 6%
Other Supplies and Services 0003 $32,242,833 25%
Services - Other 0025 $33,514,801 26%
Staff Expenses - Other 0026 $15,383,111 12%
Repairs and Maintenance - Other 0037 $3,731,370 3%
GROUP TOTAL $127,990,258
Group X: Temporary Codes

18 Who Buys What and How
Appendix 4: Spending agencies within family codesThe following tables identify up to 10 of the largest general government sector agencies buying in each of the goods and services categories, ranked by dollar value of expenditure and grouped by the UNSPSC family level.
This diagram explains how to interpret information within this appendix. Sections in Green denote goods, sections in Yellow are services.
UNSPSC family code
Total expenditure for all agencies under
this family code
Per cent of agency family code expenditure over
the total expenditure for the family code
Top 10 spending agencies for this family code
The group that these family codes belong to
A Agriculture, Horticulture, Plants & AnimalsCode Goods/Services
DescriptionTotal Expenditure For All Agencies $ Agency $ %
Western Australia Police $684,166 86%
Animal Resources Centre $63,978 8%
Challenger Institute of Technology $27,977 4%
Polytechnic West $13,844 2%
Durack Institute of Technology $7,393 1%
$797,358Live Animals
1010
Agency expenditure for this family code

19 Who Buys What and How
A Agriculture, Horticulture, Plants & AnimalsCode Goods/Services
DescriptionTotal Expenditure For All Agencies $ Agency $ %
Western Australia Police $684,166 86%
Animal Resources Centre $63,978 8%
Challenger Institute of Technology $27,977 4%
Polytechnic West $13,844 2%
Durack Institute of Technology $7,393 1%
1011 Domestic Pet Products $82 Disability Services Commission $82 100%
Department of Education $2,502,489 70%
Zoological Parks Authority $534,041 15%
Animal Resources Centre $165,755 5%
Department of Agriculture and Food $129,853 4%
Challenger Institute of Technology $123,581 3%
Western Australia Police $114,916 3%
Department of Fisheries $16,315 <1%
Western Australian Planning Commission $9,364 <1%
Great Southern Institute of Technology $1,000 <1%
Disability Services Commission $28 <1%
Animal Resources Centre $322,518 97%
Botanic Gardens and Parks Authority $5,188 2%
Zoological Parks Authority $3,311 1%
Landgate $1,120 <1%
Department of Education $811,698 69%
Department of Environment and Conservation
$294,235 25%
Botanic Gardens and Parks Authority $72,559 6%
Department of Indigenous Affairs $2,363 <1%
Forest Products Commission $1,658 <1%
Disability Services Commission $38 <1%
Live Animals
1010
Seeds and Bulbs and Seedlings and Cuttings10
15
Animal Containment and Habitats10
13
Animal Feed
1012
$797,358
$3,597,342
$332,137
$1,182,552
Western Australian Planning Commission $60,228 43%
Metropolitan Cemeteries Board $43,372 31%
Great Southern Institute of Technology $17,536 12%
Department of Finance $5,709 4%
Main Roads Western Australia $5,442 4%
Department of Agriculture and Food $3,264 2%
Department of Education $1,821 1%
Western Australian Sports Centre Trust $1,466 1%
Disability Services Commission $1,052 1%
Kimberley Development Commission $991 1%
Department of Education $1,316,485 47%
Forest Products Commission $1,309,416 47%
Botanic Gardens and Parks Authority $61,318 2%
Department of Training and Workforce Development
$45,786 2%
Metropolitan Cemeteries Board $43,261 2%
Polytechnic West $10,698 <1%
Challenger Institute of Technology $10,345 <1%
Great Southern Institute of Technology $7,200 <1%
Durack Institute of Technology $3,281 <1%
West Coast Institute of Training $2,236 <1%
Department of Environment and Conservation
$1,310,608 95%
Metropolitan Cemeteries Board $57,227 4%
Forest Products Commission $9,464 1%
Zoological Parks Authority $8,437 1%
Great Southern Institute of Technology $575 <1%
Disability Services Commission $25 <1%11
13 Non Edible Animal Products $3,350 Great Southern Institute of Technology $3,350 100%
Botanic Gardens and Parks Authority $146,519 84%
Great Southern Institute of Technology $26,083 15%
Disability Services Commission $9,720 6%
Forest Products Commission -$6,977 <1%
Floriculture and Silviculture Products10
16
Agricultural and Forestry and Landscape Machinery and Equipment21
10
Pest Control Products1019
Fertilizers and Plant Nutrients and Herbicides10
17
$141,612
$2,812,474
$1,386,336
$175,345
Code Goods/Services Description
Total Expenditure For All Agencies $ Agency $ %

20 Who Buys What and How
4212 Veterinary Equipment and
Supplies $63,108 Zoological Parks Authority $63,108 100%
5125 Veterinary Nutritional
Supplement $23,991 Zoological Parks Authority $23,991 100%
Department of Education $5,085,254 34%
Department of Housing $3,030,674 20%
Department of Health $2,842,619 19%
Polytechnic West $461,721 3%
Botanic Gardens and Parks Authority $433,857 3%
Metropolitan Cemeteries Board $431,448 3%
Department of Corrective Services $334,591 2%
Central Institute of Technology $304,145 2%
South West Institute of Technology $254,208 2%
Western Australia Police $248,442 2%
Western Australia Police $89,905 73%
Zoological Parks Authority $32,440 26%
Disability Services Commission $1,087 1%
Perth Market Authority (Market City) $27,929 99%
Disability Services Commission $299 1%
Western Australian Planning Commission $185,519 83%
Botanic Gardens and Parks Authority $38,634 17%Wildlife and Flora70
16
Crop Production and Management and Protection70
14
Livestock Services7012
Horticulture7011 $14,834,068
$123,431
$28,228
$224,153
Code Goods/Services Description
Total Expenditure For All Agencies $ Agency $ %
B Building & ConstructionCode Goods/Services
DescriptionTotal Expenditure For All Agencies $ Agency $ %
Department of Housing $148,222,828 77%
Western Australian Sports Centre Trust $27,725,600 14%
Goldfields Institute of technology $4,700,000 2%
Department of Environment and Conservation
$4,492,000 2%
Department of Health $2,171,357 1%
Department of Fire and Emergency Services $1,843,347 1%
Western Australia Police $1,759,204 1%
Department of Water $618,000 <1%
Lotteries Commission of Western Australia (Lotterywest)
$445,000 <1%
Public Transport Authority $160,000 <1%
Western Australian Sports Centre Trust $6,646,013 45%
Department of Health $4,070,484 28%
Department of Fisheries $1,834,863 13%
Department of Environment and Conservation
$920,496 6%
Department of Water $325,167 2%
Main Roads Western Australia $295,066 2%
Perth Market Authority (Market City) $241,716 2%
Department of Culture and the Arts $123,922 1%
Burswood Park Board $96,201 1%
Swan River Trust $38,770 <1%
Main Roads Western Australia $1,329,902 82%
Department of Agriculture and Food $176,699 11%
Department of Fisheries $45,103 3%
Zoological Parks Authority $24,519 2%
Polytechnic West $24,031 1%
Western Australian Planning Commission $14,019 1%
Department of Water $12,324 1%
Botanic Gardens and Parks Authority $858 <1%
C.Y. O'Connor Institute $136 <1%
Disability Services Commission $27 <1%
$14,625,429
$192,137,336
$1,627,617
Land0004
Plant and Machinery
1111
0019
Earth and Stone

21 Who Buys What and How
Zoological Parks Authority $37,675 44%
Metropolitan Cemeteries Board $28,593 33%
Disability Services Commission $19,662 23%
Disability Services Commission $25,995 54%
Zoological Parks Authority $13,439 28%
Department of Health $7,536 16%
Great Southern Institute of Technology $1,314 3%
Public Transport Authority $19,693 72%
Disability Services Commission $7,835 28%
Lotteries Commission of Western Australia (Lotterywest)
$40,769 75%
Great Southern Institute of Technology $8,000 15%
Polytechnic West $5,249 10%
Disability Services Commission $396 1%
Department of Housing $48,613,375 99%
Public Transport Authority $584,808 1%
Landgate $35,835 <1%
Disability Services Commission $29,967 <1%
Zoological Parks Authority $8,106 <1%
Western Australian Sports Centre Trust $742,259,127 48%
Department of Education $481,093,263 31%
Department of Housing $92,515,279 6%
Department of Sport and Recreation $89,867,809 6%
Public Transport Authority $39,636,662 3%
Department of Transport $36,802,759 2%
Department for Child Protection and Family Support
$26,023,254 2%
Goldfields Institute of technology $16,825,300 1%
Kimberley Training Institute $11,358,176 1%
Department of Fire and Emergency Services $9,543,754 1%
Permanent Structures
3022
Prefabricated Structures
3020
Construction and Maintenance Support Equipment30
19
Plumbing Fixtures
3018
Doors and Windows and Glass30
17
Interior Finishing Materials30
16
$49,272,092
$48,283
$54,414
$27,528
$1,561,416,994
$85,930
Code Goods/Services Description
Total Expenditure For All Agencies $ Agency $ % Code Goods/Services
DescriptionTotal Expenditure For All Agencies $ Agency $ %
Public Transport Authority $2,158,722 65%
Department of Environment and Conservation
$508,528 15%
Department for Child Protection and Family Support
$476,147 14%
Metropolitan Cemeteries Board $174,870 5%
Polytechnic West $493,281 49%
South West Institute of Technology $145,066 15%
Challenger Institute of Technology $93,337 9%
Department of Agriculture and Food $67,506 7%
West Coast Institute of Training $55,424 6%
Durack Institute of Technology $44,250 4%
Great Southern Institute of Technology $37,603 4%
Goldfields Institute of technology $32,994 3%
Main Roads Western Australia $12,040 1%
C.Y. O'Connor Institute $11,252 1%
Challenger Institute of Technology $90,447 97%
Great Southern Institute of Technology $2,900 3%
Department of Housing $6,952,758 50%
Department of Health $4,173,085 30%
Department of Environment and Conservation
$2,308,331 17%
Forest Products Commission $317,658 2%
Zoological Parks Authority $89,578 1%
Swan River Trust $3,503 <1%
Department of Education $7,112,353 100%
Disability Services Commission $17,072 <1%
Great Southern Institute of Technology $187 <1%
3014 Insulation $700 Disability Services Commission $700 100%
Department of Environment and Conservation
$2,225,018 95%
Disability Services Commission $76,083 3%
Zoological Parks Authority $34,190 1%
Perth Market Authority (Market City) $12,034 1%
Botanic Gardens and Parks Authority $2,760 <1%
Main Roads Western Australia $367 <1%
3015
Structural Building Products30
13
Roads and Landscape3012
3011
3010
Exterior Finishing Materials
Heavy Construction Machinery and Equipment22
10 $3,318,267
$996,916
$93,347
$2,350,451
Structural Materials and Basic Shapes
Concrete and Cement and Plaster
$13,844,913
$7,129,612
22 Who Buys What and How
Metropolitan Cemeteries Board $63,496 44%
Department of Agriculture and Food $22,971 16%
Public Transport Authority $17,738 12%
Botanic Gardens and Parks Authority $13,675 10%
Great Southern Institute of Technology $8,643 6%
Disability Services Commission $7,304 5%
Department of Water $4,728 3%
Department of Finance $4,420 3%
Great Southern Institute of Technology $8,701 97%
Polytechnic West $179 2%
Disability Services Commission $79 1%
Department of Health $1,513,476 32%
Department of Fire and Emergency Services $1,356,119 29%
Department for Child Protection and Family Support
$562,457 12%
Western Australian Sports Centre Trust $355,007 8%
Department of Corrective Services $283,846 6%
Department of Training and Workforce Development
$204,841 4%
Pilbara Institute $123,543 3%
Great Southern Institute of Technology $110,834 2%
Botanic Gardens and Parks Authority $52,141 1%
Polytechnic West $36,212 1%
Department of Health $20,997,717 95%
Department of Fire and Emergency Services $395,199 2%
Botanic Gardens and Parks Authority $227,279 1%
School Curriculum and Standards Authority $126,843 1%
Rottnest Island Authority $94,069 <1%
Disability Services Commission $59,413 <1%
Department for Communities $41,727 <1%
Great Southern Institute of Technology $25,111 <1%
Drug and Alcohol Office $20,824 <1%
Health and Disability Services Complaints Office
$515 <1%
Lease/Rent/Hire - Plant and Equipment
Fluid and Gas Distribution
$21,988,695
$142,975
$8,959
$4,710,306
0032
4014
Heating and Ventilation and Air Circulation40
10
Repairs and Maintenance - Plant and Equipment00
36
Department of Health $856,492,243 52%
Department of Housing $340,703,062 21%
Department of Education $124,478,177 8%
Public Transport Authority $88,160,878 5%
Western Australia Police $57,328,136 3%
Department of Training and Workforce Development
$31,087,170 2%
Department of the Attorney General $26,013,443 2%
Department of Corrective Services $23,683,280 1%
Department of Environment and Conservation
$17,192,157 1%
Department of Transport $11,863,148 1%
Main Roads Western Australia $1,038,768,988 72%
Department of Housing $354,737,322 25%
Public Transport Authority $44,147,781 3%
Department of Health $7,559,750 1%
Department for Child Protection and Family Support
$1,791,136 <1%
Department of Water $389,000 <1%
Department of Agriculture and Food $184,625 <1%
Department of Finance $146,328 <1%
Zoological Parks Authority $133,809 <1%
Department of Transport $24,469 <1%
General Building Construction72
13
Building Construction and Support and Maintenance and Repair Services72
10 $1,648,673,436
$1,447,889,934
Code Goods/Services Description
Total Expenditure For All Agencies $ Agency $ % Code Goods/Services
DescriptionTotal Expenditure For All Agencies $ Agency $ %

23 Who Buys What and How
C CleaningCode Goods/Services
DescriptionTotal Expenditure For All Agencies $ Agency $ %
Gold Corporation $202,424 68%
Department of Commerce $84,685 28%
Department of Indigenous Affairs $8,054 3%
Zoological Parks Authority $4,247 1%
Great Southern Institute of Technology $49 <1%
Rottnest Island Authority $333,768 95%
Disability Services Commission $17,748 5%
Department of Education $61,395 83%
Disability Services Commission $5,756 8%
Metropolitan Cemeteries Board $5,545 8%
Department of Training and Workforce Development
$570 1%
Botanic Gardens and Parks Authority $348 <1%
Department of Health $14,643,299 72%
Department of Corrective Services $1,620,342 8%
Department of Housing $695,065 3%
Department of Education $590,238 3%
Department of Fire and Emergency Services $524,287 3%
Western Australia Police $403,742 2%
Department of Sport and Recreation $285,209 1%
Gold Corporation $235,955 1%
Polytechnic West $177,589 1%
Department of Agriculture and Food $149,513 1%
Zoological Parks Authority $23,628 61%
Botanic Gardens and Parks Authority $7,689 20%
Workcover Western Australia $4,437 11%
Department of Mines and Petroleum $2,507 6%
Disability Services Commission $600 2%
$73,614
$20,452,248
$38,861
Industrial Laundry and Dry Cleaning Equipment
Janitorial Equipment
Cleaning and Janitorial Supplies
Water and Wastewater Treatment Supply and Disposal
$351,516
$299,459
Decontamination Services
4710
7610
4713
4712
4711
Department of Health $22,900,484 29%
Department of Education $12,107,284 15%
Challenger Institute of Technology $7,080,147 9%
Western Australia Police $5,778,531 7%
Department of Finance $4,560,447 6%
Central Institute of Technology $2,875,708 4%
Polytechnic West $2,510,734 3%
Department of Housing $2,014,887 3%
Department of Corrective Services $1,954,121 2%
Department of the Attorney General $1,888,206 2%
7611 Cleaning and Janitorial
Services $78,596,176
Code Goods/Services Description
Total Expenditure For All Agencies $ Agency $ %

24 Who Buys What and How
D Domestic & PersonalCode Goods/Services
DescriptionTotal Expenditure For All Agencies $ Agency $ %
5210 Floor Coverings $17,859 Disability Services Commission $17,859 100%
Department of Health $3,104,859 86%
Department of Corrective Services $401,228 11%
Zoological Parks Authority $48,724 1%
Department of Sport and Recreation $24,667 1%
Drug and Alcohol Office $20,523 1%
Department of the Attorney General $8,386 <1%
Disability Services Commission $6,533 <1%
Western Australian Sports Centre Trust $4,698 <1%
Department of Fisheries $325 <1%
Disability Services Commission $30,871 56%
Department of Health $14,751 27%
Great Southern Institute of Technology $9,227 17%
Disability Services Commission $95,272 46%
Lotteries Commission of Western Australia (Lotterywest)
$37,773 18%
Western Australia Police $23,433 11%
Department of Fisheries $16,731 8%
Western Australian Sports Centre Trust $5,981 3%
Rottnest Island Authority $4,833 2%
Economic Regulation Authority $4,627 2%
Great Southern Institute of Technology $4,509 2%
Department of Transport $1,917 1%
Botanic Gardens and Parks Authority $1,757 1%
Botanic Gardens and Parks Authority $85,000 71%
Disability Services Commission $34,467 29%
Western Australia Police $13,538,657 96%
Metropolitan Cemeteries Board $471,220 3%
Disability Services Commission $33,407 <1%
Public Transport Authority $18,518 <1%
Great Southern Institute of Technology $1,100 <1%
Department of the Premier and Cabinet $489 <1%
$207,374
$119,467
$14,063,390
$3,619,943Bedclothes and Table and Kitchen Linen and Towels
Domestic Appliances
Domestic Kitchenware
Consumer Electronics
$54,849
5214
Window Treatments
5213
5212
5216
5215
Department of Health $4,729,240 33%
Western Australia Police $4,192,286 30%
Department of Corrective Services $1,844,934 13%
Department of Fire and Emergency Services $788,591 6%
Department of Environment and Conservation
$774,955 5%
Public Transport Authority $609,448 4%
Metropolitan Cemeteries Board $97,906 1%
Department of Sport and Recreation $97,714 1%
Department of Agriculture and Food $85,041 1%
Western Australian Sports Centre Trust $69,794 <1%
5311 Footwear $2,658 Disability Services Commission $2,658 100%
5312 Luggage and Handbags
and Packs and Cases $34,644 Botanic Gardens and Parks Authority $34,644 100%
Challenger Institute of Technology $472,603 47%
Department of Corrective Services $428,591 43%
Durack Institute of Technology $79,139 8%
Great Southern Institute of Technology $18,687 2%
Polytechnic West $4,667 <1%
Disability Services Commission $746 <1%
Department of Fisheries $38 <1%
Drug and Alcohol Office $23 <1%
5314 Sewing Supplies and
Accessories $100 Disability Services Commission $100 100%
Botanic Gardens and Parks Authority $253,055 75%
Zoological Parks Authority $84,182 25%
Polytechnic West $166 <1%
Durack Institute of Technology $22 <1%
C.Y. O'Connor Institute $5 <1%54
11 Timepieces $168 Disability Services Commission $168 100%
$1,004,495
$337,429
Personal Care Products
Jewelry
Clothing $14,168,240
5313
5310
5410
Code Goods/Services Description
Total Expenditure For All Agencies $ Agency $ %
25 Who Buys What and How
Disability Services Commission $1,140,454 22%
Department of Housing $1,035,950 20%
Department for Child Protection and Family Support
$717,397 14%
Western Australia Police $682,169 13%
Department of Health $408,119 8%
Department of Sport and Recreation $202,236 4%
Department of Environment and Conservation
$139,165 3%
Public Transport Authority $103,826 2%
Rottnest Island Authority $102,363 2%
Department of Transport $94,085 2%
9110 Personal Appearance $1,812 Disability Services Commission $1,812 100%
Department of Health $251,714,141 98%
Rottnest Island Authority $3,014,103 1%
Department of Education $1,299,011 1%
Department of Fire and Emergency Services $424,108 <1%
Disability Services Commission $320,711 <1%
Central Institute of Technology $186,843 <1%
Polytechnic West $52,691 <1%
Western Australia Police $49,294 <1%
Western Australian Sports Centre Trust $7,923 <1%
Department of Mines and Petroleum $7,186 <1%
9411 Religious Organizations $539,993 Department of Health $539,993 100%
Western Australia Police $937,320 99%
Lotteries Commission of Western Australia (Lotterywest)
$6,289 1%
Department of Transport $166,218 74%
Western Australian Treasury Corporation $34,665 15%
Rottnest Island Authority $25,089 11%
$5,268,189
$257,112,337
$943,609
$225,972
Domestic and Personal Assistance
Accommodation Furniture
9413
9412
9111
5610
Clubs
Civic Organizations and Associations and Movements
ECode Goods/Services
DescriptionTotal Expenditure For All Agencies $ Agency $ %
Department of Education $5,970,977 21%
Department of Health $5,189,724 18%
Department of Culture and the Arts $3,833,788 13%
Department of the Attorney General $2,729,138 9%
Department of Commerce $1,492,988 5%
Polytechnic West $1,474,440 5%
Central Institute of Technology $752,534 3%
Challenger Institute of Technology $735,486 3%
Western Australia Police $623,211 2%
Department of Agriculture and Food $389,975 1%
Department of Health $154,111 35%
Drug and Alcohol Office $145,581 34%
Department of State Development $82,872 19%
Department of Mines and Petroleum $34,791 8%
Great Southern Institute of Technology $11,728 3%
West Coast Institute of Training $3,568 1%
Disability Services Commission $1,077 <1%
Economic Regulation Authority $359 <1%
Department of Fire and Emergency Services $34 <1%
Department of Education $1,799,046 34%
Challenger Institute of Technology $645,223 12%
Pilbara Institute $532,872 10%
South West Institute of Technology $487,653 9%
Polytechnic West $401,990 8%
Goldfields Institute of technology $370,527 7%
West Coast Institute of Training $311,225 6%
Central Institute of Technology $290,468 5%
Durack Institute of Technology $246,116 5%
Kimberley Training Institute $224,095 4%
$28,755,829
$434,122
$5,347,667
5511
5510
5612
Educational
Printed Media
Electronic Reference Material
Classroom and Instructional and Institutional Furniture and Fixtures
Code Goods/Services Description
Total Expenditure For All Agencies $ Agency $ %

26 Who Buys What and How
Department of Education $160,937,391 98%
Central Institute of Technology $1,489,096 1%
South West Institute of Technology $654,829 <1%
Department of Transport $263,813 <1%
Department of Culture and the Arts $183,644 <1%
Department of Corrective Services $166,184 <1%
West Coast Institute of Training $141,577 <1%
C.Y. O'Connor Institute $122,459 <1%
Department of Training and Workforce Development
$93,226 <1%
Great Southern Institute of Technology $60,949 <1%
Department of Health $7,855,028 23%
Western Australia Police $2,655,375 8%
Public Transport Authority $2,236,122 7%
Department of Housing $2,016,164 6%
Department of Mines and Petroleum $1,511,574 4%
Department of Education $1,445,254 4%
Department of Finance $1,173,896 3%
Kimberley Training Institute $1,114,366 3%
Landgate $945,978 3%
Department of Transport $867,733 3%
Public Transport Authority $41,294 83%
Disability Services Commission $8,439 17%
Department of Education $15,192,892 82%
Department of Corrective Services $2,230,846 12%
Department of Finance $634,591 3%
Main Roads Western Australia $188,238 1%
Department of Agriculture and Food $64,366 <1%
Department of Culture and the Arts $51,195 <1%
Department of Water $29,108 <1%
Office of the Commissioner of Children and Young People
$18,316 <1%
Department of Commerce $12,407 <1%
Department of Local Government $5,167 <1%
6010
8612
8611
8610
$164,628,719
$34,134,859
$49,733
$18,429,740
Developmental and Professional Teaching Aids and Materials and Accessories and Supplies
Educational Institutions
Vocational Training
Alternative Educational Systems
8613 Specialized Educational
Services $135 Disability Services Commission $135 100%
Department of Corrective Services $885,524 50%
Department of Environment and Conservation
$794,694 44%
Department of State Development $59,293 3%
GESB $31,730 2%
Department of the Attorney General $8,373 <1%
Department of Transport $3,506 <1%
Durack Institute of Technology $3,256 <1%
8614 Educational Facilities $1,786,377
Code Goods/Services Description
Total Expenditure For All Agencies $ Agency $ %Code Goods/Services
DescriptionTotal Expenditure For All Agencies $ Agency $ %

27 Who Buys What and How
F IT, Telecommunications, Electronic & ElectricalCode Goods/Services
DescriptionTotal Expenditure For All Agencies $ Agency $ %
Public Transport Authority $1,035 99%F
Disability Services Commission $10 1%F
Disability Services Commission $57,603 59% F
Botanic Gardens and Parks Authority $25,000 26% F
Great Southern Institute of Technology $15,000 15% F
3910 Lamps and Lightbulbs
and Lamp Components $517 Disability Services Commission $517 100%
F
Public Transport Authority $309,053 90% F
Department of Health $29,498 9% F
Great Southern Institute of Technology $4,000 1% F
Disability Services Commission $2,214 1% F
Department of Agriculture and Food $1,494 <1% F
Department of Fisheries $782 <1% F
Western Australian Planning Commission $479 <1% F
Department of Finance $395 <1% F
Great Southern Development Commission $72 <1% F
Kimberley Development Commission $63 <1% F
Public Transport Authority $1,020,862 42% F
Department of Health $500,249 20% F
Polytechnic West $400,467 16% F
Western Australia Police $114,837 5% F
Goldfields Institute of technology $103,120 4% F
Challenger Institute of Technology $71,710 3% F
West Coast Institute of Training $64,972 3% F
Rottnest Island Authority $51,477 2% F
Zoological Parks Authority $51,401 2% F
Durack Institute of Technology $38,523 2% F
Electronic Hardware and Component Parts and Accessories
Lighting and Fixtures and Accessories
Electrical Equipment and Components and Supplies39
1239
1132
1332
10
Printed Circuits and Integrated Circuits and Microassemblies
$1,046
$97,603
$343,546
$2,450,678
Department of Corrective Services $1,234,406 17%
Central Institute of Technology $1,014,407 14%
Department of Health $984,700 14%
Department of Fire and Emergency Services $859,434 12%
Western Australia Police $801,018 11%
Department of Education $566,769 8%
Polytechnic West $466,665 6%
Department of Environment and Conservation
$461,810 6%
Challenger Institute of Technology $225,423 3%
Swan River Trust $85,090 1%
Western Australia Police $1,037,805 64%
Public Transport Authority $210,792 13%
Main Roads Western Australia $92,323 6%
Department of Culture and the Arts $88,629 5%
Workcover Western Australia $37,512 2%
Botanic Gardens and Parks Authority $25,000 2%
Department of Mines and Petroleum $24,706 2%
Department of Agriculture and Food $22,721 1%
Challenger Institute of Technology $22,427 1%
Department of Regional Development and Lands
$10,770 1%
Department of Health $27,066,921 34%
Western Australia Police $6,753,424 8%
Department of Education $5,640,206 7%
Department of Housing $4,065,694 5%
Department of Fisheries $3,217,931 4%
Lotteries Commission of Western Australia (Lotterywest)
$2,397,595 3%
Landgate $2,373,906 3%
Central Institute of Technology $2,301,366 3%
Main Roads Western Australia $1,972,663 2%
Polytechnic West $1,464,262 2%
$7,284,464
$1,616,366
$79,529,038
4320
4319
4321
Communications Devices and Accessories
Components for Information Technology or Broadcasting or Telecommunications
Computer Equipment and Accessories
Code Goods/Services Description
Total Expenditure For All Agencies $ Agency $ %

28 Who Buys What and How
Department of Environment and Conservation
$910,628 20%
Public Transport Authority $644,058 14%
Department of Fisheries $616,821 13%
Western Australia Police $548,291 12%
Challenger Institute of Technology $371,091 8%
Western Australian Sports Centre Trust $254,747 6%
Polytechnic West $224,955 5%
Department of Mines and Petroleum $193,667 4%
Great Southern Institute of Technology $126,905 3%
South West Institute of Technology $117,639 3%
Department of Education $13,809,119 21%
Western Australia Police $11,828,957 18%
Department of Treasury $11,186,192 17%
Department of the Attorney General $5,235,016 8%
Department of Health $3,189,424 5%
Department of Environment and Conservation
$2,505,363 4%
GESB $1,868,641 3%
Department of Fire and Emergency Services $1,436,334 2%
Department of Fisheries $1,397,375 2%
Department of Mines and Petroleum $1,173,933 2%
Department of Transport $1,237,382 31%
Department of Housing $1,085,007 27%
Department of Finance $742,359 19%
Central Institute of Technology $408,081 10%
Department of Corrective Services $350,732 9%
Department of Health $90,472 2%
Goldfields Institute of technology $31,902 1%
Swan River Trust $11,816 <1%
Tourism Western Australia $4,416 <1%
Department of the Registrar - WA Industrial Relations Commission
$500 <1%
Lease/Rent/Hire - Computer Hardware & Software
$4,570,150
$65,966,727
$3,963,4350029
4323
4322
Data Voice or Multimedia Network Equipment or Platforms and Accessories
Software
Botanic Gardens and Parks Authority $3,268 62%
Department of Local Government $680 13%
Western Australian Planning Commission $618 12%
Public Sector Commission $538 10%
Central Institute of Technology $124 2%
Durack Institute of Technology $15 <1%
Department of Finance $4,563,767 31%
Department of Transport $3,006,033 20%
Main Roads Western Australia $1,422,270 10%
Department of Water $892,459 6%
Central Institute of Technology $653,906 4%
Department of Culture and the Arts $514,749 3%
Polytechnic West $513,947 3%
Challenger Institute of Technology $479,315 3%
Office of the Auditor General $433,457 3%
Department of Indigenous Affairs $380,653 3%
Department of Health $115,216,838 24%
Public Transport Authority $98,861,163 21%
Department of Education $46,006,528 10%
Western Australia Police $41,433,539 9%
Department of Finance $32,774,181 7%
Landgate $20,186,137 4%
Department of the Attorney General $19,139,957 4%
Main Roads Western Australia $17,274,456 4%
Department for Child Protection and Family Support
$13,986,881 3%
Department of Corrective Services $13,097,988 3%
Lease/Rent/Hire - Communications
Software Licences
$5,243
$14,830,176
$479,574,9498111
0038
0033
Computer Services
Code Goods/Services Description
Total Expenditure For All Agencies $ Agency $ % Code Goods/Services
DescriptionTotal Expenditure For All Agencies $ Agency $ %

29 Who Buys What and How
Department of Education $25,019,354 20%
Department of Health $22,748,954 18%
Public Transport Authority $11,346,181 9%
Western Australia Police $11,165,920 9%
Department of Corrective Services $5,817,819 5%
Main Roads Western Australia $4,288,890 3%
Department of Environment and Conservation
$4,288,370 3%
Department of Finance $3,872,902 3%
Department of Training and Workforce Development
$3,702,773 3%
Department for Child Protection and Family Support
$3,512,513 3%
Telecommunications Media Services83
11 $126,588,278
G Environment & Waste DisposalCode Goods/Services
DescriptionTotal Expenditure For All Agencies $ Agency $ %
Forest Products Commission $1,386,460 60%
Department of Environment and Conservation
$894,243 39%
Botanic Gardens and Parks Authority $11,325 <1%
Western Australia Police $528 <1%
7015 Forestry $68,733,387 Forest Products Commission $68,733,387 100%
Botanic Gardens and Parks Authority $367,735 84%
Zoological Parks Authority $60,086 14%
Department of Health $10,913 2%
Department of Health $6,677,016 44%
Department of Education $3,618,231 24%
Department of Transport $552,785 4%
Rottnest Island Authority $541,440 4%
Department of Corrective Services $516,477 3%
Perth Market Authority (Market City) $479,917 3%
Western Australia Police $471,555 3%
Polytechnic West $295,782 2%
Zoological Parks Authority $197,051 1%
Gold Corporation $189,089 1%
Department of Agriculture and Food $24,862 31%
Department of Finance $15,749 20%
Western Australian Sports Centre Trust $12,693 16%
Department of Transport $9,230 12%
Main Roads Western Australia $8,784 11%
Department of Fisheries $5,157 6%
Western Australian Planning Commission $1,795 2%
Department of Regional Development and Lands
$767 1%
Disability Services Commission $516 1%
Department of Water $20 <1%
7612
7613
7017
7013 $2,292,556
$438,734
$15,237,804
$79,572
Land and Soil Preparation and Management and Protection
Water Resources Development and Oversight
Refuse Disposal and Treatment
Toxic and Hazardous Waste Cleanup
Code Goods/Services Description
Total Expenditure For All Agencies $ Agency $ %

30 Who Buys What and How
Department of Environment and Conservation
$4,300,387 51%
Public Transport Authority $1,923,366 23%
Department of Regional Development and Lands
$985,476 12%
Swan River Trust $759,050 9%
Department of Health $242,660 3%
Department of Mines and Petroleum $81,802 1%
Western Australian Planning Commission $68,722 1%
Perth Market Authority (Market City) $59,904 1%
Department of Transport $51,652 1%
Disability Services Commission $225 <1%
Department of Environment and Conservation
$1,839,519 100%
Department of State Development $1,417 <1%
Public Transport Authority $2,042,096 97%
Great Southern Institute of Technology $65,664 3%
Botanic Gardens and Parks Authority $299 <1%
Pollution Tracking and Monitoring and Rehabilitation77
1277
1177
10 $8,473,244
$1,840,936
$2,108,060
Environmental Protection
Environmental Management
H Health & MedicineCode Goods/Services
DescriptionTotal Expenditure For All Agencies $ Agency $ %
Department of Health $6,606,797 82%
Western Australia Police $412,791 5%
Botanic Gardens and Parks Authority $374,842 5%
Department of Agriculture and Food $304,007 4%
Animal Resources Centre $211,652 3%
Department of Fisheries $72,504 1%
Department of Environment and Conservation
$50,261 1%
Workcover Western Australia $26,500 <1%
Great Southern Institute of Technology $13,375 <1%
Department of Mines and Petroleum $8,762 <1%
Department of Health $22,789,500 98%
Western Australia Police $258,777 1%
Botanic Gardens and Parks Authority $133,915 1%
Department of Environment and Conservation
$45,316 <1%
Challenger Institute of Technology $34,100 <1%
Landgate $15,777 <1%
Western Australian Planning Commission $7,306 <1%
Drug and Alcohol Office $3,428 <1%
Disability Services Commission $2,102 <1%
Department of Health $2,344,988 92%
Botanic Gardens and Parks Authority $169,497 7%
Animal Resources Centre $40,694 2%
Forest Products Commission $333 <1%
Department of Health $4,207,894 99%
West Coast Institute of Training $20,553 <1%
Polytechnic West $15,103 <1%
Great Southern Institute of Technology $1,722 <1%
Drug and Alcohol Office $828 <1%
Disability Services Commission $90 <1%
Measuring and Observing and Testing Instruments
Laboratory Supplies and Fixtures
Medical Apparel and Textiles42
1341
1241
1141
10$4,246,190
$8,092,541
$23,290,219
$2,555,511
Laboratory and Scientific Equipment
Code Goods/Services Description
Total Expenditure For All Agencies $ Agency $ %

31 Who Buys What and How
Department of Health $1,382,104 80%
Department of Corrective Services $157,999 9%
Disability Services Commission $87,714 5%
Public Transport Authority $69,868 4%
Polytechnic West $24,008 1%
Great Southern Institute of Technology $3,910 <1%
Drug and Alcohol Office $3,493 <1%
Department of Housing $918 <1%
Botanic Gardens and Parks Authority $499 <1%
Department of Fisheries $29 <1%
Department of Health $2,351,057 100%
Disability Services Commission $1,300 <1%
Department of Corrective Services $480 <1%
Drug and Alcohol Office $22 <1%
4216 Dialysis Equipment and
Supplies $239,295 Department of Health $239,295 100%
Western Australia Police $833,279 84%
Challenger Institute of Technology $23,946 2%
Polytechnic West $18,257 2%
South West Institute of Technology $10,837 1%
Department of Fisheries $10,555 1%
Corruption and Crime Commission $9,686 1%
Central Institute of Technology $8,728 1%
Botanic Gardens and Parks Authority $8,123 1%
West Coast Institute of Training $7,148 1%
Western Australian Sports Centre Trust $6,869 1%
Department for Communities $3,179 83%
Disability Services Commission $366 10%
Drug and Alcohol Office $285 7%
Department of Health $380,698 53%
Disability Services Commission $238,194 33%
Botanic Gardens and Parks Authority $104,500 14%
Dental Equipment and Supplies
Patient Care and Treatment Products and Supplies
Emergency and Field Medical Services Products42
1742
1542
1442
1942
18
$1,730,541
$2,352,860
$989,634
$3,830
$723,392
Patient Exam and Monitoring Products
Medical Facility Products
4220
Medical Diagnostic Imaging and Nuclear Medicine Products
$3,946,083 Department of Health $3,946,083 100%
Department of Health $20,108,532 100%
Disability Services Commission $54,442 <1%
4223 Clinical Nutrition $18,896 Disability Services Commission $18,896 100%
Department of Health $89,189,486 100%
Disability Services Commission $57,315 <1%
Rottnest Island Authority $10,733 98%
Disability Services Commission $217 2%
Department of Health $227,877 99%
Disability Services Commission $2,696 1%
4228 Medical Sterilization
Products $2,783 Disability Services Commission $2,783 100%
Department of Health $122,732,407 100%
Drug and Alcohol Office $1,118 <1%
4230 Medical Training and
Education Supplies $12,320 Workcover Western Australia $12,320 100%
Department of Health $29,133,811 100%
Disability Services Commission $1,333 <1%
Healthway $191 <1%
5110 Anti Infective Drugs $1,888,080 Department of Corrective Services $1,888,080 100%
Department of Health $107,250 78%
Drug and Alcohol Office $29,671 22%
Department of Health $30,287,225 100%
Department for Communities $1,375 <1%
Department of Health $11,177,361 99%
Drug and Alcohol Office $76,370 1%
Western Australia Police $17,538 <1%
Respiratory and Anesthesia and Resuscitation Products
Independent Living Aids for The Physically Challenged
Orthopedic and Prosthetic and Sports Medicine Products
Physical and Occupational Therapy and Rehabilitation Products
$20,162,974
$89,246,801
$10,950
$230,573
$122,733,526
$29,135,335
$136,921
$30,288,600
$11,271,268
4221
4224
5120
5119
4231
4229
4227
4225
5121
Surgical Products
Wound Care Products
Agents Affecting Water and Electrolytes
Immunomodulating Drugs
Miscellaneous Drug Categories
Code Goods/Services Description
Total Expenditure For All Agencies $ Agency $ % Code Goods/Services
DescriptionTotal Expenditure For All Agencies $ Agency $ %

32 Who Buys What and How
Department of Health $23,345,282 98%
Department of Culture and the Arts $378,977 2%
Disability Services Commission $185,433 1%
Department of Fisheries $1,940 <1%
Drug and Alcohol Office $569 <1%
0035 Lease/Rent/Hire - Medical $516,399 Department of Health $516,399 100%
Department of Health $403,048,745 99%
Department of Corrective Services $3,469,416 1%
Department of the Attorney General $816,536 <1%
Public Transport Authority $412,594 <1%
Metropolitan Cemeteries Board $17,659 <1%
Department of State Development $2,266 <1%
Department of Fisheries $1,164 <1%
Western Australian Planning Commission $865 <1%
Disability Services Commission $473 <1%
Western Australian Sports Centre Trust $295 <1%
Department of Health $48,263,804 56%
Drug and Alcohol Office $38,068,328 44%
Great Southern Institute of Technology $2,190 <1%
Zoological Parks Authority $1,350 <1%
Botanic Gardens and Parks Authority $1,003 <1%
Disease Prevention and Control
Medical Equipment - Repairs and Maintenance
Comprehensive Health Services
8511
8510
0002 $23,912,201
$407,770,213
$86,336,675
Department of Health $361,052,228 92%
Western Australia Police $23,366,502 6%
Department of Corrective Services $3,971,825 1%
Department of the Attorney General $624,311 <1%
Department of Education $315,408 <1%
Department of Fire and Emergency Services $140,328 <1%
Department of Transport $124,210 <1%
Department of Culture and the Arts $96,928 <1%
Department of Finance $64,681 <1%
Disability Services Commission $58,438 <1%
Department of the Attorney General $8,202,419 36%
Drug and Alcohol Office $6,992,212 31%
Department of Health $6,244,424 27%
Department of Corrective Services $1,078,183 5%
Animal Resources Centre $292,931 1%
Disability Services Commission $214 <1%
8515 Food and Nutrition
Services $2,163 Department of Fire and Emergency Services $2,163 100%
$390,344,318
$22,810,3838513
8512 Medical Practice
Medical Science Research and Experimentation
Code Goods/Services Description
Total Expenditure For All Agencies $ Agency $ % Code Goods/Services
DescriptionTotal Expenditure For All Agencies $ Agency $ %

33 Who Buys What and How
I Industrial ServicesCode Goods/Services
DescriptionTotal Expenditure For All Agencies $ Agency $ %
7310 Plastic and Chemical
Industries $904 Gold Corporation $904 100%
Gold Corporation $215,195 57%
Botanic Gardens and Parks Authority $161,634 43%
Department of Health $7,343 94%
Disability Services Commission $440 6%
Western Australia Police $20 <1%
Gold Corporation $1,184,828 90%
Disability Services Commission $51,979 4%
Department of Training and Workforce Development
$50,116 4%
Metropolitan Cemeteries Board $20,687 2%
Department of Mines and Petroleum $3,323 <1%
Public Transport Authority $59,500 100%
Disability Services Commission $23 <1%
Department of Mines and Petroleum $77,952 54%
Public Transport Authority $62,649 44%
Landgate $2,746 2%
Disability Services Commission $385 <1%
Gold Corporation $413,018 62%
Perth Market Authority (Market City) $138,089 21%
Disability Services Commission $112,793 17%
Fibers and Textiles and Fabric Industries
Metal and Mineral Industries
7314
7312
7318
7317
7316
7315
$143,731
$663,899
$376,829
$7,803
$1,310,932
$59,523
Manufacturing Support Services
Machinery and Transport Equipment Manufacture
Manufacture of Electrical Goods and Precision Instruments
Machining and Processing Services
J Industrial ComponentsCode Goods/Services
DescriptionTotal Expenditure For All Agencies $ Agency $ %
Polytechnic West $202,359 58%
Challenger Institute of Technology $36,548 11%
Durack Institute of Technology $30,287 9%
South West Institute of Technology $26,019 8%
Great Southern Institute of Technology $23,365 7%
West Coast Institute of Training $22,700 7%
C.Y. O'Connor Institute $1,466 <1%
Main Roads Western Australia $1,206 <1%
Disability Services Commission $983 <1%
Department of Agriculture and Food $944 <1%
1114 Scrap and Waste
Materials $150 Disability Services Commission $150 100%
Great Southern Institute of Technology $375 77%
Polytechnic West $89 18%
Durack Institute of Technology $22 5%
Polytechnic West $72,895 53%
Department of Fisheries $14,873 11%
Challenger Institute of Technology $14,480 11%
South West Institute of Technology $11,712 8%
Great Southern Institute of Technology $10,000 7%
Durack Institute of Technology $6,357 5%
West Coast Institute of Training $4,538 3%
Goldfields Institute of technology $1,753 1%
C.Y. O'Connor Institute $1,295 1%
Western Australia Police $32,542 100%
Disability Services Commission $20 <1%
Fibers and Threads and Yarns
Non Edible Plant and Forestry Products
1115
1112
1213
1116
$346,287
$486
$137,904
$32,562Explosive Materials
Fabrics and Leather Materials
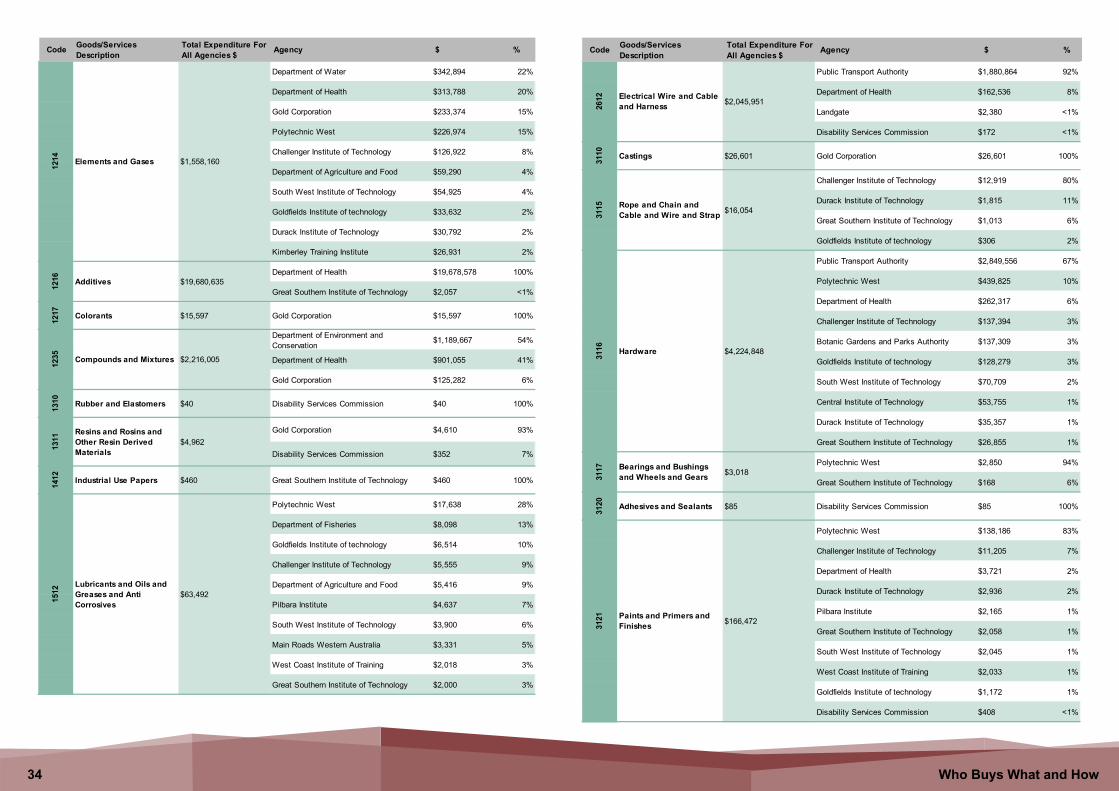
34 Who Buys What and How
Department of Water $342,894 22%
Department of Health $313,788 20%
Gold Corporation $233,374 15%
Polytechnic West $226,974 15%
Challenger Institute of Technology $126,922 8%
Department of Agriculture and Food $59,290 4%
South West Institute of Technology $54,925 4%
Goldfields Institute of technology $33,632 2%
Durack Institute of Technology $30,792 2%
Kimberley Training Institute $26,931 2%
Department of Health $19,678,578 100%
Great Southern Institute of Technology $2,057 <1%
1217 Colorants $15,597 Gold Corporation $15,597 100%
Department of Environment and Conservation
$1,189,667 54%
Department of Health $901,055 41%
Gold Corporation $125,282 6%
1310 Rubber and Elastomers $40 Disability Services Commission $40 100%
Gold Corporation $4,610 93%
Disability Services Commission $352 7%
1412 Industrial Use Papers $460 Great Southern Institute of Technology $460 100%
Polytechnic West $17,638 28%
Department of Fisheries $8,098 13%
Goldfields Institute of technology $6,514 10%
Challenger Institute of Technology $5,555 9%
Department of Agriculture and Food $5,416 9%
Pilbara Institute $4,637 7%
South West Institute of Technology $3,900 6%
Main Roads Western Australia $3,331 5%
West Coast Institute of Training $2,018 3%
Great Southern Institute of Technology $2,000 3%
Additives
Compounds and Mixtures
Lubricants and Oils and Greases and Anti Corrosives
Resins and Rosins and Other Resin Derived Materials
Elements and Gases
1512
1235
1216
1214
1311
$1,558,160
$19,680,635
$2,216,005
$4,962
$63,492
Public Transport Authority $1,880,864 92%
Department of Health $162,536 8%
Landgate $2,380 <1%
Disability Services Commission $172 <1%
3110 Castings $26,601 Gold Corporation $26,601 100%
Challenger Institute of Technology $12,919 80%
Durack Institute of Technology $1,815 11%
Great Southern Institute of Technology $1,013 6%
Goldfields Institute of technology $306 2%
Public Transport Authority $2,849,556 67%
Polytechnic West $439,825 10%
Department of Health $262,317 6%
Challenger Institute of Technology $137,394 3%
Botanic Gardens and Parks Authority $137,309 3%
Goldfields Institute of technology $128,279 3%
South West Institute of Technology $70,709 2%
Central Institute of Technology $53,755 1%
Durack Institute of Technology $35,357 1%
Great Southern Institute of Technology $26,855 1%
Polytechnic West $2,850 94%
Great Southern Institute of Technology $168 6%
3120 Adhesives and Sealants $85 Disability Services Commission $85 100%
Polytechnic West $138,186 83%
Challenger Institute of Technology $11,205 7%
Department of Health $3,721 2%
Durack Institute of Technology $2,936 2%
Pilbara Institute $2,165 1%
Great Southern Institute of Technology $2,058 1%
South West Institute of Technology $2,045 1%
West Coast Institute of Training $2,033 1%
Goldfields Institute of technology $1,172 1%
Disability Services Commission $408 <1%
3121
3117
3116
3115
2612
$16,054
$4,224,848
$3,018
$166,472
$2,045,951
Paints and Primers and Finishes
Bearings and Bushings and Wheels and Gears
Hardware
Rope and Chain and Cable and Wire and Strap
Electrical Wire and Cable and Harness
Code Goods/Services Description
Total Expenditure For All Agencies $ Agency $ % Code Goods/Services
DescriptionTotal Expenditure For All Agencies $ Agency $ %

35 Who Buys What and How
Polytechnic West $86,706 80%
Challenger Institute of Technology $11,252 10%
Durack Institute of Technology $10,697 10%
C.Y. O'Connor Institute $129 <1%
3124 Industrial Optics $169 Disability Services Commission $169 100%
Polytechnic West $31,782 88%
Durack Institute of Technology $3,459 10%
Challenger Institute of Technology $643 2%
C.Y. O'Connor Institute $185 1%
3138 Magnets and Magnetic
Materials $8 Disability Services Commission $8 100%
Stampings and Sheet Components31
2831
23 $108,785
$36,069
Machined Raw Stock
Code Goods/Services Description
Total Expenditure For All Agencies $ Agency $ %
K Industrial MachineryCode Goods/Services
DescriptionTotal Expenditure For All Agencies $ Agency $ %
2313 Lapidary Machinery and
Equipment $4 Disability Services Commission $4 100%
Department of Environment and Conservation
$267,619 94%
Great Southern Institute of Technology $6,600 2%
Animal Resources Centre $5,898 2%
Gold Corporation $3,579 1%
2316 Foundry Machines and
Equipment and Supplies $355,888 Gold Corporation $355,888 100%
Gold Corporation $1,499,781 55%
Department of Mines and Petroleum $1,129,230 41%
Polytechnic West $35,424 1%
Challenger Institute of Technology $24,905 1%
Great Southern Institute of Technology $20,524 1%
West Coast Institute of Training $12,182 <1%
Goldfields Institute of technology $7,987 <1%
Durack Institute of Technology $928 <1%
C.Y. O'Connor Institute $837 <1%
Disability Services Commission $212 <1%
2318 Industrial Food and
Beverage Equipment $22,719 Workcover Western Australia $22,719 100%
2323
Sawmilling and Lumber Processing Machinery and Equipment
$15,232 Disability Services Commission $15,232 100%
Public Transport Authority $3,071,488 94%
Metropolitan Cemeteries Board $133,169 4%
Animal Resources Centre $32,740 1%
Great Southern Institute of Technology $15,831 <1%
Department of Health $13,518 <1%
Botanic Gardens and Parks Authority $6,405 <1%
Western Australia Police $6,300 <1%
Disability Services Commission $2,035 <1%
Material Handling Machinery and Equipment
Industrial Process Machinery and Equipment and Supplies
Workshop Machinery and Equipment and Supplies
$283,696
$2,732,009
$3,281,486
2317
2315
2410

36 Who Buys What and How
Western Australia Police $246,930 97%
Polytechnic West $5,095 2%
Challenger Institute of Technology $3,146 1%
Durack Institute of Technology $515 <1%
Department of Housing $277,444 57%
Department of Fisheries $143,027 30%
Department of Health $33,310 7%
Landgate $11,266 2%
Durack Institute of Technology $7,615 2%
Botanic Gardens and Parks Authority $3,423 1%
C.Y. O'Connor Institute $3,130 1%
Disability Services Commission $2,098 <1%
Challenger Institute of Technology $1,890 <1%
Great Southern Institute of Technology $1,000 <1%
Zoological Parks Authority $160,159 92%
Great Southern Institute of Technology $14,412 8%
Department of Agriculture and Food $262,508 17%
Gold Corporation $246,492 16%
Metropolitan Cemeteries Board $190,507 13%
Polytechnic West $132,061 9%
Durack Institute of Technology $130,512 9%
South West Institute of Technology $94,649 6%
Department of Water $90,841 6%
Goldfields Institute of technology $46,131 3%
Challenger Institute of Technology $41,821 3%
Great Southern Institute of Technology $40,958 3%
Zoological Parks Authority $63,791 80%
Polytechnic West $16,344 20%
2713 Pneumatic Machinery and
Equipment $3,547 Polytechnic West $3,547 100%
2714 Automotive Specialty
Tools $26,000 Great Southern Institute of Technology $26,000 100%
Batteries and Generators and Kinetic Power Transmission
Power Generation
2712
2711
2610
2613
2611
$255,685
$484,203
$174,571
$1,502,005
$80,135Hydraulic Machinery and Equipment
Hand Tools
Power Sources
Metropolitan Cemeteries Board $420,183 97%
Zoological Parks Authority $7,881 2%
Great Southern Institute of Technology $6,204 1%
Disability Services Commission $250 <1%
Department of Commerce $198,219 41%
Gold Corporation $176,926 37%
Polytechnic West $40,738 8%
Challenger Institute of Technology $16,098 3%
Goldfields Institute of technology $15,368 3%
Central Institute of Technology $12,599 3%
Durack Institute of Technology $12,167 3%
C.Y. O'Connor Institute $5,749 1%
Department of Regional Development and Lands
$1,470 <1%
Printing and Publishing Equipment
Industrial Pumps and Compressors $434,517
$479,3344510
4015
Code Goods/Services Description
Total Expenditure For All Agencies $ Agency $ %Code Goods/Services
DescriptionTotal Expenditure For All Agencies $ Agency $ %

37 Who Buys What and How
L Law, Order & SafetyCode Goods/Services
DescriptionTotal Expenditure For All Agencies $ Agency $ %
Western Australia Police $1,448,190 98%
Department of Environment and Conservation
$18,167 1%
Department of Agriculture and Food $13,550 1%
Western Australia Police $913,113 94%
Drug and Alcohol Office $36,422 4%
Department of Health $21,226 2%
Disability Services Commission $258 <1%
Public Transport Authority $10,215,444 93%
Western Australia Police $779,159 7%
Botanic Gardens and Parks Authority $20,000 <1%
Disability Services Commission $377 <1%
Corruption and Crime Commission $1,606,968 50%
Public Transport Authority $382,923 12%
Department of Housing $362,091 11%
Perth Market Authority (Market City) $337,743 11%
Western Australia Police $157,632 5%
Department of the Attorney General $101,919 3%
Department of Health $78,672 2%
Gold Corporation $37,727 1%
Disability Services Commission $27,429 1%
Main Roads Western Australia $25,923 1%
Department of Health $5,931,953 53%
Department of Fire and Emergency Services $3,544,017 32%
Western Australia Police $636,610 6%
Public Transport Authority $180,989 2%
Challenger Institute of Technology $134,690 1%
Department of Transport $129,580 1%
Department of Mines and Petroleum $79,437 1%
Gold Corporation $68,640 1%
South West Institute of Technology $57,920 1%
Polytechnic West $48,524 <1%
Security Surveillance and Detection
Personal Safety and Protection
Law Enforcement
Light Weapons and Ammunition
Public Safety and Control
$1,479,907
$971,019
$11,014,980
$3,207,319
$11,170,6794618
4615
4610
4617
4616
Department of Environment and Conservation
$1,546,238 62%
Department of Fire and Emergency Services $504,948 20%
Public Transport Authority $253,482 10%
Department of Housing $61,402 2%
Lotteries Commission of Western Australia (Lotterywest)
$45,659 2%
Workcover Western Australia $30,283 1%
Department of Health $27,540 1%
Department of the Premier and Cabinet $10,909 <1%
Western Australia Police $7,350 <1%
Disability Services Commission $5,750 <1%
Department of Health $153,345,198 53%
Department of Corrective Services $109,110,560 38%
Department of Environment and Conservation
$7,523,047 3%
Western Australia Police $5,075,741 2%
Department of the Attorney General $3,846,207 1%
Western Australian Planning Commission $2,759,704 1%
Department of Fire and Emergency Services $2,484,152 1%
Forest Products Commission $2,106,219 1%
Department of Culture and the Arts $296,028 <1%
Department of Water $187,552 <1%
Department of the Attorney General $28,572,666 54%
Department of Education $4,697,114 9%
Department of Health $3,757,438 7%
Department of Fire and Emergency Services $3,012,930 6%
Department of Culture and the Arts $2,330,478 4%
Western Australia Police $1,875,557 4%
Department of Transport $1,864,291 4%
Department of the Premier and Cabinet $826,787 2%
Western Australian Sports Centre Trust $807,138 2%
Central Institute of Technology $790,393 1%
Public Order and Safety
Fire Protection $2,493,561
$287,060,852
$52,699,323
9210
4619
9212 Security and Personal
Safety
Code Goods/Services Description
Total Expenditure For All Agencies $ Agency $ %

38 Who Buys What and How
M MiningCode Goods/Services
DescriptionTotal Expenditure For All Agencies $ Agency $ %
1110 Minerals and Ores and
Metals $5,673,662,597 Gold Corporation $5,673,662,597 100%
7115
Oil and Gas Data Management and Processing Services
$1,119 Public Transport Authority $1,119 100%
O Office & CommercialCode Goods/Services
DescriptionTotal Expenditure For All Agencies $ Agency $ %
Lotteries Commission of Western Australia (Lotterywest)
$3,396,826 49%
Department of Health $861,143 13%
Department of Housing $593,712 9%
Department of Fire and Emergency Services $521,809 8%
Department of Mines and Petroleum $242,946 4%
Gold Corporation $185,933 3%
Western Australia Police $124,288 2%
Botanic Gardens and Parks Authority $95,711 1%
Polytechnic West $90,610 1%
Department of Transport $88,044 1%
Department of Education $12,085,966 48%
Western Australian Sports Centre Trust $3,738,171 15%
Department of the Attorney General $2,402,872 9%
Department of Corrective Services $802,522 3%
Western Australia Police $619,908 2%
Department of Fisheries $522,670 2%
Department of Sport and Recreation $468,220 2%
Department of Environment and Conservation
$460,934 2%
Landgate $382,729 2%
Department of the Premier and Cabinet $325,767 1%
Gold Corporation $195,668 61%
Landgate $60,150 19%
Department of Mines and Petroleum $46,491 15%
Disability Services Commission $12,515 4%
Department of Health $5,608 2%
Office Machines and Their Supplies and Accessories
Paper Products $6,882,081
$25,391,973
$320,43244
1144
1014
11Office and Desk Accessories

39 Who Buys What and How
Department of Education $20,852,054 41%
Department of Health $12,527,013 25%
Department of Agriculture and Food $1,918,199 4%
Western Australia Police $1,630,512 3%
Department of Fisheries $1,196,603 2%
Department for Child Protection and Family Support
$982,052 2%
Disability Services Commission $956,039 2%
Department of Corrective Services $920,312 2%
Department of the Attorney General $909,649 2%
Department of Environment and Conservation
$713,265 1%
Public Transport Authority $2,218,311 68%
Central Institute of Technology $473,922 15%
Department of Culture and the Arts $92,622 3%
Polytechnic West $88,781 3%
Department of Sport and Recreation $53,221 2%
Department of the Registrar - WA Industrial Relations Commission
$43,245 1%
South West Institute of Technology $37,143 1%
Department of Fisheries $34,403 1%
Challenger Institute of Technology $28,769 1%
Department of the Premier and Cabinet $26,805 1%
Western Australia Police $257,952 62%
Department of Fisheries $69,766 17%
Public Transport Authority $38,995 9%
Department of Culture and the Arts $16,987 4%
Department of Agriculture and Food $12,801 3%
Department of Mines and Petroleum $4,908 1%
Department of Transport $4,241 1%
Zoological Parks Authority $2,275 1%
Botanic Gardens and Parks Authority $2,238 1%
Department of Regional Development and Lands
$1,688 <1%
Audio and Visual Presentation and Composing Equipment
$50,835,268
$3,245,242
$417,4164512
4511
4412 Office Supplies
Photographic or Filming or Video Equipment
Main Roads Western Australia $80,312 24%
Central Institute of Technology $51,737 15%
Department of Fire and Emergency Services $44,797 13%
West Coast Institute of Training $41,363 12%
Department of Culture and the Arts $33,754 10%
Department of Racing, Gaming and Liquor $15,144 4%
Department of Fisheries $14,794 4%
Tourism Western Australia $12,378 4%
Department of Transport $10,157 3%
Public Sector Commission $7,198 2%
4514 Photographic Filmmaking
Supplies $33,287 Western Australia Police $33,287 100%
Public Transport Authority $10,274,412 51%
Department of Transport $8,995,214 45%
Main Roads Western Australia $307,785 2%
Botanic Gardens and Parks Authority $127,579 1%
Tourism Western Australia $121,460 1%
Department of Culture and the Arts $95,443 <1%
Western Australian Planning Commission $82,131 <1%
Zoological Parks Authority $72,751 <1%
Department of the Premier and Cabinet $21,428 <1%
Great Southern Institute of Technology $15,971 <1%
Department of Education $5,900,075 34%
Department of Health $5,280,859 30%
Goldfields Institute of technology $2,126,704 12%
Pilbara Institute $1,095,396 6%
Central Institute of Technology $879,927 5%
Polytechnic West $626,520 4%
Department of Training and Workforce Development
$379,433 2%
Durack Institute of Technology $272,921 2%
South West Institute of Technology $232,260 1%
Department of Mines and Petroleum $197,629 1%
$337,148
$20,195,613
$17,548,48255
1245
1356
11
Photographic and Recording Media
Signage and Accessories
Commercial and Industrial Furniture
Code Goods/Services Description
Total Expenditure For All Agencies $ Agency $ % Code Goods/Services
DescriptionTotal Expenditure For All Agencies $ Agency $ %

40 Who Buys What and How
5613 Merchandising Furniture
and Accessories $21,916Lotteries Commission of Western Australia (Lotterywest) $21,916 100%
Department of Health $12,026,482 84%
Western Australia Police $928,143 6%
Insurance Commission of Western Australia $299,833 2%
Department of Culture and the Arts $168,798 1%
Department for Child Protection and Family Support
$123,256 1%
Drug and Alcohol Office $99,393 1%
Durack Institute of Technology $83,674 1%
Department of Regional Development and Lands
$61,978 <1%
Public Sector Commission $55,992 <1%
Department for Communities $54,535 <1%
Department of Health $814,291 49%
Challenger Institute of Technology $180,311 11%
Polytechnic West $90,997 6%
Main Roads Western Australia $89,293 5%
Kimberley Training Institute $75,147 5%
Central Institute of Technology $63,127 4%
South West Institute of Technology $52,025 3%
Pilbara Institute $48,550 3%
Disability Services Commission $44,405 3%
Goldfields Institute of technology $36,083 2%
Department of Health $26,294 76%
Disability Services Commission $6,037 18%
Office of the Auditor General $2,150 6%
Lease/Rent/Hire - Furnishing and Fitting
$14,307,929
$1,653,820
0001
0012
0030
Furniture Fixtures & Fittings - Repairs and Maintenance
Office Equipment - Repairs and Maintenance
$34,481
Department of Culture and the Arts $230,850 35%
South West Institute of Technology $165,081 25%
Western Australian Sports Centre Trust $99,178 15%
Pilbara Institute $85,348 13%
Department of Transport $23,895 4%
Department of Finance $15,470 2%
Department of Water $14,434 2%
Main Roads Western Australia $14,421 2%
Western Australian Planning Commission $5,416 1%
Department of Training and Workforce Development
$2,359 <1%
$660,6050034 Lease/Rent/Hire - Office
Items
Code Goods/Services Description
Total Expenditure For All Agencies $ Agency $ %Code Goods/Services
DescriptionTotal Expenditure For All Agencies $ Agency $ %

41 Who Buys What and How
P ProfessionalCode Goods/Services
DescriptionTotal Expenditure For All Agencies $ Agency $ %
Department of Housing $480,627 73%
Durack Institute of Technology $56,207 9%
West Coast Institute of Training $48,354 7%
Goldfields Institute of technology $35,418 5%
Rottnest Island Authority $28,698 4%
Disability Services Commission $5,314 1%
Polytechnic West $2,098 <1%
Department of Transport $15,132,165 41%
Department of Environment and Conservation
$12,868,016 35%
Swan River Trust $2,319,942 6%
Tourism Western Australia $832,847 2%
Public Sector Commission $625,759 2%
Public Transport Authority $591,405 2%
Botanic Gardens and Parks Authority $558,164 2%
Small Business Development Corporation $506,691 1%
Department of Finance $502,557 1%
Department of Culture and the Arts $478,624 1%
Main Roads Western Australia $7,066,324 50%
Public Sector Commission $2,155,631 15%
Public Transport Authority $752,532 5%
Department of Culture and the Arts $664,087 5%
Western Australian Sports Centre Trust $635,139 5%
Department of Environment and Conservation
$586,090 4%
Department of Transport $585,827 4%
Department of the Registrar - WA Industrial Relations Commission
$479,739 3%
Rottnest Island Authority $351,613 3%
Department of Regional Development and Lands
$118,835 1%
$656,715
$36,476,876
$14,044,7390028
0027
0007 Research and
Development
Proffessional/Technical Services - Other
Lease/Rent/Hire - Other
Public Transport Authority $147,883,908 46%
Department of Housing $45,670,864 14%
Department of Health $30,400,519 10%
Department of Commerce $14,315,921 4%
Department of Mines and Petroleum $10,910,534 3%
Department for Child Protection and Family Support
$7,855,549 2%
Western Australia Police $6,252,970 2%
Department of Agriculture and Food $6,092,849 2%
Department of Finance $4,164,610 1%
Department of Sport and Recreation $3,709,030 1%
Department of Health $83,520,060 37%
Department of Education $24,385,071 11%
Department of Agriculture and Food $12,619,011 6%
Main Roads Western Australia $10,613,155 5%
Department of Finance $10,027,052 4%
Department of Housing $9,864,641 4%
Western Australian Electoral Commission $7,110,574 3%
School Curriculum and Standards Authority $6,891,887 3%
Gold Corporation $4,872,816 2%
Insurance Commission of Western Australia $4,464,991 2%
Main Roads Western Australia $2,722,203 15%
Western Australian Planning Commission $1,739,446 10%
South West Institute of Technology $1,060,468 6%
Department for Child Protection and Family Support
$924,560 5%
Department of the Premier and Cabinet $822,236 5%
Department of Education $741,941 4%
Department of Finance $711,936 4%
Department of Housing $685,924 4%
Landgate $588,906 3%
Department of Regional Development and Lands
$558,098 3%
Legal Services
$318,740,347
$224,870,485
$17,731,386
8010
8012
8011 Human Resources
Services
Management Advisory Services
Code Goods/Services Description
Total Expenditure For All Agencies $ Agency $ %

42 Who Buys What and How
Department of Housing $129,457,397 27%
Western Australia Police $61,076,315 13%
Department of Health $40,769,972 9%
Department of Corrective Services $34,733,827 7%
Department of Education $28,450,032 6%
Department of the Attorney General $27,663,024 6%
Department of the Premier and Cabinet $19,861,285 4%
Department of Commerce $17,216,120 4%
Department of Finance $15,807,833 3%
Department of Transport $11,674,506 2%
Tourism Western Australia $29,027,632 54%
Department of Health $8,899,983 17%
Department of Culture and the Arts $4,245,741 8%
Main Roads Western Australia $1,757,515 3%
Western Australia Police $1,286,533 2%
Gold Corporation $900,102 2%
GESB $743,122 1%
Forest Products Commission $620,634 1%
Landgate $601,272 1%
Lotteries Commission of Western Australia (Lotterywest)
$594,076 1%
Landgate $189,710 85%
Animal Resources Centre $16,420 7%
Department of Health $15,778 7%
Department of Health $20,402,972 37%
Department of Education $7,800,023 14%
Western Australia Police $5,967,416 11%
Western Australian Electoral Commission $2,499,119 5%
Department of Training and Workforce Development
$2,176,062 4%
Department of Environment and Conservation
$2,162,659 4%
Department of Transport $1,849,786 3%
Department of Mines and Petroleum $1,775,751 3%
Department of Culture and the Arts $1,730,845 3%
Rottnest Island Authority $1,586,105 3%
Trade Policy and Services
Marketing and Distribution
Real Estate Services $479,545,499
$53,743,626
$221,907
$55,200,011
8013
8016
8014
8015
Business Administration Services
Main Roads Western Australia $37,862,688 36%
Public Transport Authority $23,968,109 23%
Department of Mines and Petroleum $12,049,339 12%
Department of Health $7,724,728 7%
Department of Finance $6,160,157 6%
Department of Transport $3,880,426 4%
Department of Culture and the Arts $2,892,290 3%
Western Australia Police $2,713,350 3%
Department of State Development $1,539,858 1%
Zoological Parks Authority $1,146,711 1%
South West Development Commission $309,235 42%
Economic Regulation Authority $136,381 19%
Department of the Premier and Cabinet $124,250 17%
Pilbara Development Commission $98,102 13%
Gascoyne Development Commission $54,955 7%
Main Roads Western Australia $11,000 1%
Department of the Premier and Cabinet $2,692,007 34%
Department of Finance $826,132 10%
Tourism Western Australia $818,539 10%
Department of Fisheries $775,460 10%
Department of Culture and the Arts $677,444 8%
Department of Agriculture and Food $481,313 6%
Main Roads Western Australia $275,430 3%
Department of Transport $196,433 2%
Department of Health $193,415 2%
Department of Regional Development and Lands
$165,573 2%
Professional Engineering Services $103,965,582
$733,923
$8,032,0808113
8112
8110
Economics
Statistics
Code Goods/Services Description
Total Expenditure For All Agencies $ Agency $ % Code Goods/Services
DescriptionTotal Expenditure For All Agencies $ Agency $ %

43 Who Buys What and How
Department of Health $20,065,751 97%
Forest Products Commission $206,893 1%
Gold Corporation $93,955 <1%
Challenger Institute of Technology $74,200 <1%
Department of Mines and Petroleum $65,753 <1%
West Coast Institute of Training $61,412 <1%
Corruption and Crime Commission $13,144 <1%
Botanic Gardens and Parks Authority $1,800 <1%
Department of Fire and Emergency Services $1,202 <1%
Department of State Development $1,907,287 37%
Landgate $998,947 20%
Department of Water $707,720 14%
Public Transport Authority $670,648 13%
Department of Regional Development and Lands
$309,854 6%
Department of Mines and Petroleum $283,113 6%
Western Australia Police $139,654 3%
Western Australian Planning Commission $85,251 2%
Metropolitan Cemeteries Board $9,161 <1%
Botanic Gardens and Parks Authority $3,080 <1%
Lotteries Commission of Western Australia (Lotterywest)
$13,264,507 24%
Tourism Western Australia $9,433,671 17%
Department of Housing $8,276,867 15%
Main Roads Western Australia $6,152,765 11%
Western Australian Electoral Commission $1,699,601 3%
Department of Culture and the Arts $1,339,964 2%
Public Transport Authority $1,247,341 2%
Department of Health $1,042,760 2%
Department of Mines and Petroleum $1,006,906 2%
Department of Regional Development and Lands
$876,972 2%
$20,584,110
$5,115,457
$54,719,6278210
8114
8115
Manufacturing Technologies
Earth Science Services
Advertising
Department of the Attorney General $7,089,762 90%
Western Australia Police $182,165 2%
Department for Child Protection and Family Support
$140,681 2%
Department of the Registrar - WA Industrial Relations Commission
$113,658 1%
Department of Health $88,610 1%
Department of Commerce $68,832 1%
Corruption and Crime Commission $51,700 1%
Department of Corrective Services $50,221 1%
Department of Fire and Emergency Services $24,686 <1%
West Coast Institute of Training $18,265 <1%
Department of Health $5,175,144 21%
Public Transport Authority $1,972,929 8%
Department of Education $1,674,599 7%
Western Australian Electoral Commission $1,565,782 6%
Department of Transport $1,120,803 5%
Department of the Attorney General $902,080 4%
Department of Environment and Conservation
$854,830 3%
Department of Commerce $736,126 3%
Western Australia Police $673,602 3%
Department of Agriculture and Food $562,914 2%
Landgate $1,640,738 54%
Western Australia Police $591,211 19%
Department of Culture and the Arts $192,690 6%
Department of Mines and Petroleum $155,906 5%
Tourism Western Australia $88,185 3%
Department of Fisheries $85,843 3%
Western Australian Planning Commission $49,970 2%
Department of Health $46,547 2%
Department of Regional Development and Lands
$37,971 1%
Department of Fire and Emergency Services $31,278 1%
Photographic Services
Reproduction Services
$7,871,082
$24,832,197
$3,061,2608213
8212
8211 Writing and Translations
Code Goods/Services Description
Total Expenditure For All Agencies $ Agency $ % Code Goods/Services
DescriptionTotal Expenditure For All Agencies $ Agency $ %

44 Who Buys What and How
Tourism Western Australia $1,522,044 41%
Department of the Attorney General $585,696 16%
Department of Agriculture and Food $232,638 6%
Department of Culture and the Arts $210,033 6%
Department of Regional Development and Lands
$206,484 6%
Botanic Gardens and Parks Authority $160,000 4%
Department of Transport $114,011 3%
Western Australian Planning Commission $83,908 2%
Department of Indigenous Affairs $74,797 2%
Department for Communities $71,476 2%
Department of Culture and the Arts $858,376 50%
Western Australian Sports Centre Trust $595,320 35%
Botanic Gardens and Parks Authority $113,197 7%
Zoological Parks Authority $66,848 4%
Western Australian Planning Commission $36,645 2%
Department of Finance $36,296 2%
Department of the Premier and Cabinet $6,900 <1%
Department of Mines and Petroleum $2,276 <1%
Department of Local Government $1,509 <1%
Department of Fisheries $1,375 <1%
Department of Mines and Petroleum $191,310 50%
Department of State Development $62,620 16%
Public Transport Authority $41,775 11%
Department of Health $23,076 6%
Disability Services Commission $19,882 5%
Corruption and Crime Commission $18,845 5%
Western Australian Electoral Commission $12,633 3%
Zoological Parks Authority $9,857 3%
West Coast Institute of Training $1,454 <1%
Polytechnic West $1,055 <1%
Professional Artists and Performers
Graphic Design
Information Services
$3,678,798
$1,719,799
$383,789
8214
8312
8215
Department of the Attorney General $2,238,731 55%
Department of Housing $1,152,849 28%
Department of Health $478,561 12%
Department of Education $72,560 2%
Polytechnic West $27,738 1%
Central Institute of Technology $24,427 1%
Challenger Institute of Technology $13,014 <1%
C.Y. O'Connor Institute $8,536 <1%
Western Australian Planning Commission $7,603 <1%
South West Institute of Technology $7,567 <1%
Department of Health $8,817,688 16%
Department of Education $8,000,245 14%
Office of the Auditor General $4,429,605 8%
Department of Agriculture and Food $3,230,253 6%
Main Roads Western Australia $2,908,364 5%
Department of Treasury $2,331,226 4%
Department of Transport $1,867,502 3%
Department of Finance $1,855,994 3%
Department of Commerce $1,579,169 3%
Department of Fisheries $1,382,695 2%
Department of the Attorney General $18,649,180 53%
Department of Transport $9,165,555 26%
Landgate $4,168,349 12%
Gold Corporation $1,231,670 4%
Public Transport Authority $386,490 1%
Department of Culture and the Arts $200,403 1%
Department of Finance $191,656 1%
School Curriculum and Standards Authority $128,966 <1%
Lotteries Commission of Western Australia (Lotterywest)
$128,140 <1%
Department of Commerce $103,937 <1%
Development Finance $4,056,719
$55,460,562
$35,006,218
Accounting and Auditing
8412
8411
8410
Banking and Investment
Code Goods/Services Description
Total Expenditure For All Agencies $ Agency $ %Code Goods/Services
DescriptionTotal Expenditure For All Agencies $ Agency $ %

45 Who Buys What and How
Department of Corrective Services $26,912,671 22%
Department of Education $22,283,751 18%
Department of Housing $14,997,967 12%
Department of Fire and Emergency Services $12,510,553 10%
Public Transport Authority $5,101,825 4%
Department for Child Protection and Family Support
$3,861,580 3%
Department of Environment and Conservation
$3,638,196 3%
Department of the Attorney General $3,534,582 3%
Western Australia Police $3,251,696 3%
Department of Culture and the Arts $2,941,660 2%
Department of Finance $157,749 69%
Gold Corporation $63,792 28%
Department of Corrective Services $23,134 10%
Landgate $4,560 2%
Department of Transport $2,134 1%
Lotteries Commission of Western Australia (Lotterywest)
$1,322 1%
Economic Regulation Authority $710 <1%
Department of the Registrar - WA Industrial Relations Commission
$415 <1%
Kimberley Development Commission $242 <1%
Pilbara Development Commission $77 <1%
9310 Political Systems and
Institutions $6,790 Western Australian Electoral Commission $6,790 100%
Department for Communities $117,682 90%
Lotteries Commission of Western Australia (Lotterywest)
$13,696 10%
Disability Services Commission $590,909 56%
Department of Housing $176,678 17%
Department for Child Protection and Family Support
$166,057 16%
Drug and Alcohol Office $112,871 11%
$123,827,571
$227,336
$131,378
$1,046,516
8413
9312
8414
9313
Insurance and Retirement Services
Credit Agencies
International Relations
Humanitarian Aid and Relief
Department for Child Protection and Family Support
$232,486,909 78%
Department of Corrective Services $25,056,747 8%
Department of Housing $14,844,513 5%
Department of Education $10,924,576 4%
Department of Health $3,754,486 1%
Department of Indigenous Affairs $3,340,450 1%
Western Australian Planning Commission $2,251,474 1%
Department of Training and Workforce Development
$1,069,182 <1%
Metropolitan Cemeteries Board $643,280 <1%
Department of Commerce $595,634 <1%
Department of Training and Workforce Development
$617,469,314 32%
Disability Services Commission $497,695,966 26%
Main Roads Western Australia $229,815,349 12%
Department of Fire and Emergency Services $139,543,549 7%
Department of Regional Development and Lands
$131,257,750 7%
Department for Communities $76,436,242 4%
Department of Health $52,042,002 3%
Department of Commerce $42,850,922 2%
Department of Culture and the Arts $37,094,118 2%
Healthway $18,308,995 1%
Department of the Attorney General $5,038,216 50%
Department of Corrective Services $2,340,967 23%
Western Australian Planning Commission $656,080 6%
Department of Water $539,897 5%
Department of Education $274,753 3%
Department of Mines and Petroleum $164,690 2%
Department of Culture and the Arts $149,935 1%
Department of Fire and Emergency Services $122,414 1%
Department of Regional Development and Lands
$110,881 1%
Polytechnic West $76,183 1%
Public Administration and Finance Services
Taxation
$297,938,810
$1,932,227,080
$10,115,609
9315
9314
9316
Community and Social Services
Code Goods/Services Description
Total Expenditure For All Agencies $ Agency $ %Code Goods/Services
DescriptionTotal Expenditure For All Agencies $ Agency $ %

46 Who Buys What and How
Department for Child Protection and Family Support
$7,039,656 49%
Public Transport Authority $1,494,272 10%
Department of Health $854,926 6%
Department of Training and Workforce Development
$756,226 5%
Landgate $480,350 3%
Lotteries Commission of Western Australia (Lotterywest)
$416,702 3%
Polytechnic West $368,868 3%
Department of Mines and Petroleum $357,759 2%
Department of Corrective Services $274,254 2%
GESB $253,313 2%
9410 $14,422,118
Work Related Organizations
R Recreational, Catering, Food & HospitalityCode Goods/Services
DescriptionTotal Expenditure For All Agencies $ Agency $ %
Department of Health $1,614,849 62%
Department of Corrective Services $738,242 28%
Polytechnic West $70,318 3%
Department of the Attorney General $26,223 1%
Department of Treasury $21,286 1%
Department of Finance $20,510 1%
Challenger Institute of Technology $20,435 1%
Department of the Premier and Cabinet $19,760 1%
Disability Services Commission $11,523 <1%
Department of Transport $11,399 <1%
4812 Gambling or Wagering
Equipment $33,107Lotteries Commission of Western Australia (Lotterywest) $33,107 100%
Department of Commerce $518,505 47%
Department of Training and Workforce Development
$117,941 11%
Department of Agriculture and Food $117,867 11%
Zoological Parks Authority $71,227 6%
Department of Fire and Emergency Services $65,933 6%
Department for Communities $32,036 3%
Western Australia Police $25,443 2%
Challenger Institute of Technology $17,027 2%
Small Business Development Corporation $17,010 2%
Department of Finance $16,818 2%
4912
Camping and Outdoor Equipment and Accessories
$764 Disability Services Commission $764 100%
4914 Watersports Equipment $83,413 Western Australia Police $83,413 100%
Western Australia Police $345,795 84%
Department of Fire and Emergency Services $63,513 15%
Disability Services Commission $4,240 1%
Fitness Equipment
Collectibles and Awards
Institutional Food Services Equipment $2,601,192
$1,104,657
$413,549
4810
4920
4910
Code Goods/Services Description
Total Expenditure For All Agencies $ Agency $ %

47 Who Buys What and How
Department of Health $3,965 84%
Disability Services Commission $743 16%
Polytechnic West $114,958 40%
Challenger Institute of Technology $107,729 37%
Great Southern Institute of Technology $21,195 7%
South West Institute of Technology $12,705 4%
Durack Institute of Technology $11,502 4%
Department of Indigenous Affairs $7,708 3%
Department of Fisheries $7,447 3%
Goldfields Institute of technology $3,860 1%
Western Australian Planning Commission $1,961 1%
Department of Agriculture and Food $805 <1%
Polytechnic West $347,830 51%
Challenger Institute of Technology $224,644 33%
Great Southern Institute of Technology $42,312 6%
Durack Institute of Technology $24,688 4%
Goldfields Institute of technology $22,465 3%
South West Institute of Technology $9,940 1%
Disability Services Commission $8,931 1%
Department of Fisheries $640 <1%
Great Southern Institute of Technology $14,887 95%
Department of Fisheries $725 5%
Disability Services Commission $54 <1%
Meat and Poultry Products
Fruits and Vegetables and Nuts and Seeds
Seafood
$4,708
$290,054
$681,450
$15,665
4924
5011
5010
5012
Recreation and Playground and Swimming and Spa Equipment and Supplies
Polytechnic West $91,041 37%
Disability Services Commission $41,809 17%
Challenger Institute of Technology $23,078 9%
Department of Fisheries $20,325 8%
Great Southern Institute of Technology $18,814 8%
Department of Finance $16,350 7%
Office of the Auditor General $8,276 3%
Durack Institute of Technology $7,805 3%
South West Institute of Technology $6,290 3%
Department of Racing, Gaming and Liquor $3,515 1%
South West Institute of Technology $1,578 63%
Durack Institute of Technology $823 33%
Goldfields Institute of technology $70 3%
Challenger Institute of Technology $27 1%
Great Southern Institute of Technology $17,500 46%
Zoological Parks Authority $9,441 25%
Challenger Institute of Technology $7,429 19%
South West Institute of Technology $3,159 8%
Goldfields Institute of technology $439 1%
Polytechnic West $252 1%
Durack Institute of Technology $27 <1%
5017 Seasonings and
Preservatives $5,000 Great Southern Institute of Technology $5,000 100%
Polytechnic West $222,105 61%
Challenger Institute of Technology $76,180 21%
Great Southern Institute of Technology $31,000 9%
Durack Institute of Technology $17,089 5%
Department of Fisheries $5,808 2%
South West Institute of Technology $2,156 1%
Pilbara Development Commission $1,891 1%
Department of Finance $1,156 <1%
Department of Agriculture and Food $909 <1%
Department of Regional Development and Lands
$843 <1%
Chocolate and Sugars and Sweeteners and Confectionary Products
Bread and Bakery Products
$246,946
$2,498
$38,247
$361,7645018
5016
Dairy Products and Eggs5013
5015 Edible Oils and Fats
Code Goods/Services Description
Total Expenditure For All Agencies $ Agency $ %Code Goods/Services
DescriptionTotal Expenditure For All Agencies $ Agency $ %

48 Who Buys What and How
Department of Education $2,736,979 66%
Department for Child Protection and Family Support
$678,989 16%
Durack Institute of Technology $237,205 6%
Public Transport Authority $181,635 4%
Perth Market Authority (Market City) $146,522 4%
Challenger Institute of Technology $48,422 1%
C.Y. O'Connor Institute $40,715 1%
Department of Housing $32,870 1%
Great Southern Institute of Technology $17,000 <1%
West Coast Institute of Training $13,853 <1%
Western Australian Sports Centre Trust $627,883 64%
Polytechnic West $81,793 8%
Challenger Institute of Technology $64,199 7%
West Coast Institute of Training $53,114 5%
Great Southern Institute of Technology $43,620 4%
Perth Market Authority (Market City) $19,936 2%
South West Institute of Technology $19,307 2%
Metropolitan Cemeteries Board $19,014 2%
Durack Institute of Technology $14,733 1%
Corruption and Crime Commission $9,271 1%
5022 Cereal and Pulse
Products $13,000 Great Southern Institute of Technology $13,000 100%
Department of Culture and the Arts $3,422,574 78%
Department of Health $335,774 8%
Botanic Gardens and Parks Authority $211,974 5%
Central Institute of Technology $108,383 2%
Department of Fisheries $97,000 2%
Gold Corporation $78,246 2%
Rottnest Island Authority $33,593 1%
Department of Education $27,685 1%
Department of Indigenous Affairs $27,000 1%
Zoological Parks Authority $19,850 <1%
Arts and Crafts Equipment and Accessories and Supplies
$4,412,768
$4,136,811
$982,523Beverages
Prepared and Preserved Foods50
1960
1250
20
Department of Education $229,207 67%
Western Australia Police $110,625 33%
Zoological Parks Authority $337,455 100%
Disability Services Commission $367 <1%
Western Australia Police $2,514,060 18%
Department of Fire and Emergency Services $1,353,778 10%
Department of Education $1,295,133 9%
Department of Health $757,293 5%
Department of Agriculture and Food $551,909 4%
Department for Child Protection and Family Support
$546,830 4%
Disability Services Commission $495,350 4%
Department of Culture and the Arts $431,482 3%
Central Institute of Technology $415,058 3%
Department of Training and Workforce Development
$390,965 3%
Department of Health $17,525,631 46%
Department of Education $4,492,479 12%
Department of Agriculture and Food $2,734,304 7%
Western Australia Police $2,158,989 6%
Department of Housing $1,510,050 4%
Department of Fisheries $667,674 2%
Department of Transport $655,544 2%
Disability Services Commission $583,013 2%
Department of Training and Workforce Development
$580,445 2%
Central Institute of Technology $417,992 1%
9013 Performing Arts $50,613 Department for Communities $50,613 100%
Main Roads Western Australia $67,436 77%
Disability Services Commission $20,164 23%
Toys and Games
Musical Instruments and Parts and Accessories
Hotels and Lodging and Meeting Facilities
Commercial Sports
$339,832
$337,823
$14,129,436
$37,749,142
$87,600
Restaurants and Catering
9014
9011
9010
6014
6013
Code Goods/Services Description
Total Expenditure For All Agencies $ Agency $ % Code Goods/Services
DescriptionTotal Expenditure For All Agencies $ Agency $ %

49 Who Buys What and How
Department of Fire and Emergency Services $58,924 31%
Lotteries Commission of Western Australia (Lotterywest)
$58,778 30%
Public Transport Authority $29,810 15%
Perth Market Authority (Market City) $24,051 12%
Disability Services Commission $9,883 5%
Workcover Western Australia $7,883 4%
Gold Corporation $2,929 2%
Great Southern Institute of Technology $760 <1%
Entertainment Services $193,0189015
S StorageCode Goods/Services
DescriptionTotal Expenditure For All Agencies $ Agency $ %
Department of Health $2,063,529 94%
Forest Products Commission $87,432 4%
Disability Services Commission $27,986 1%
Great Southern Institute of Technology $6,101 <1%
Botanic Gardens and Parks Authority $2,234 <1%
Drug and Alcohol Office $211 <1%
Metropolitan Cemeteries Board $9,669 46%
Perth Market Authority (Market City) $8,704 41%
Landgate $2,795 13%
Disability Services Commission $18 <1%
2413 Industrial Refrigeration $1,727 Disability Services Commission $1,727 100%
Department of Health $2,136,675 88%
Western Australian Sports Centre Trust $68,415 3%
Western Australia Police $62,428 3%
Polytechnic West $37,981 2%
Department of Agriculture and Food $33,258 1%
West Coast Institute of Training $28,519 1%
Challenger Institute of Technology $26,061 1%
South West Institute of Technology $5,525 <1%
Durack Institute of Technology $4,633 <1%
Goldfields Institute of technology $3,072 <1%
Department of Health $548,029 79%
Gold Corporation $147,081 21%
Lotteries Commission of Western Australia (Lotterywest)
$488 <1%
Packing Supplies
Packaging Materials
Material Packing and Handling
Containers and Storage $2,187,493
$21,187
$2,417,209
$695,598
2412
2411
2414
7812
Code Goods/Services Description
Total Expenditure For All Agencies $ Agency $ %

50 Who Buys What and How
Department of Health $1,121,372 16%
Western Australia Police $827,767 12%
Department of Transport $715,496 10%
Department of the Attorney General $695,966 10%
Main Roads Western Australia $411,225 6%
Tourism Western Australia $332,704 5%
Department of Commerce $251,661 4%
Department of Corrective Services $249,638 4%
Department of Culture and the Arts $219,779 3%
Insurance Commission of Western Australia $211,878 3%
Storage $6,846,5907813
T Travel & TransportationCode Goods/Services
DescriptionTotal Expenditure For All Agencies $ Agency $ %
Western Australia Police $9,006,769 31%
Department of Health $5,994,585 20%
Public Transport Authority $3,411,397 12%
Department of Environment and Conservation
$2,286,559 8%
Department of Fire and Emergency Services $1,916,360 6%
Department of Corrective Services $1,603,690 5%
Department of Fisheries $1,510,249 5%
Department of Transport $779,353 3%
Department of Commerce $473,691 2%
Department of Agriculture and Food $247,525 1%
Department of Education $3,088,864 62%
Department of Health $1,605,948 32%
Department of Agriculture and Food $61,376 1%
Department of Fisheries $43,646 1%
Department of Training and Workforce Development
$40,245 1%
South West Development Commission $28,766 1%
Pilbara Development Commission $26,191 1%
Department of Commerce $25,760 1%
Gascoyne Development Commission $15,299 <1%
Kimberley Development Commission $13,296 <1%
Public Transport Authority $65,668,439 58%
Department of Fire and Emergency Services $33,255,921 29%
Department of Environment and Conservation
$3,289,282 3%
Department of the Attorney General $2,036,767 2%
Department of Fisheries $1,931,293 2%
Department of Housing $1,300,910 1%
Western Australia Police $1,200,632 1%
Department of Health $963,376 1%
Insurance Commission of Western Australia $664,571 1%
Pilbara Institute $543,574 <1%
Gaseous Fuels and Additives
Fuels $29,494,979
$5,006,382
$112,987,262Motor Vehicles2510
1511
1510
Code Goods/Services Description
Total Expenditure For All Agencies $ Agency $ %

51 Who Buys What and How
Western Australia Police $2,335,110 65%
Department of Transport $539,204 15%
Rottnest Island Authority $512,352 14%
Department of Environment and Conservation
$150,496 4%
Department of Fisheries $43,259 1%
Swan River Trust $11,775 <1%
Department of Water $134 <1%
Public Transport Authority $157,403,085 100%
Great Southern Institute of Technology $1,340 <1%
Department of Fire and Emergency Services $21,816,060 77%
Department of Environment and Conservation
$5,062,487 18%
Western Australia Police $1,313,919 5%
Western Australian Electoral Commission $121,342 <1%
2516 Non Motorized Cycles $588 Disability Services Commission $588 100%
Western Australia Police $7,693,236 49%
Public Transport Authority $7,629,355 48%
Gold Corporation $268,550 2%
Department of Health $117,646 1%
Landgate $35,177 <1%
Great Southern Institute of Technology $31,569 <1%
Pilbara Institute $6,719 <1%
Polytechnic West $840 <1%
Drug and Alcohol Office $715 <1%
Disability Services Commission $708 <1%
$3,592,331
$157,404,425
$28,313,808
$15,785,114Transportation Components and Systems
Aircraft
Marine Transport
Railway and Tramway Machinery and Equipment
2513
2512
2517
2511
Western Australia Police $305,914 76%
Department of Agriculture and Food $51,134 13%
Main Roads Western Australia $15,691 4%
Metropolitan Cemeteries Board $13,995 3%
Department of Transport $10,785 3%
Zoological Parks Authority $7,364 2%
Western Australian Sports Centre Trust $5,717 1%
Botanic Gardens and Parks Authority $3,118 1%
Western Australian Planning Commission $1,432 <1%
Department of Water $15 <1%
Western Australia Police $2,206,139 99%
Department of Fire and Emergency Services $12,184 1%
Great Southern Institute of Technology $748 <1%
Western Australia Police $19,399,582 25%
Department of Health $12,355,194 16%
Department of Education $11,486,353 15%
Gold Corporation $4,785,205 6%
Department of Transport $4,354,883 6%
Forest Products Commission $2,517,521 3%
Department of Corrective Services $2,455,525 3%
Department of Culture and the Arts $2,361,580 3%
Department of the Attorney General $1,838,227 2%
Western Australian Electoral Commission $1,312,889 2%
Mail and Cargo Transport
$405,181
$2,219,071
$76,269,872
Vehicle Bodies and Trailers
Transportation Services Equipment
7810
2519
2518
Code Goods/Services Description
Total Expenditure For All Agencies $ Agency $ %Code Goods/Services
DescriptionTotal Expenditure For All Agencies $ Agency $ %

52 Who Buys What and How
Public Transport Authority $402,149,894 65%
Department of Health $50,251,252 8%
Department of Transport $34,410,219 6%
Western Australia Police $20,444,940 3%
Department of Environment and Conservation
$15,852,333 3%
Department of the Premier and Cabinet $10,990,108 2%
Department of Corrective Services $9,505,050 2%
Department of Agriculture and Food $9,442,247 2%
Department for Child Protection and Family Support
$8,949,086 1%
Department of Education $8,732,558 1%
Department of Education $1,388,205 53%
Animal Resources Centre $520,461 20%
Department of Housing $491,874 19%
Gold Corporation $224,395 8%
Forest Products Commission $6,058 <1%
Disability Services Commission $5,406 <1%
Department for Communities $5,277 <1%
Durack Institute of Technology $2,473 <1%
Department of Transport $7,262,765 25%
Department of Fire and Emergency Services $5,736,379 20%
Western Australia Police $4,843,426 17%
Department of Health $2,483,843 9%
Department of Education $2,179,433 7%
Department of Corrective Services $1,928,710 7%
Department of Environment and Conservation
$1,273,070 4%
Department of Fisheries $994,337 3%
Challenger Institute of Technology $385,774 1%
Department of Training and Workforce Development
$213,786 1%
7814
7818
7811
$29,114,895
$617,465,903
$2,643,643
Passenger Transport
Transportation Repair or Maintenance Services
Transport Operations
Public Transport Authority $1,315,503 89%
Western Australia Police $118,581 8%
Disability Services Commission $27,470 2%
Workcover Western Australia $14,544 1%
Department for Communities $3,531 <1%
Landgate $2,788 <1%
Department of State Development $1,641 <1%
Health and Disability Services Complaints Office
$599 <1%
Challenger Institute of Technology $320 <1%
Department of Racing, Gaming and Liquor $235 <1%
Travel Facilitation $1,485,2939012
Code Goods/Services Description
Total Expenditure For All Agencies $ Agency $ % Code Goods/Services
DescriptionTotal Expenditure For All Agencies $ Agency $ %

53 Who Buys What and How
U UtilitiesCode Goods/Services
DescriptionTotal Expenditure For All Agencies $ Agency $ %
Public Transport Authority $25,727,425 77%
Gold Corporation $2,788,480 8%
Department of Housing $2,723,784 8%
Landgate $1,108,636 3%
Department of Health $840,404 3%
Department of Mines and Petroleum $47,845 <1%
Department of State Development $7,991 <1%
Department of Education $22,658,190 49%
Department of Health $11,908,133 26%
Department of Corrective Services $2,458,969 5%
Department of Housing $1,142,537 2%
Rottnest Island Authority $802,412 2%
Western Australia Police $597,040 1%
Department of Agriculture and Food $545,081 1%
Central Institute of Technology $501,683 1%
Department of Culture and the Arts $447,252 1%
Department of Environment and Conservation
$382,814 1%
Department of Health $7,677,332 61%
Department of Corrective Services $1,467,956 12%
Department of Culture and the Arts $996,295 8%
Rottnest Island Authority $434,530 3%
Metropolitan Cemeteries Board $190,971 2%
Gold Corporation $183,192 1%
Central Institute of Technology $174,091 1%
Animal Resources Centre $165,825 1%
Western Australia Police $151,110 1%
Disability Services Commission $135,552 1%
$33,244,565
$45,819,229
$12,588,642
Utilities - Unspecified
Water and Sewer Utilities
Oil and Gas Utilities
8310
0083
1016
8310
15
X To Be AssignedCode Goods/Services
DescriptionTotal Expenditure For All Agencies $ Agency $ %
Department of Corrective Services $11,487,769 58%
Department of Culture and the Arts $4,099,574 21%
Western Australian Sports Centre Trust $1,740,020 9%
Department of Fire and Emergency Services $1,372,108 7%
Western Australia Police $648,669 3%
Main Roads Western Australia $250,670 1%
Department of Treasury $106,722 1%
Department of Water $83,150 <1%
Perth Market Authority (Market City) $46,283 <1%
Department of Health $33,298 <1%
Department of Environment and Conservation
$363,852 22%
Western Australian Sports Centre Trust $162,595 10%
Department of Culture and the Arts $156,137 10%
Department of Local Government $139,413 9%
Polytechnic West $102,316 6%
Great Southern Institute of Technology $85,938 5%
Department of Transport $85,516 5%
Pilbara Institute $78,888 5%
Challenger Institute of Technology $63,160 4%
Botanic Gardens and Parks Authority $53,606 3%
Department of Racing, Gaming and Liquor $118,083 49%
Public Transport Authority $94,394 39%
Parliamentary Commissioner for Administrative Investigations
$15,407 6%
South West Development Commission $4,859 2%
Department of Finance $4,353 2%
Public Sector Commission $3,112 1%
Mid West Development Commission $628 <1%00
09 Warranties $50 Disability Services Commission $50 100%
0008
0006
0005 Other Equipment $19,806,065
$1,629,035
$240,220Other Intangibles
Licences

54 Who Buys What and How
Insurance Commission of Western Australia $82,944 28%
Tourism Western Australia $26,561 9%
Department of Culture and the Arts $24,504 8%
Department of State Development $22,939 8%
Rottnest Island Authority $22,674 8%
Department of Finance $17,799 6%
Department of Water $14,049 5%
Botanic Gardens and Parks Authority $12,954 4%
Department of Mines and Petroleum $12,161 4%
Economic Regulation Authority $10,346 4%
Public Transport Authority $7,942,063 99%
Department of Regional Development and Lands
$80,625 1%
Department of Health $372,960 89%
Perth Market Authority (Market City) $45,518 11%
Drug and Alcohol Office $184 <1%
0017 Works-In-Progress -
Inventories $4,025,482 Department of Water $4,025,482 100%
Western Australian Sports Centre Trust $163,228 95%
Small Business Development Corporation $7,942 5%
0022 Unspecified Assets $1,188,993 Western Australian Planning Commission $1,188,993 100%
Department of Culture and the Arts $3,083,964 42%
Public Transport Authority $1,113,069 15%
Western Australian Sports Centre Trust $608,200 8%
Department of Regional Development and Lands
$565,508 8%
Department of Fisheries $524,348 7%
Forest Products Commission $518,381 7%
Department of Fire and Emergency Services $297,347 4%
Department of Finance $154,256 2%
Department of Transport $106,006 1%
Public Sector Commission $86,572 1%
0024
0018
0011
0016
0013 Compensation Payments -
Legislative Act
Consumable Stores - Inventories
Finished Goods - Inventories
$418,662
$171,170
$7,323,488
$292,291
$8,022,688
Staff Amenities
Goods - Other
Department of Health $17,038,697 53%
Department of Finance $4,508,319 14%
Department of Agriculture and Food $4,167,325 13%
Department of Environment and Conservation
$1,939,789 6%
Department of Training and Workforce Development
$1,432,052 4%
Department of Housing $1,001,277 3%
Department of the Attorney General $609,132 2%
Rural Business Development Corporation $608,848 2%
Department of Treasury $258,589 1%
Rottnest Island Authority $187,185 1%
Tourism Western Australia $9,108,334 27%
Public Transport Authority $6,640,863 20%
Department of Fisheries $3,887,191 12%
Department of Water $3,660,288 11%
Western Australian Sports Centre Trust $3,499,873 10%
Public Sector Commission $1,684,682 5%
Department of Culture and the Arts $1,232,170 4%
Department of Corrective Services $1,176,780 4%
Department of Finance $809,669 2%
Department of Treasury $474,999 1%
Department of Housing $5,058,287 33%
Department of Health $3,137,603 20%
Department of Culture and the Arts $1,855,769 12%
Public Sector Commission $1,674,191 11%
Department of Finance $1,274,555 8%
Department of Fisheries $503,438 3%
Department of Fire and Emergency Services $411,740 3%
Forest Products Commission $410,084 3%
Department of Corrective Services $194,493 1%
Department of Treasury $183,860 1%
Services - Other
Other Supplies and Services $32,242,833
$33,514,801
$15,383,111Staff Expenses - Other
0025
0003
0026
Code Goods/Services Description
Total Expenditure For All Agencies $ Agency $ % Code Goods/Services
DescriptionTotal Expenditure For All Agencies $ Agency $ %

55 Who Buys What and How
Main Roads Western Australia $1,032,066 28%
Western Australian Sports Centre Trust $477,153 13%
Department of Agriculture and Food $416,374 11%
Department of Water $413,706 11%
Department of Culture and the Arts $358,190 10%
Department of Transport $292,375 8%
Rottnest Island Authority $271,560 7%
Western Australian Planning Commission $236,047 6%
Forest Products Commission $58,058 2%
Tourism Western Australia $32,467 1%
$3,731,370Repairs and Maintenance - Other 00
37Code Goods/Services
DescriptionTotal Expenditure For All Agencies $ Agency $ %