Embed Size (px)
Citation preview

Who benefits from the rapidly increasing Voluntary
Sustainability Standards? Evidence from Fairtrade
and Organic coffee in Ethiopia
By: Bart Minten, Mekdim Dereje, Ermias Engeda, and Seneshaw Tamru Ethiopian Strategic Support Program (IFPRI-EDRI)
Abstract
Voluntary Sustainability Standards (VSS) are rapidly increasing in global value chains. While
consumers (mostly in developed countries) are willing to pay significant premiums for such stand-
ards, it is however not well understood how effective these incentives are transmitted to producing
countries. We study VSS in Ethiopia’s coffee sector, its most important export commodity, using a
unique census of transaction data at the export level and large-scale data at the production level.
We find that transmission of the export quality premiums to coffee producers is limited, with only
one-third of this premium being passed on. Moreover, as quality premiums are small and with low
average production levels from coffee farmers in these settings, these premiums would only lead
to an increased income of 20 USD per year even with a perfect transmission scenario, and would
therefore have little effect on the livelihoods of an average coffee farmer.
WORKING PAPER XX

1. INTRODUCTION
There is a growing emphasis of international markets on VSS practices, seemingly a response to
enhanced global social and environmental pressure (Giovannucci et al., 2014; Swinnen, 2007;
Henson and Reardon, 2005). By guaranteeing the product origin, fair prices to producers, ethical
standards of production and processing, environmental sustainability, and safety and quality safe-
guards, international buyers and consumers are often willing to pay extra for a product. Con-
versely, adhering to those new requirements can be expensive with costs coming from several
sources. For example, VSS certified organizations are required to put in place environmental, la-
bor, and safety standards as well as putting documentation in place to monitor the process. This
documenting process might be costly to impose in situations devoid of any such practices. The
certifying organization’s charges can also be substantial (de Janvry et al., 2014). Therefore this
often raises questions about who actually benefits from the imposition of these standards and if
these VSS achieve their objectives (Haight, 2011).1
The coffee sector has led the field in applying different VSS (Potts et al., 2014). In this global
sector - one of the most important traded agricultural commodities in the world - it is estimated
that 18 percent of coffee production will be VSS certified in 2015, up from 4% in 2005 (Giovan-
nucci et al., 2014). This share is expected to reach significantly higher levels in the near future
(Pierrot et al., 2011; Giovannucci et al., 2014; Potts et al., 2014). 2 Despite the increasing global
demand for VSS and the large share of coffee producers that supply their products under these
schemes, there are relatively few studies that examine the impacts of these arrangements on coffee
producers or on the distribution of costs and benefits along the coffee supply chain. Most available
studies have focused on identifying the impacts on the producer level. The findings are mostly
mixed, with some exposing positive impacts (e.g. Ruben and Fort, 2012; Wollni and Zeller, 2007;
Weber, 2011; Barham and Weber, 2012; Dragusanu et al., 2014; Rueda and Lambin, 2012, 2013;
1 In the literature, there are opposing views on the impact of standards on smallholders in developing countries. On the one hand, certification has been found to be beneficial and smallholders are able to thrive under the imposition of more stringent standards (e.g. Minten et al., 2009; Kersting and Wollni, 2012; Wang et al., 2009; Kleeman et al., 2014). On the other hand, there are findings that the impact of standards is minimal or negative (Jena et al., 2014; Dragusanu & Nunn 2014). Reardon et al. (2009) even find that standards can lead to the exclusion of smallholders in these agricultural value chains, especially when firms have procurement options. 2 For example, the Sustainable Trade Initiative has an agreement with major roasters towards increasing global sustainable coffee sales to 25 percent in 2016. See http://www.idhsustainabletrade.com/koffie-news

Chiputwa et al., 2015) while others are more critical and find little effect (e.g. Jena et al., 2012;
Cramer et al., 2014; Haight, 2011; de Janvry et al., 2014; Dragusanu and Nunn, 2014; Stellmacher
and Grote, 2010; Valkila and Nygren, 2009; Beuchelt and Zeller, 2011). In Africa especially, there
are few studies on this, possibly because of the lower uptake of these VSS than in the rest of the
world (CTA, 2013).
We look at this issue in the case of the coffee sector of Ethiopia, its most important export product
which accounts for about a quarter of its foreign exchange earnings.3 More in particular, we ex-
amine at how the benefits of VSS - in particular Fairtrade/Organic - certification are distributed
between export and production levels. Our contribution to the literature is two-fold. First, this is
the first study that looks at the quality premiums paid for VSS at different levels in the value chain
in producing countries. Second, we use exceptionally rich datasets, i.e. census data of coffee trans-
actions over a nine-year period, coffee producer prices over an eight-year period, and a compre-
hensive representative survey of 1,600 coffee producers. The latter survey alone is much more
extensive than any other survey conducted on which most other studies have been based. This
provides confidence in our findings for Ethiopia, the biggest coffee producing country in Africa.
We find that there are statistically significant quality premiums attached to VSS certified coffee at
the export level, yet there are only small price premiums at the producer level, i.e. one-third of the
quality premium for exports. The gap in effective transmission is seemingly explained by signifi-
cant overhead and certification costs, and investments in communal services that might not directly
improve individual producer prices. Compliance costs at the cooperative and household level are
often also found to be high. Moreover, we find that even if the transmission of premiums were
more efficient, it would likely lead to little effects on the livelihood of poor farmers. If an average
Ethiopian coffee farmer, who annually sells the equivalent of 400 kilograms of red cherries, were
to market all his red cherries as VSS certified, he would increase his annual income by 144 Birr or
7.5 US dollar with the current transmission rates. Even in the case of a perfect transmission, an
average farmer would only increase his annual income by 20 US dollar. These premiums from
3 In Ethiopia, there are a number of studies that have examined issues of coffee certification. For those that looked at them, there are two major drawbacks. First, studies are qualitative (e.g. Stellmacher & Grote 2011) and fail to illustrate quantitative impacts. Second, when surveys were fielded, they were limited spatially or they were only focusing on one type of certification (e.g. Kodama 2009; Jena et al. 2012; and Cramer et al. 2014).

VSS certification are therefore likely to contribute little to improving the livelihoods of coffee
producers. These findings, therefore, raise doubts on some of the fundamental propositions of VSS.
The structure of the paper is as follows. First, we provide some background information on VSS
in the coffee sector. In Section 3, we describe the data used for this study. Section 4 presents a
conceptual framework and empirical methodology. In Section 5, we describe VSS certification
patterns in Ethiopia. Empirical results on the quality premiums and its transmission between dif-
ferent layers in the value chain are presented in Section 6. In Section 7, we test to what extent VSS
certification achieves its intended objectives. We then finish with a discussion of the findings and
with concluding remarks.
2. VOLUNTARY SUSTAINABILITY STANDARDS (VSS) IN COFFEE
Concerns for producers’ income combined with those for social injustice and environmental de-
struction have led to the start of a global movement for sustainability standards (Giovannucci et
al., 2014; Pierrot et al., 2011). The demand for VSS certification for coffee arguably took off glob-
ally in early part of the 2000s when the international price of coffee declined dramatically creating
hardship for many poor smallholder coffee producing households. In 2005, it was estimated that
4% of all green coffee was VSS certified. This has grown quickly since then and it is estimated
that this share has now reached almost 20% of global trade (Giovannucci et al., 2014). The main
sustainability standards in the coffee sector include Fairtrade, Organic, Rainforest Alliance, Utz
Capeh, and 4C Code of Conduct (Potts et al., 2014).
The Fairtrade movement has its origin in an initiative started in Netherlands in 1988 by a church-
based NGO in response to low coffee prices. This initiative led to the start of the Fairtrade Labeling
Organization (FLO) in 1997. The vision of the initiative was to ensure that producers would get
sufficient incomes by assuring minimum prices and price premiums and by guaranteeing social
standards. A second VSS, i.e. Organic, certification should ensure that a product has been produced
under organic standards. It emphasizes systems that promote and enhance agro-ecosystem health,
including biodiversity, biological cycles, and soil biological activity. To obtain Organic certifi-
cates, it is required that no inorganic outputs have been used on the farm for two years prior to

obtaining the crop of coffee. There is often double certification where Fairtrade and Organic cer-
tifications have been combined: Pierrot et al. (2011) estimate that this combination made up 42%
of global Fairtrade. Notably, these two VSS were the first to be implemented globally.4
A number of other, more recently developed certification schemes are now important globally, but
less so in Ethiopia. Utz capeh certification promotes better business practices and focuses on a
tracking system to ensure that coffee producers implement good agronomic practices which the
industry then rewards (Potts et al., 2014). More in particular, it incorporates Global Gap practices,
and social and environmental criteria. Rainforest Alliance certification aims to ensure sustainable
livelihoods by transforming land-use and business practices and consumer behavior (Potts et al.,
2014). Independent certification is required for these four major VSS, i.e. Fairtrade (by FLO),
Organic (by IFOAM), Rainforest Alliance (by RA) and Utz Capeh certified (by UTZ). The 4C
(“Common Code for Coffee Community”) Association aims to establish a code of conduct for
global coffee trade. In contrast with other VSS, this initiative relies on self-assessment and a three-
year verification cycle (Panhuysen and Pierrot, 2014). Two other VSS initiatives belong specifi-
cally to private companies who have their own standards. CAFÉ practices a green coffee sourcing
program developed by Starbucks in collaboration with Conservation International. Nespresso
AAA guidelines have a similar set-up.
Figure 2.1 shows at the global level the importance of the different types of VSS, indicating pro-
duction as well as sales estimates under each VSS in 2013. Although it is one of the most recent
initiatives in VSS in coffee trade, the 4C Association compliant coffee is by far the most important.
While Organic and Fairtrade were traditionally the most adopted VSS in the global coffee sector,
Rainforest Alliance and Utz Capeh Certified are growing much faster than Organic or Fairtrade as
the former provide arguably less challenging requirements in some areas and more business-
friendly approaches (Giovannucci et al., 2014). Figure 2.1 also shows that a significant portion of
coffee that is produced under VSS is not sold under that label. It was estimated in 2013 that 40%
4 It is to be noted that Fairtrade certification could initially only be granted to groups of smallholders organized in producer organiza-tions. While this was the initial condition, this is no longer true for all product types and Fairtrade can now be achieved by both small producer organizations and hired labor organizations.

of the global coffee production was produced under one of these VSS but only 15% was actually
sold using such labels (Panhuysen and Pierrot, 2014).
Figure 2.1—Prevalence of Voluntary Sustainability Standards in the coffee sector (2013)
Source: Panhuysen and Pierrot (2014)
VSS certification of coffee is a relatively new phenomenon in Ethiopia. At the turn of the last
decade only one certifier in the whole country was accredited to issue these certificates. Since
2006, the country has however attracted several international certifiers including for Fairtrade,
Organic, Utz, and Rainforest Alliance (Stellmacher and Grote, 2011). A number of cooperatives
and commercial farms have since obtained certification for their export coffee under different
schemes. It is estimated that only 18 cooperatives were Fairtrade certified in 2003 but in 2013, a
total of 111 cooperatives were certified to export their coffee under Fairtrade. Organic certification
is also widely implemented by these cooperatives. While there has been an increase in the last
decade, the adoption of VSS certificates in Ethiopia has been significantly below world averages
(Figure 2.2). It is estimated that VSS certified exported coffee from Ethiopia made up 2% in 2005,
compared to 5% in 2015.
0 500 1000 1500 2000 2500
Fairtrade
Organic
Rainforest Alliance
Utz certified
4C Association
CAFÉ practices
Nespresso AAA
1000 Metric Tons
Verified-certified sold Verified-certified produced but not sold

Figure 2.2— Evolution of Voluntary Sustainability Standards in the coffee sector, globally
and in Ethiopia
Source: Giovannucci et al. (2014) for world; Kodama (2009) and authors’ estimates for Ethiopia
3. DATA
To study voluntary sustainability standards, we rely on different unique large-scale datasets. It has
to be noted upfront that in all datasets, there is significant overlap of certifications, especially of
Fairtrade and Organic certification, and we are therefore unable to analyze the effects of each VSS
separately. First, a survey with 1,600 producers was fielded in February 2014. We focused on those
zones that produced most coffee in the country. The zones were stratified based on the coffee
variety produced, which is classified for export markets (Sidama, Jimma, Nekempte, Harar,
Yirgacheffe). Within each strata, woredas were ranked from the highest to the lowest producer.
Woredas were divided in two, the less productive woredas and the more productive ones (defined
by each one cultivating 50% of the area). Two woredas were randomly selected from each group,
and then a list of all the kebeles from the selected woredas was obtained. Two kebeles were ran-
domly chosen from two categories, i.e. the top and the bottom 50% producing kebeles. Finally, a
list of all households in the selected kebeles was made. They were ranked from small to large
coffee producers (based on areas cultivated in the year before the survey). We divided the produc-
ers into two groups, the less productive and the more productive ones (defined by each one culti-
0
2
4
6
8
10
12
14
16
18
20
2005 2010 2015
%
Ethiopia World

vating 50% of the area). A total of 20 coffee producers was then selected: 10 from the less produc-
tive and 10 from the highly productive ones. In total, 16 kebeles were included in the survey and
20 coffee producers from these selected kebeles. Thus, 320 producers were interviewed per stra-
tum.
Second, we collected prices offered to producers from primary cooperatives and private traders in
major producing areas. Price data were collected from 12 major coffee producing zones in the
country. In each zone, the 3 top producing woredas were selected and all primary cooperatives
were there visited. For each cooperative sampled, we attempted to find out if they had kept records
over the last 9 years and in what form these records were, i.e. receipts or a “record book”. In the
case where a transactions record book was maintained containing data on transaction prices, quan-
tities, and total amounts paid out, we photocopied the book in the nearest town and those data were
subsequently entered electronically in the computer. Using this survey method, we were able to
collect price information of 89 cooperatives, as well as 138 private traders. Moreover, a survey of
cooperative unions was conducted in July 2014, during which time information was recorded about
all certification types, the number of certified cooperatives, start-up dates of certification, quanti-
ties exported under these certificates, and the premiums obtained from these certificates.
Third, a database of coffee export transactions is maintained by the Ministry of Trade. This dataset
was obtained for the period July 2006 to June 2014. An important aspect in coffee exports is qual-
ity. Quality assessments for exports are conducted by the Coffee Liquoring Unit (CLU) to ensure
that the coffee meets export standards. A quality inspection sheet is prepared by this Unit and it is
attached to the lot to be exported.5 These quality indicators, as well as others (such as washing,
certification, and origin), are part of the coffee export transactions dataset.6 We also obtained a list
5 The analysis of coffee quality by the CLU is based on two measures, the raw and physical inspection, and the cup inspection. The raw and physical inspection contributes for 40 percent to the final quality grade, while the cup inspection contributes for 60 percent. However, moisture and screen analysis are the two requisites before grading any coffee. The moisture content should be less than 11.5 percent, while the size of the bean should be above screen size 14 for 85 percent of the bean sample. In the case of unwashed coffee, raw quality is determined based on defect count of the beans and on odor. In the case of washed coffee, the raw quality is based on an assessment of shape and make, color, and odor. Cup quality is assessed along four criteria, including cup cleanliness, acidity, body, and flavor. Each characteristic counts for 15 percent of the 60 percent of the cup quality value. The washed coffee export standards vary between grade 1 and 2, as well as under-grade (UG) while unwashed coffee is graded 3, 4, 5, or under-grade. Within the under-grade category, a further distinction is made for under-grade type ‘inferior, but exportable’ coffee, while the worst under-grade coffee is not exportable and is destined for domestic consumption. 6 It is not possible to completely control for quality in the specialty market using information from CLU grading. Specialty buyers usu-ally disregard CLU grades altogether and cup and grade the coffee themselves. These grades determine the (sometimes very high)

of private commercial coffee farms (with cultivated areas of 40 hectares and above) from its asso-
ciation. This information was integrated into the dataset as well.
4. CONCEPTUAL FRAMEWORK AND EMPIRICAL METHODOLOGY
To motivate our empirical analysis, we follow the theoretical model developed by Lancaster
(1966) and we consider a food product (or a group of food products) as a collection of character-
istics or attributes. In particular, a food product i can be described by a vector of attributes
0 1{ , ,... }N
i i i ix x x x with xi
k the level of attribute k in good i. Attributes are defined in such a way that
consumers derive positive utility from them: 0 1( , ,... )NU U x x x with / 0kU x . For reasons of
simplicity, we assume that U is measured in monetary equivalent. If two food products i and j
differing only in attribute k are offered in the market, their price difference will adjust to the point
where consumers are indifferent between the two:
0 0( ,..., ,... ) ( ,..., ,... )
( )
k N k N
i i i i j j j j
k k
i j i jk
U x x x p U x x x p
Up p x x
x
The price differential between the two food products can thus be regarded as the implicit price of
attribute k.7 We assume agricultural producers have identical production possibility frontiers G(x,
l) ≤ 0 where l is the vector of inputs required to produce a vector of attributes x. Positive values of
G correspond to inefficient input/output combinations.
The efficient allocation is obtained by solving a social planner problem of the form:
0
{ , }1
max ( ,..., )M
N
n nx l
n
U x x p l
subject to: 0
1( ,..., ; ,... ) 0N
MG x x l l
which yields first order conditions of the form:
prices paid but are not recorded in our dataset. However, the number of such purchases should be too low to influence the results found.
7If utility is additively separable, i.e., if
N
k
k 0
k
i iU x
, the formula holds exactly: ( )k k
i j k i jp p x x

0
0
k k
n
n
U G
x x
Gp
l
At the optimum, the price (p) of the (group of) food product(s) equals the Lagrange multiplier λ.
From equations (1) and (2), it follows that:
k k k
dp U Gp
dx x x
This implies that, in an efficient equilibrium, the price premium associated with attribute k is equal
to the marginal utility of that attribute (expressed in monetary equivalent) and equal to the marginal
cost of producing the attribute.
If we assume the marginal utility and the implicit price for each characteristic to be constant, a
hedonic price regression can be estimated where the food price is a function of the characteristics
of the product, which are determined by the choice of a particular variety, or by the specific post-
harvest technologies used. A simple model of the following form can then be estimated:
kXpN
0k
k
where p is the price of the product, Xk is the level of the attribute k, βk the implicit price of attribute
k, and ν a stochastic error term. We apply this general model to the issue that we like to study.
More in particular, we estimate the impact of VSS certification on price formation at different
levels in the value chain by the following estimation strategy:
jt
m
t
t
m
j
j
m
ijt
i
m
jt
m
jt XVSSp **** 43210
Where pmjt represents the coffee price of firm j at time t at level m in the value chain, VSSjt is a
binary variable equal to 1 in time t when the buyer has a VSS certificate and 0 otherwise, Xijt is a
vector of i variables that affect producer price levels such as quality, origin of the coffee, or quan-
tity sold. The αj are buyer fixed effects and ηt are monthly fixed effects. The parameter that we are

interested in is β1 which captures the effect of a VSS for the buyer. The assumptions for this spec-
ification to be valid is common trends among VSS and non-VSS buyers as well as conditional
independence between the price outcome variable and the VSS variable. This type of regression is
run at two levels in the value chain, the exporter as well as the primary cooperative level. For all
specifications of these regressions, robust standard errors were estimated.
5. PATTERNS OF VSS COFFEE CERTIFICATION IN ETHIOPIA
In this section, we look at a number of patterns in VSS certification in the coffee sector in Ethiopia.
We address three questions consecutively. First, how important is VSS certification in coffee ex-
port in Ethiopia and how is it changing over time? Second, what types of VSS certificates are in
vogue and where are they mostly implemented? Third, what are the characteristics of the coffee
that is exported under VSS certification?
Table 5.1 gives an overview of total exports of coffee from Ethiopia over the period 2007 until
2013. Despite large variability between years, coffee exports have been increasing over the period
considered, from 156,000 tons in 2007 to 172,000 tons in 2013. Coffee exports are mostly in the
hands of the private sector and while the share of cooperatives in exports is increasing, it is still
minor: they made up 6% of total exports in 2013, increasing from 5% in 2007. The share of VSS
certified coffee in total exports is relatively small. It varied from a low of 3.1% in 2008 to a high
of 5.3% in 2011 over the period considered. Most of the VSS certified coffee is exported by coop-
eratives and the majority of coffee that is exported by them is VSS certified: in the last 3 years,
VSS certified coffee varied between 72% and 75% of all exports by cooperatives. Some private
firms also export VSS certified coffee, almost all organically certified. However, their importance
is relatively small in the total exports of VSS certified coffee from Ethiopia, i.e. 12% in 2013.

Table 5.1— Certified coffee exports from Ethiopia, 2007 to 2013
Quantity coffee exports Certified coffee
Total By Share Total Share (%) By cooperatives By non-
coopera-
tives cooperatives in of total % of coop.'s cooperatives
year tons tons % tons exports tons exports tons
2007 156,157 7,541 4.8 6,352 4.1 5,708 75.7 644
2008 170,433 7,242 4.2 5,210 3.1 4,011 55.4 1,199
2009 111,035 7,690 6.9 4,541 4.1 4,277 55.6 264
2010 199,478 10,703 5.4 9,438 4.7 8,922 83.4 516
2011 160,523 10,302 6.4 8,475 5.3 7,552 73.3 923
2012 192,150 11,073 5.8 9,494 4.9 8,351 75.4 1,143
2013 172,247 10,460 6.1 8,482 4.9 7,487 71.6 995
Table 5.2 gives an overview of the different types of VSS certification that cooperatives adhere
to.8 About one-third of the primary coffee cooperatives - that are subsequently organized in coop-
erative unions - in Ethiopia have VSS certification. Organic certification is the dominant one, with
136 primary cooperatives accredited for it. They are spatially clustered as about half of the Organic
certified cooperatives are from the Sidama and Yirgachefe cooperative unions. 29% of all the cof-
fee primary cooperatives are organically certified. The next most important VSS certification in
Ethiopia is Fairtrade. There are 128 primary cooperatives that are accredited by FLO. The Oromia
and Sidama cooperative unions have the largest number of FLO certified cooperatives. They
jointly account for about two-third of FLO certified cooperatives in the country. The other two
types of certificates prevalent in Ethiopia, i.e. Rainforest Alliance and Utz Capeh, are not widely
adopted yet. Out of all the cooperatives, just 2% of cooperatives are certified with one or the other.
Double certification of Fairtrade and Organic is common in Ethiopia with 98 percent of Organic
certified cooperatives also having Fairtrade certification, and similiarly 80 percent of Fairtrade
certified cooperatives also having Organic certification. Moreover, cooperatives that are certified
for Utz capeh or Rainforest alliance are also Organic and Fairtrade double certified (for more dis-
cussion, see Hoebink et al., 2014). Notably, while the Oromia union is the largest in the country,
the number of certified primary cooperatives is lower than for Yirgacheffe and Sidama, possibly
due to poorer administration capacity at the primary cooperative levels and poorer quality coffee.
8 This information was obtained from the cooperative unions.

Table 5.2—Number of VSS certified primary cooperatives
Number of certified primary cooperatives
Number of Type of VSS
Cooperative primary Any VSS Organic Fairtrade
Rainfor-
est Utz
unions cooperatives
Certifi-
cate Alliance Capeh
Sidama 47 42 39 41 3 5
Yirgacheffe 26 26 26 26 3 2
Oromia 250 41 24 41 3 3
Limmu Inara 27 16 16 5 0 0
Wolaita
Damota 42 10 10 0 0 0
Kaffa 34 19 18 15 0 0
Bench Maji 39 3 3 0 0 0
Total 465 157 136 128 9 10
As described earlier, one challenge for VSS certification is quality. For VSS certifications that
guarantee a price floor and/or a fixed premium above the market price, it has been argued that
there might not be an incentive to ensure quality (de Janvry et al., 2014). To understand the links
of quality and different associated variables with VSS certification in Ethiopia, we present the
results of a probit regression where we regress VSS certification of the exported lot on a number
of associates (Table 5.3). We find a strong influence of origin on the likelihood of VSS certifica-
tion. Coffee from zones of origin other than the Sidama region is less likely to be certified. Coop-
eratives and private commercial farms are significantly more likely to export certified coffee, as
discussed above. From these findings, better quality coffee is also shown to be significantly more
likely to be exported under a VSS certification scheme.9 The coefficients of unwashed and under-
graded coffee are significant and negative, indicating that they are significantly less likely to be
exported as a VSS certified coffee. In contrast with other countries (de Janvry et al., 2014), it might
be that quality is easier to maintain for VSS certification in Ethiopia because of credible and man-
datory third-party quality assessments by the CLU and the Ethiopian Commodity Exchange
(ECX).
9 This does not have to be the result of the VSS schemes, which do not certify quality. It can be that certified cooperatives get better at making good coffee but it could also be the result of self-selection of the best cooperatives into VSS status, and the NGO pro-grams that support coops in a variety of ways related to quality and also help them gain certification.
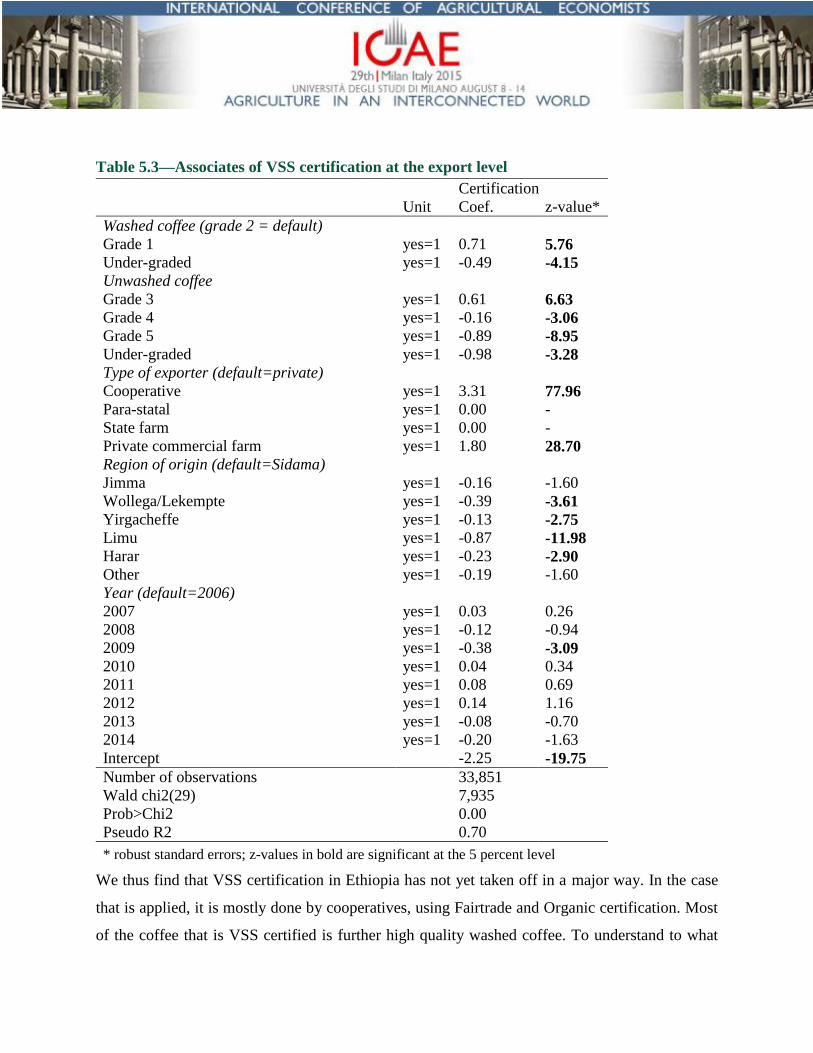
Table 5.3—Associates of VSS certification at the export level
Certification
Unit Coef. z-value*
Washed coffee (grade 2 = default)
Grade 1 yes=1 0.71 5.76
Under-graded yes=1 -0.49 -4.15
Unwashed coffee
Grade 3 yes=1 0.61 6.63
Grade 4 yes=1 -0.16 -3.06
Grade 5 yes=1 -0.89 -8.95
Under-graded yes=1 -0.98 -3.28
Type of exporter (default=private)
Cooperative yes=1 3.31 77.96
Para-statal yes=1 0.00 -
State farm yes=1 0.00 -
Private commercial farm yes=1 1.80 28.70
Region of origin (default=Sidama)
Jimma yes=1 -0.16 -1.60
Wollega/Lekempte yes=1 -0.39 -3.61
Yirgacheffe yes=1 -0.13 -2.75
Limu yes=1 -0.87 -11.98
Harar yes=1 -0.23 -2.90
Other yes=1 -0.19 -1.60
Year (default=2006)
2007 yes=1 0.03 0.26
2008 yes=1 -0.12 -0.94
2009 yes=1 -0.38 -3.09
2010 yes=1 0.04 0.34
2011 yes=1 0.08 0.69
2012 yes=1 0.14 1.16
2013 yes=1 -0.08 -0.70
2014 yes=1 -0.20 -1.63
Intercept -2.25 -19.75
Number of observations 33,851
Wald chi2(29) 7,935
Prob>Chi2 0.00
Pseudo R2 0.70
* robust standard errors; z-values in bold are significant at the 5 percent level
We thus find that VSS certification in Ethiopia has not yet taken off in a major way. In the case
that is applied, it is mostly done by cooperatives, using Fairtrade and Organic certification. Most
of the coffee that is VSS certified is further high quality washed coffee. To understand to what

extent prices and incentives matter for VSS certification at different levels in the value chain, we
look in the next section at quality premiums for VSS certification, at export and producer level.
6. QUALITY PREMIUMS FOR VSS CERTIFICATION
6.1. Export level
Simply using observed prices of each exported lot, expressed in US cents per lb., Figure 6.1 illus-
trates the size of the certification premium over the period 2006 to 2014. The density function of
VSS prices of certified coffee is distinctively to the right of non-certified coffee, indicating signif-
icant premiums at the export level. The average price difference amounts to 88 US cents per lb.,
statistically different when measured with a t-test (t=-78.61; Pr(|T|>|t|)=0.00). However, this sim-
ple price comparison masks other factors that might explain the VSS certification premiums. As
seen above, mostly better quality coffee is used for VSS certification and to get at the additional
value of certification on top of other variables, a multi-variate regression framework is required.
Figure 6.1— Export quality premiums for VSS certification of clean green coffee, 2006 to 2014
Source: Authors’ calculations based on data from the Ministry of Trade
Following the methodology outlined in Section 4, we regress export prices of clean green beans in
US cents per lb. on VSS certification, quantity exported, quality indicators, the origin of the coffee,
type of exporters, and monthly dummy variables (Table 6.1). In the first specification, we report
0
.00
2.0
04
.00
6.0
08
.01
Den
sity
0 200 400 600US cents/lb)
non-certified certified

the results of a pooled regression. The results show that coffee exported by cooperatives and pri-
vate commercial farms obtains higher export prices compared to coffee exported by private ex-
porters, even if we control for quality. In this case, certification raises the price of exports by 22
US cents per lb. When we control for exporter fixed effects (Specification 2), we find that certifi-
cation raises prices significantly by 15 US cents per lb. This represents, on average over the period
considered, 7% of the coffee export price. When we run the exporter fixed effect model for coop-
eratives only (the third specification), VSS certification shows a premium of 11 US cents per lb.,
ceteris paribus. We are specifically interested in the premiums applied in recent years. We there-
fore restrict the sample to the years 2013 and 2014. In those specifications, we find that VSS cer-
tification raises coffee prices by 11 and 14 US cents per lb. (as shown by the size of the coefficients
of the VSS certification dummy) in a specification where all exporters are included (Specification
4) or where the sample is restricted to cooperatives only (Specification 5) respectively. The evi-
dence therefore suggests that there are statistically significant but small premiums (of about 7%)
for VSS certification at the export level, slightly higher than those found in other studies for similar
periods (de Janvry et al., 2014).

Table 6.1—Determinants of coffee prices (US cents per lb.) at the export level, 2006 to 2014
Specification 1 Specification 2 Specification 3 Specification 4 Specification 5
Unit Coef. t-value* Coef. t-value* Coef. t-value* Coef. t-value* Coef. t-value*
VSS certificate yes=1 22.17 16.16 15.33 7.51 11.47 4.19 10.59 2.37 13.66 2.80
Quantity exported log() -4.99 -16.24 -4.07 -5.77 -5.79 -12.17 -4.67 -5.16 -7.11 -32.40
Washed coffee (grade 2 = default)
Grade 1 yes=1 53.30 23.13 44.66 7.25 36.31 3.35 40.51 8.30 37.87 5.00
Under-grade yes=1 -39.26 -39.58 -39.30 -10.94 -51.27 -2.81 -32.15 -5.89 -47.66 -2.81
Unwashed coffee
Grade 3 yes=1 28.94 11.50 21.12 3.25 2.50 0.22 36.86 4.32 -6.77 -0.65
Grade 4 yes=1 -44.84 -90.14 -43.01 -21.83 -32.61 -2.79 -39.67 -13.42 -55.22 -3.79
Grade 5 yes=1 -55.69 -59.17 -50.31 -14.34 -29.90 -3.27 -43.91 -9.34 -61.58 -6.25
Under-grade yes=1 -80.04 -68.71 -68.30 -17.16 -116.40 -3.74 -72.11 -12.16 -255.61 -17.43
Region of origin (default=Sidama)
Jimma yes=1 -6.01 -6.67 -7.36 -2.50 -29.78 -5.77 -5.50 -1.21 -34.34 -6.07
Wollega/Lekempte yes=1 -1.01 -1.24 -2.97 -1.15 -22.35 -4.87 2.05 0.65 -32.65 -3.77
Yirgacheffe yes=1 19.69 31.79 20.71 10.10 20.38 4.13 20.63 7.26 11.94 1.93
Limu yes=1 -11.69 -14.07 -11.30 -7.93 -12.53 -3.10 -5.98 -1.56 1.72 0.32
Harar yes=1 54.60 44.35 51.60 18.64 47.31 6.79 121.68 29.55 143.58 16.85
Other yes=1 -0.18 -0.15 -3.20 -0.59 -13.88 -0.89 0.06 0.01 116.67 12.98
Type of exporter (default=private trader)
Cooperative yes=1 34.26 26.61
Parastatal yes=1 -6.75 -10.25
State farm yes=1 -13.84 -14.01
Private commercial farm yes=1 5.70 4.87
Monthly dummies included yes yes yes yes yes
Exporter dummies included no yes yes yes yes
Intercept 276.39 68.08 223.45 22.61 221.56 37.80 251.64 27.66 308.965 62.48
Period 2006-2014 2006-2014 2006-2014 2013-2014 2013-2014
Type of exporters All All Only coops All Only coops
Number of observations 35,471 35,471 3,741 7,856 872
Number of groups 285 9 194 7
R-squared 0..83 0.79 0.84 0.66 0.53
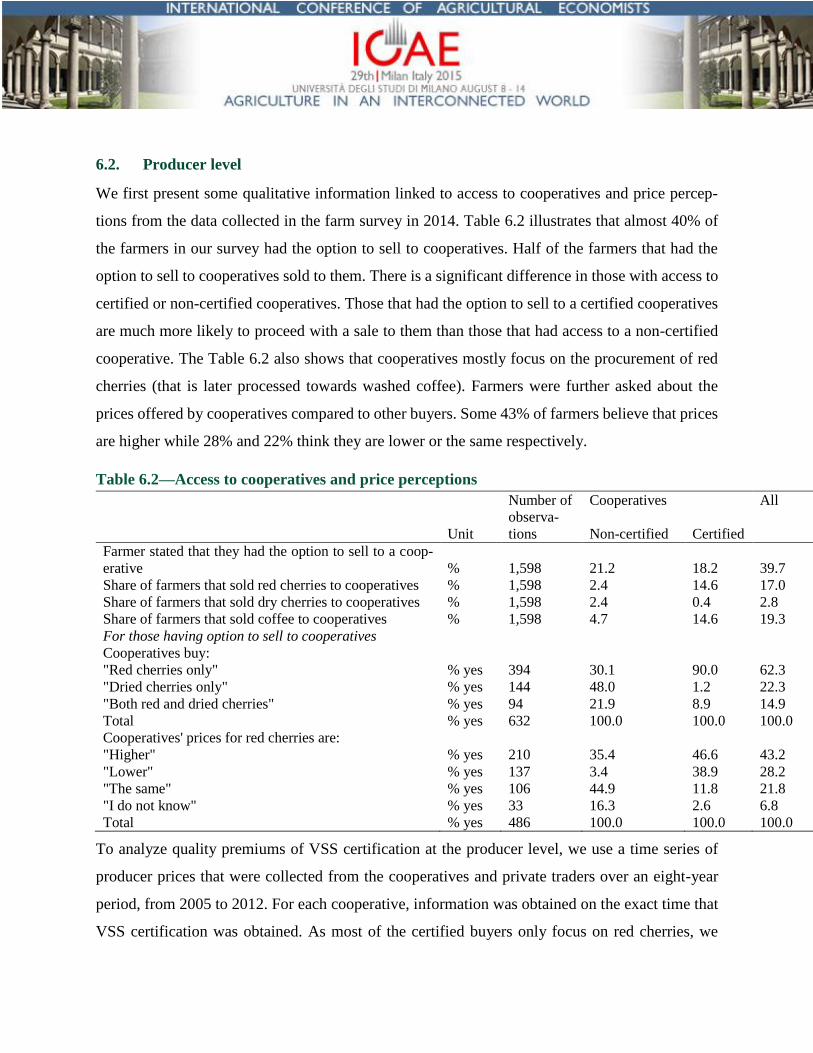
6.2. Producer level
We first present some qualitative information linked to access to cooperatives and price percep-
tions from the data collected in the farm survey in 2014. Table 6.2 illustrates that almost 40% of
the farmers in our survey had the option to sell to cooperatives. Half of the farmers that had the
option to sell to cooperatives sold to them. There is a significant difference in those with access to
certified or non-certified cooperatives. Those that had the option to sell to a certified cooperatives
are much more likely to proceed with a sale to them than those that had access to a non-certified
cooperative. The Table 6.2 also shows that cooperatives mostly focus on the procurement of red
cherries (that is later processed towards washed coffee). Farmers were further asked about the
prices offered by cooperatives compared to other buyers. Some 43% of farmers believe that prices
are higher while 28% and 22% think they are lower or the same respectively.
Table 6.2—Access to cooperatives and price perceptions
Number of Cooperatives All
Unit
observa-
tions Non-certified Certified
Farmer stated that they had the option to sell to a coop-
erative % 1,598 21.2 18.2 39.7
Share of farmers that sold red cherries to cooperatives % 1,598 2.4 14.6 17.0
Share of farmers that sold dry cherries to cooperatives % 1,598 2.4 0.4 2.8
Share of farmers that sold coffee to cooperatives % 1,598 4.7 14.6 19.3
For those having option to sell to cooperatives
Cooperatives buy:
"Red cherries only" % yes 394 30.1 90.0 62.3
"Dried cherries only" % yes 144 48.0 1.2 22.3
"Both red and dried cherries" % yes 94 21.9 8.9 14.9
Total % yes 632 100.0 100.0 100.0
Cooperatives' prices for red cherries are:
"Higher" % yes 210 35.4 46.6 43.2
"Lower" % yes 137 3.4 38.9 28.2
"The same" % yes 106 44.9 11.8 21.8
"I do not know" % yes 33 16.3 2.6 6.8
Total % yes 486 100.0 100.0 100.0
To analyze quality premiums of VSS certification at the producer level, we use a time series of
producer prices that were collected from the cooperatives and private traders over an eight-year
period, from 2005 to 2012. For each cooperative, information was obtained on the exact time that
VSS certification was obtained. As most of the certified buyers only focus on red cherries, we

mostly use prices of those cherries as our dependent variable, converted to US cents per lb. The
results of different specifications are presented in Table 6.3. We first run a pooled regression where
we regress the price of cherries on a VSS certification dummy, the bean form, type of buyer, an
origin variable, and monthly dummies. As expected given their lower conversion ratio to exporta-
ble clean green beans, red cherries get significantly lower prices per kg compared to dried cherries
and coffee beans. As found at the export level, we find significantly higher prices for producers in
Harar and Yirgacheffe compared to Sidama, and significantly lower ones for Jimma and Nekempt,
indicating that these origin premiums at the export level are transmitted to producers. In this spec-
ification, we find that certification raises producer prices by 0.94 US cents per lb. In a second
specification, we only focus on red cherries. In this case certification raises prices by 1.56 US cents
per lb. In a third specification, we include fixed effects for buyers. In this fixed effect model, we
find that VSS certificates do not raise the producer price. This result is robust to a specification
where we only include cooperatives (specification 4) and where we focus only on the most recent
period (Specification 5). This evidence therefore suggests that VSS certification did not lead to
higher producer prices over the period considered.

Table 6.3—Determinants prices of red cherries (in US cents per lb.) at the producer level, 2005 to 2013
Specification 1 Specification 2 Specification 3 Specification 4 Specification 5
Unit Coef. t-value* Coef. t-value* Coef. t-value* Coef. t-value* Coef. t-value*
VSS certificate yes=1 0.94 13.80 1.56 71.34 0.13 0.48 0.09 0.33 -0.26 -0.58
Type of bean (default=red cherries)
Dried cherries yes=1 21.75 59.78
Coffee beans yes=1 102.02 65.88
Type of seller (default=private)
Cooperative yes=1 -0.65 -5.38 -1.40 -31.03
Region of origin (default=Sidama)
Jimma yes=1 -0.92 -26.51 -0.93 -41.55
Wollega/Lekempte yes=1 -5.02 -25.34 -4.10 -32.38
Yirgacheffe yes=1 2.93 84.52 2.89 137.82
Limu yes=1 0.60 7.60 1.22 27.95
Harar yes=1 14.95 23.89 22.89 6.52
Monthly dummies included yes yes yes yes yes
Buyer dummies in-
cluded no no yes yes yes
Intercept 4.90 40.30 5.23 83.16 4.58 11.98 4.43 11.63 5.64 23.55
Period 2003-2012 2003-2012 2003-2012 2003-2012 2011-2012
Type of buyers All All All Coops only Coops only
Type of coffee All forms Red cherries Red cherries Red cherries Red cherries
Number of observations 148,558 113,536 113,536 107,736 23,637
Number of groups 227 66 63
R-squared 0.86 0.88 0.80 0.81 0.89
* robust standard errors; t-values in bold are significant at the 5 percent level

One issue with the estimation of premium transmission in the method above might be that coop-
eratives pay a quality premium only after they have secured a buyer for the lot and have been paid.
Some cooperatives also pay dividends. Analysis of prices at the time of transactions only might
therefore potentially underestimate the benefits of VSS certification. While that information was
not in the record books, questions were asked on the incidence and level of these two payments
during the farm survey of 2014 (Table 6.4). For those farmers that sold to cooperatives, 44% and
23% stated that they received “second payments” - an additional premium per kg sold - and divi-
dends respectively in the 12 months prior to the survey. Certified cooperatives are much more
likely to have paid out second payments and dividends to farmers. 55% of the farmers who sold to
certified cooperatives reported to have received a second payment and 27% of them received a
dividend. Overall, 66% of the farmers that sold to certified cooperatives received a payment after
the transaction. In the case that a second payment or a dividend was paid, a follow-up question
relating to the exact amount was asked. On average, the second payment was 0.9 Birr/kg, equiva-
lent to an extra 0.14 US cents per lb. We also recorded the amounts of dividends that were paid.
The median dividend paid out was 240 Birr per receiving household. These responses therefore
suggest that coffee incomes received from cooperatives have increased through second payments
or dividends, and more so for certified farmers. Table 6.3 further illustrates that, as perceived by
farmers, prices paid by cooperatives are not systematically higher than from other buyers and also
that late payments are common with cooperatives, especially so for certified ones.
Table 6.4—Cooperatives, dividends and second payments
Number of Cooperatives All
Unit
observa-
tions Non-certified Certified
If farmer sold to cooperative:
Share of red cherries sold to cooperatives % 272 80.6 92.0 90.4
Share of dried cherries sold to cooperatives % 44 77.7 85.0 78.6
Share of farmers that received a second payment % 307 8.1 55.4 44.0
If received, amount (mean) Birr/kg 135 1.05 0.89 0.89
If received, amount (median) Birr/kg 135 0.90 0.80 0.90
Share of farmers that received a dividend % 308 10.7 27.0 23.0
If received, amount (mean) Birr 62 1,697 294 475
If received, amount (median) Birr 62 885 217 240
Share of farmers that received a second payment or div-
idend % 307 13.5 66.1 53.4

To understand to what extent the second payments and dividends are raising producer prices paid
to certified producers compared to non-certified ones, we rely on the reported prices for every
coffee transaction at the household level during the year 2013. This information was collected
during the farm survey. We analyze three types of producer prices from these transactions, the
price that was paid immediately after the transaction, the price incorporating the second payment,
and the price incorporating all payments (where dividends were converted to benefits per kg sold).
Figure 6.2 shows the distribution of the second measure for red cherries by market outlet.10 The
graph illustrates that certified cooperatives offer higher prices than non-certified ones and that
cooperatives offer in general a higher price than other buyers. However, the graph also shows that
the differences in the density functions are rather small.11
Figure 6.2—Producer quality premiums (using combined prices of first and second payment)
for VSS certification of red cherries (2013)
Source: Authors’ calculations based on data from the coffee producer survey 2014
In the above graph, we do not control for other explanatory variables of price formation. Following
the model of Section 4, we therefore regress prices for red cherries on dummies reflecting the type
of buyer (including sales to a certified and non-certified cooperative), perceived quality of the red
cherries, place of sales, month of sales, and woreda dummies. As dependent variable, we use the
10 We focus on red cherries as VSS certification almost exclusively deals with these. 11 The average price differences of sales to certified cooperatives versus sales to non-cooperatives and non-certified cooperatives are 1.76 and 1.13 US cents per lb. respectively (both significant with a t-test, i.e. t=7.99 and t=2.96 respectively) while there is no significant difference between sales to non-certified cooperatives and those to non-cooperatives (difference of 0.63 US cents per lb. with a t-value of -1.26 and a Pr(|T|>|t|)=0.21.
0
.05
.1.1
5.2
.25
Den
sity
0 5 10 15Birr/kg)
cert. coop non-cert. coop
non-coop

price received at the time of the transaction and the measures that incorporate second payments
and dividends. We find that cooperatives offer significantly higher prices than other buyers, as
seen in the significant positive coefficients of sales to certified and non-certified cooperatives (Ta-
ble 6.5). We also find that certification raises the price of red cherries, on top of the cooperative
effect. However, the difference of prices offered by certified and non-certified cooperatives is not
significant (as measured through an F-test) in the first specification, i.e. in the case that the first
payment only is used. This confirms the results that were found in Table 6.3. On the other hand,
when the full price of red cherries is used as dependent variable, we do find a significant price
difference of certified cooperatives compared to non-certified ones, shown by the significant F-
test at the bottom of Table 6.5.

Table 6.5—Hedonic pricing regression red cherries producer level, in US cents per lb., har-
vest of 2013
Price 1 Price 2 Price 3
First payment
(=A) A + 2nd payment (=B) B + dividend
Unit Coef. t-value* Coef. t-value* Coef. t-value*
Type of buyer (default=non-coopera-
tive)
Bought by non-certified cooperative yes=1 1.10 2.80 1.38 3.42 1.47 3.60
Bought by certified cooperative yes=1 1.54 3.46 2.20 4.78 2.27 4.95
Quantity sold log() 0.00 0.00 0.13 1.54 0.18 2.00
Quality (default=mostly green)
Mixture of red/green yes=1 1.00 0.91 0.80 0.73 0.78 0.71
Mostly red yes=1 1.21 1.57 1.17 1.51 1.19 1.53
Only red yes=1 1.17 1.57 1.05 1.41 1.04 1.39
Place of sales (default=farmer-trader/collector in vil-
lage)
To agent of private mill/hull yes=1 0.39 1.14 0.35 1.06 0.35 1.07
To agent of cooperative yes=1 -0.37 -1.01 -0.26 -0.69 -0.10 -0.25
Agent/trader without a hull/mill yes=1 0.12 0.25 0.08 0.16 0.06 0.13
Site of private milller yes=1 -0.01 -0.03 -0.03 -0.07 -0.01 -0.03
Consumer yes=1 3.71 0.82 3.86 0.86 3.91 0.86
Other yes=1 1.30 3.15 1.21 2.93 1.06 2.58
Monthly dummies included yes yes yes
Woreda dummies included yes yes yes
Intercept 11.70 8.18 11.44 8.11 11.36 8.08
Number of observations 1,449 1,449 1,449
R-squared 0.51 0.49 0.49
F-test if prices offered by certified cooperatives F() Prob>F F() Prob>F F() Prob>F
are different from non-certified ones 1.45 0.23 4.42 0.04 4.11 0.04
* robust standard errors; t-values in bold are significant at the 5 percent level
The difference in price offered between certified and non-certified cooperatives amounts to 0.80
US cents per lb. of red cherries in the third specification. On average, six kg of Arabica red cherries
converts to 1 kg of clean green coffee beans (ITC, 2011) and prices of these two coffee forms can
therefore be compared when a conversion factor of 6 is used. This translates to a 4.6 US cents per
lb. green coffee equivalent price at the producer level and compares to premiums at the export

level of 13.7 US cents per lb. during the years 2013-2014 (Table 6.1).12 Using this method, we
therefore deduce a transmission of quality premiums to producers of 33%.
6.3. What explains the gap?
The evidence presented above suggests that we find a rather small transmission of quality premi-
ums at the export level when comparing prices that are paid to coffee producers. It appears that
two-thirds of the quality premium is not directly transmitted. This then begs the question about
where most of the quality premium paid for VSS certification at the export level goes. A number
of explanations can be forwarded.
First, the VSS are implemented by primary cooperatives, organized at the village level, which are
grouped in cooperative unions at zonal and regional levels.13 In the majority of the cases, primary
cooperatives do not interact with international buyers, instead the cooperative unions perform the
commercial transactions. To pay for the costs that the unions incur, an overhead charge of 30% of
the quality premium is withheld (in the case of Organic premiums, not for Fairtrade). The remain-
ing 70% of the quality premiums goes to the primary cooperatives. While the 30% allows for the
payment of certification costs in some of the cooperative unions, this is not the case for all coop-
eratives, and the 70% transmitted to primary cooperatives is required to cover for the certification
costs. These costs are usually substantial. De Janvry et al. (2014) estimate these costs to be up to
3 US cents per lb. Moreover, a rule is that 70% of the profits of the primary cooperatives are
transferred to farmers while the rest is kept for the functioning of the primary cooperative. In the
case that a primary cooperative incurs no expenses and the complete quality premium would be
considered profits, a maximum of 49% (70% of 70%) of the quality premium would in this case
be transmitted.14
Second, a common practice in Community-Driven Development projects (Binswanger-Mkhize et
al., 2009), is that it is up to the local community, in this case the primary cooperatives, to decide
how the extra budget they receive from the VSS certification quality premiums is used. It is usually
invested in communal assets, such as medical and educational facilities, that provide benefit to
12 Using an exchange rate of 19.2 Birr/USD at the end of 2013 when most of the sales of red cherries took place. 13 As seen in Table 2, there are 7 such unions in the country. 14 See http://www.oromiacoffeeunion.org/

coffee farmers in other ways than by higher prices. It is however also possible that the quality
premiums are being used for investments that may not directly benefit farmers, such as better fa-
cilities or more staff at the cooperative (Haight, 2011).
Third, our interviews highlighted that parts of the quality premiums were used by some of the
primary cooperatives to pay off debts. These incurred debts are sometimes high because of vola-
tility in international prices, especially in recent years, in situations where these cooperatives
bought cherries at relatively high prices and could only sell coffee beans at a low price later in the
year. Some cooperatives also invested in the purchase of wet mills by taking out loans.
It is also worth noting that there is frequent oversupply of certified products that cannot be sold
primarily because there are not enough buyers for VSS certified products (e.g. de Janvry et al.,
2014; Potts et al., 2014). At the global level, 40% of global production in 2012 was estimated to
have been produced in compliance with VSS standards, but only 15% of that quantity was sold
under that label (Potts et al., 2014). These supplies are then sold on conventional markets. In such
case, even though farmers are certified, coffee would not be sold at a higher price. However, in
recent years, the majority of the coffee that was sold to the cooperative unions in Ethiopia was sold
under a VSS certification.
7. DO VSS CERTIFICATES ACHIEVE THEIR SUSTAINABILITY OBJECTIVES?
In addition to economic sustainability (income) effects, VSS certificates are also designed to im-
prove environmental, labor, and social environments (Raynolds et al., 2007; Potts et al., 2014;
Arnould et al., 2009; Dragusanu et al., 2014). We look at the extent to which these objectives are
achieved by using data from the farm survey. To understand the incentives for sales to a coopera-
tive, farmers were requested to provide details on the reasons for selling to a specific buyer for
each coffee sales transaction that each farmer made. Farmers who sold to cooperatives stated that
being a member of the cooperative was the major reason for their choice, and not the price offered
(Table 7.1). We also enquired about what these farmers saw as the benefits of having access to
cooperatives in the community, dividing the results based on certified and non-certified ones (Ta-
ble 7.1). The results indicate that most farmers do not believe that cooperatives offer higher prices

but they state that there are other advantages linked to advice and location, as well as payments of
dividends. No significant difference is noted between certified and non-certified cooperatives

Table 7.1—Stated benefits by farmers of accessing certified and non-certified cooperatives
Number of Non- Cooperatives All
Unit observ. coops. Non-certified Certified
Major reasons why farmer chose this buyer in 2013 red cherries' sales transaction:
"He gives higher price" % yes 282 22.3 42.9 11.6 19.5
"He accepts large quantities" % yes 5 0.4 0.0 0.4 0.4
"He accepts small quantities" % yes 30 3.3 0.0 0.6 2.1
"He gives advances when needed or lends money" % yes 32 3.7 0.0 0.4 2.2
"He pays immediately" % yes 104 12.2 1.2 0.7 7.2
"He is close by" % yes 228 25.5 11.9 1.8 15.7
"There is no real difference with other buyers" % yes 185 22.1 2.4 0.6 12.8
"There is only a single buyer" % yes 12 1.4 0.0 0.2 0.8
"I trust his weighing" % yes 23 2.0 4.8 0.6 1.6
"The buyer is a relative" % yes 20 2.5 0.0 0.0 1.4
"He buys at the farm gate" % yes 25 3.1 0.0 0.0 1.7
"Buyer has the needed inputs" % yes 1 0.1 0.0 0.0 0.1
"Because of advantages of being a member" % yes 498 1.2 35.7 83.3 34.4
"Other" % yes 4 0.4 1.2 0.0 0.3
Total % yes 1449 100.0 100.0 100.0 100.0
For those having option to sell to cooperatives
Main advantages of selling to a cooperative:
"They provide higher prices" % yes 627 49.5 52.1 50.9
"They provide credit" % yes 623 25.8 14.4 19.6
"They provide advice" % yes 626 44.8 60.9 53.5
"They provide inputs" % yes 627 41.5 10.6 24.7
"They pay immediately" % yes 626 58.0 22.4 38.7
"They are close by" % yes 627 55.1 58.5 56.9
"They do not cheat with weights" % yes 619 67.7 55.6 61.1
"They pay dividends/second payments later" % yes 617 42.2 80.3 63.2
We rely on regressions and matching techniques to assess the influence of certification on indica-
tors other than on prices. To first understand some of the characteristics associated with the type
of farmers who participate in selling certified coffee, we run a probit of certified versus non-certi-
fied farmers (Table 7.2). We include on the right-hand side of the regression measures of house-
hold characteristics (size of household, gender of the head of household, education levels), farm
characteristics (land owned, coffee land cultivated), and distance to facilities. The results show
that VSS certified households are located closer to paved roads and closer to coffee cooperatives.
They also show that the head of the households is older and is also more likely to have been in
school.
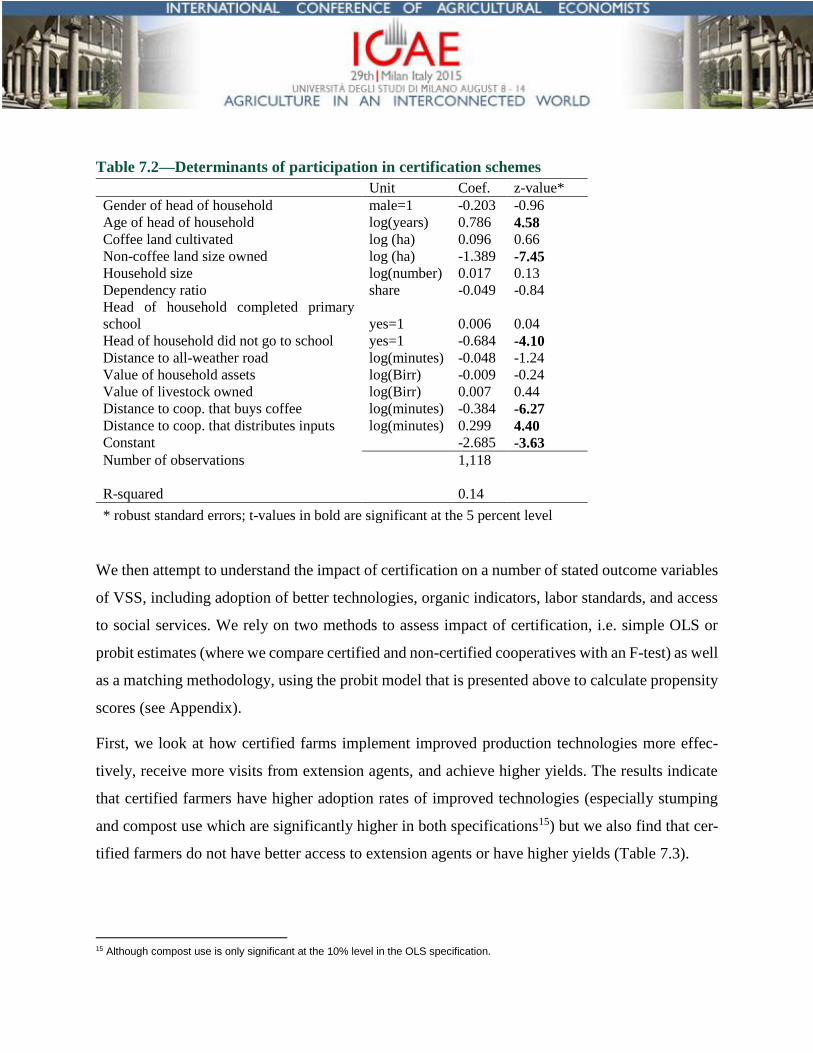
Table 7.2—Determinants of participation in certification schemes
Unit Coef. z-value*
Gender of head of household male=1 -0.203 -0.96
Age of head of household log(years) 0.786 4.58
Coffee land cultivated log (ha) 0.096 0.66
Non-coffee land size owned log (ha) -1.389 -7.45
Household size log(number) 0.017 0.13
Dependency ratio share -0.049 -0.84
Head of household completed primary
school yes=1 0.006 0.04
Head of household did not go to school yes=1 -0.684 -4.10
Distance to all-weather road log(minutes) -0.048 -1.24
Value of household assets log(Birr) -0.009 -0.24
Value of livestock owned log(Birr) 0.007 0.44
Distance to coop. that buys coffee log(minutes) -0.384 -6.27
Distance to coop. that distributes inputs log(minutes) 0.299 4.40
Constant -2.685 -3.63
Number of observations 1,118
R-squared
0.14
* robust standard errors; t-values in bold are significant at the 5 percent level
We then attempt to understand the impact of certification on a number of stated outcome variables
of VSS, including adoption of better technologies, organic indicators, labor standards, and access
to social services. We rely on two methods to assess impact of certification, i.e. simple OLS or
probit estimates (where we compare certified and non-certified cooperatives with an F-test) as well
as a matching methodology, using the probit model that is presented above to calculate propensity
scores (see Appendix).
First, we look at how certified farms implement improved production technologies more effec-
tively, receive more visits from extension agents, and achieve higher yields. The results indicate
that certified farmers have higher adoption rates of improved technologies (especially stumping
and compost use which are significantly higher in both specifications15) but we also find that cer-
tified farmers do not have better access to extension agents or have higher yields (Table 7.3).
15 Although compost use is only significant at the 10% level in the OLS specification.

The second series of indicators look at the use of chemical fertilizer, pesticides, and herbicides.
The use of these chemicals for coffee production is extremely small in Ethiopia and most of the
coffee production is organic, even though the farmers are not actually certified for Organic coffee.
We see that only 6% and 2% of the coffee farmers use chemical fertilizers and other agro-chemi-
cals respectively. The low level of use of inorganic chemicals might therefore explain why - except
for the matching exercise for chemical fertilizer use - we do not find any significant results of the
impact of certification in any of the regressions or the matching exercises that were conducted.
Third, farmers were asked to indicate details on the extent that children (defined as those who were
younger than 16 years of age) participated in different coffee production activities. Questions were
asked on the use of child wage labor as well. A low 1.5% of the households report to use child
wage labor in coffee production activities and no significant difference between certified and non-
certified households was found. 30% of the coffee farms in our sample reported to use children in
coffee production activities and the share of child labor in total labor time during the coffee pro-
duction process is 6%. We find that there is no significant impact of VSS certification on the
likelihood of using children in any of the two specifications (Table 7.2). On the other hand, we
find that the share of children in total labor is lower on certified coffee farms in both matching
exercises.
Fourth, as a number of the VSS certified cooperatives reported investments that were used towards
better social services, including more and better school infrastructure, we test to what extent school
attendance of school-aged children is impacted by VSS certification. We find that VSS certified
households are characterized by significantly higher school attendance rates as shown by signifi-
cant (at the 5%) results in the matching specification (Table 7.3). While the school attendance is
higher for certified than for non-certified cooperatives in the OLS specification, this differences is
not statistically significant. Overall, schooling attendance rates are higher in this specification for
anybody who sells to coffee cooperatives.

Table 7.3—Cooperatives and VSS objectives indicators
Dependent variable Yield
(Q/ha)
Exten-
sion vis-
its
Uses
compost
Adopts
mulch-
ing
Adopts
stump-
ing
Uses
chem.
fertilizer
Uses
pesti-
cides -
Uses chil-
dren on
coffee
farm
Uses chil-
dren on
coffee
farm
School-age
children in
school
yes=1 yes=1 yes=1 yes=1 yes=1 yes=1 yes=1 share share
Average 7.44 0.48 0.24 0.52 0.23 0.06 0.02 0.30 0.06 0.65
Std. deviation 5.48 0.42 0.13 0.34
OLS/Probit regressions
Households sells to…
… certified coop. (yes=1) Coeff. 0.075 0.015 0.169 0.016 0.123 0.006 0.012 -0.006 -0.012 0.121
t-value 0.19 0.27 3.24 0.35 2.48 0.74 0.67 -0.12 -0.87 3.48
… non-cert. coop. (yes=1) Coeff. 1.128 0.104 0.052 0.027 -0.070 0.016 -0.021 -0.041 -0.011 0.102
t-value 1.66 1.75 1.09 0.52 -1.58 0.65 -3.05 -0.77 -0.79 3.07
Household & woreda
indicators included yes yes yes yes yes yes yes yes yes yes
Constant Coeff. 6.635 0.0511 0.145 0.301 -0.512 0.109 0.064 -0.700 -0.181 -1.036
t-value 2.95 0.23 0.89 1.51 -2.82 1.51 0.88 -3.76 -3.08 -5.69
Observations 1,410 1,429 1,429 1,429 1,429 1,429 1,429 1,429 1,419 1,238
R-squared 0.28 0.16 0.35 0.32 0.14 0.33 0.03 0.16 0.16 0.30
F-test if certified cooperatives different from non-cert. ones
F-value 1.99 1.31 3.02 0.03 9.16 0.16 2.38 0.23 0.00 0.18
Prob>F 0.16 0.25 0.08 0.86 0.00 0.69 0.12 0.63 0.98 0.67
Matching
Nearest neighbor match-
ing Coeff. 0.417 0.052 0.392 0.356 0.207 -0.049 -0.007 -0.056 -0.025 0.075
t-value 0.83 1.10 8.63 8.01 4.53 -2.78 -0.62 -1.25 -2.23 2.08
Kernel matching Coeff. 0.313 0.050 0.392 0.329 0.209 -0.042 -0.001 -0.039 -0.019 0.073
t-value 0.76 1.22 9.81 9.77 5.77 -3.63 -0.19 -1.10 -2.13 2.80
Observations 1,100 1,118 1,118 1,118 1,118 1,118 1,118 1,118 1,109 954
* robust standard errors; z-values in bold are significant at the 5 percent level


8. CONCLUSIONS
VSS are rapidly taking off in global value chains. However, it is not well understood to what extent
benefits of these VSS are transmitted to producing countries. In this paper, we look in particular
at the impact of VSS certification on the coffee sector in Ethiopia using unique large-scale datasets.
We find that adoption of VSS certification in Ethiopia is low – it currently only represents 5% of
exported quantity – and that this figure has not grown significantly over the last 8 years. We further
find that there are statistically significant quality premiums at the export level for VSS certified
coffee in Ethiopia and that VSS certification has therefore contributed to extra foreign earnings for
the country. It is estimated that average annual export earnings were 2 million USD higher per
year because of VSS certification. Given the potential for growth locally and considering the in-
creasing international demand, more could be done. For example, to achieve a level of 25% certi-
fied coffee, this would assure extra foreign earnings annually for Ethiopia to the height of 10 mil-
lion USD - important considerations for a country in need of foreign exchange to fund its ambitious
development agenda.
While there are significant quality premiums attached to VSS certification at the export level, we
find however that only one-third of that quality premium at the export level is directly transmitted
to producers. Part of the quality premiums is used towards the financing of communal investment.
While these are shown in our study to have led to higher school enrolment rates and while certified
farmers show higher levels of adoption of improved production practices, there is however limited
evidence on large-scale impacts of these communal investments given that a much larger part of
the premiums has also been used for overheads and program management. This is an important
finding as Fairtrade is characterized by the highest premiums among VSS certificates (Potts et al.,
2014) and it can therefore be assumed that even lower benefits from other VSS certification trickles
down to the actual producers.
The challenge of these types of VSS certification is therefore to ensure greater transmission of the
willingness-to-pay by consumers and higher benefits to the poor smallholder producers. For ex-
ample, there are substantial costs to obtaining VSS certification. As stated in the requirements,
minimum wages have to be paid, child wage labor is not allowed, and environmental standards
(such as access to sanitation and water) have to be respected. Each of these may lead to higher
production costs.16 Moreover, sound bookkeeping and management is required from democrati-
cally elected leaders. As education levels in these production areas are generally low (in our da-
taset, 39% of the heads of households did not go to school at all), this is often a challenge for these
coffee producing communities. As there are therefore important compliance costs with VSS certi-
fication and as benefits are relatively small, this often reduces rates of returns of adhering to VSS
certification by these coffee farmers.
The limited effects on improved incomes combined with significant implementation costs might
therefore not give the required incentives for rapid expansion of the adoption of VSS standards in
these settings. This possibly explains the slow growth of adoption in VSS certification in the case
of Ethiopia. While there is slow growth in Fairtrade and Organic certification in the country, the
uptake of other VSS schemes has even been slower. This might be explained by the local market
set-up, i.e. the Ethiopian Commodity Exchange (ECX), as well as the smallholder nature of coffee
production in Ethiopia. As Fairtrade almost exclusively deals with cooperatives and they are not
required to use the ECX as a trading platform, this VSS is not affected by that requirement. How-
ever, others do not require working with cooperatives but given that the ECX market set-up re-
quires anonymity of the sellers, it is, until these provisions are allowed, not conducive for trade in
other VSS certified coffee beans. However, given the prohibitive high costs of certification for
smallholders, the majority of coffee farmers - except the commercial farms – are unlikely to show
interest. Moreover, as different certification schemes fetch different retail margins, they are likely
to have, not only different wholesale prices, but different price spreads between wholesale and
retail. Studying the effects of other VSS certificates should therefore be a fruitful area for future
research.
16 It is also sometimes argued that Ethiopia might forego production because of its adherence to organic practices. However, even when no certification is present, few farmers use chemical fertilizer, indicating that foregone production because of adherence to organic practices is likely to be small.

The low transmission of the premium of VSS models to effectively benefit poor producers, is a
concern especially as other development programs illustrate greater efficiency in transmitting ben-
efits of programs towards poverty alleviation.17 Although some payment towards VSS ends up in
the producing countries, the findings however raise questions on the efficiency of the VSS model.
As it currently stands, significant resources are required for VSS certification of complete product
value chains to assure the transfer of the willingness-to-pay from consumers towards sustainability
and poverty alleviation.18 Moreover, while the increasingly stringent private international stand-
ards on quality and food safety have been shown to meet their objective, and even to benefit farm-
ers (e.g. Swinnen, 2007), this is seemingly easier because of the focused objective that is easy to
recognize by buyers. VSS objectives on the other hand might not be that easily attainable given
the broad objective of ‘sustainability’ and substitution possibilities in the farm household econ-
omy. For example, farmers have often diverse portfolios and can therefore be sustainable on coffee
plots but not on others and resources can be re-allocated within the farm from coffee to other crops,
e.g. no child labor on coffee plots might mean more child labor on other plots. While coffee might
have been sustainably produced and certified, it is possible that little might have changed in the
aggregate at the farm, village or country level. This drawback is therefore seemingly a crucial
challenge for the successful future of such programs.
17 For example, in the case of the Productive Safety Net Program (PSNP), one of the biggest aid programs in Ethiopia, it was esti-mated that 80% of the program funds went to beneficiaries (White and Ellis, 2012) 18 It could be argued that they might even exclude those farmers that it intends to benefit because of high compliance costs, as seen in the low adoption of VSS certification in smallholder coffee production in Africa (Potts et al., 2014).

REFERENCES
Arnould, E.J., A. Plastina, D. Ball. 2009. “Does Fairtrade Deliver on Its Core Value Proposition?
Effects on Income, Educational Attainment, and Health in Three Countries.” Journal of Pub-
lic Policy and Marketing 28(2): 186–201.
Bacon, C. 2005. “Confronting the Coffee Crisis: Can Fairtrade, Organic, and Specialty Coffee
Reduce Small-Scale Farmer Vulnerability in Northern Nicaragua?” World Development
33(3): 497–511.
Barham, B. L., J. G. Weber. 2012. “The Economic Sustainability of Certified Coffee: Recent Ev-
idence from Mexico and Peru.” World Development 40(6): 1269-1279.
Beuchelt, T. D., M. Zeller. 2011. “Profits and Poverty: Certification's Troubled Link for Nicara-
gua's Organic and Fairtrade Coffee Producers.” Ecological Economics 70(7): 1316-1324.
Binswanger-Mkhize, H., J.P. de Regt, S. Spector. 2009. Scaling up Local and Community Driven
Development: A Real World Guide to its Theory and Practice. World Bank, Washington DC
Chiputwa, B., Spielman, D.J., Qaim, M. (2015). Food Standards, Certification, and Poverty
among Coffee Farmers in Uganda. World Development 66: 400-412.
Cramer, C., D. Johnston, C. Oya, and J. Sender. 2014. Fairtrade , Employment and Poverty
Reduction in Ethiopia and Uganda, April 2014, report submitted to Dfid, downloaded from:
http://ftepr.org/wp-content/uploads/FTEPR-Final-Report-19-May-2014-FINAL.pdf
CTA 2013. Executive brief: Coffee Sector, Agritrade, Wageningen, downloaded from:
http://agritrade.cta.int/Agriculture/Commodities/Coffee/Executive-Brief-Update-2013-
Coffee-sector
Dragusanu, R., and N. Nunn. 2014. The Impacts of Fairtrade Certification : Evidence From Coffee
Producers in Costa Rica, unpiublished paper, downloaded from:
http://scholar.harvard.edu/nunn/publications/impacts-fair-trade-certification-evidence-
coffee-producers-costa-rica
Dragusanu, R., D. Giovannucci, D. Nunn. 2014. "The Economics of Fairtrade." Journal of
Economic Perspectives 28(5):217-236
de Janvry, C. A., McIntosh, E. Sadoulet, 2014. Fairtrade and Free Entry: Can a Disequilibrium
Market Serve as a Development Tool?, mimeo, downloaded from:
http://irps.ucsd.edu/assets/001/505311.pdf
Elder, S.D., H. Zerriffi, P. Le Billon. 2012. "Effects of Fairtrade Certification on Social Capital:
The Case of Rwandan Coffee Producers." World Development 40(11): 2355–67.

Giovannucci, D., O. von Hagen, J. Wozniak. 2014. Corporate Social Responsibility and the Role
of Voluntary Sustainability Standards, in C. Schmitz-Hofman et al., Voluntary Sustainability
Standards, Natural Resource Management in Transition 1, Springer-Verlag Berlin Heidelberg
2014
Giovannucci, D., S. Ponte. 2005. "Standards as a New Form of Social Contract? Sustainability
Initiatives in the Coffee Industry." Food Policy 30(3): 284–301.
Haight, C. 2011. The Problem with Fairtrade Coffee. Stanford Social Innovation review. Available
at: http://www.ssireview.org/.
Henson, S., T. Reardon. 2005. "Private Agri-Food Standards: Implications for Food Policy and the
Agri-Food System." Food Policy 30:241-253
Hoebink, P., R. Ruben, W. Elbers, B. Van Rijsbergen. 2014. The Impact of Coffee Certification
on Smallholder Farmers in Kenya , Uganda and Ethiopia, Report prepared by Centre for
International Development Issues Nijmegen (CIDIN), Radboud University Nijmegen, The
Netherlands
ITC (International Trade Centre) (2011). The Coffee Exporters Guide, Geneva, 247p.
Jena, P. R., B. B. Chichaibelu, T. Stellmacher, U. Grote. 2012. "The Impact of Coffee Certification
on Small‐scale Producers’ Livelihoods: A Case Study from the Jimma Zone, Ethiopia." Ag-
ricultural Economics 43(4): 429-440.
Kersting, S., and M. Wollni. 2012. "New Institutional Arrangements and Standard Adoption: Ev-
idence from Small-scale Fruit and Vegetable Farmers in Thailand." Food Policy 37(4): 452-
462.
Kleemann, L., A. Abdulai, and M. Buss. 2014. "Certification and Access to Export Markets: Adop-
tion and Return on Investment of Organic-Certified Pineapple Farming in Ghana." World
Development 64: 79-92.
Kodama, Y. 2009. The Effects of Fairtrade on Coffee Producers : A Case Study of Ethiopian
Coffee Cooperatives. 16th International Conference of Ethiopian Studies. pp. 297–299.
Lancaster, K. 1966. "New Approach to Consumer Theory." Journal of Political Economy 74(2):
132-157.
Panhuysen, S., and J. Pierrot. 2014. Coffee Barometer 2014, Hivos - IUCN Nderland - Oxfam
Nivob - Solidaridad - WWF, downloaded from
https://www.hivos.org/sites/default/files/coffee_barometer_2014_report.pdf
Pierrot, J., D. Giovannucci, and A. Kasterine. 2011. Trends in the Trade of Certified Coffee.
International Trade Center, Geneva

Potts, J., M. Lynch, A. Wilkings, G. Huppé, M. Cunningham, V. Voora, 2014. The State of
Sustainability Initiatives Review 2014. International Institute for Sustainable Development
and the International Institute for Environment and Development, London, 364p.
Raynolds, L., D. Murray, and A. Heller. 2007. "Regulating Sustainability in the Coffee Sector: A
Comparative Analysis of Third-party Environmental and Social Certification Initiatives."
Agriculture and Human Values 24(2): 147-163
Reardon, T., C. B. Barrett, J. Berdegué, and J. Swinnen. 2009. "Agrifood Industry Transformation
and Small Farmers in Developing Countries." World Development 37 (11): 1717–1727
Ruben, R., and R. Fort. 2012. "The Impact of Fairtrade Certification for Coffee Farmers in Peru."
World Development 40(3): 570-582.
Rueda, X., and E.F. Lambin. 2013. "Responding to Globalization: Impacts of Certification on Co-
lombian Small-scale Coffee Growers." Ecology and Society 18(3): 21.
http://dx.doi.org/10.5751/ES-05595-180321
Rueda, X., and E.F. Lambin. 2012. "Linking Globalization to Local Land Uses: How Eco-con-
sumers and Gourmands are Changing the Colombian Coffee Landscapes." World Develop-
ment 41:286-301
Stellmacher, T., and U. Grote. 2011. Forest Coffee Certification in Ethiopia: Economic Boon or
Ecological Bane?, Working Paper Series 76, Centrum for Development Research, University
of Bonn
Swinnen, J. 2007. Global supply chains, standards and the poor: How the globalization of food
systems and standards affects rural development and poverty. Cab International.
Valkila, J., and A. Nygren. 2009. “Impacts of Fairtrade Certification on Coffee Farmers, Cooper-
atives, and Laborers in Nicaragua.” Agriculture and Human Values 27(3): 321-333
Wang, H., X. Dong, S. Rozelle, J. Huang, T. Reardon. 2009. “Producing and Procuring Horticul-
ture Crops with Chinese Characteristics: The Case of Northern China.” World Development
37(11): 1791-1801.
Weber, J. G. 2011. “How Much More do Growers Receive for Fairtrade-organic Coffee?” Food
policy 36(5): 678-685.
Wollni, M., and M. Zeller. 2007. “Do Farmers Benefit from Participating in Specialty Markets and
Cooperatives? The Case of Coffee Marketing in Costa Rica.” Agricultural Economics 37(2):
243-248.

39
APPENDIX
Figure A1—Distribution of propensity score (PPS) before matching
01
23
0 .2 .4 .6 .8 1Estimated propensity score
Non-certified Certified
Kernel density of PPS by treatment status

40
Figure A2—Distribution of propensity score (PPS) after matching
01
23
0 .2 .4 .6 .8Estimated propensity score
Non-certified certified
Kernel density of PPS by treatment status