Embed Size (px)
Citation preview

ISSN 1403-2473 (Print) ISSN 1403-2465 (Online)
Working Paper in Economics No. 708 Who Benefits from Fairtrade? Evidence from the Swedish Coffee Market Dick Durevall Department of Economics, September 2017

Who Benefits from Fairtrade? Evidence from the Swedish Coffee Market1
Dick Durevall*
HUI Research and Department of Economics, University of Gothenburg
Monday, 18 September 2017
Abstract
This paper analyses how the premium customers pay for Fairtrade-labelled coffee is distributed in the Swedish market, using information on costs of production and scanner data on almost all roasted and ground coffee products sold by retailers. A key finding is that roasters and retailers get 43–70%, while producer countries, in this paper comprising coffee farmers, cooperatives, middlemen, exporters and Fairtrade International, get 24–51%. Fairtrade Sweden gets 5–8%. These values are upper and lower bounds that reflect assumptions made about the additional costs of producing roasted and ground Fairtrade coffee, given the cost of beans and the Fairtrade license, and whether conventional coffee is compared with organic or non-organic Fairtrade coffees. Since roasters’ and retailers’ margins are higher for Fairtrade than conventional coffee, there is evidence that Fairtrade retail prices are higher than the level attributable to costs. However, producer countries receive a significantly larger share of the premium paid than reported in earlier studies, which are either dated or analyse very small samples of coffees.
Keywords: coffee supply chain, ethic labels, Fair Trade, extra price, Fairtrade, market power, organic coffee
JEL Codes: D43, O19, P46
1 This is a substantially revised version of the paper “Are Fairtrade Prices Fair? An Analysis of the Distribution of Returns in the Swedish Coffee Market”, S-WoPEc No 615.
2
1. Introduction
The sales of Fairtrade-certified goods are increasing rapidly and reached EUR 7.3 billion in
2015. Coffee, the first product to be certified, accounts for about 25% of the value of Fairtrade
retail sales, and currently there are over 800 000 Fairtrade coffee farmers (Fairtrade
International, 2017a; 2017b). The overall goal of Fairtrade is to ensure that farmers get a fair
price and terms of trade that allow them to improve their lives (Fairtrade International,
2017c). Over the years, a number of studies have evaluated whether farmers benefit from
Fairtrade, with varying results.2
Several papers analyse consumers’ willingness to pay a premium for sustainability-certified
products. Although the findings vary with type of consumer and origin of the product, there is
overwhelming evidence that many people are willing to pay considerably more for Fairtrade-
certified products (Basu and Hick, 2008; Hertel et al., 2009, Carlsson et al., 2010; Howard
and Allen, 2010; Hiscox et al., 2011; Andorfer and Liebe, 2012; Van Loo et al., 2015;
Hainmueller et al., 2015; Basu et al., 2016). Some of these studies use real-life experiments.
One example is Hiscox et al. (2011), who, by setting up eBay auctions with products that are
identical except for the Fair Trade3 label, show that US consumers are willing to pay
approximately 23% more for Fair Trade coffee. Thus, Fairtrade certification has the potential
to increase market efficiency by creating a product that consumers are willing to buy, i.e.
coffee combined with (perceived) decent incomes and working conditions for poor farmers
(Reinstein and Song, 2012; Dragasanu et al., 2014; Podhorsky, 2015). Without the
certification, the label and the subsequent monitoring (and a presumed positive effect on
farmers), the market for Fairtrade products would not exist.
The argument that Fairtrade increases market efficiency hinges on assumptions about
roasters’ and retailers’ limited market power (Reinstein and Song, 2012; Podhorsky, 2015).
2 Nelson and Pound (2009) conclude that Fairtrade producers enjoy higher returns and more stable incomes compared with others. Dragusanu et al. (2014) agree but note that the empirical evidence is based primarily on conditional correlations, while Mohan (2010), Blackman and Rivera (2011) and Dammert and Mohan (2015) argue that there is a lack of persuasive evidence that coffee certification provides significant economic benefits. Recent empirical studies on the impact of Fairtrade on coffee farmers are Weber (2011), Jena et al. (2012), Dragusanu and Nunn (2014), Chiputwa et al. (2015), de Janvry et al. (2015), Minten et al. (2015) and Nelson et al. (2016). Their findings are mixed, yet none of them report strong positive average effects on income and other indicators of standard of living. 3 I use the term Fairtrade when referring to the certification and labelling system governed by Fairtrade International. The term Fair Trade is used to refer to the fair trade movement as a whole and to products certified by the organization Fair Trade USA.
3
However, several papers claim that the lion’s share of the premium paid for Fairtrade coffee
accrues to roasters or retailers, and that the bean-exporting country receives as little as 10% or
less (Mohan, 2010; Griffiths 2012, 2015; Hartford, 2012, p. 37; Claar and Haight, 2015). If
correct, Fairtrade has created a product that mainly benefits roasters and/or retailers as they
exploit their market power and set high prices.
In spite of these claims, few studies provide empirical evidence on the price paid for Fairtrade
coffee in consumer markets, and no one attempts to estimate the total additional cost of
producing Fairtrade relative to ordinary coffee. To the best of my knowledge, only four
published papers actually measure the premium paid and provide some information about
how it is distributed (Mendoza and Bastiaensen, 2003; Kilian et al., 2006; Johannessen and
Wilhite, 2010; Valkila et al., 2010).4 It is important to note that Mendoza and Bastiaensen
(2003) and Kilian et al. (2006) analyse data from the 1990s and early 2000s, when Fairtrade
coffee was mostly sold in special shops and its market share was tiny (Fairtrade Foundation,
2012). Since there has been a rapid expansion in sales of Fairtrade coffee and a shift to
grocery chains, these studies are probably no longer relevant (Smith, 2009; Mohan, 2010, pp.
52–55). While the other two studies use more recent data, Johannessen and Wilhite (2010)
analyse one Fairtrade coffee sold in retail outlets and Valkila et al. (2010) compare a few
popular conventional coffees with two Fairtrade coffees. Thus, no study analyses a
representative sample from a market where large companies produce Fairtrade coffees and
grocery chains sell them.
The purpose of the present paper is to analyse how the premium paid by consumers for
Fairtrade coffee is distributed in the Swedish market. It differs from earlier studies by
providing estimates of how much of the premium paid for Fairtrade coffee is captured by
roasters and retailers when their costs, though indirectly, are accounted for. Moreover, by
analysing practically all coffee products sold during the study period and controlling for
various factors that affect prices, sample selection problems are reduced.
Coffee retail markets in developed countries share many characteristics, so the Swedish
market should be representative at least of those in northern Europe. Most developed country
4 In her review of Fairtrade, Mohan (2010) refers to Potts (2004), Weber (2007) and Sellers (2005), but none of these studies provide any evidence on the premium paid for Fairtrade coffee by comparing prices. Griffiths (2012) reports data from a British café. However, these data are not relevant for retail markets.

4
consumer markets, a few multinational and national roasters have a very large share of the
market (60–85%), while many small roasters compete for the rest (Oxfam, 2002; Durevall,
2003; Sutton, 2007). Food retailing is usually even more concentrated than coffee processing
(Bukeviciute et al., 2009; McCorriston, 2013). In for example Sweden, the three largest
grocery chains account for well over 90% of all sales (Swedish Competition Authority, 2011).
In Sweden, Fairtrade coffee has a market share of 10% (Fairtrade Sweden, 2016), which is
similar to the figure in several other countries (Krier, 2008; Elliot, 2012). Today, both large-
and small-scale roasters produce Fairtrade coffee and primarily sell it through grocery chains,
so Fairtrade and conventional coffees have the same supply chains after the beans have
reached the importing countries. Consequently, Fairtrade coffee is an integrated part of the
mainstream coffee retail market.
I use scanner data at the barcode (EAN) level for all roasted and ground coffee products,
collected by the Nielsen company from over 3 000 Swedish grocery shops, as well as
information about costs in order to measure how the premium paid for Fairtrade coffee is
distributed. First I estimate representative average Fairtrade and conventional coffee retail
prices by regressing retail prices on a range of product characteristics, i.e. I estimate hedonic
regressions. Then I calculate the distribution of shares using the estimates of average retail
prices, the difference in margins on sales of Fairtrade and conventional coffee, costs of
Fairtrade and conventional beans, and Fairtrade licence costs, while assuming rather extreme
maximum and minimum additional costs related to the production of Fairtrade coffee
compared with conventional coffee. This makes it possible to distinguish between three
groups of actors: producer countries, i.e. coffee farmers, cooperatives, middlemen, exporters
and Fairtrade International; roasters and retailers, in this paper comprising importers, roasters
and retailers in Sweden; and Fairtrade Sweden, which manages the certification of roasters
and other related activities in Sweden. The analysis also provides estimates of government
income from value added tax (VAT), but they are small and uncertain and not explicitly
reported.
The main finding is based on a comparison of roasted and ground non-organic conventional
and non-organic Fairtrade coffees. Out of the premium paid for Fairtrade coffee, net of VAT
and additional costs, roasters and retailers get 61% when additional costs are assumed to be
SEK 5/kg (about USD 0.70) higher for Fairtrade coffee than for conventional coffee, given

5
the cost of Fairtrade beans and the Fairtrade licence, and 70% when the costs are assumed to
be the same. Producer countries get 31% or 24%, respectively, and Fairtrade Sweden gets 8%
or 6%. A difference of SEK 5/kg in costs is an extreme assumption and therefore generates a
very low lower bound of the share going to roasters and retailers. After all, there are no
obvious differences in the marginal cost of production between Fairtrade and conventional
roasted and ground coffee, since both are produced by both small and large roasters.
I lack systematic information about prices of conventional organic green beans, so I compare
roasted and ground non-organic conventional and organic Fairtrade coffees, i.e. the combined
effect of the Fairtrade and organic labels. This results in somewhat smaller figures for roasters
and retailers: 43% when an SEK 5/kg difference is assumed and 53% without a difference,
while the producer country gets 51% or 42%, respectively. The larger shares going to
producer countries are due to the relatively high Fairtrade social premium on organic beans
and the small impact of the organic coffee label on the retail price. Nonetheless, in a
competitive market, roasters’ and retailers’ margins would be similar for Fairtrade and
conventional coffee, so their share of the premium paid for Fairtrade coffee would be close to
zero. Thus, the Fairtrade label seems to create a product that roasters and retailers can use to
exploit their market power.
Another finding is that the share of the premium consumers pay for Fairtrade, i.e. the
difference between Fairtrade and conventional coffee retail prices, which goes to the producer
countries is 22% for non-organic coffee and 40% for organic coffee. These figures are clearly
higher than the 11.5% reported by Valkila et al. (2010). The value share, i.e. the price paid for
beans used to produce 1 kg of ground coffee as a share of the retail price, is 50% for
conventional coffee and 43% or 46% for Fairtrade non-organic and organic coffee,
respectively, which can be compared with 35% for the two Fairtrade coffees in Finland
(Valkila et al., 2010) and 26% for the Fairtrade coffee in Norway (Johannessen and Wilhite,
2010). Thus, while Fairtrade retail prices are high compared with costs, producer countries
receive a substantially larger share of the difference between Fairtrade and conventional
coffee retail prices than reported in earlier studies (Mendoza and Bastiaensen, 2003; Kilian et
al., 2006; Johannessen and Wilhite, 2010; Valkila et al., 2010) and often used when
discussing Fairtrade (Mohan, 2010; Griffiths 2012, 2015; Hartford, 2012, p. 37; Claar and
Haight, 2015). Nonetheless, the shares roasters and retailers obtain are large compared with
6
what farmers are likely to get, which is just a small part of the producer country’s share,
casting doubt on the market efficiency argument, as stated by Reinstein and Song (2012) and
Podhorsky (2015).
The next section briefly reviews earlier research on Fairtrade retail prices. Sections 3 and 4
describe the data and method, respectively. Section 5 reports the regression results, while
Section 6 calculates the allocations of the Fairtrade returns. Section 7 concludes the paper.
2. Earlier Research
A vast number of papers on Fairtrade have been written, but very few analyse consumer
prices. A recent study is Johannessen and Wilhite (2010), who analyse 2006–07 data for a
Fairtrade coffee sold in retail stores in Norway: Farmers’ Coffee from Guatemala. They find
that, out of the final consumer price, the retailer gets 13.8%, the Fairtrade certifier 2.4% and
the importer/roaster 58.2%. This implies that 74.4% of the value stays in Norway while
26.6% ends up in Guatemala. There is no information about production costs, VAT etc. and
no comparison with prices of conventional coffee, so we cannot say anything about the
premium paid for Fairtrade coffee or how it was distributed.
Valkila et al. (2010) compare the prices in 2006-09 of the two most popular Fairtrade coffees
with those of the four most popular conventional coffees sold by a large retail chain in
Finland. They find that 35% of the Fairtrade consumer price goes to the bean producer
country and 60% stays in Finland; the other 5% are for licence fees and transport costs. The
producer country receives EUR 1.30 for 1 kg of Fairtrade coffee and EUR 1.15 for 1 kg of
conventional coffee, which implies that 11.5% of the premium paid by consumers for
Fairtrade coffee reaches the producer country.
Kilian et al. (2006) report US and European data on conventional, organic and
Fairtrade/organic coffee in graphs.5 There are three noteworthy findings, particularly in
Europe. First, there is a relatively small difference in prices charged by roasters for the three
studied categories of coffee, indicating that the production costs are similar. Second, retailers
increase the price of organic and organic Fairtrade coffee by about 100%, while the markup
5 Kilian et al. (2006) do not present any details about their study but refer to a report that I have not managed to obtain.

7
on conventional coffee is only 15–20%. Third, there is almost no difference in the consumer
prices of organic and Fairtrade/organic coffee, indicating that the premium paid for Fairtrade
is small. Rough estimates based on the graphs indicate that about 15% of the difference in
price between conventional and Fairtrade/organic coffee went to the producer country.
However, this was almost all due to the high price on organic coffee. These findings might be
due to the study period, which largely pre-dates the sale of Fairtrade coffee by grocery chains.
Mendoza and Bastiaensen (2003) compare the costs for one conventional and one Fairtrade
instant coffee in the UK in 1996 and 2003. In 1996, the producer price for green beans was
similar for conventional and Fairtrade coffee, while the consumer price was 40% higher for
Fairtrade than for conventional coffee. Only 4.5% of the premium paid for Fairtrade coffee
went to the producer country. World market bean prices declined sharply after 1996, but the
impact on Fairtrade coffee bean prices was small. As a result, the share going to the producer
country increased to 19%.
There are also some studies that estimate hedonic models, focusing on the size of the
Fairtrade premium only; Wang (2016) provides a brief review. There is one study on Sweden,
Schollenberg (2012), who uses Nielsen data for March 2005–March 2008. A Fairtrade label
raises the price by 32% when controlling for a range of factors that influence prices, including
brands. A drawback of the study is that by controlling for practically all brands, several of
which have Fairtrade coffees, it is not clear what Fairtrade products the 32% applies to.
Thus, there is some limited evidence that importers, roasters and/or retailers charge high
prices for Fairtrade coffee and keep a large part of the price difference. However, most studies
use data from a period when Fairtrade coffee sales were much lower than today. Such sales
are estimated to have grown by about eight times from 2000 to 2012 (Fairtrade Foundation,
2012), and therefore, increases in competition might have eroded price differences, as claimed
by Smith (2009). Moreover, apart from Kilian et al. (2006), which uses old data, the studies
focus on a small selection of products, which might amplify the impact of differences in
quality. For example, the conventional coffees studied by Valkila et al. (2010), i.e. the most
popular ones, are likely to have low prices, so the benchmark used for conventional coffee
might be biased downwards. Thus, the studies may suffer from severe selection bias (Elliott,
2012).
8
3. Data The data on coffee products are from weekly sales in 3 088 Swedish grocery shops from 1
March 2009 to 26 February 2012, collected at the barcode level by the Nielsen company.
They include values and volumes of all coffee products sold as well as information about
types of coffee and various product characteristics, such as manufacturer, type of roast, size of
package, organic, Fairtrade, and private label (retailer-owned brand). I measure retail prices as
value divided by volume averaged over the sample period and grocery shops (Nielsen does
not provide information from the individual grocery shops in Sweden). I focus on roasted and
ground coffee, as this is by far the largest market segment, accounting for 80% of all coffee
sales in value terms according to the Nielsen data. Instant coffee, which accounts for 11% of
the sales, is more challenging to analyse due to the small number of Fairtrade products and
larger scope for using cheap beans.6
Table 1 provides price information on the 188 ground coffee products available in packages
of 250 g, 400–499 g and 500 g. There are 22 organic Fairtrade and 12 organic non-Fairtrade
products. Both the mean and median prices of organic Fairtrade coffee are relatively high, 30–
40% higher than for conventional coffee. This is partly due to the low prices of conventional
coffee at the lower end of the price scale, i.e. the minimum price is SEK 30 compared with
SEK 69 for Fairtrade coffee while the maximum price for conventional coffee is only SEK 10
lower than for Fairtrade coffee. The price difference is probably due to the Fairtrade label
since organic non-Fairtrade coffee is only slightly more expensive than conventional coffee.
There are 3 non-organic Fairtrade coffee products. They are in the 250 g segment, which is
very small; it only accounts for 0.5% of total sales of ground and roasted coffee. The prices of
the three non-organic Fairtrade coffees also differ greatly and are therefore not useful for
estimating representative Fairtrade coffee prices (see Appendix A).
There are two sources of information about green bean prices: International Coffee
Organisation (ICO) and Statistics Sweden. ICO publishes daily world market prices for
various types of green coffee beans. I used these prices and information on the volume of
imports of green beans to construct an index with weights based on the type of Arabica beans
imported (ECF, 2014). Statistics Sweden publishes monthly volumes and values of imports of
6 I did analyse instant coffee and the results are available on request. They are qualitatively similar to the ones reported for ground coffee.

9
green beans. The average bean prices obtained from the two sources are very similar, SEK
29.15 and 29.72/kg for March 2009–February 2012. The difference is probably due to quality
differences and additional freight and insurance costs for delivery to Sweden. Converting the
freight and insurance costs used by Valkila et al. (2010) from EUR to SEK gives a cost of
SEK 0.85/kg for transporting green beans from Latin America to Finland, so the SEK 0.57
difference between Statistics Sweden and ICO prices makes sense; ICO prices are for delivery
to the US, France or Germany. Because the difference in the prices is small, the choice of data
source does not matter for the results. In the calculations, I use prices based on import data
from Statistics Sweden.
The current Fairtrade (minimum) bean price is 140 US cents per pound for washed Arabica,
135 US cents per pound for natural Arabica, and 101 US cents per pound for Robusta. On top
of those prices, Fairtrade requires buyers to add a social premium of 20 US cents per pound to
the price of conventional coffee beans and another 30 US cents for certified organic coffee
beans (Fairtrade Foundation, 2012). Because world market prices were higher than Fairtrade
minimum prices during the study period, I added the Fairtrade social premiums to world
market prices to obtain the prices paid for Fairtrade coffee beans.7 Most Fairtrade coffee sold
in Sweden is organic, so Table 1 reports both Fairtrade and organic Fairtrade bean prices.
Unfortunately, I do not have systematic information about organic non-Fairtrade bean prices.
The price of ordinary green beans was SEK 29.72/kg during the study period. Adding
Fairtrade’s social premium increases this figure to SEK 32.80/kg for Fairtrade beans and SEK
37.50/kg for organic Fairtrade beans. This means that Fairtrade and organic Fairtrade beans
are 10% and 26% more expensive than ordinary beans, respectively.
Approximately 1.19 kg of green beans is used to produce 1 kg of ground coffee due to weight
lost during roasting (ECF, 2014). When comparing green bean and ground coffee prices, it
therefore makes sense to multiply bean prices by 1.19. Roasters thus pay SEK 35.37 for the
beans used to produce 1 kg of ground conventional coffee. For Fairtrade coffee and organic
Fairtrade coffee, the corresponding figures are SEK 39.03 and SEK 44.63.
We conclude that there are large retail price differences between conventional and Fairtrade
coffee and that these are unlikely to be due to differences in bean prices only. However, the
7 Before April 2011, the social premiums were 10 and 20 US cents, respectively.
10
comparisons ignore the fact that the coffees compared are not identical; many characteristics
of the products affect price, such as size of packages and type of roasting.
4. Method
I calculate three measures of how the premium paid for Fairtrade coffee is distributed by
comparing conventional and non-organic Fairtrade coffee, and conventional and organic
Fairtrade coffee. The calculations aim to account for various costs, and are not complicated.
However, there are several components, so here I give a somewhat simplified description of
them by ignoring VAT and organic coffee; more details are provided in Appendix B.
The simplest and the most commonly used measure in studies on coffee prices is the value
share; see e.g. Oxfam (2002), Talbot (2004) and Gilbert (2008). It compares the cost of beans
with the retail price, and is defined here as:
( 0.85) ,Bi RiP P− (1)
where RiP is the average retail price per kg of roasted and ground coffee, i is Fairtrade or
conventional coffee, BiP is the cost of beans needed to produce one kg of ground coffee and
SEK 0.85 is an estimate of the per-kg transport cost for beans, obtained from Valkila et al.
(2010).
The second measure shows how the consumer premium, the difference between Fairtrade and
conventional coffee retail prices, is divided between the producer and consumer countries.
The producer countries’ share of the premium is:
( ) ( )BF BF RF RCP P P P− − , (2)
where BF BCP P− is the difference between the cost of Fairtrade and conventional beans and
RF RCP P− is the difference in retail price between Fairtrade and conventional coffee. This
measure is often reported when discussing Fairtrade consumer prices. It is estimated in some
studies, such as Valkila et al. (2010), but not in Johannessen and Wilhite (2010), who do not
use data on conventional coffee prices.
11
The third measure highlights the share going to roasters and retailers (retail chains in
Sweden). It shows how the difference in Fairtrade and conventional coffee retail prices, net of
VAT and costs, is distributed between roasters and retailers, Fairtrade Sweden, and producer
countries. In contrast to the other two measures, it requires information about Fairtrade
licence fees to process the coffee beans; a roaster needs a Fairtrade license in order to process
the coffee beans. It also requires an analysis of how production costs differ between Fairtrade
and conventional coffee, and how much VAT that is paid to government.
The total additional income from the sale of 1 kg of Fairtrade coffee, ,FTRR is measured as the
sum of three components: the cost of Fairtrade beans minus the cost of conventional beans,
the licence fee paid to Fairtrade Sweden and the difference in roasters’ and retailers’ margins
on Fairtrade and conventional coffee, defined as .F CM M− The margin, ,M is the retail price
adjusted for VAT minus costs of producing ground coffee. Since I use the difference in
margins, the only information about costs needed is the cost of beans, the licence fee paid to
Fairtrade Sweden and the additional ‘other cost’ incurred when producing Fairtrade coffee
instead of conventional coffee; all other costs are netted out by the use of differences. The
share accruing to roasters and retailers is thus the difference in margins (excess margins for
Fairtrade coffee) divided by the total additional income value from Fairtrade coffee retail
sales:
( ) ,F C FTRM M R− (3)
while the share accruing to the producer countries is:
( ) .BF BC FTRP P R− (4)
I have information on the cost of beans, which is the main cost of production of ground
coffee, and on applicable Fairtrade certification fees (paid by roasters) and VAT. It is possible
that roasters’ marginal cost of production is higher for Fairtrade than for conventional coffee,
even after controlling for the cost of beans and fees, although coffee production is fairly
straightforward and returns to scale are limited (Sutton, 2007). The value chains are the same
for conventional and Fairtrade coffee in Sweden, but production costs might be higher for
Fairtrade coffee due to administrative costs, if e.g. it is more challenging to source Fairtrade
coffee beans of adequate quality or taste. To get a rough idea of the size of a potential
difference in ‘other costs’ of production, I use annual data from Statistics Sweden on value
12
and volume of deliveries from Swedish roasters and the price of imported green beans.8 The
average wholesale delivery price in 2010–2011 was SEK 52/kg, while the import price of
coffee beans was SEK 32/kg. The difference, SEK 20, is margin plus costs for roasting
(including bean weight loss, which corresponds to SEK 6), packaging, transport to retailers
etc. A difference in production costs between Fairtrade and conventional coffee of, say, SEK
5/kg should therefore be a very high upper limit. I use this as a measure of additional ‘other
costs’ in the calculations, since it indicates a minimum value for the shares obtained by
roasters and retailers.
One challenge when evaluating Fairtrade prices is that the quality might differ both between
conventional and Fairtrade coffees and within each category (Elliot, 2012). Another challenge
is that almost all Swedish Fairtrade coffees are organic, and the separate contributions of
Fairtrade and organic beans to the price need to be disentangled. Therefore, I use regression
analysis to estimate the average price paid for Fairtrade and conventional coffee, since it
allows me to control for several product characteristics.
To identify the impact of a Fairtrade label on the price, I use the facts that not all organic
coffees are Fairtrade and that the price of organically certified conventional coffee should be
informative about the contribution of organic coffee labels to the price of organically certified
Fairtrade coffee. The main analysis is restricted to coffees in 500 g packages. This is by far
the most popular package size, making up 93% of all sales of roasted coffee in value terms
according to the Nielsen data. In this market segment, all Fairtrade coffees are organic.
However, to check for the robustness of the results, I also estimate models with various sub-
samples (see Appendix A).
I also compare non-organic conventional coffee and organic Fairtrade coffee, which provides
information about the distribution of shares without the need to separate the price effects of
Fairtrade and organic labels. Ideally, organic Fairtrade coffee should be compared with
organic conventional coffee, but there is a shortage of detailed information about prices for
organic conventional beans, preventing such a comparison.
8 Almost all deliveries recorded by Statistics Sweden are roasted and ground coffee since all instant coffee is imported to Sweden and retail sales of whole roasted beans make up only a tiny part of the coffee sold to consumers. Thus, almost all imported green beans are used to produce ground coffee. A small share of roasted coffee is exported, which I ignore.

13
5. How high are Fairtrade prices?
Table 2 reports OLS regressions on prices per kg of ground coffee in 500 g packages, using
robust (sandwich estimator) standard errors. Product characteristics, aimed at capturing
quality-related costs, are measured by dummy variables for type of roast (medium, dark and
other), private label, decaffeinated, organic (not Fairtrade) and Fairtrade organic coffee (all
500 g Fairtrade coffees are organic). The dummies are not mutually exclusive: a small number
of coffees with private labels are also organic and a few are both organic and Fairtrade.
However, the inclusion of more dummy variables, such as non-Fairtrade-organic private label,
does not affect the results (available from the author on request).
Specification (1) includes the 140 products for which there is data. The base category is
ground medium-roast branded coffee with caffeine. The price of it is SEK 62.00/kg. The
combined Fairtrade and organic labels add SEK 23.27/kg to the SEK 62.00/kg, while organic
coffee labels by themselves add only SEK 6.14/kg. The estimate of the contribution of
organic beans to the price is somewhat uncertain because it is only significant at the 10%
level, but it is clearly much smaller than the SEK 17/kg (23.27 minus 6.14) contribution of the
Fairtrade label.
Because the variable measuring Fairtrade coffee products includes only organic Fairtrade
coffee, I re-estimate the model without Fairtrade coffee to focus on organic coffee
(specification 2). The results are similar: organic beans add SEK 6.17/kg to the price. And to
check the robustness of the result for the Fairtrade coffee, I then estimate a model with only
organic coffee (specification 3). Now the base category is a 500 g package of ground
medium-roast organic branded coffee with caffeine, priced at SEK 69.26/kg. There are only
24 observations, but the results are strong: the coefficient for Fairtrade coffee is highly
significant (t-value = 5.25), showing that the Fairtrade label adds SEK 14.76/kg to the price of
organic coffee. This is in line with the results obtained in the two other specifications. A
medium-roast branded coffee with caffeine that is also Fairtrade but not organic would thus
cost about SEK 77–79. This implies that the Fairtrade label increases the price of
conventional coffee by about 25%.
All the control variables have expected signs. Private label coffee is about SEK 12 cheaper
than branded coffee, and dark roast is SEK 5–7 more expensive. The ‘undefined roast’ is a

14
control variable that captures products without a type of roast identified on the package.
Decaffeinated coffee is SEK 6 more expensive than conventional coffee, but the estimates are
not significant due to the small number of observations.
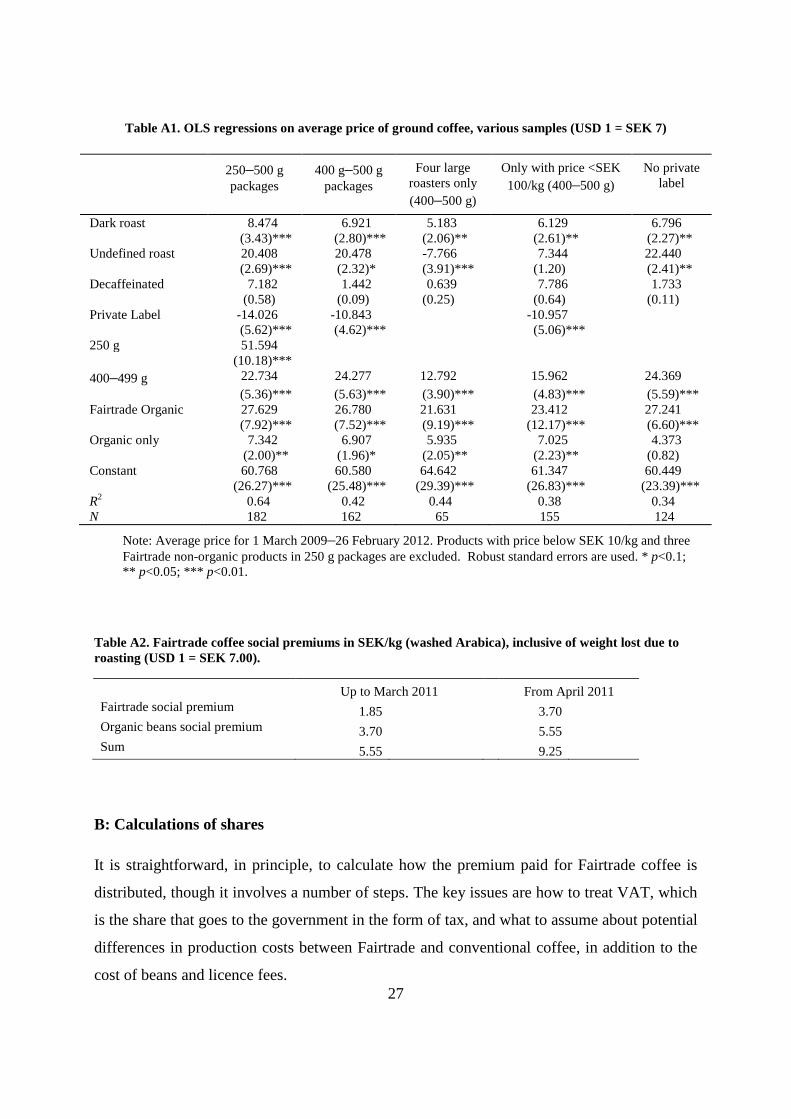
To further check for robustness of the findings, I estimated models with five different
samples: all 250 g, 400–499 g and 500 g packages; only 400–499 g and 500 g packages,
which excludes several very expensive 250 g packages; the four roasters that dominate the
Swedish market for ground coffee; only inexpensive coffees, i.e. coffees that cost less than
SEK 100/kg; and only branded coffees. Although the coefficients of some of the product
characteristics differ, the ones for organic and Fairtrade coffee are similar to the coefficients
reported in Table 2 (see Table A1 in Appendix A).
6. Distribution of the premium paid for Fairtrade coffee
The purpose of this section is to calculate how much of the premium consumers pay for
Fairtrade coffee that accrues to roasters and retailers, Fairtrade Sweden and producer
countries. In addition, I calculate producer countries’ share of the consumer premium and
producer countries’ value shares for Fairtrade and conventional coffee.
During the study period, the average Fairtrade social premium, i.e. the additional cost roasters
pay for green Fairtrade beans, was SEK 3.11/kg on ordinary beans and SEK 7.11/kg for
organic beans (see Table A2 in Appendix A). The certification fee paid by roasters was 1.5%
of the consumer price in 2008 and 0.8% in 2013.9 In the calculations, I use 1.5% (inclusive of
VAT) of the consumer price (exclusive of VAT), which might be on the high side.
Because there is a time lag between the purchase of beans and the sale of processed coffee, I
calculated average bean prices starting three and six months before the study period, as well
as in March 2009. However, the price changes are small and the choice does not matter much.
The price used in the calculations is the average price of imported green beans for January
2009–November 2011.
Table 3 reports the results for ground coffee in 500 g packages. Consumer prices are from
Table 2, specification (1), where I control for product characteristics. They are SEK 62 for
9 Personal communication with Morgan Zerne, CEO of Fairtrade Sweden.

15
conventional coffee and SEK 79 for Fairtrade coffee. Out of the premium paid for 1 kg of
Fairtrade coffee, producer countries and Fairtrade Sweden get SEK 3.70 and 0.95/kg,
respectively. When I assume that ‘other costs’ are zero, the roasters’ and retailers’ margin is
SEK 11.10/kg higher for Fairtrade than conventional coffee. The total additional value of
Fairtrade sales is thus SEK 15.75/kg, of which 24% accrues to producer countries, 70% to
roasters and retailers and 6% to Fairtrade Sweden. If we instead assume that ‘other costs’ are
SEK 5/kg higher for Fairtrade than conventional coffee, the share for producer countries
increases to 31% and the share for roasters and retailers decreases to 61%.
Table 3 also reports how large the difference in ‘other costs’ needs to be to completely erode
roasters’ and retailers’ margin; it is SEK 14.80/kg. In this hypothetical case, roasters’ and
retailers’ margins are the same for conventional and Fairtrade coffee, and producer countries’
share is 80%.
Table 4 reports calculations with conventional coffee and organically certified Fairtrade
coffee using Fairtrade’s premium on organic green coffee beans. When there is no difference
in ‘other costs’, producer countries receive 42% and rosters/retailers 53%, and when there is
an SEK 5/kg difference, producer countries receive 51% and rosters/retailer 43%. Fairtrade
Sweden gets 5% and 6%, respectively.
The producer countries’ share of the premium, i.e. the difference between Fairtrade and
conventional retail prices, is 22% when non-organic coffees are compared (Table 3) and 40%
when the non-organic conventional coffee is compared with organic Fairtrade coffee (Table
4). The large share for organic Fairtrade coffee is due to the combination of a relatively large
social premium on organic green Fairtrade beans and a relatively small price effect of the
organic label. Producer countries’ value shares, the price of beans as a percentage of retail
prices, are about 50% for conventional coffee and 46% and 43% for organic and non-organic
Fairtrade coffee, respectively.
7. Discussion and Conclusion
Consumers pay a premium for Fairtrade coffee, most likely assuming that it mainly benefits
poor coffee farmers (Koppel and Schulze, 2013). Yet, several authors claim that almost the
entire difference between Fairtrade and conventional coffee retail prices is kept by importers,

16
roasters and retailers (Mendoza and Bastiaensen, 2003; Kilian et al., 2006; Johannessen and
Wilhite, 2010; Mohan, 2010; Valkila et al., 2010; Griffiths 2012, 2014, 2015; Hartford, 2012,
p. 37; Claar and Haight, 2015). However, the empirical evidence for this claim is weak. Most
studies are based on comparisons of a small number of selected coffees, not representative
samples, and few of them have been published. Several studies are also dated, and defenders
of Fairtrade argue that the rapid growth of Fairtrade coffee sales has increased competition
and reduced premiums (Smith, 2009).
This paper analyses how the premium paid by consumers for Fairtrade coffee in the Swedish
coffee market is distributed between three groups: coffee producer countries; importers,
roasters and retailers; and the organisation managing the certification of roasters, Fairtrade
Sweden. Scanner data for everyday sales of coffee in 3 088 outlets across Sweden are used to
estimate price differences between conventional and Fairtrade-certified roasted and ground
coffee, while controlling for product characteristics. Information about green bean prices,
Fairtrade certification fees and VAT, as well as assumptions about additional costs of
producing roasted and ground Fairtrade coffee, are then used to calculate extreme maximum
and minimum values of the distribution of the shares.
Comparing non-organic conventional and Fairtrade coffee, and assuming it costs SEK 5/kg
(USD 0.70) more to produce Fairtrade than conventional coffee (which is a very high value),
importers, roasters and retailers get 61% of the premium, while assuming that the costs are the
same increases their share to 70%. Producer countries receive 31% or 24% and Fairtrade
Sweden 8% or 6%, respectively. These percentages can be considered lower and upper
bounds. Comparing non-organic conventional coffee and organic Fairtrade coffee gives a
more favourable result for producer countries; they receive 51% or 42% and roasters and
retailers receive 43% or 53%, depending on the assumption about additional costs. The reason
the shares differ from the comparison of non-organic coffee is that Fairtrade’s social premium
on organic beans is high compared with the social premium on ordinary beans, and that the
increase in price related to the organic coffee label is small.
Earlier studies focus either on how the difference between Fairtrade and conventional coffee
retail prices is allocated between producer and consumer countries, ignoring costs of
production and VAT, or on the export price as a share of the retail price, i.e. the value share. I
find that producer countries get 22% of consumer premium on Fairtrade measured as the
17
difference between Fairtrade and non-organic conventional coffee prices, and 40% of the
consumer premium measured as the difference between organic Fairtrade and non-organic
conventional coffee prices. This is clearly more than the 11% or less found in other studies
(Valkila et al., 2010). The value shares are 50% for conventional coffee and 46% and 43% for
organic and non-organic Fairtrade coffee, respectively. Some other recent estimates are 26%
for a Fairtrade coffee brand in Norway (Johannessen and Wilhite, 2010) and 35% for a
selection of Fairtrade coffees in Finland (Valkila et al., 2010). The most likely reason I obtain
higher values than earlier studies is that I analyse a national sample of coffees, not just a few
products, and control for product characteristics.
Nonetheless, a key finding is that the margins for Fairtrade coffee are clearly higher than for
conventional coffee. This is an indication of market power in the Swedish consumer coffee
market. Large national and multinational roasters sell Fairtrade coffee, and they are generally
believed to have market power due to their large market shares, in Sweden and elsewhere
(Talbot, 2004; Gibbon, 2005; Nakamura and Zerom, 2010), though earlier research on the
Swedish coffee market has not found persuasive evidence in this direction (Durevall, 2007;
Gilbert, 2008). Moreover, three large grocery chains dominate the Swedish retail food market.
With market power, roasters and retailers can charge prices that more than compensate for
additional Fairtrade costs. As a consequence, the demand for Fairtrade coffee beans is kept
down by high prices, indirectly affecting the income of poor farmers. Therefore, Fairtrade
seems to provide roasters and retailers with a new product that earns monopoly rents.
A shortage of Fairtrade beans, at least of beans of sufficiently good quality, is an alternative
explanation for the high Fairtrade retail prices. Although there arguably have been periods
when some roasters have had difficulties sourcing adequate Fairtrade beans, this is unlikely to
be a general phenomenon. In fact, most Fairtrade-certified cooperatives sell only a part of
their coffee beans as Fairtrade, as there is excess supply (de Janvry et al., 2015).
Fairtrade critics have suggested that consumers should donate money to coffee farmers
(supposedly via some institution) instead of buying Fairtrade coffee (Leclair, 2002; de Janvry
et al., 2015; Claar and Haight, 2015). Dragusanu et al. (2014) disagree, arguing that it is better
to use market-based mechanisms because direct transfers of money to farmers tend to distort
incentives and spur rent-seeking and corruption. This is also shown by Reinstein and Song,
(2012) and Podhorsky (2015) by, respectively, developing models with information

18
asymmetries and market power. However, they also show that when rosters’ and retailers’
margins are large relative to farmers’ benefits, which the results of this study indicate to be
the case, when combined with the results of recent studies of the supply side and the impact of
Fairtrade on coffee farmers,10 it might be more efficient to use direct transfers instead of
relying on the Fairtrade system. Although further research is needed, the suggestion to use
donations is unlikely to have much policy relevance, since Fairtrade is a well-known
organisation with a well-established label. A better strategy would be to improve the
functioning of the Fairtrade system. One suggestion is that roasters should declare openly on
packages how much that goes to Fairtrade cooperatives (Griffiths, 2010). This would
probably be unattractive to most roasters, but it could be adopted by those seriously engaged
in Fairtrade, increasing their market shares and boosting competition in the Fairtrade coffee
market.
Acknowledgements
I am grateful for financial support from the Swedish Competition Authority and useful
comments by Arne Bigsten, Måns Söderbom, Debbie Axlid, and seminar participants at
Swedish National Economics Conference, Umeå, 2014, Nordic Development Economics
Conference, Copenhagen, 2015, and Latin American and Caribbean Economic Association
(LACEA) annual meeting, Santa Cruz, 2015.
10 See, for example, Weber (2011), Jena et al. (2012), Dragusanu and Nunn (2014), Chiputwa et al. (2015), de Janvry et al. (2015), Minten et al. (2015) and Nelson et al. (2016).

19
References Andorfer, V. A., and U. Liebe. 2012. Research on Fair Trade Consumption—A Review. Journal of Business Ethics, 106(4), 415–435.
Basu, A. K., and Hicks, R. L. 2008. Label performance and the willingness to pay for Fair Trade coffee: a cross-national perspective. International Journal of Consumer Studies, 32(5), 470–478.
Basu, A. K., Grote, U., Hicks, R., and T. Stellmacher. 2016. Multiple Certifications and Consumer Purchase Decisions: A Case Study of Willingness to Pay for Coffee in Germany. Working Paper 2016-7, Charles H. Dyson School of Applied Economics and Management, Cornell University
Blackman, Allen, and Jorge Rivera. 2011. Producer-level benefits of sustainability certification. Conservation Biology 25(6), 1176–85.
Bukeviciute, L., A. Dierx and F. Ilzkowitz. 2009. The Functioning of the Food Supply Chain and Its Effect on Food Prices in the European Union. European Economy, Occasional Papers 47. May.
Carlsson, F., J. Garcia and Å. Löfgren. 2010. Conformity and the Demand for Environmental Goods. Environmental & Resource Economics, 47(3), 407–421.
Chiputwa, B., D.J. Spielman and M. Qaim. 2015. Food standards, certification, and poverty among coffee farmers in Uganda. World Development, 66(February), 400–412.
Claar, V. V., and C. E. Haight. 2015a. Fair Trade Coffee: Correspondence. Journal of Economic Perspectives, 29(1), 215–16.
Dammert, A. C., & Mohan, S. 2015. A Survey of the Economics of Fair Trade. Journal of Economic Surveys 29(5): 855–868
de Janvry, A., C. McIntosh and E. Sadoulet. 2015. Fairtrade and Free Entry: Can a Disequilibrium Market Serve as a Development Tool? Review of Economics and Statistics 97(3), 567–573.
Dragusanu R., D. Giovannucci and N. Nunn. 2014. The Economics of Fairtrade. Journal of Economic Perspectives 28(3), 217–36.
Dragusanu, R., and N. Nunn. 2014. The Impacts of Fair Trade Certification: Evidence from Coffee Producers in Costa Rica. Memo, Harvard University.
Durevall, D. 2003. Competition and Pricing: An Analysis of the Market for Roasted Coffee. Chap. 5 in High prices in Sweden – a result of poor competition? Swedish Competition Authority Report, Stockholm.
Durevall, D. 2007. Competition in the Swedish Coffee Market 1978-2002. International Journal of Industrial Organization 25(4), 721–739.

20
Elliott, K. 2012. Is My Fairtrade Coffee Really Fair? Trends and Challenges in Fair Trade Certification. CGD Policy Paper 017, Center for Global Development, Washington DC.
ECF. 2014. European Coffee Report 2012–13. European Coffee Federation, Brussel.
Fairtrade Foundation. 2012. Fairtrade and Coffee, Commodity Briefing, London.
Fairtrade International. 2017a. Annual Report 2015-2016. Available at https://www.fairtrade.net/about-fairtrade/annual-reports.html
Fairtrade International. 2017b. Products/coffee. Available at https://www.fairtrade.net/products/coffee.html.
Fairtrade International. 2017c. What is Fairtrade? Available at http://www.fairtrade.net/what-is-fairtrade.html
Fairtrade Sweden. 2016. Försäljningsstatistik: Officiell statistik från Fairtrade Sverige, 201 6-04 -15. https://fairtrade.se/app/uploads/2016/06/2015-Forsaljningsstatistik-for-Fairtrade-markt.pdf
Gibbon, P. 2007. Africa, Tropical Commodity Policy and the WTO Doha Round. Development Policy Review, 25(1), 43–70.
Gilbert, C. 2008. Value Chain Analysis And Market Power in Commodity Processing with Application to the Cocoa And Coffee Sectors. Commodity Market Review 2007-08, 5–38.
Griffiths, P. 2010. Lack of Rigor in Defending Fairtrade. Economic Affairs 30: 45–49.
Griffiths, P. 2012. Ethical Objections to Fairtrade. Journal of Business Ethics 105(3), 357–373.
Griffiths, P. 2014. Fairtrade: Comment on Tedeschi and Carlson. Journal of International Development 26(2), 277–289.
Griffiths, P. 2015. Marketing by Controlling Social Discourse: The Fairtrade Case. Economic Affairs, 35(2), 256–271.
Hainmueller, J., M. Hiscox, S. Sequeira. 2015. Consumer Demand for the Fairtrade Label: Evidence from a Multi-Store Field Experiment. Review of Economics and Statistics 97(2), 242–256.
Harford, T. 2012. The Undercover Economist. Oxford: Oxford University Press.
Hertel, S, L. Scruggs, and C. Heidkamp. 2009. Human Rights and Public Opinion: From Attitudes to Action. Political Science Quarterly 124 (3), 443–459.
Hiscox MJ, Broukhim M, and C. Litwin (2011). Consumer Demand for Fair Trade: New Evidence from a Field Experiment Using eBay Auctions of Fresh Roasted Coffee. Memo, Harvard University.

21
Howard, P. H. and P. Allen. 2010. Beyond Organic & Fair Trade? An Analysis of Ecolabel Preferences in the United States. Rural Sociology, 75(2), 244–269.
Jena, P. R., B. B. Chichaibelu, T. Stellmacher, and U. Grote. 2012. The impact of coffee certification on small-scale producers’ livelihoods: a case study from the Jimma Zone, Ethiopia. Agricultural Economics 43(4), 429–440.
Johannessen, S. and H. Wilhite. 2010. Who Really Benefits from Fairtrade? An Analysis of Value Distribution in Fairtrade Coffee. Globalizations 7(4), 525–544,
Kilian B, C. Jones, L. Pratt, A. Villalobos. 2006. Is Sustainable Agriculture a Viable Strategy to Improve Farm Income in Central America? A Case Study on Coffee. Journal of Business Research 59(3), 322–330.
Koppel, H., and Schulze, G. G. (2013). The importance of the indirect transfer mechanism for consumer willingness to pay for fair trade products—evidence from a natural field experiment. Journal of consumer policy, 36(4), 369-387.
Krier, J.M. 2008. Fair Trade 2007: New facts and figures from an ongoing success story. A Report on Fair Trade in 33 consumer countries. A survey prepared on behalf of DAWS – Dutch Association of Worldshops, Netherlands.
Leclair, M. 2002. Fighting the Tide: Alternative Trade Organizations in the Era of Global Free Trade. World Development 30(6), 949–958.
McCorriston, S. 2013. Competition in the Food Chain. Working Paper (11), Transparency for Food Pricing (TRANSFOP).
Mendoza, R., and J. Bastiaensen. 2003. Fair Trade and the Coffee Crisis in the Nicaraguan Segovias. Small Enterprise Development 14(2), 36–46.
Minten, B., M. Dereje, E. Engeda, and S. Tamru. 2015. Who benefits from the rapidly increasing Voluntary Sustainability Standards? Evidence from Fairtrade and Organic Certified Coffee in Ethiopia. Working Paper 71. Addis Ababa: International Food Policy Research Institute (IFPRI).
Mohan S. 2010. Fair Trade Without the Froth – A Dispassionate Economic Analysis of Fair Trade. Institute of Economic Affairs: London.
Nakamura, E., and D. Zerom. 2010. Accounting for incomplete pass-through. The Review of Economic Studies 77(3), 1192–1230.
Nelson, V., and Pound, B. 2009. The last ten years: A comprehensive review of the literature on the impact of Fairtrade. Natural Resources Institute, University of Greenwich, Chatham, UK. Nelson, V., J. Haggar, A. Martin, J. Donovan, E. Borasino, W. Hasyim, N. Mhando, M. Senga, J. Mgumia, E. Quintanar Guadarrama, Z. Kendar, J. Valdez, D. Morales. 2016. Fairtrade coffee: A study to assess the impact of Fairtrade for coffee smallholders and
22
producer organisations in Indonesia, Mexico, Peru and Tanzania. Natural Resources Institute, University of Greenwich, Chatham, UK. Oxfam. 2002. Mugged: Poverty in Your Coffee Cup. Oxfam International and Make Fair Trade, London.
Podhorsky, A. 2015. A positive analysis of Fairtrade certification. Journal of Development Economics, 116, 169–185.
Reinstein, D., and Song, J. 2012. Efficient consumer altruism and fair trade products. Journal of Economics & Management Strategy, 21(1), 213-241.
Schollenberg, L. 2012. Estimating the hedonic price for Fair Trade coffee in Sweden. British Food Journal, 114(3), 428–446.
Sellers, F. S. 2005. Gift-wrapped Guilt?, Washington Post, 18 December.
Smith, A. M. (2009). Evaluating the criticisms of Fairtrade. Economic Affairs, 29(4), 29-36.
Sutton, J. 2007. Sunk Cost and Market Structure. MIT Press, Cambridge, Massachusetts.
Swedish Competition Authority. 2011. Konkurrens och makt i den svenska livsmedelskedjan. Stockholm. Report prepared by Agrifood Economics Centre, Lund.
Talbot, J. M. 2004. Grounds for Agreement: The Political Economy of the Coffee Commodity Chain. New York, Rowman & Littlefield Publishers.
Valkila, J., P. Haaparanta and N. Niemi. 2010. Empowering Coffee Traders? The Coffee Value Chain from Nicaraguan Fairtrade Farmers to Finnish Consumers. Journal of Business Ethics 97(2), 257–270.
Van Loo, E. J., Caputo, V., Nayga, R. M., Seo, H. S., Zhang, B., & Verbeke, W. 2015. Sustainability labels on coffee: Consumer preferences, willingness-to-pay and visual attention to attributes. Ecological Economics, 118, 215–225. Wang, X. 2016. Is Fair Trade Fair for Consumers? A Hedonic Analysis of US Retail Fair Trade Coffee Prices. In 2016 Annual Meeting, July 31-August 2, 2016, Boston, Massachusetts (No. 236344). Agricultural and Applied Economics Association. Weber, J. G. 2011. How much more do growers receive for Fair Trade-organic coffee? Food Policy 36(5), 678–685.

23
Table 1. Ground coffee and bean prices, March 2009–February 2012 (USD 1 = SEK 7) Ground coffee Number Mean Median Min Max
Conventional 151 71.20 64.08 30.00 175.93 Fairtrade organic 22 107.16 90.80 69.32 185.71 Fairtrade not organic 3 121.00 95.00 82.00 186.00 Organic, not Fairtrade 12 71.69 67.54 41.02 129.44
Green beans Ordinary Fairtrade Organic Fairtrade Import price 1 kg of green beans 29.72 32.80 37.50
Cost of producing 1 kg roasted coffee 35.37 39.03 44.63 Note: The sample includes products in 250 g, 400–499 g and 500 g packages. Coffee products priced at SEK 10/kg or less have been excluded since they are only sold in large quantities. The green bean import price is from Statistics Sweden, calculated as value of imports in SEK divided by volume of imports. The price paid for beans to produce 1 kg of coffee is based on the requirement to use 1.19 kg of beans due to weight lost when roasting (ECF, 2014). Sources: Own calculations based on data from the Fairtrade Foundation (2012), Nielsen Sweden and Statistics Sweden.
Table 2. OLS regression on average price per kg of ground coffee (500 g packages)
(1)
All products (2)
No Fairtrade (3)
Only organic Dark roast 5.05 4.78 7.54 (1.97)* (1.68)* (3.99)*** Undefined roast 17.45 17.333 -5.07 (1.85)* (1.84)* (1.62) Decaffeinated 6.40 6.31 (0.31) (0.30) Private Label -11.55 -11.70 -9.72 (4.96)*** (4.76)*** (2.61)** Fairtrade organic 23.27 14.76 (11.90)*** (5.25)*** Organic, not Fairtrade 6.14 6.17 (1.74)* (1.75)* Constant 62.00 62.14 69.26 (26.03)*** (25.18)*** (22.09)*** R2 0.29 0.20 0.80 N 140 127 24
Note: Average price for 1 March 2009–26 February 2012. Robust standard errors are used. * p<0.1; ** p<0.05; *** p<0.01. USD 1= SEK 7.
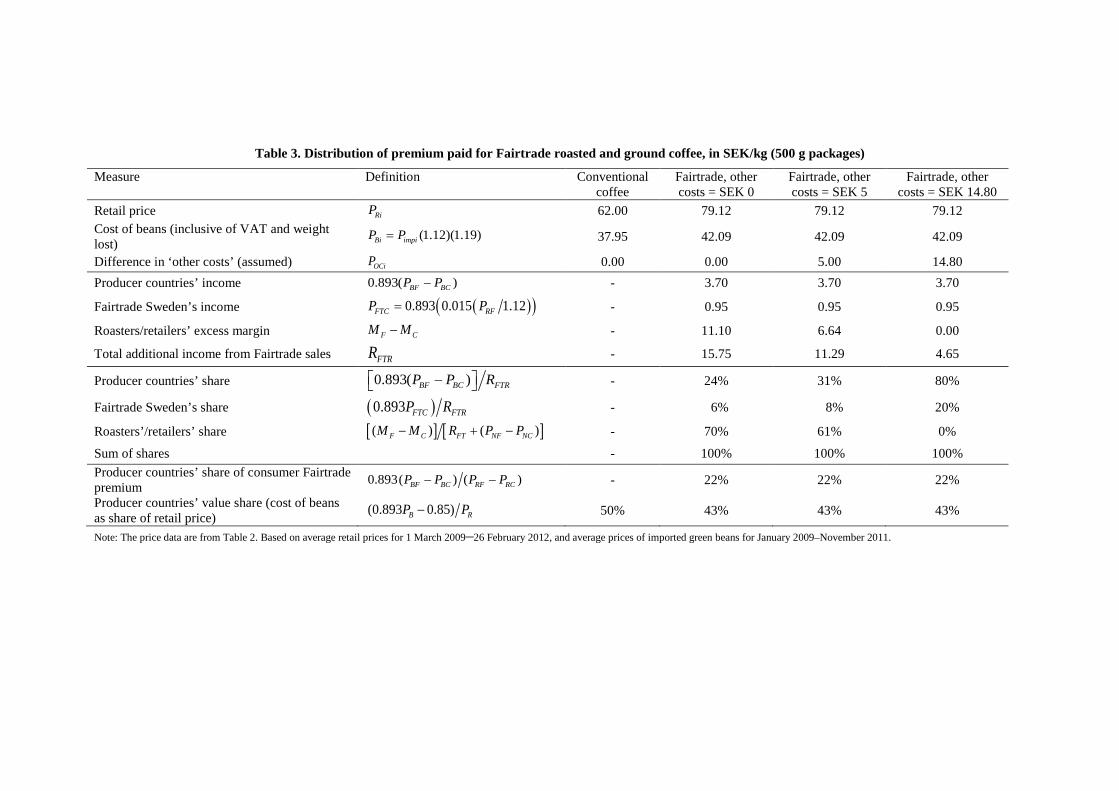
Table 3. Distribution of premium paid for Fairtrade roasted and ground coffee, in SEK/kg (500 g packages)
Measure Definition Conventional coffee
Fairtrade, other costs = SEK 0
Fairtrade, other costs = SEK 5
Fairtrade, other costs = SEK 14.80
Retail price RiP 62.00 79.12 79.12 79.12 Cost of beans (inclusive of VAT and weight lost)
(1.12)(1.19)Bi impiP P= 37.95 42.09 42.09 42.09
Difference in ‘other costs’ (assumed) OCiP 0.00 0.00 5.00 14.80 Producer countries’ income 0.893( )BF BCP P− - 3.70 3.70 3.70
Fairtrade Sweden’s income ( )( )0.893 0.015 1.12FTC RFP P= - 0.95 0.95 0.95
Roasters/retailers’ excess margin F CM M− - 11.10 6.64 0.00
Total additional income from Fairtrade sales FTRR - 15.75 11.29 4.65
Producer countries’ share 0.893( )BF BC FTRP P R − - 24% 31% 80%
Fairtrade Sweden’s share ( )0.893 FTC FTRP R - 6% 8% 20%
Roasters’/retailers’ share [ ] [ ]( ) ( )F C FT NF NCM M R P P− + − - 70% 61% 0%
Sum of shares - 100% 100% 100% Producer countries’ share of consumer Fairtrade premium 0.893( ) ( )BF BC RF RCP P P P− − - 22% 22% 22%
Producer countries’ value share (cost of beans as share of retail price) (0.893 0.85)B RP P− 50% 43% 43% 43%
Note: The price data are from Table 2. Based on average retail prices for 1 March 2009–26 February 2012, and average prices of imported green beans for January 2009–November 2011.

25
Table 4. Distribution of premium paid for organic Fairtrade roasted and ground coffee, in SEK/kg (500 g packages)
Measure Definition Conventional coffee
Fairtrade organic, other costs=0
Fairtrade organic other costs =SEK 5
Retail price RiP 62.00 85.27 85.27 Cost of beans (inclusive of VAT and weight lost)
(1.12)(1.19)Bi impiP P= 37.95 48.30 48.30
Difference in ‘other costs’ (assumed) OCiP 0.00 0.00 5.00 Producer countries’ income 0.893( )BF BCP P− - 9.25 9.25
Fairtrade Sweden’s income ( )( )0.893 0.015 1.12FTC RFP P= - 1.02 1.02
Roasters/retailers’ excess margin F CM M− - 11.60 7.90
Total additional income from Fairtrade sales FTRR - 21.90 18.15
Producer countries’ share 0.893( )BF BC FTRP P R − - 42% 51%
Fairtrade Sweden’s share ( )0.893 FTC FTRP R - 5% 6%
Roasters’/retailers’ share [ ] [ ]( ) ( )F C FT NF NCM M R P P− + − - 53% 43%
Sum of shares - 100% 100% Producer countries’ share of consumer Fairtrade premium 0.893( ) ( )BF BC RF RCP P P P− − - 40% 40%
Producer countries’ value share (cost of beans as share of retail price) (0.893 0.85)B RP P− 50% 46% 46% Note: The price data are from Table 2. Based on average retail prices for 1 March 2009–26 February 2012 and average import prices on green beans for January 2009–November 2011.

Appendix
A: Additional tables
Table A1 reports regressions with various samples to show that the findings are not likely to
be due to outliers or extrapolation, i.e. comparisons of completely different products. Five
samples are used: 250, 400–499 g, and 500 g packages; 400–499 g and 500 g packages; only
the four largest roasters; only inexpensive coffee, price < SEK 100/kg; and only coffee with
national labels.
The estimated coefficients for Fairtrade and organic coffee are similar to the ones in Table 2.
The most notable result is that the four large roasters have a somewhat higher price for the
base category (SEK 64.60 vs. SEK 62.00) and add fewer SEK to Fairtrade and organic coffee.
However, using these prices only marginally affects the distribution of shares; for instance,
roasters/retailers get 57% instead of 61% when we assume that the difference in ‘other costs’
is SEK 5/kg. Another interesting result is that coffees in 250 g and 400–499 g packages are
much more expensive than those in the standard 500 g package. However, they make up a
small and heterogeneous groups. For example, in the 250 g group there are only 23 products.
Prices range from SEK 52 to 186/kg, and the average price is SEK 51 higher per kg than the
average price of 500 g packages. The 250 g group also includes three non-organic Fairtrade
coffees, which were excluded from the sample because there are too few to provide a reliable
estimate, and there are no non-organic Fairtrade coffees in the other categories. The prices of
the three 250 g non-organic Fairtrade coffees are SEK 82, 95 and 186/kg.
The estimates of the coefficients for the control variables vary in some cases, particularly
those of decaffeinated coffee and undefined roast. This is primarily due to few observations.
Table A2 reports Fairtrade’s social premiums on world market prices of green beans,
converted into SEK per kg for the production of 1 kg of ground coffee. As is evident, there
was a sharp increase in premiums in March 2011. The values in Table A2 are used to
calculate the cost of Fairtrade beans in Tables 3 and 4.
27
Table A1. OLS regressions on average price of ground coffee, various samples (USD 1 = SEK 7)
250–500 g
packages 400 g–500 g
packages Four large
roasters only (400–500 g)
Only with price <SEK 100/kg (400–500 g)
No private label
Dark roast 8.474 6.921 5.183 6.129 6.796 (3.43)*** (2.80)*** (2.06)** (2.61)** (2.27)** Undefined roast 20.408 20.478 -7.766 7.344 22.440 (2.69)*** (2.32)* (3.91)*** (1.20) (2.41)** Decaffeinated 7.182 1.442 0.639 7.786 1.733 (0.58) (0.09) (0.25) (0.64) (0.11) Private Label -14.026 -10.843 -10.957 (5.62)*** (4.62)*** (5.06)*** 250 g 51.594 (10.18)*** 400–499 g 22.734 24.277 12.792 15.962 24.369 (5.36)*** (5.63)*** (3.90)*** (4.83)*** (5.59)*** Fairtrade Organic 27.629 26.780 21.631 23.412 27.241 (7.92)*** (7.52)*** (9.19)*** (12.17)*** (6.60)*** Organic only 7.342 6.907 5.935 7.025 4.373 (2.00)** (1.96)* (2.05)** (2.23)** (0.82) Constant 60.768 60.580 64.642 61.347 60.449 (26.27)*** (25.48)*** (29.39)*** (26.83)*** (23.39)*** R2 0.64 0.42 0.44 0.38 0.34 N 182 162 65 155 124
Note: Average price for 1 March 2009–26 February 2012. Products with price below SEK 10/kg and three Fairtrade non-organic products in 250 g packages are excluded. Robust standard errors are used. * p<0.1; ** p<0.05; *** p<0.01.
Table A2. Fairtrade coffee social premiums in SEK/kg (washed Arabica), inclusive of weight lost due to roasting (USD 1 = SEK 7.00).
Up to March 2011 From April 2011 Fairtrade social premium 1.85
3.70
Organic beans social premium 3.70
5.55 Sum 5.55
9.25
B: Calculations of shares
It is straightforward, in principle, to calculate how the premium paid for Fairtrade coffee is
distributed, though it involves a number of steps. The key issues are how to treat VAT, which
is the share that goes to the government in the form of tax, and what to assume about potential
differences in production costs between Fairtrade and conventional coffee, in addition to the
cost of beans and licence fees.
28
In the calculations described below all prices and costs are measured inclusive of VAT. In
Sweden, VAT on food is 12%, i.e. 10.7% of the price inclusive of VAT. It is 25% on other
products relevant for the study, which equals 20% of the price inclusive of VAT. All prices
and costs are in SEK per kg of coffee. USD 1 is about SEK 7.
- Roasters’/retailers’ margin, Mi, on 1 kg of roasted and ground conventional or
Fairtrade coffee is
(0.107 0.107 0.107 0.2 ) ,i Ri Ri Bi FTC OCi Bi FTC OiM P P P P P P P P= − − − − − − −
where i is C for conventional coffee and F for Fairtrade coffee, RiP is retail price, BiP
is the bean price adjusted for weight lost when roasting, FTCP is the roasters’ cost for
Fairtrade certification and OiP is ‘other costs’. Based on an analysis of wholesale
prices and the cost of beans, I use SEK 5 as the maximum difference in ‘other cost’
between Fairtrade and conventional coffee, which is likely to be much higher than the
actual difference in ‘other costs’. Roasters’/retailers’ margin is thus the retail price
minus costs and net payments of VAT (the terms in parentheses).
- Import price for beans inclusive of VAT and weight lost is 1.19 ,Bi impiP P= where impiP
is the border price of conventional or Fairtrade green beans and 1.19 is adjustment due
to weight lost (ECF, 2014).
- Producer countries’ income from sales of Fairtrade beans is 0.893( ),BF BCP P− where
0.893 removes the VAT from the difference in prices of Fairtrade and conventional
beans.
- Fairtrade Sweden’s income from the certification fee is ( )0.893 0.015*0.893FTC RFP P= .
Fairtrade Sweden gets the net of VAT value of SEK 0.015 of the retail price net of
VAT.
- Roasters/retailers’ excess margin from sales of Fairtrade coffee is ,F CM M− i.e. the
difference between the margins from sales of Fairtrade and conventional coffee.
- Total additional income from Fairtrade retail sales is
0.893( ) ( ).FTR FTC BF BC F CR P P P M M= + − + − It is made up of the licence fee plus the
income of the producer country and roasters/retailers’ excess margin from sales of

29
Fairtrade coffee. The income going to the government is ignored as VAT is small and
uncertain.
- Producer countries’ share of the total additional income from Fairtrade retail sales
0.893( ) .BF BC FTRP P R −
- Fairtrade Sweden’s share of the total additional income from Fairtrade retail sales :
.FTC FTRP R
- Roasters’/retailers’ share of the total additional value of Fairtrade retail sales:
( ) .F C FTRM M R−
- Producer countries’ share of the difference between Fairtrade and conventional retail
prices is 0.893( ) ( ).BF BC RF RCP P P P− −
- Producer countries’ value share is the cost of beans used to produce 1 kg of coffee, net
of freight and insurance costs (SEK 0.85), divided by the retail price:
(0.893 0.85) .B RP P−