Embed Size (px)
Citation preview
Philippine Journal of DevelopmentNumber 59, First Semester 2005, Volume XXXII, No. 1
* Senior Research Fellow and Consultant, respectively, Philippine Institute for Development Studies. Theauthors may be contacted at [email protected] and [email protected].
Who Are Opposed to Free Trade in thePhilippines?
GLORIA O. PASADILLA AND CHRISTINE MARIE M. LIAO*
ABSTRACTIn a democratic country, economic policies succeed or fail dependingon the political support they receive. Open trade policies that wereinitiated and accepted years ago can be reversed in accordance withthe government's free trade conviction and popular pressure. How-ever, popular pressure for or against open trade is affected by otherfactors. This paper attempts to link these factors with individualpreferences toward either more protectionism or greater trade liber-alization. Using ordered logit estimation of thousands of survey data,the paper finds that gender, economic class, and urban populationnegatively correlate with pro-trade attitudes in the Philippines. It alsonotes that the effect of some of the demographic variables on protec-tionist sentiment is markedly different from their effects among moredeveloped Western nations.
Filipinos as a people are very open to strangers and foreigners. They takepride in their so-called "Filipino hospitality," where they try to makevisitors feel at home and comfortable, even, at times, at great personalcost. But when it comes to trade, the Philippines is, ironically, relatively
closed. For instance, based on the average most-favored-nation (MFN) tariffs,the Philippines is no match to its ASEAN neighbors Singapore, Brunei, andMalaysia—countries that have relatively low mean and median tariff rates. Rather,the Philippines is among those with an average MFN rate higher than 10 percent.
PHILIPPINE JOURNAL OF DEVELOPMENT 20052
A scan of local newspaper articles shows a strong undercurrent of anti-globaliza-tion sentiment, especially among those who belong to certain sectors of society.Faced with this tendency toward protection, it would be worthwhile to examinewhat lies behind certain people's protectionist ideals. What are the traits that leadparticular persons to be more anti-globalization than others?
This paper attempts to determine the characteristics that make individualseither more protectionist or more open to free trade. It examines the issue throughan ordered logit approach using data from the 2003 International Social SurveyProgramme (ISSP) national survey in the Philippines. The survey asks 1,200respondents how they feel about limiting foreign imports. These responses arethen correlated with their demographic characteristics to establish some linkageswith individual trade policy preferences.
The number of studies that relate demographic characteristics to trade hasactually increased since survey data have been made more widely available inrecent years, but none have yet been applied specifically to the Philippine case.Mayda and Rodrik (2001) and O'Rourke and Sinnott (2001) use similar survey datain 1995 across several countries to run huge panel data regressions and find thatpersonal characteristics such as gender, age, and social status are significant inexplaining trade policy preferences. Using various country survey data, Scheveand Slaughter (2001) for the United States, Pasadilla (2002) for Switzerland, andBalistreri (1997) for Canada all find that noneconomic variables significantlyexplain their trade-related results.
A demographic understanding of how individual incentives and characteristicsaffect trade policy choices is important, especially for policymakers. If they believe inthe virtues of free trade, as many economists do, an understanding of how the generalpublic's trade opinion is formed can help policymakers cater their pitches to the righttarget groups and thus better gather support for trade liberalization programs.
The next section provides a background on the role of trade preferences.Section 3 expounds on the data and methodology employed in this study as wellas briefly describes the theory behind the use of demographic and institutionalvariables. Section 4 presents the results of the empirical work, and Section 5presents the conclusions.
BACKGROUNDEconomists tend to construct economic models that ignore political and institu-tional realities. This perhaps explains why only economists nearly unanimouslyextol the desirability of free trade.1 The reality is that there are but a few economies
1 In a 1992 study by Alston et al., more than 90 percent of economists who responded indicated a beliefthat different trade barriers reduce general economic welfare.
PASADILLA AND LIAO 3
in the world, e.g., Singapore and Hong Kong, that have trade policies close towhat economics textbooks preach. The majority pose some form of trade protec-tion, either through the imposition of positive tariffs or through other nontariffbarriers such as liberal anti-dumping policies, dubious standards requirements,and quotas.
The existence of political considerations can explain why free trade is virtu-ally nonexistent. In some policy models, the trade policy that is adopted may notbe the economically optimal one but it is what clears the political market. Thepolitical market consists of those that demand certain types of trade policy (e.g.,interest group and businessmen) and those that supply it (i.e., policymakers undera given institutional structure). The policy that results is the outcome of thedemand and supply, in much the same way as price is the result of the demand andsupply of a commodity in a traditional economic market. This "political equilib-rium" may be found in trade policies that create distortions. In usual economicparlance, these are considered economic inefficiencies, but they persist as long asthey cause the political market to clear.
As in the traditional goods market, individual preferences for particulartrade policies ultimately affect demand for certain types of policies. If certaintypes of individuals prefer good A over good B in the goods market, so dodifferent types of individuals prefer certain forms of trade policies over others inthe political market.
This paper modestly contributes to this rich literature by describing thecharacteristics of individuals that would have particular preferences for or againsttrade openness in the Philippines.
DATA AND METHODOLOGYThis section presents the ordered logit model regression that maps different indi-vidual characteristics to explain the probability of an individual being pro- or anti-trade. First, it discusses the basic characteristics of the data, particularly the mainvariable—the protect variable (as explained below). It then proceeds to discuss themethodological framework, the construction of variables, and the analysis of results.
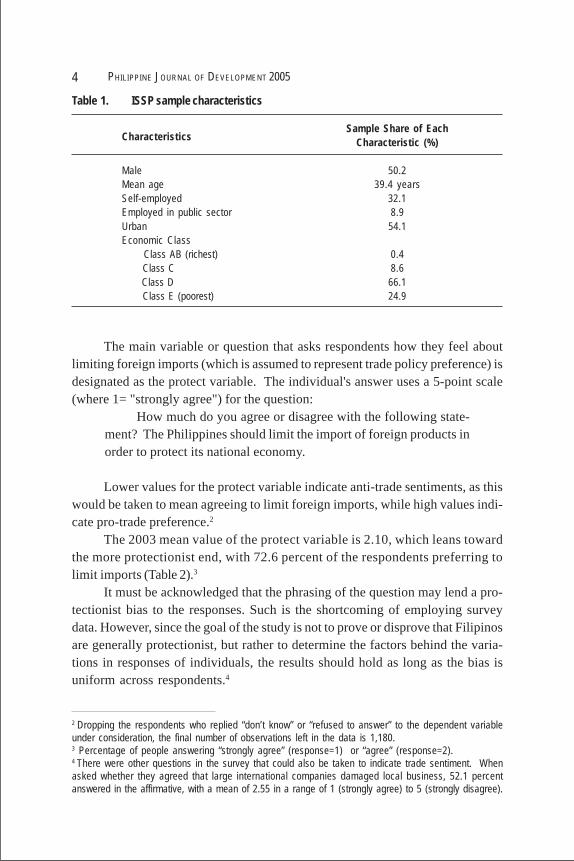
Survey data, economic condition, and trade preferenceThe Social Weather Station (SWS) used multistage probability sampling to selectthe 1,200 voting-age (i.e., 18 years old and above) respondents for the survey.Covering the entire Philippines, the research body targeted 300 individuals eachfrom the National Capital Region (NCR), and the main islands of Luzon (excludingNCR), Visayas, and Mindanao. The questionnaire contained more than 100 ques-tions, but this subsection will discuss only the major policy variables. Table 1presents the salient characteristics of the 2003 sample.
PHILIPPINE JOURNAL OF DEVELOPMENT 20054
Table 1. ISSP sample characteristics
Sample Share of EachCharacteristic (%)
Male 50.2Mean age 39.4 yearsSelf-employed 32.1Employed in public sector 8.9Urban 54.1Economic Class Class AB (richest) 0.4 Class C 8.6 Class D 66.1 Class E (poorest) 24.9
Characteristics
The main variable or question that asks respondents how they feel aboutlimiting foreign imports (which is assumed to represent trade policy preference) isdesignated as the protect variable. The individual's answer uses a 5-point scale(where 1= "strongly agree") for the question:
How much do you agree or disagree with the following state-ment? The Philippines should limit the import of foreign products inorder to protect its national economy.
Lower values for the protect variable indicate anti-trade sentiments, as thiswould be taken to mean agreeing to limit foreign imports, while high values indi-cate pro-trade preference.2
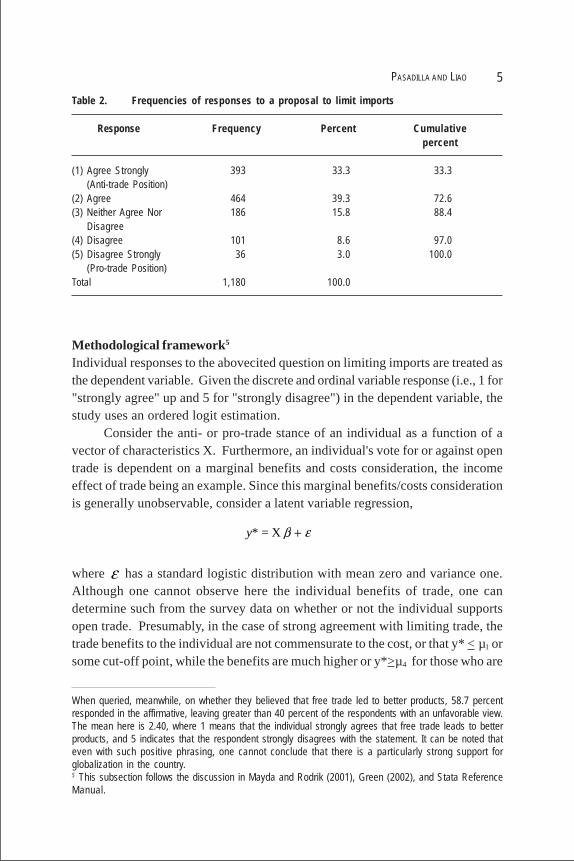
The 2003 mean value of the protect variable is 2.10, which leans towardthe more protectionist end, with 72.6 percent of the respondents preferring tolimit imports (Table 2).3
It must be acknowledged that the phrasing of the question may lend a pro-tectionist bias to the responses. Such is the shortcoming of employing surveydata. However, since the goal of the study is not to prove or disprove that Filipinosare generally protectionist, but rather to determine the factors behind the varia-tions in responses of individuals, the results should hold as long as the bias isuniform across respondents.4
2 Dropping the respondents who replied “don’t know” or “refused to answer” to the dependent variableunder consideration, the final number of observations left in the data is 1,180.3 Percentage of people answering “strongly agree” (response=1) or “agree” (response=2).4 There were other questions in the survey that could also be taken to indicate trade sentiment. Whenasked whether they agreed that large international companies damaged local business, 52.1 percentanswered in the affirmative, with a mean of 2.55 in a range of 1 (strongly agree) to 5 (strongly disagree).
PASADILLA AND LIAO 5
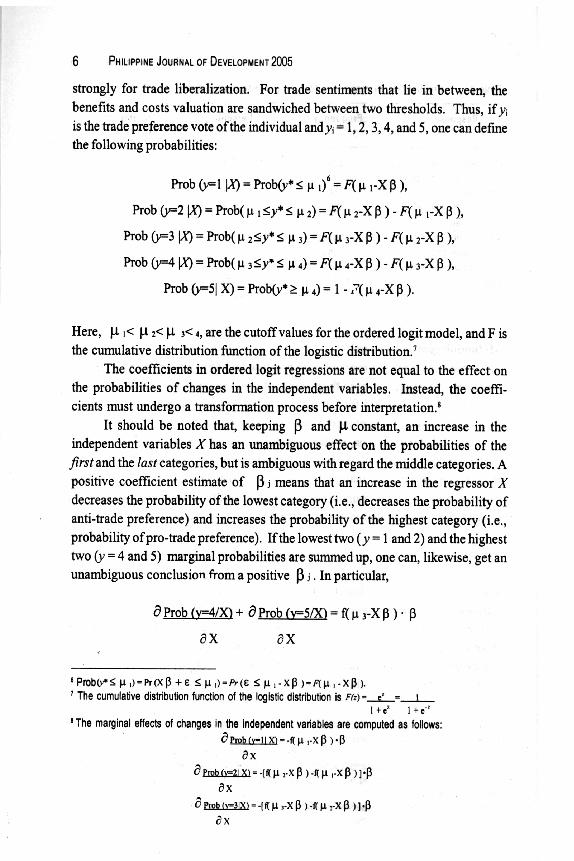
Methodological framework5
Individual responses to the abovecited question on limiting imports are treated asthe dependent variable. Given the discrete and ordinal variable response (i.e., 1 for"strongly agree" up and 5 for "strongly disagree") in the dependent variable, thestudy uses an ordered logit estimation.
Consider the anti- or pro-trade stance of an individual as a function of avector of characteristics X. Furthermore, an individual's vote for or against opentrade is dependent on a marginal benefits and costs consideration, the incomeeffect of trade being an example. Since this marginal benefits/costs considerationis generally unobservable, consider a latent variable regression,
where ε has a standard logistic distribution with mean zero and variance one.Although one cannot observe here the individual benefits of trade, one candetermine such from the survey data on whether or not the individual supportsopen trade. Presumably, in the case of strong agreement with limiting trade, thetrade benefits to the individual are not commensurate to the cost, or that y* < µ1 orsome cut-off point, while the benefits are much higher or y*>µ4 for those who are
Table 2. Frequencies of responses to a proposal to limit imports
Response Frequency Percent Cumulativepercent
(1) Agree Strongly 393 33.3 33.3(Anti-trade Position)
(2) Agree 464 39.3 72.6(3) Neither Agree Nor 186 15.8 88.4
Disagree(4) Disagree 101 8.6 97.0(5) Disagree Strongly 36 3.0 100.0
(Pro-trade Position)Total 1,180 100.0
When queried, meanwhile, on whether they believed that free trade led to better products, 58.7 percentresponded in the affirmative, leaving greater than 40 percent of the respondents with an unfavorable view.The mean here is 2.40, where 1 means that the individual strongly agrees that free trade leads to betterproducts, and 5 indicates that the respondent strongly disagrees with the statement. It can be noted thateven with such positive phrasing, one cannot conclude that there is a particularly strong support forglobalization in the country.5 This subsection follows the discussion in Mayda and Rodrik (2001), Green (2002), and Stata ReferenceManual.
y* = X +β ε
PASADILLA AND LIAO 7
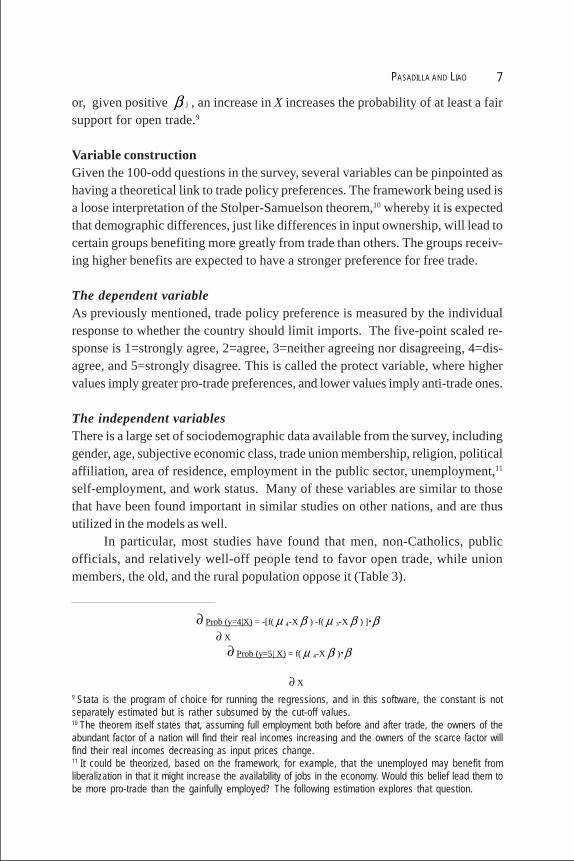
or, given positive β j , an increase in X increases the probability of at least a fairsupport for open trade.9
Variable constructionGiven the 100-odd questions in the survey, several variables can be pinpointed ashaving a theoretical link to trade policy preferences. The framework being used isa loose interpretation of the Stolper-Samuelson theorem,10 whereby it is expectedthat demographic differences, just like differences in input ownership, will lead tocertain groups benefiting more greatly from trade than others. The groups receiv-ing higher benefits are expected to have a stronger preference for free trade.
The dependent variableAs previously mentioned, trade policy preference is measured by the individualresponse to whether the country should limit imports. The five-point scaled re-sponse is 1=strongly agree, 2=agree, 3=neither agreeing nor disagreeing, 4=dis-agree, and 5=strongly disagree. This is called the protect variable, where highervalues imply greater pro-trade preferences, and lower values imply anti-trade ones.
The independent variablesThere is a large set of sociodemographic data available from the survey, includinggender, age, subjective economic class, trade union membership, religion, politicalaffiliation, area of residence, employment in the public sector, unemployment,11
self-employment, and work status. Many of these variables are similar to thosethat have been found important in similar studies on other nations, and are thusutilized in the models as well.
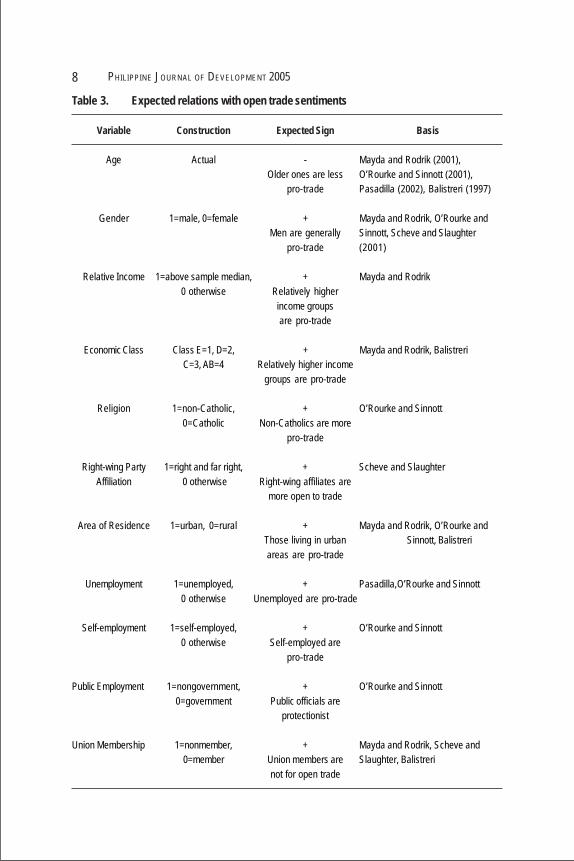
In particular, most studies have found that men, non-Catholics, publicofficials, and relatively well-off people tend to favor open trade, while unionmembers, the old, and the rural population oppose it (Table 3).
9 Stata is the program of choice for running the regressions, and in this software, the constant is notseparately estimated but is rather subsumed by the cut-off values.10 The theorem itself states that, assuming full employment both before and after trade, the owners of theabundant factor of a nation will find their real incomes increasing and the owners of the scarce factor willfind their real incomes decreasing as input prices change.11 It could be theorized, based on the framework, for example, that the unemployed may benefit fromliberalization in that it might increase the availability of jobs in the economy. Would this belief lead them tobe more pro-trade than the gainfully employed? The following estimation explores that question.
.
.
∂ X
∂ Prob (y=4|X) = -[f( μ 4-X β ) -f( μ 3-X β ) ] β
∂ X
∂ Prob (y=5| X) = f( μ 4-X β ) β
PHILIPPINE JOURNAL OF DEVELOPMENT 20058
Table 3. Expected relations with open trade sentiments
Variable Construction Expected Sign Basis
Age Actual - Mayda and Rodrik (2001),Older ones are less O’Rourke and Sinnott (2001),
pro-trade Pasadilla (2002), Balistreri (1997)
Gender 1=male, 0=female + Mayda and Rodrik, O’Rourke andMen are generally Sinnott, Scheve and Slaughter
pro-trade (2001)
Relative Income 1=above sample median, + Mayda and Rodrik0 otherwise Relatively higher
income groupsare pro-trade
Economic Class Class E=1, D=2, + Mayda and Rodrik, BalistreriC=3, AB=4 Relatively higher income
groups are pro-trade
Religion 1=non-Catholic, + O’Rourke and Sinnott0=Catholic Non-Catholics are more
pro-trade
Right-wing Party 1=right and far right, + Scheve and SlaughterAffiliation 0 otherwise Right-wing affiliates are
more open to trade
Area of Residence 1=urban, 0=rural + Mayda and Rodrik, O’Rourke andThose living in urban Sinnott, Balistreriareas are pro-trade
Unemployment 1=unemployed, + Pasadilla,O’Rourke and Sinnott0 otherwise Unemployed are pro-trade
Self-employment 1=self-employed, + O’Rourke and Sinnott0 otherwise Self-employed are
pro-trade
Public Employment 1=nongovernment, + O’Rourke and Sinnott0=government Public officials are
protectionist
Union Membership 1=nonmember, + Mayda and Rodrik, Scheve and0=member Union members are Slaughter, Balistreri
not for open trade
PASADILLA AND LIAO 9
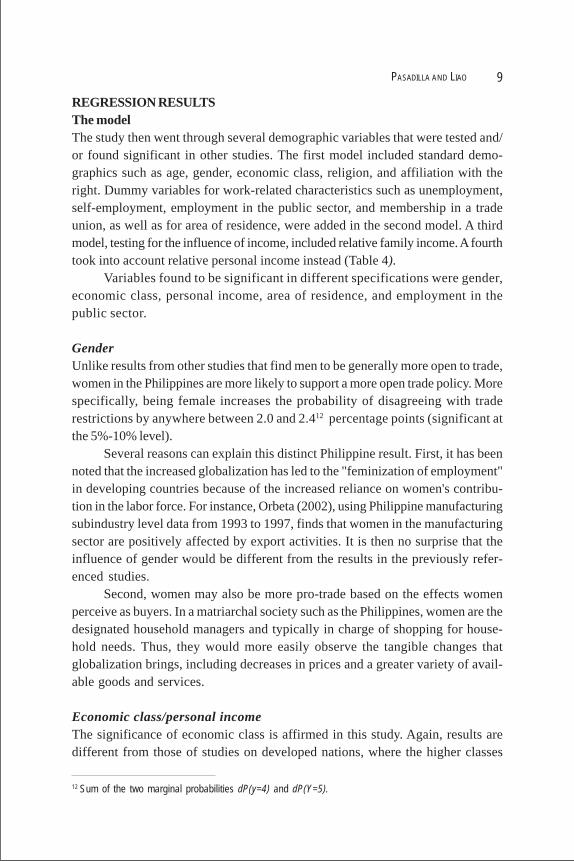
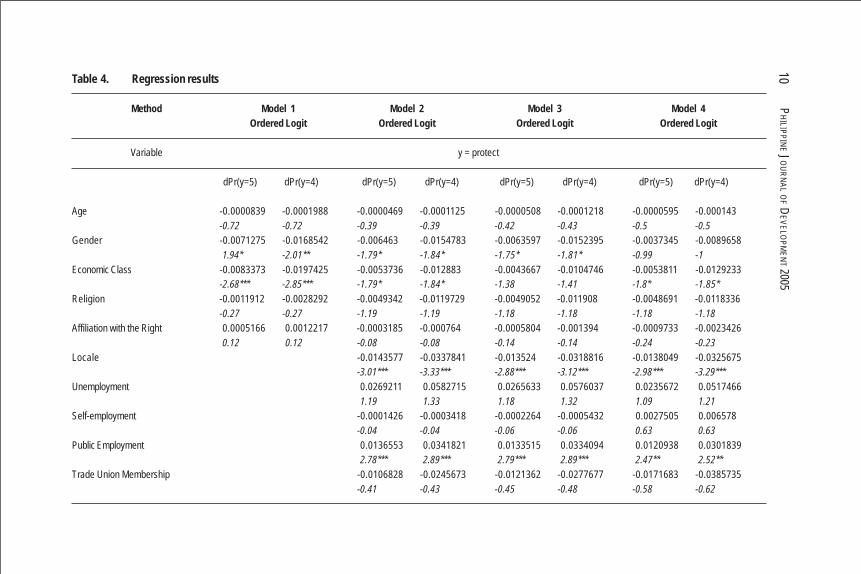
REGRESSION RESULTSThe modelThe study then went through several demographic variables that were tested and/or found significant in other studies. The first model included standard demo-graphics such as age, gender, economic class, religion, and affiliation with theright. Dummy variables for work-related characteristics such as unemployment,self-employment, employment in the public sector, and membership in a tradeunion, as well as for area of residence, were added in the second model. A thirdmodel, testing for the influence of income, included relative family income. A fourthtook into account relative personal income instead (Table 4).
Variables found to be significant in different specifications were gender,economic class, personal income, area of residence, and employment in thepublic sector.
GenderUnlike results from other studies that find men to be generally more open to trade,women in the Philippines are more likely to support a more open trade policy. Morespecifically, being female increases the probability of disagreeing with traderestrictions by anywhere between 2.0 and 2.412 percentage points (significant atthe 5%-10% level).
Several reasons can explain this distinct Philippine result. First, it has beennoted that the increased globalization has led to the "feminization of employment"in developing countries because of the increased reliance on women's contribu-tion in the labor force. For instance, Orbeta (2002), using Philippine manufacturingsubindustry level data from 1993 to 1997, finds that women in the manufacturingsector are positively affected by export activities. It is then no surprise that theinfluence of gender would be different from the results in the previously refer-enced studies.
Second, women may also be more pro-trade based on the effects womenperceive as buyers. In a matriarchal society such as the Philippines, women are thedesignated household managers and typically in charge of shopping for house-hold needs. Thus, they would more easily observe the tangible changes thatglobalization brings, including decreases in prices and a greater variety of avail-able goods and services.
Economic class/personal incomeThe significance of economic class is affirmed in this study. Again, results aredifferent from those of studies on developed nations, where the higher classes
12 Sum of the two marginal probabilities dP(y=4) and dP(Y=5).
PH
ILIPP
INE J
OU
RN
AL O
F DE
VE
LOP
ME
NT 2005
10Table 4. Regression results
Method Model 1 Model 2 Model 3 Model 4Ordered Logit Ordered Logit Ordered Logit Ordered Logit
Variable y = protect
dPr(y=5) dPr(y=4) dPr(y=5) dPr(y=4) dPr(y=5) dPr(y=4) dPr(y=5) dPr(y=4)
Age -0.0000839 -0.0001988 -0.0000469 -0.0001125 -0.0000508 -0.0001218 -0.0000595 -0.000143-0.72 -0.72 -0.39 -0.39 -0.42 -0.43 -0.5 -0.5
Gender -0.0071275 -0.0168542 -0.006463 -0.0154783 -0.0063597 -0.0152395 -0.0037345 -0.00896581.94* -2.01** -1.79* -1.84* -1.75* -1.81* -0.99 -1
Economic Class -0.0083373 -0.0197425 -0.0053736 -0.012883 -0.0043667 -0.0104746 -0.0053811 -0.0129233-2.68*** -2.85*** -1.79* -1.84* -1.38 -1.41 -1.8* -1.85*
Religion -0.0011912 -0.0028292 -0.0049342 -0.0119729 -0.0049052 -0.011908 -0.0048691 -0.0118336-0.27 -0.27 -1.19 -1.19 -1.18 -1.18 -1.18 -1.18
Affiliation with the Right 0.0005166 0.0012217 -0.0003185 -0.000764 -0.0005804 -0.001394 -0.0009733 -0.00234260.12 0.12 -0.08 -0.08 -0.14 -0.14 -0.24 -0.23
Locale -0.0143577 -0.0337841 -0.013524 -0.0318816 -0.0138049 -0.0325675-3.01*** -3.33*** -2.88*** -3.12*** -2.98*** -3.29***
Unemployment 0.0269211 0.0582715 0.0265633 0.0576037 0.0235672 0.05174661.19 1.33 1.18 1.32 1.09 1.21
Self-employment -0.0001426 -0.0003418 -0.0002264 -0.0005432 0.0027505 0.006578-0.04 -0.04 -0.06 -0.06 0.63 0.63
Public Employment 0.0136553 0.0341821 0.0133515 0.0334094 0.0120938 0.03018392.78*** 2.89*** 2.79*** 2.89*** 2.47** 2.52**
Trade Union Membership -0.0106828 -0.0245673 -0.0121362 -0.0277677 -0.0171683 -0.0385735-0.41 -0.43 -0.45 -0.48 -0.58 -0.62
PA
SADILLA AN
D LIAO
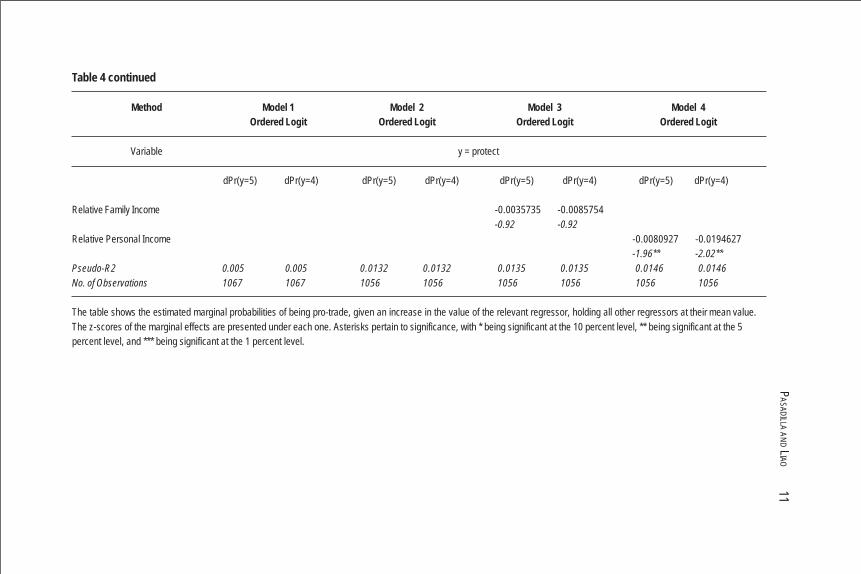
11Table 4 continued
Method Model 1 Model 2 Model 3 Model 4Ordered Logit Ordered Logit Ordered Logit Ordered Logit
Variable y = protect
dPr(y=5) dPr(y=4) dPr(y=5) dPr(y=4) dPr(y=5) dPr(y=4) dPr(y=5) dPr(y=4)
Relative Family Income -0.0035735 -0.0085754-0.92 -0.92
Relative Personal Income -0.0080927 -0.0194627-1.96** -2.02**
Pseudo-R2 0.005 0.005 0.0132 0.0132 0.0135 0.0135 0.0146 0.0146No. of Observations 1067 1067 1056 1056 1056 1056 1056 1056
The table shows the estimated marginal probabilities of being pro-trade, given an increase in the value of the relevant regressor, holding all other regressors at their mean value.The z-scores of the marginal effects are presented under each one. Asterisks pertain to significance, with * being significant at the 10 percent level, ** being significant at the 5percent level, and *** being significant at the 1 percent level.
PHILIPPINE JOURNAL OF DEVELOPMENT 200512
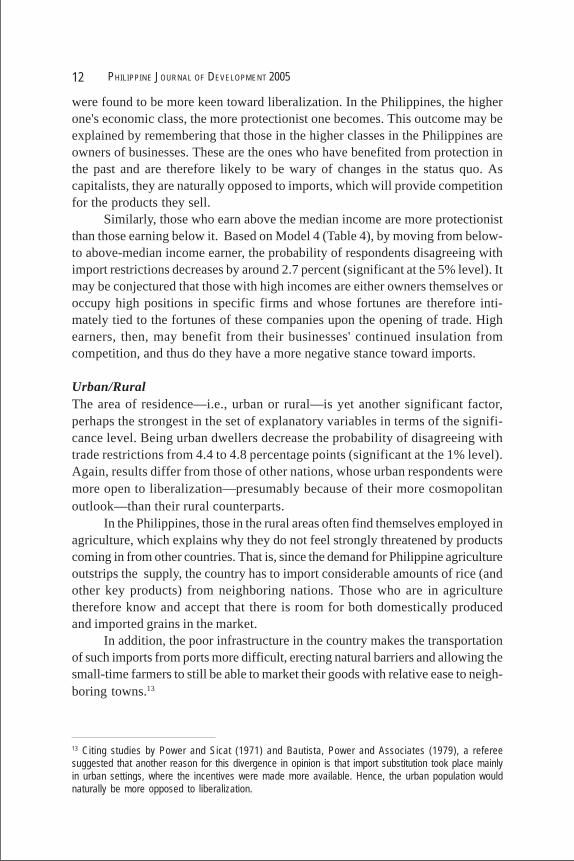
were found to be more keen toward liberalization. In the Philippines, the higherone's economic class, the more protectionist one becomes. This outcome may beexplained by remembering that those in the higher classes in the Philippines areowners of businesses. These are the ones who have benefited from protection inthe past and are therefore likely to be wary of changes in the status quo. Ascapitalists, they are naturally opposed to imports, which will provide competitionfor the products they sell.
Similarly, those who earn above the median income are more protectionistthan those earning below it. Based on Model 4 (Table 4), by moving from below-to above-median income earner, the probability of respondents disagreeing withimport restrictions decreases by around 2.7 percent (significant at the 5% level). Itmay be conjectured that those with high incomes are either owners themselves oroccupy high positions in specific firms and whose fortunes are therefore inti-mately tied to the fortunes of these companies upon the opening of trade. Highearners, then, may benefit from their businesses' continued insulation fromcompetition, and thus do they have a more negative stance toward imports.
Urban/RuralThe area of residence—i.e., urban or rural—is yet another significant factor,perhaps the strongest in the set of explanatory variables in terms of the signifi-cance level. Being urban dwellers decrease the probability of disagreeing withtrade restrictions from 4.4 to 4.8 percentage points (significant at the 1% level).Again, results differ from those of other nations, whose urban respondents weremore open to liberalization—presumably because of their more cosmopolitanoutlook—than their rural counterparts.
In the Philippines, those in the rural areas often find themselves employed inagriculture, which explains why they do not feel strongly threatened by productscoming in from other countries. That is, since the demand for Philippine agricultureoutstrips the supply, the country has to import considerable amounts of rice (andother key products) from neighboring nations. Those who are in agriculturetherefore know and accept that there is room for both domestically producedand imported grains in the market.
In addition, the poor infrastructure in the country makes the transportationof such imports from ports more difficult, erecting natural barriers and allowing thesmall-time farmers to still be able to market their goods with relative ease to neigh-boring towns.13
13 Citing studies by Power and Sicat (1971) and Bautista, Power and Associates (1979), a refereesuggested that another reason for this divergence in opinion is that import substitution took place mainlyin urban settings, where the incentives were made more available. Hence, the urban population wouldnaturally be more opposed to liberalization.
PASADILLA AND LIAO 13
EmploymentEmployment in the public sector makes a person more protectionist, decreasingthe probability of disagreeing with trade restrictions by 4.7 percentage points,again significant at the 1 percent level and robust across various models. Oneimportant implication of the removal of trade barriers is the reduction in govern-ment revenues. With roughly 20 percent of government income coming fromimport taxes and other import duties, a drop in resources will negatively affectthose employed by the public sector, mainly because the most likely reaction toreduced funds is the trimming of the bureaucracy. Second, it can also be positedthat trade barriers bestow government employees a certain amount of power,especially if they are recipients of requests with regard trade protection. Tradebarriers allow public employees some rent-seeking behavior. Such employeeswould therefore not want to allow any breakdown in trade regulation to take awaytheir influence as bureaucratic middlemen.
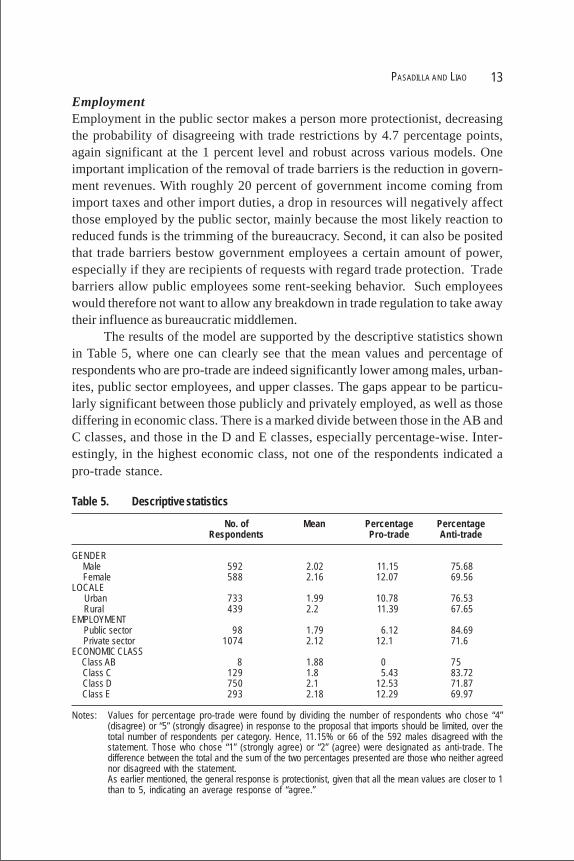
The results of the model are supported by the descriptive statistics shownin Table 5, where one can clearly see that the mean values and percentage ofrespondents who are pro-trade are indeed significantly lower among males, urban-ites, public sector employees, and upper classes. The gaps appear to be particu-larly significant between those publicly and privately employed, as well as thosediffering in economic class. There is a marked divide between those in the AB andC classes, and those in the D and E classes, especially percentage-wise. Inter-estingly, in the highest economic class, not one of the respondents indicated apro-trade stance.
Table 5. Descriptive statistics
No. of Mean Percentage PercentageRespondents Pro-trade Anti-trade
GENDER Male 592 2.02 11.15 75.68 Female 588 2.16 12.07 69.56LOCALE Urban 733 1.99 10.78 76.53 Rural 439 2.2 11.39 67.65EMPLOYMENT Public sector 98 1.79 6.12 84.69 Private sector 1074 2.12 12.1 71.6ECONOMIC CLASS Class AB 8 1.88 0 75 Class C 129 1.8 5.43 83.72 Class D 750 2.1 12.53 71.87 Class E 293 2.18 12.29 69.97
Notes: Values for percentage pro-trade were found by dividing the number of respondents who chose “4”(disagree) or “5” (strongly disagree) in response to the proposal that imports should be limited, over thetotal number of respondents per category. Hence, 11.15% or 66 of the 592 males disagreed with thestatement. Those who chose “1” (strongly agree) or “2” (agree) were designated as anti-trade. Thedifference between the total and the sum of the two percentages presented are those who neither agreednor disagreed with the statement.As earlier mentioned, the general response is protectionist, given that all the mean values are closer to 1than to 5, indicating an average response of “agree.”
PHILIPPINE JOURNAL OF DEVELOPMENT 200514
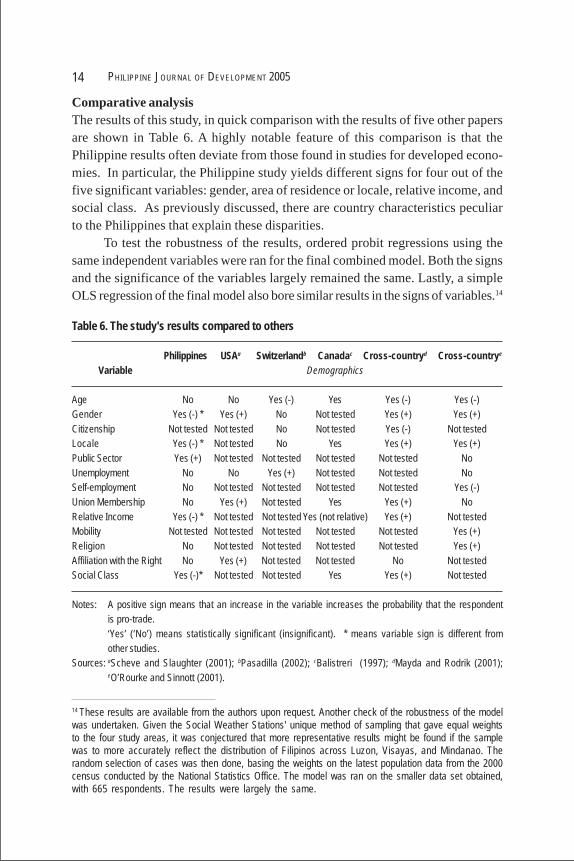
Comparative analysisThe results of this study, in quick comparison with the results of five other papersare shown in Table 6. A highly notable feature of this comparison is that thePhilippine results often deviate from those found in studies for developed econo-mies. In particular, the Philippine study yields different signs for four out of thefive significant variables: gender, area of residence or locale, relative income, andsocial class. As previously discussed, there are country characteristics peculiarto the Philippines that explain these disparities.
To test the robustness of the results, ordered probit regressions using thesame independent variables were ran for the final combined model. Both the signsand the significance of the variables largely remained the same. Lastly, a simpleOLS regression of the final model also bore similar results in the signs of variables.14
14 These results are available from the authors upon request. Another check of the robustness of the modelwas undertaken. Given the Social Weather Stations' unique method of sampling that gave equal weightsto the four study areas, it was conjectured that more representative results might be found if the samplewas to more accurately reflect the distribution of Filipinos across Luzon, Visayas, and Mindanao. Therandom selection of cases was then done, basing the weights on the latest population data from the 2000census conducted by the National Statistics Office. The model was ran on the smaller data set obtained,with 665 respondents. The results were largely the same.
Table 6. The study's results compared to others
Philippines USAa Switzerlandb Canadac Cross-countryd Cross-countrye
Variable Demographics
Age No No Yes (-) Yes Yes (-) Yes (-)Gender Yes (-) * Yes (+) No Not tested Yes (+) Yes (+)Citizenship Not tested Not tested No Not tested Yes (-) Not testedLocale Yes (-) * Not tested No Yes Yes (+) Yes (+)Public Sector Yes (+) Not tested Not tested Not tested Not tested NoUnemployment No No Yes (+) Not tested Not tested NoSelf-employment No Not tested Not tested Not tested Not tested Yes (-)Union Membership No Yes (+) Not tested Yes Yes (+) NoRelative Income Yes (-) * Not tested Not tested Yes (not relative) Yes (+) Not testedMobility Not tested Not tested Not tested Not tested Not tested Yes (+)Religion No Not tested Not tested Not tested Not tested Yes (+)Affiliation with the Right No Yes (+) Not tested Not tested No Not testedSocial Class Yes (-)* Not tested Not tested Yes Yes (+) Not tested
Notes: A positive sign means that an increase in the variable increases the probability that the respondentis pro-trade.‘Yes’ (‘No’) means statistically significant (insignificant). * means variable sign is different fromother studies.
Sources: aScheve and Slaughter (2001); bPasadilla (2002); cBalistreri (1997); dMayda and Rodrik (2001);eO’Rourke and Sinnott (2001).
PASADILLA AND LIAO 15
SUMMARY AND CONCLUSIONSThis study contributes to the growing empirical literature that seeks out thedeterminants of individual trade policy preferences. It finds, based on a nationalidentity survey undertaken in 2003, that demographic characteristics play a keyrole in shaping a person’s opinion on trade. In particular, females in the Philippinesare more likely to be pro-trade than the males. This observation can be attributedto the unique employment experiences in, as well as the matriarchal culture of,the nation. Those who rank themselves as belonging to the higher economicclasses and those who earn above the median income are more protectionist, aresult that can be viewed as stemming from their ownership of or strong ties tolocal business. Those who are employed in the public sector and whose sourcesof income, both direct and indirect, may be threatened by the demolition of tradebarriers, are significantly and notably more anti-trade than those in the privatesector. Another remarkable finding is that those in the rural areas are more opento trade than urban dwellers, an outcome that may be traced to differing sectoralexperiences of competition.
It is interesting to note that many of the variables operated differently in thePhilippines compared to countries covered by previous studies. This serves tohighlight the differences among nations both in economic terms as well as withregard to cultural backgrounds. It is important for policymakers all over the world,especially those who work jointly with international organizations such as theWorld Trade Organization, to take note of this reality if they are to gain thenecessary public support for their policy actions.
On the domestic front, meanwhile, policymakers can better focus their infor-mation campaigns on specific sectors if they first identify which social groups aremore averse toward trade. Additionally, since these results imply that the groupsmore resistant to liberalization are not benefiting from it in a tangible way or arebeing adversely affected by it, decisionmakers ought to explore the possibilities ofcreating safety nets or arranging for transfers toward these particular segments ofsociety. This way, the benefits of liberalization will be more widely felt throughoutthe populace.
PHILIPPINE JOURNAL OF DEVELOPMENT 200516
REFERENCES
Alston, R., J.R. Kearl and M. Vaughan. 1992. Is there a consensus among econo-mists in the 1990s? The American Economic Review 82(2).
Balistreri, E.J. 1997. The performance of the Heckscher-Ohlin-Vanek Model inpredicting policy forces at the individual level. Canadian Journal ofEconomics 30:1-17.
Bautista, R., J. Power and Associates. 1979. Industrial promotion policies in thePhilippines. Makati City: Philippine Institute for Development Studies.
Beaulieu, E., M. Benarroch and J. Gaisford. 2001. Intra-industry trade liberalization:why skilled workers in most countries resist protectionism. Unpublished.
Beaulieu, E. 2002. Who supported the Canada-US free trade agreement: factor orindustry cleavages in trade policy? Economics and Politics 14(2).
Braun, M. 1998. Some guidelines for the measurement of education in internationalprojects. In ISSP 1995 National Identity Codebook, ZA Study No. 2880,Appendix 2, pp. 99-100. Cologne: Zentralarchiv fur EmpirischeSozialforschung.
Cororaton, C. 2003. Analyzing the impact of trade reforms on welfare and incomedistribution using CGE framework: the case of the Philippines. PIDS Dis-cussion Paper. Makati City: Philippine Institute for Development Studies.
Green, W. 2002. Econometric analysis. 5th ed. London: Prentice-Hall.International Labour Organization. 1990. ISCO-88 User Guide. Geneva, Switzer-
land: International Labour Organization.Maddala, G.S. 1986. Limited-dependent and qualitative variables in economet-
rics. UK: Cambridge University Press.Mayda, A. and D. Rodrik. 2001. Why are some people (and countries) more protec-
tionist than others? NBER Working Paper No. 8461. Cambridge, MA:National Bureau of Economic Research.
National Statistics Office (1997-2003). Monthly integrated survey of selected in-dustries. Manila.
National Statistics Office (1997-2003). Philippine Statistical Yearbook. Manila.O’Rourke, K. 2003. Heckscher-Ohlin theory and individual attitudes towards glo-
balization. Paper presented for the Eli Heckscher Celebratory Sympo-sium, Stockholm School of Economics, 22-24 May 2003, Stockholm.
O’Rourke, K. and R. Sinnott. 2001. The determinants of individual trade policypreferences: international survey evidence. Paper presented at theBrookings Trade Policy Forum, 10-11 May 2001, Washington.
Orbeta, A. 2002. Globalization and employment: the impact of trade on employ-ment level and structure in the Philippines. PIDS Discussion Paper. MakatiCity: Philippine Institute for Development Studies.
PASADILLA AND LIAO 17
Pasadilla, G. 2002. What affects trade policy preferences?: Evidence from the 1992Swiss vote on European integration. Unpublished.
Power, J. and G. Sicat. 1971. The Philippines’ industrialization and trade policies.London: Oxford University Press.
Scheve, K. and M. Slaughter. 2001. What determines individual trade policypreferences? Journal of International Economics 54:267-292.
Stata 8 User’s Guide and Base Reference Manual. Stata Press.Stolper, W. and P. Samuelson. 1941. Protection and real wages. Review of Eco-
nomic Studies IX (1):58-73.