Embed Size (px)
Citation preview

The Importance of Regional Variation in Patterns of
Involuntary Non-Standard Employment across Europe
Neil H. Spencer
University of Hertfordshire, U.K.
www.herts.ac.uk

Who Am I? What Do I Do?
• Neil H. Spencer
– Reader in Applied Statistics
Hertfordshire Business School, University of Hertfordshire
• This Research Project
– The impact of regions and missing levels in analyses of
Eurostat Microdata
• Related Research Projects
– Digital Footprint (Surveys of crowdworking in Europe)
– PLUS: Platform Labour in Urban Spaces (H2020 Project)
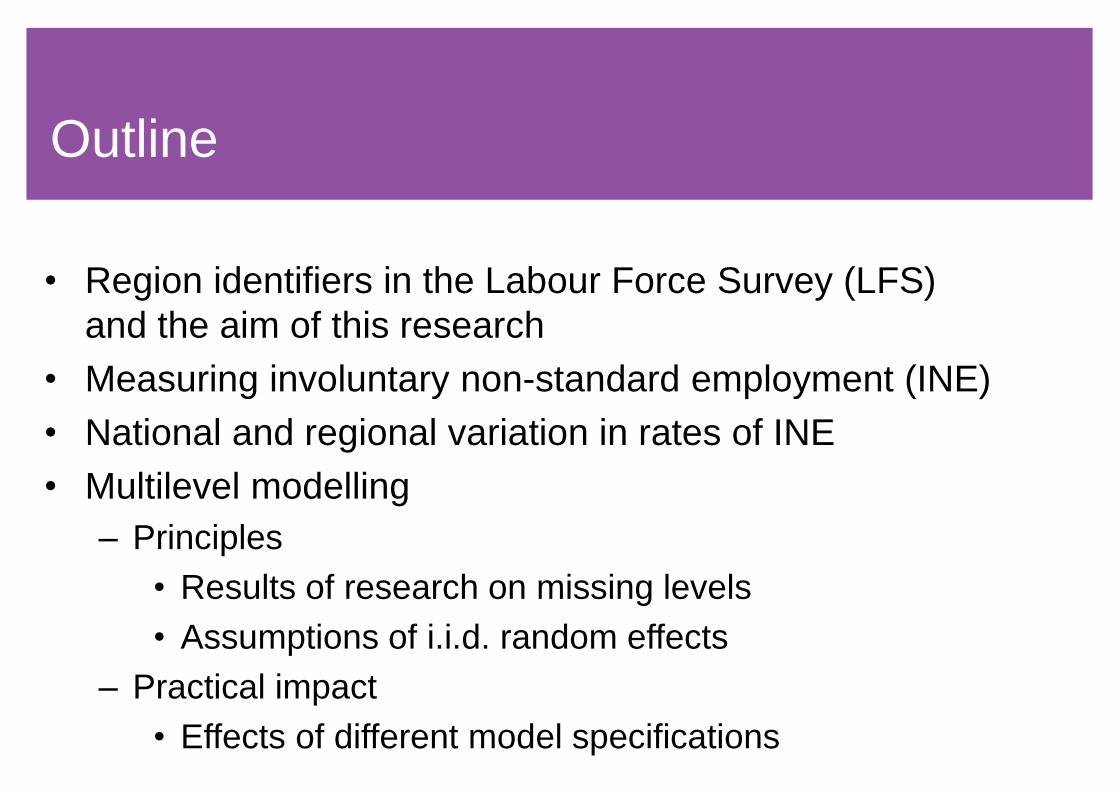
Outline
• Region identifiers in the Labour Force Survey (LFS)
and the aim of this research
• Measuring involuntary non-standard employment (INE)
• National and regional variation in rates of INE
• Multilevel modelling
– Principles
• Results of research on missing levels
• Assumptions of i.i.d. random effects
– Practical impact
• Effects of different model specifications
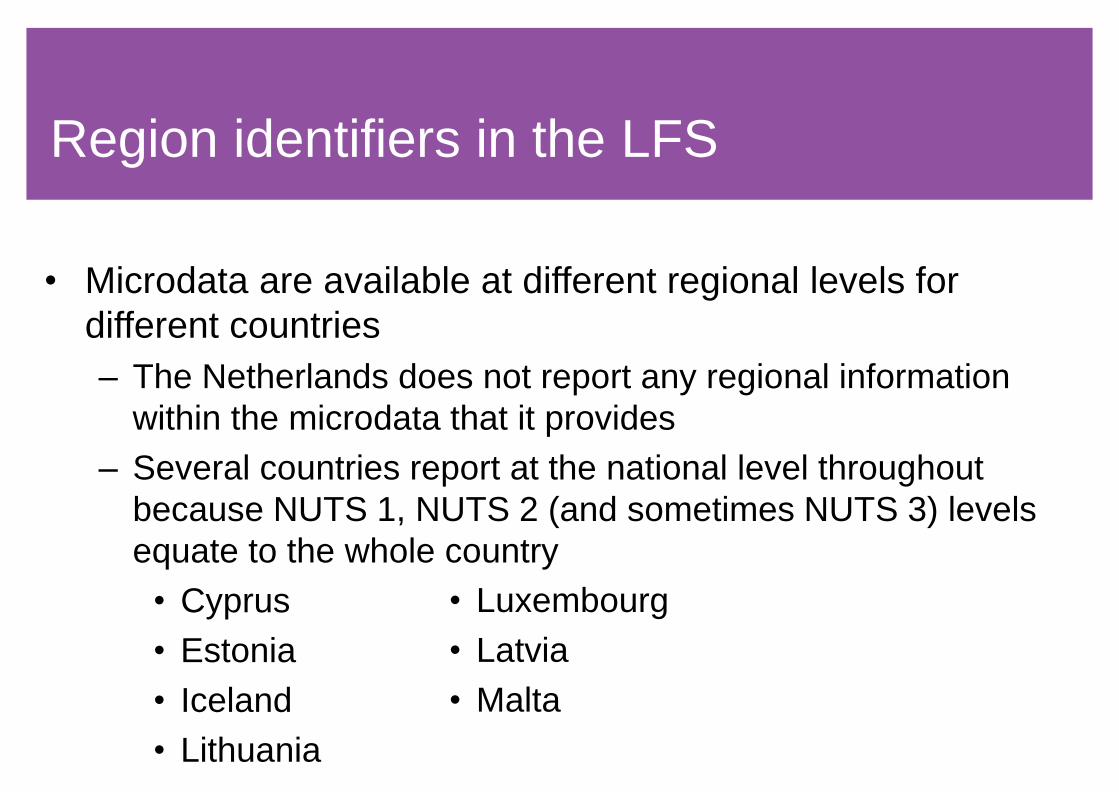
• Microdata are available at different regional levels for
different countries
– The Netherlands does not report any regional information
within the microdata that it provides
– Several countries report at the national level throughout
because NUTS 1, NUTS 2 (and sometimes NUTS 3) levels
equate to the whole country
• Luxembourg
• Latvia
• Malta
• Microdata are available at different regional levels for
different countries
– The Netherlands does not report any regional information
within the microdata that it provides
– Several countries report at the national level throughout
because NUTS 1, NUTS 2 (and sometimes NUTS 3) levels
equate to the whole country
• Cyprus
• Estonia
• Iceland
• Lithuania
Region identifiers in the LFS
Region identifiers in the LFS
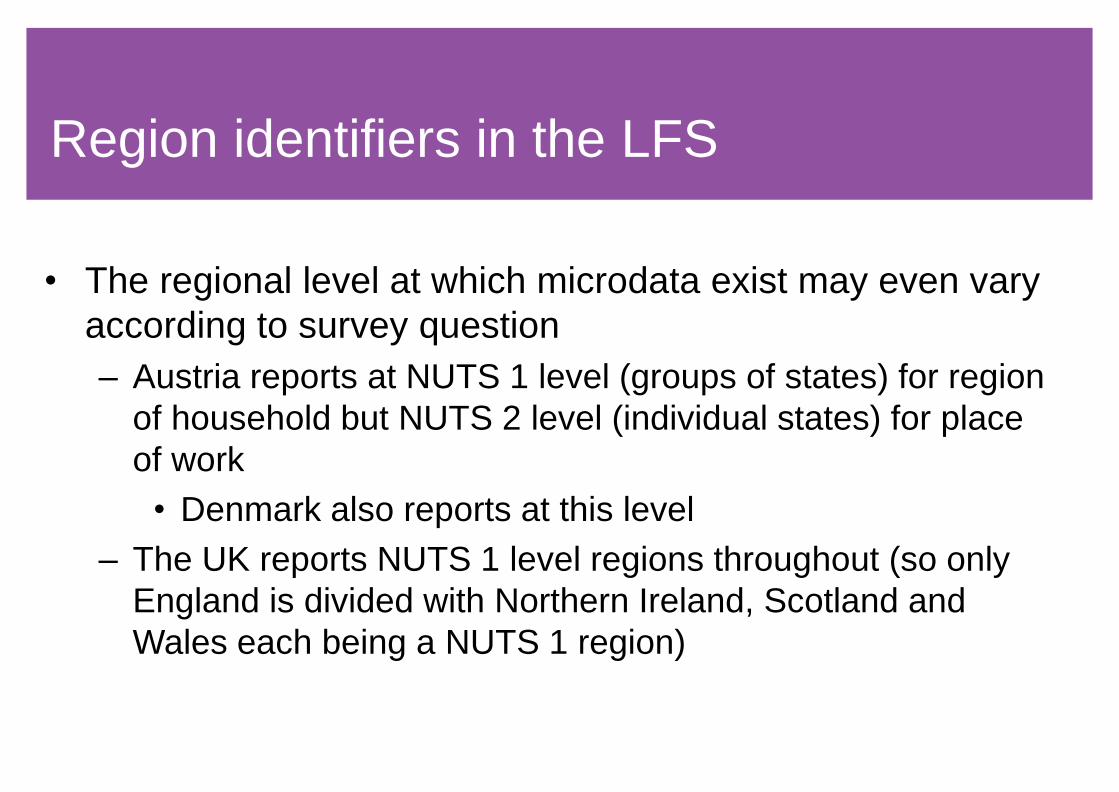
• The regional level at which microdata exist may even vary
according to survey question
– Austria reports at NUTS 1 level (groups of states) for region
of household but NUTS 2 level (individual states) for place
of work
• Denmark also reports at this level
– The UK reports NUTS 1 level regions throughout (so only
England is divided with Northern Ireland, Scotland and
Wales each being a NUTS 1 region)
The aim of this research
• To identify the impact of regional variation on the analysis
of social science data
• More specifically here…
– Regions and countries of Europe
• NUTS 1 and NUTS 2 regions within countries
– Eurostat Microdata
• LFS data
• Patterns of involuntary non-standard employment
Measuring involuntary non-standard
employment (INE)
• Three measures of INE extracted from the LFS microdata
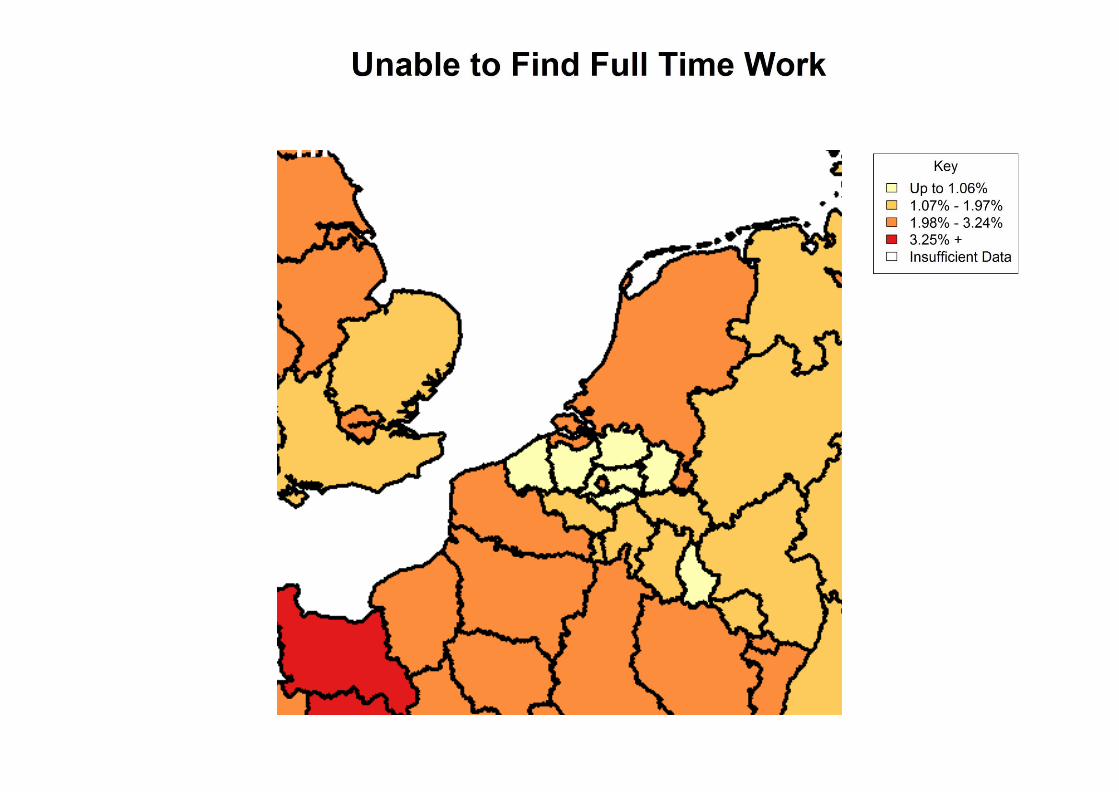
– Not being able to find full-time work
• (from question FTPTREAS – “I would like to ask you why
you took a part-time rather than a full-time job. Was it
because...”).
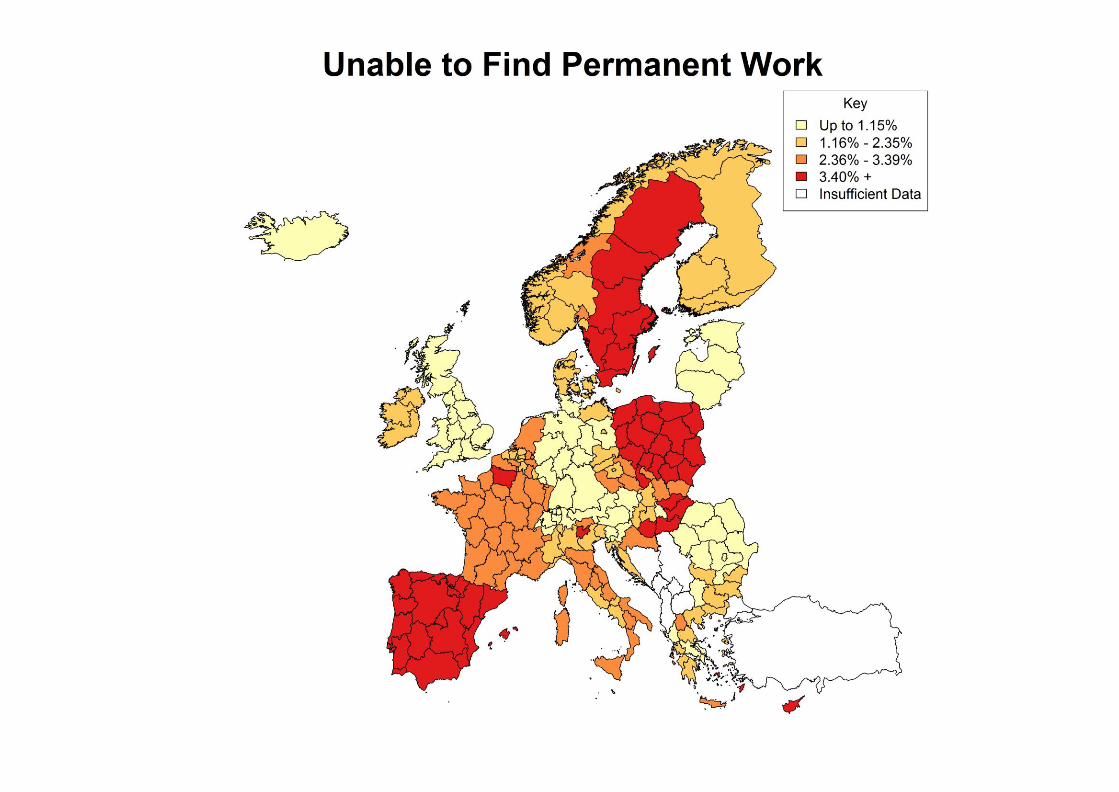
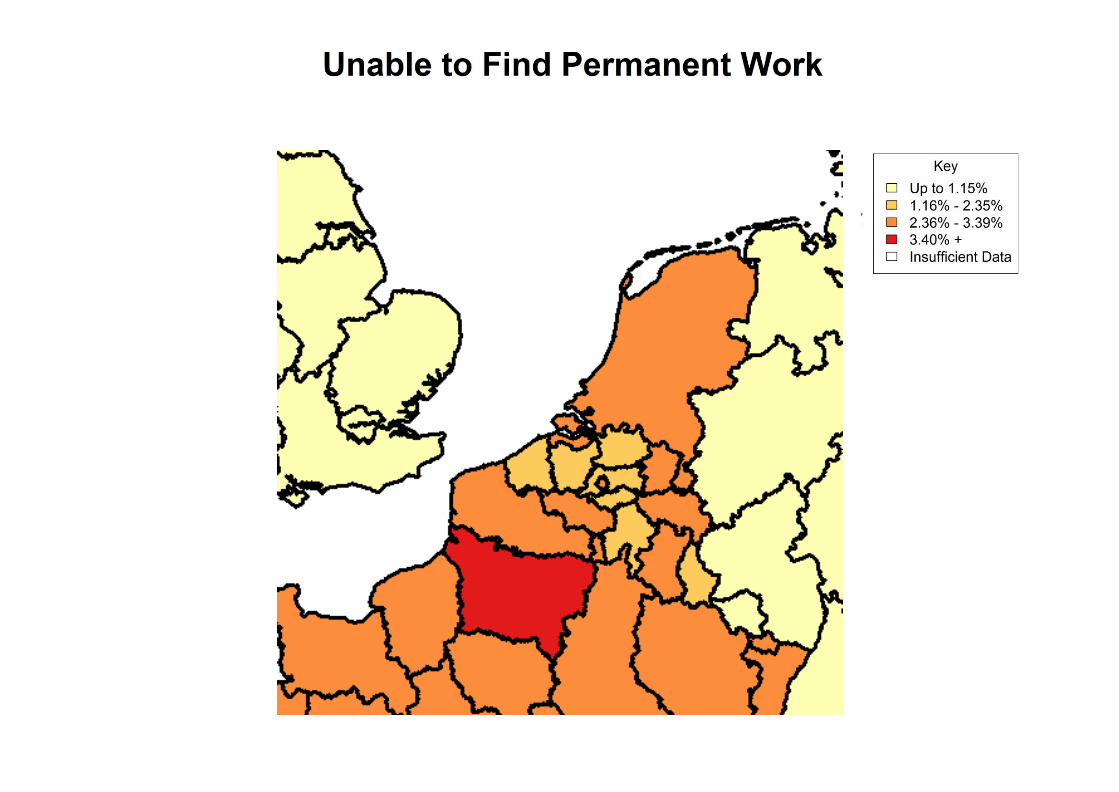
– Not being able to find permanent work
• (from question TEMPREAS – “Did you take that type of
job rather than a permanent job because...”).
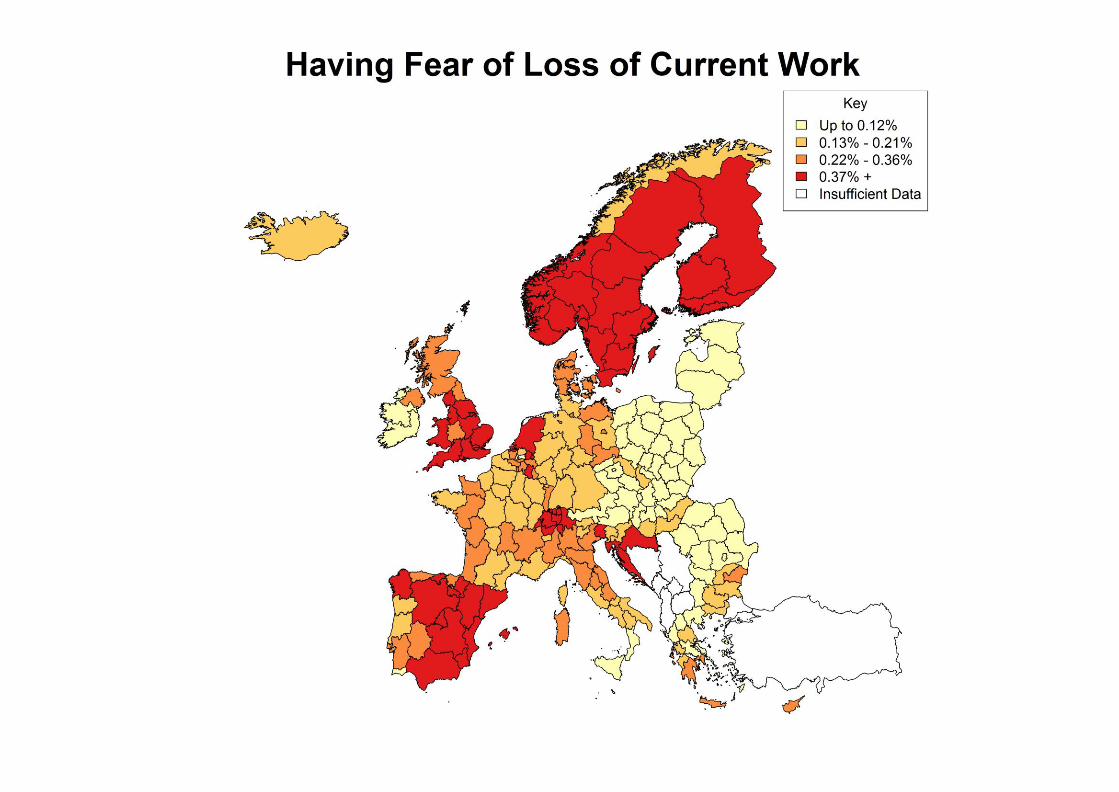
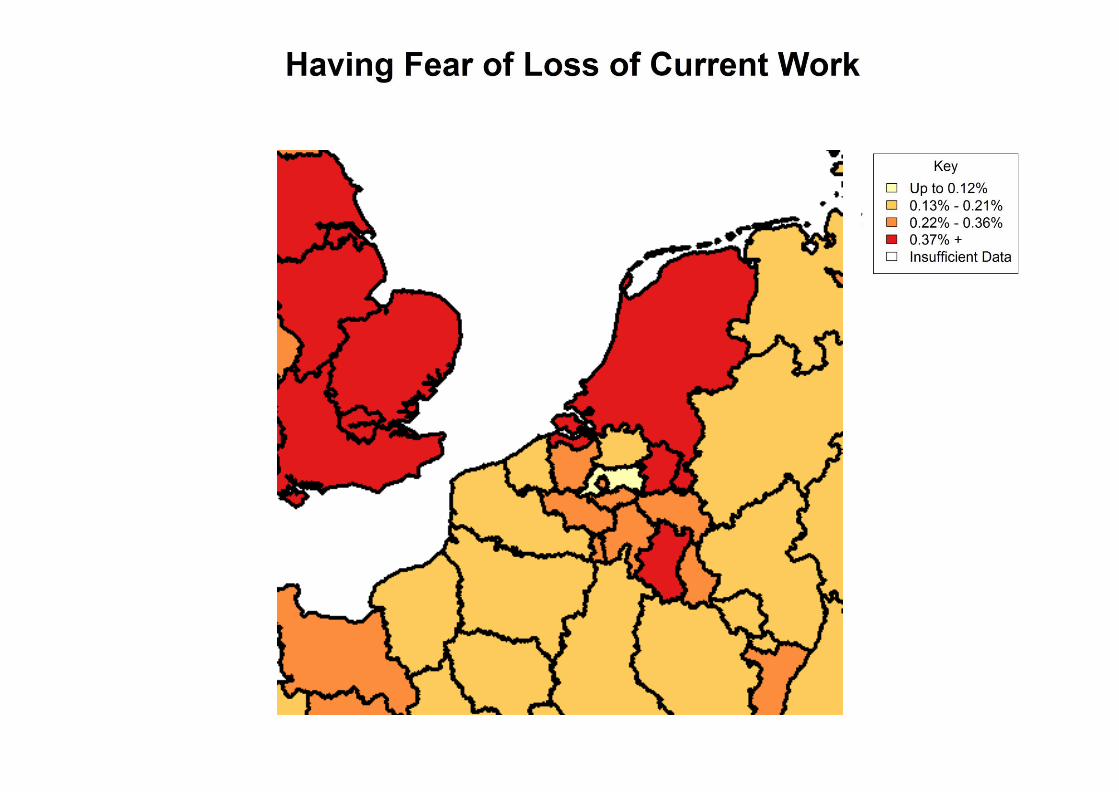
– Having a fear of loss of current work
• (from question LOOKREAS – “Why were you looking for
another job?”).
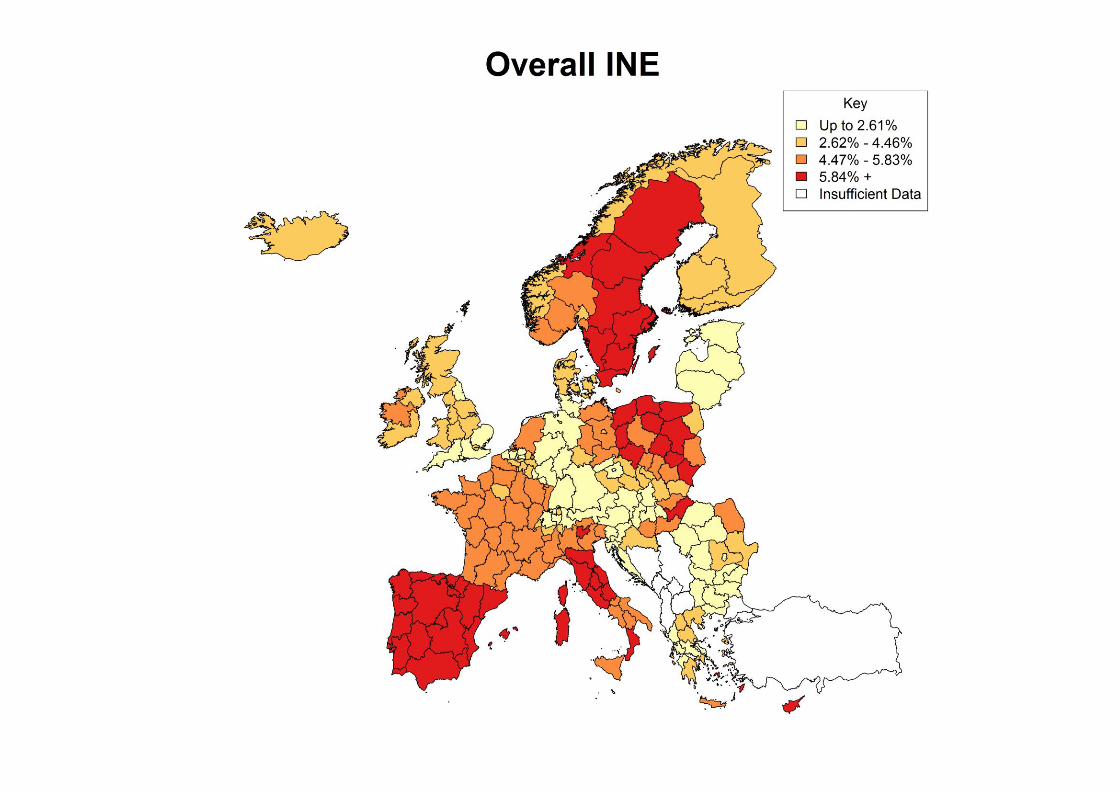
Measuring involuntary non-standard
employment (INE)
• An individual who has one, two or three of these
characteristics is said to be in “involuntary non-standard
employment” (INE)
– Unable to find full-time work
– Unable to find permanent work
– Having fear of loss of current work
• E.g. Green, A.E. & Livanos, I. (2017) “Involuntary non-
standard employment in Europe”, European Urban and
Regional Studies, 24(2), pp175-192.
• Rates for components of INE and overall INE calculated
– For each country
– For the lowest level of geography available
– Maps are produced to show the variation in INE rates
• Notes
– LFS 2014 data used here for convenience
– There is a literature concerning the ideal choice of colours
and numbers of categories for maps but we do not pursue
this further here
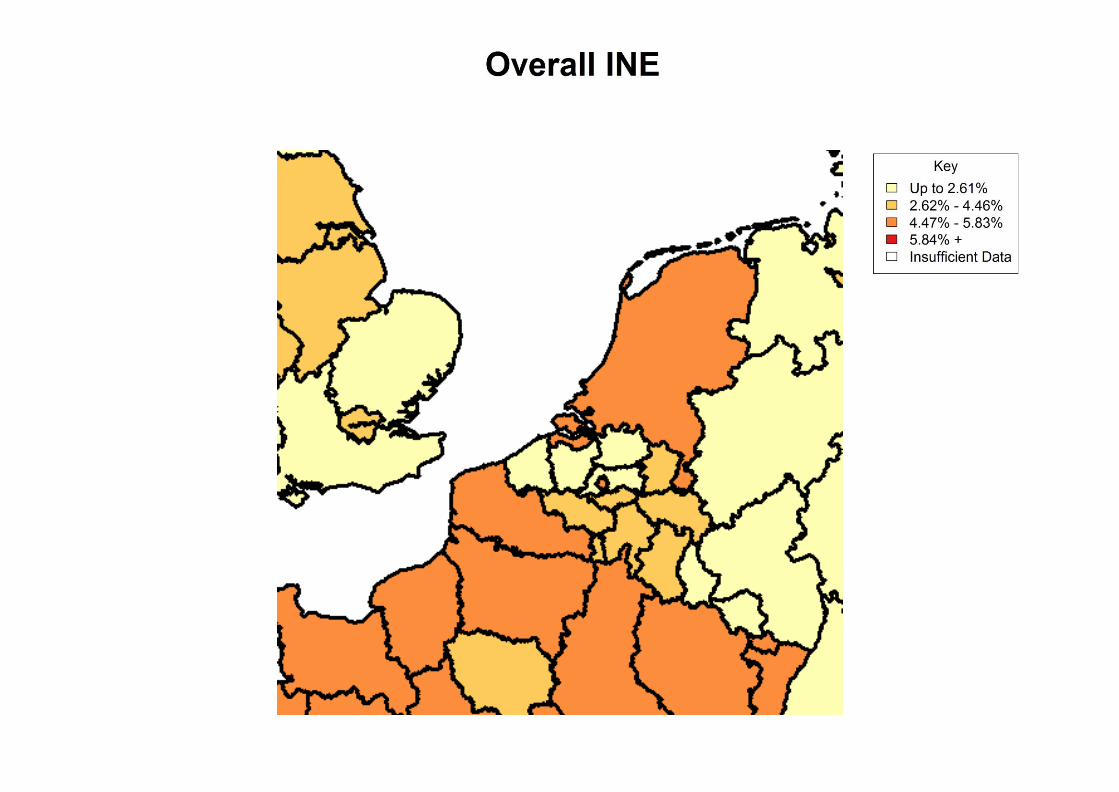
Mapping INE
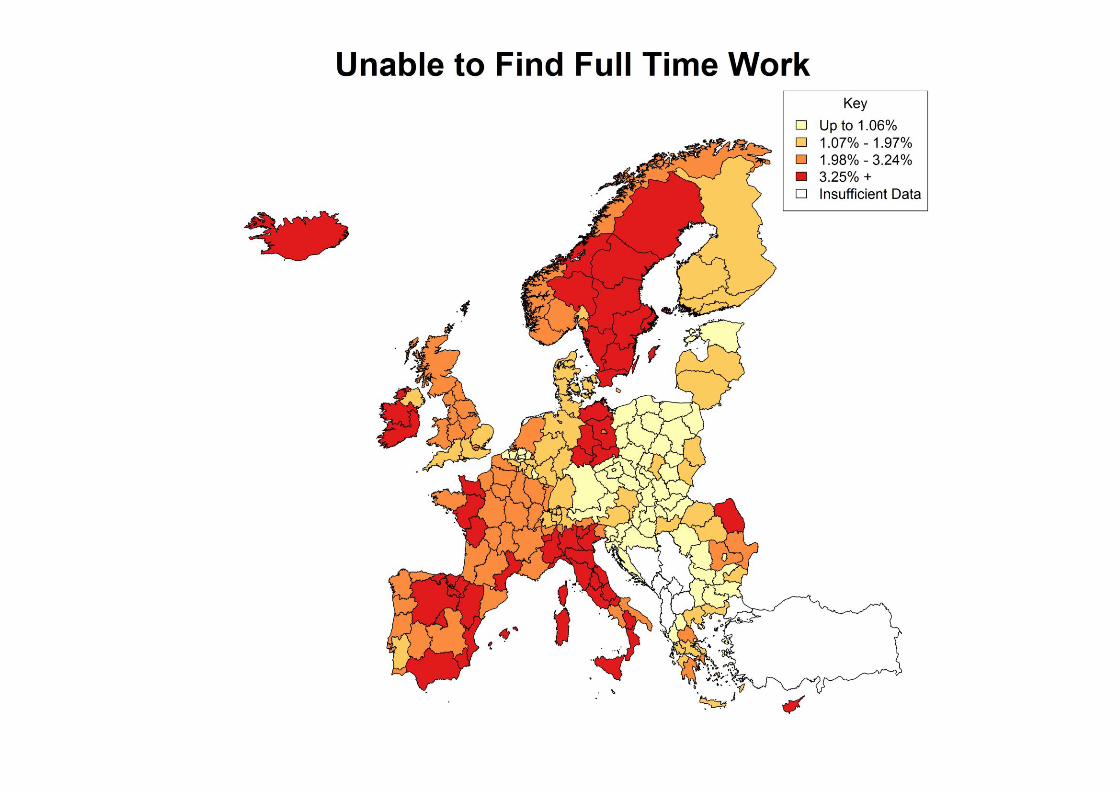
Unable to find full-time work
Unable to find full-time work
Unable to find full-time work
Unable to find full-time work
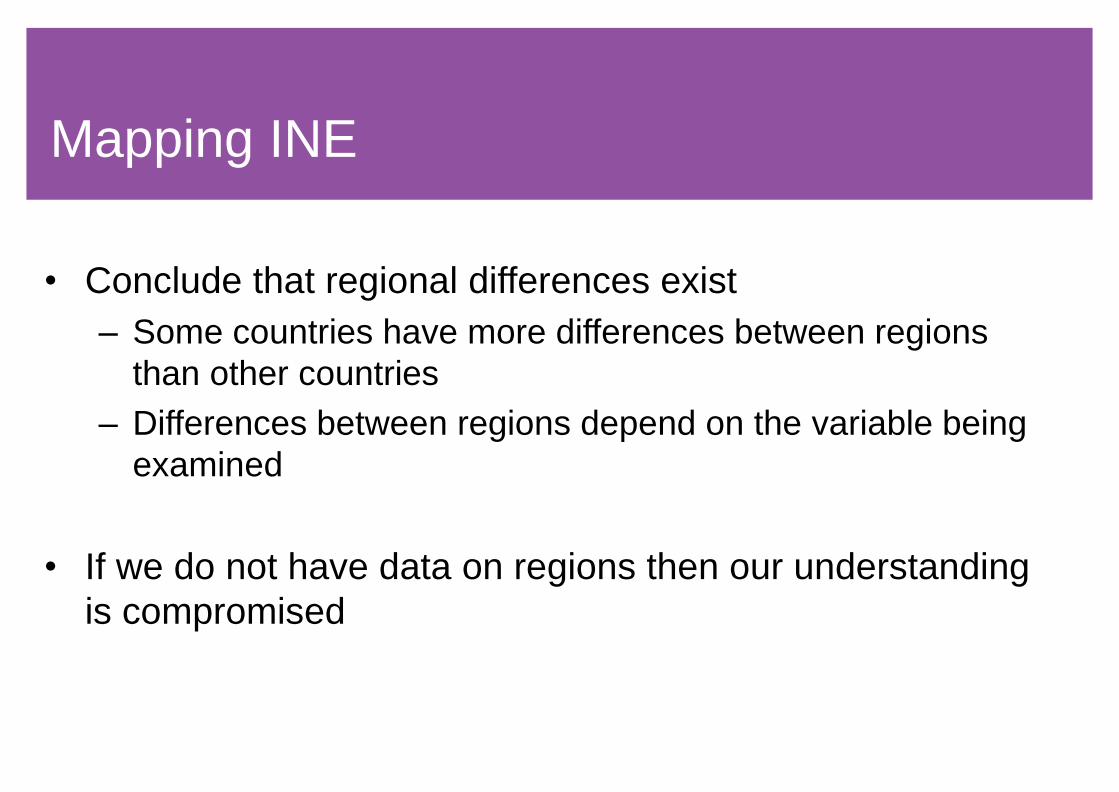
• Conclude that regional differences exist
– Some countries have more differences between regions
than other countries
– Differences between regions depend on the variable being
examined
• If we do not have data on regions then our understanding
is compromised
Mapping INE
Unable to find full-time work
Unable to find full-time work
Unable to find full-time work
Unable to find full-time work
• The fact that there are differences between regions may
be due to several factors including:
– It is possible that individuals in particular regions have
different characteristics from those in other regions and this
predisposes them to have different outcomes
– Certain regions may have different characteristics from
other regions (e.g. proportions of businesses in different
sectors) and this may lead to individuals in those regions
having different outcomes
Regional variation
• It is thus of interest to build models which will help
understand the underlying processes
• Let us consider the modelling of the probability of being in
involuntary non-standard employment (INE)
– Logistic regression as binary outcome
– Multilevel modelling
• Respondents are grouped within countries
• Respondents are grouped within regions within countries
Effect of regions in modelling
• Effects shown by Moerbeek (2004)
– Variation at ignored level is added to neighbouring levels
– Standard errors of fixed effects below the level omitted are
inflated, leading to loss of power for associated statistical
tests
– For unbalanced designs, estimates of fixed effects in the
model are incorrect as well as their standard errors
Moerbeek, M. (2004) “The consequence of ignoring a level of nesting in multilevel
analysis”, Multivariate Behavioral Research, 39, 1, pp129-149.
Potential effects of ignoring regional level
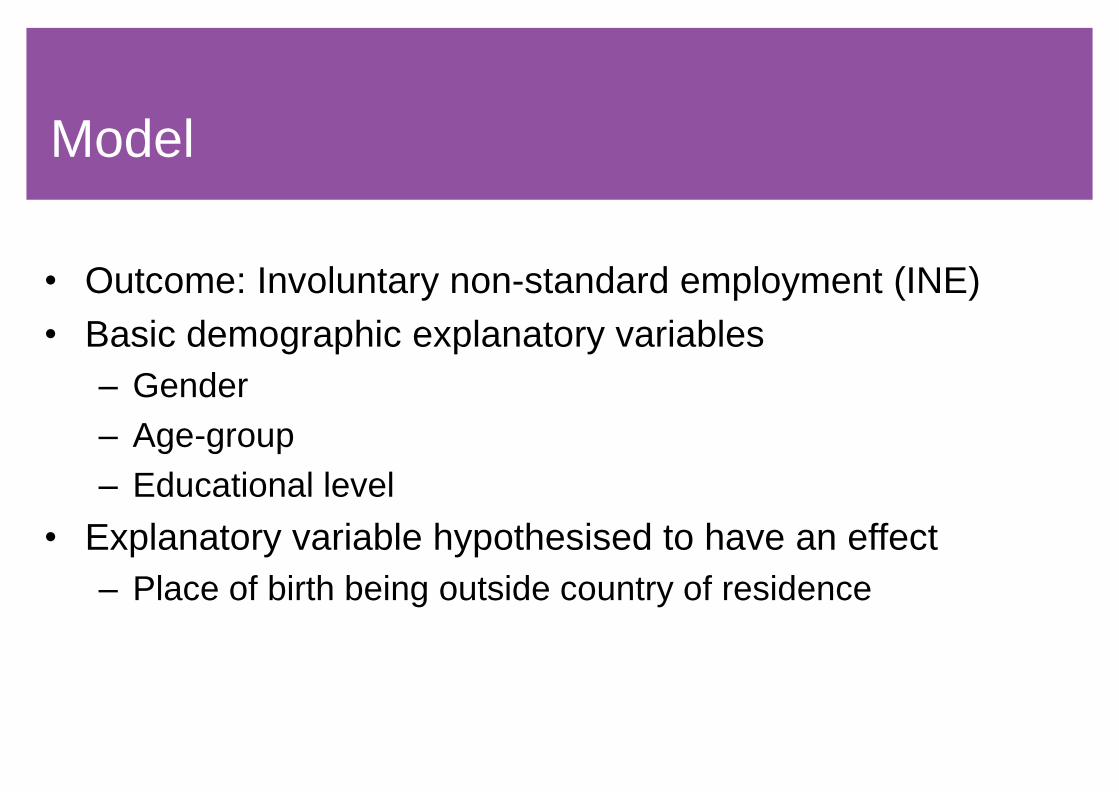
• Outcome: Involuntary non-standard employment (INE)
• Basic demographic explanatory variables
– Gender
– Age-group
– Educational level
• Explanatory variable hypothesised to have an effect
– Place of birth being outside country of residence
Model
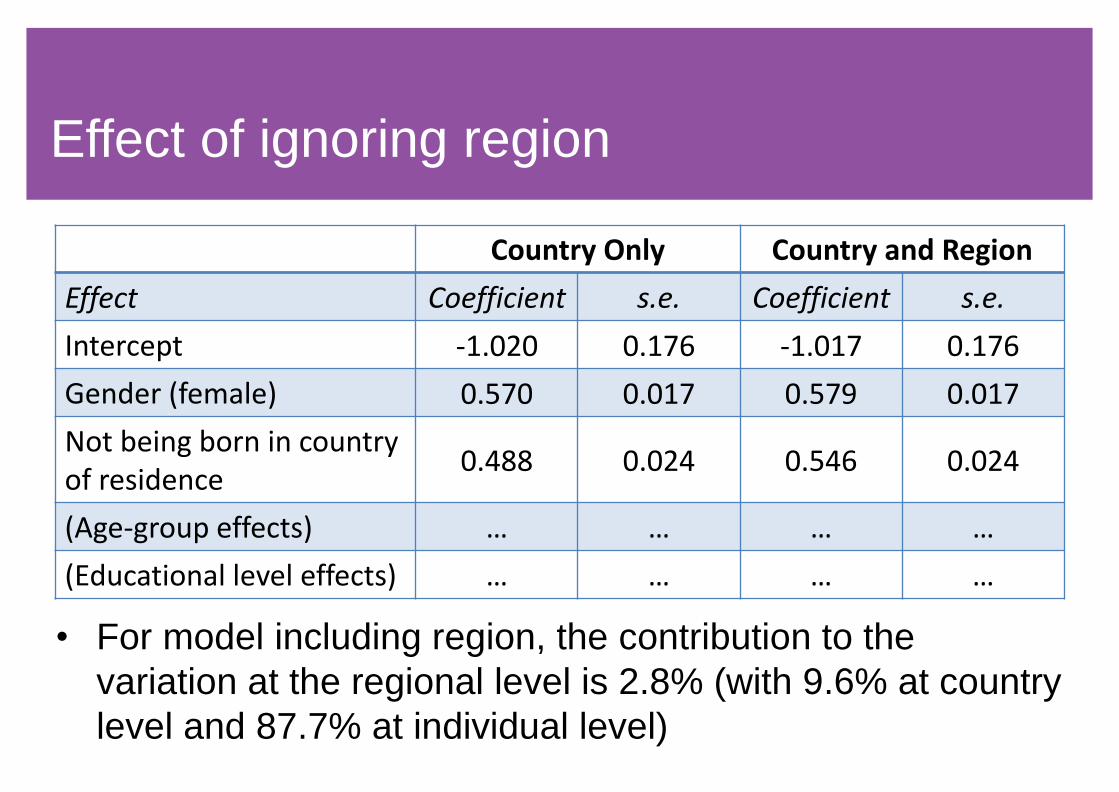
• For model including region, the contribution to the
variation at the regional level is 2.8% (with 9.6% at country
level and 87.7% at individual level)
Country Only Country and Region
Effect Coefficient s.e. Coefficient s.e.
Intercept -1.020 0.176 -1.017 0.176
Gender (female) 0.570 0.017 0.579 0.017
Not being born in country of residence
0.488 0.024 0.546 0.024
(Age-group effects) … … … …
(Educational level effects) … … … …
Effect of ignoring region

• Coefficient for not being born in country of residence
changes by more than 2 standard errors
– Coefficient from model ignoring region (0.488) is outside
95% CI for the coefficient from model including region:
(0.497, 0.594)
• This has occurred with even this low level of variation
attributable to the regional level
– For models where the missing level accounts for even more
of the variation, the effects on the fixed effects are likely to
be larger
Effect of ignoring region
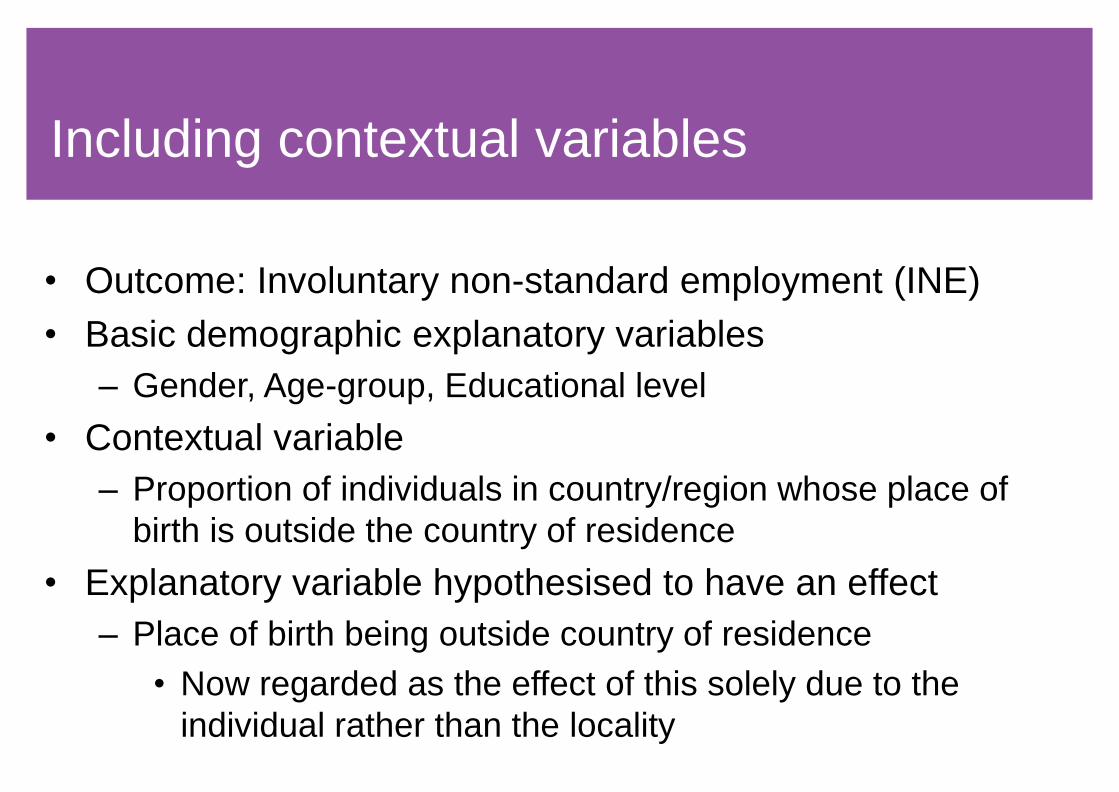
• Outcome: Involuntary non-standard employment (INE)
• Basic demographic explanatory variables
– Gender, Age-group, Educational level
• Contextual variable
– Proportion of individuals in country/region whose place of
birth is outside the country of residence
• Explanatory variable hypothesised to have an effect
– Place of birth being outside country of residence
• Now regarded as the effect of this solely due to the
individual rather than the locality
Including contextual variables
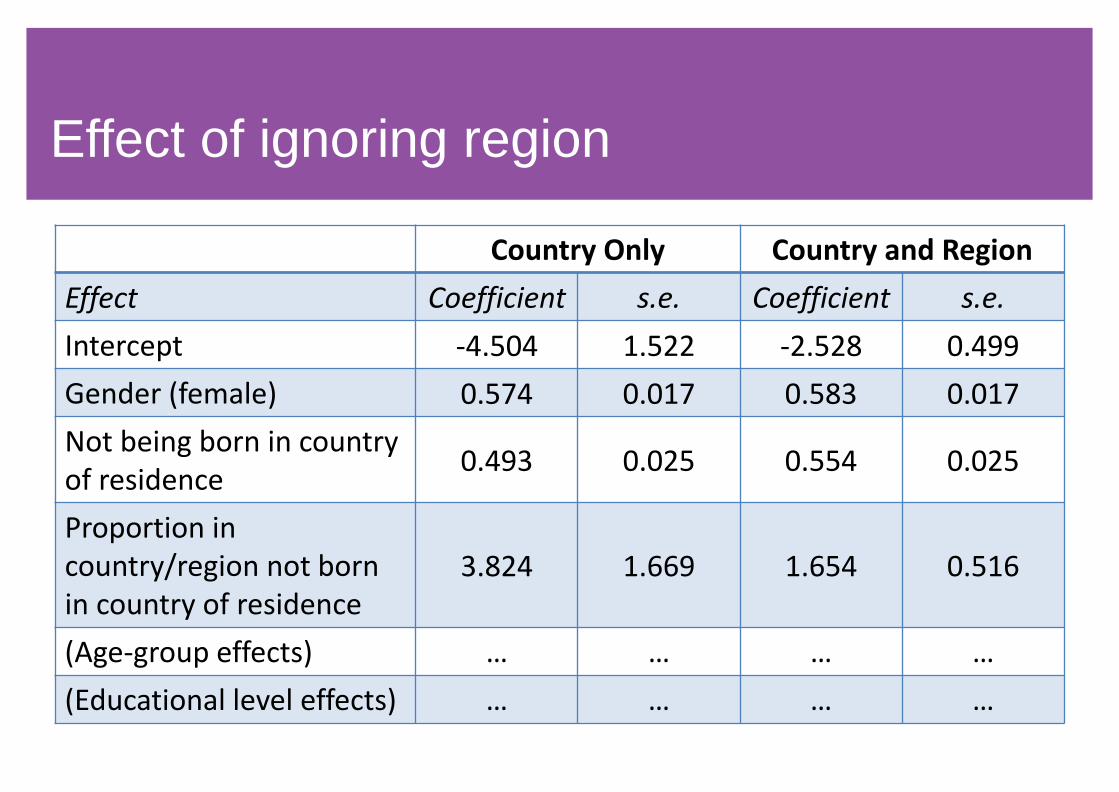
Country Only Country and Region
Effect Coefficient s.e. Coefficient s.e.
Intercept -4.504 1.522 -2.528 0.499
Gender (female) 0.574 0.017 0.583 0.017
Not being born in country of residence
0.493 0.025 0.554 0.025
Proportion in country/region not born in country of residence
3.824 1.669 1.654 0.516
(Age-group effects) … … … …
(Educational level effects) … … … …
Effect of ignoring region
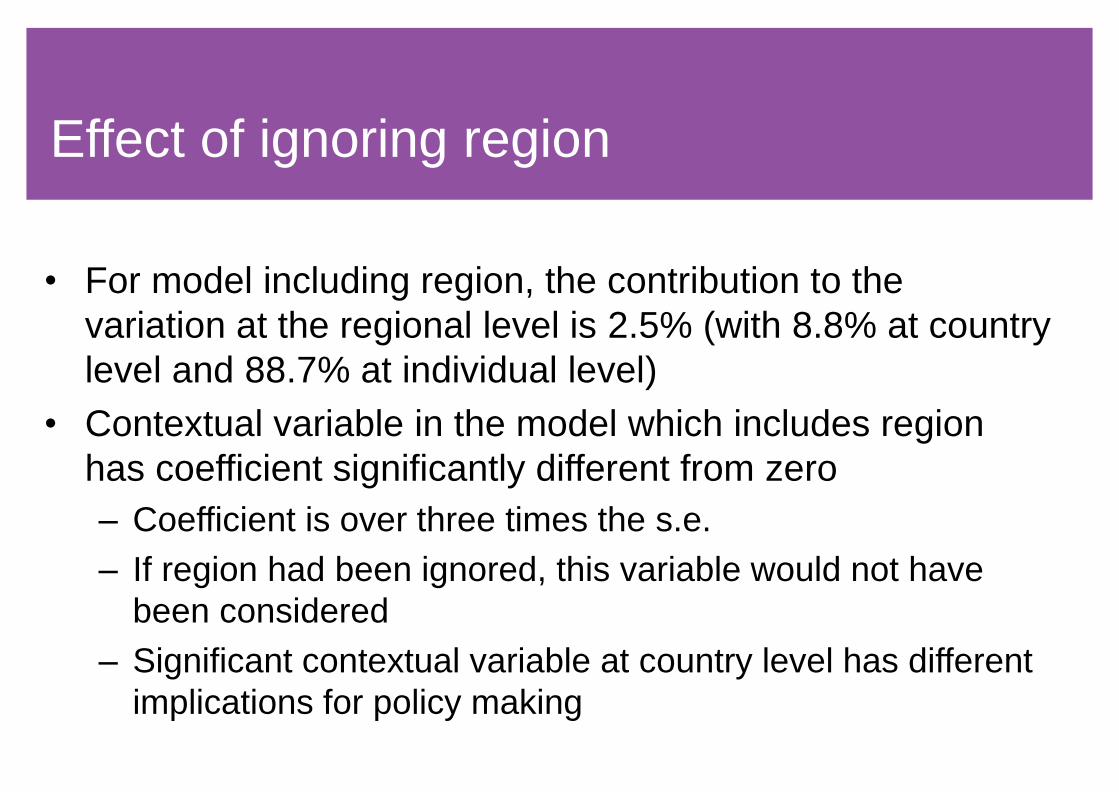
• For model including region, the contribution to the
variation at the regional level is 2.5% (with 8.8% at country
level and 88.7% at individual level)
• Contextual variable in the model which includes region
has coefficient significantly different from zero
– Coefficient is over three times the s.e.
– If region had been ignored, this variable would not have
been considered
– Significant contextual variable at country level has different
implications for policy making
Effect of ignoring region
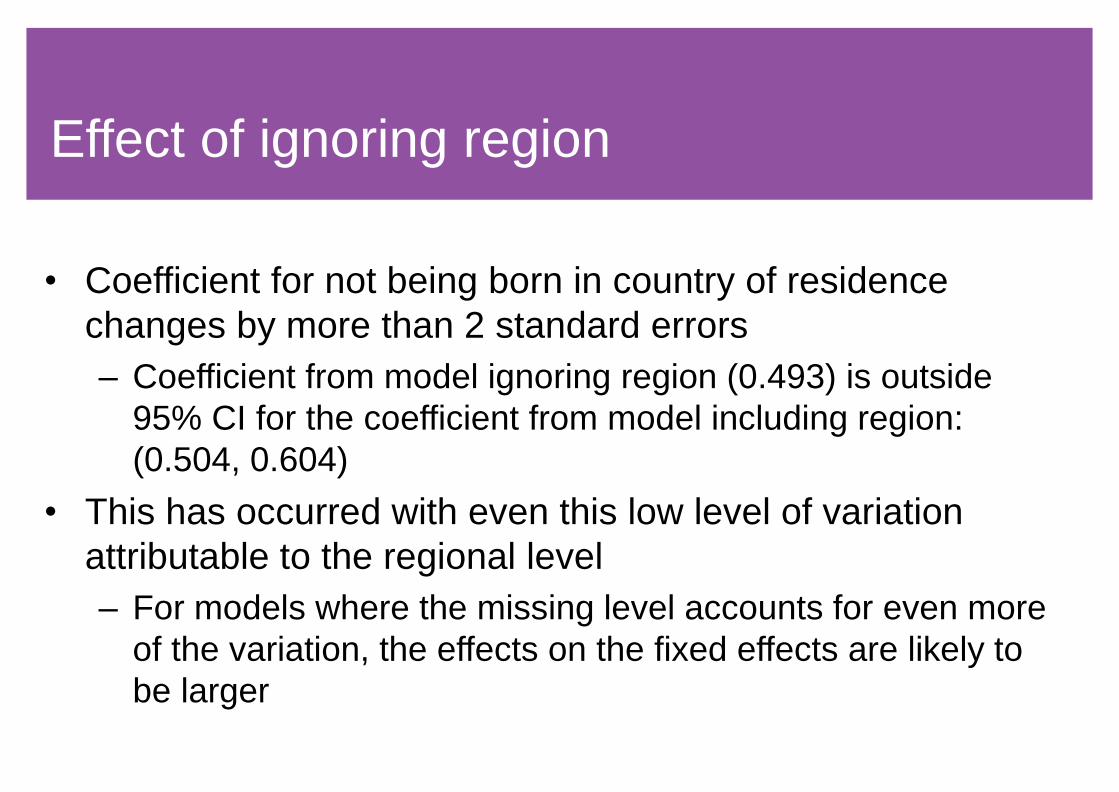
• Coefficient for not being born in country of residence
changes by more than 2 standard errors
– Coefficient from model ignoring region (0.493) is outside
95% CI for the coefficient from model including region:
(0.504, 0.604)
• This has occurred with even this low level of variation
attributable to the regional level
– For models where the missing level accounts for even more
of the variation, the effects on the fixed effects are likely to
be larger
Effect of ignoring region
• Maps of labour force data show that variation occurs not
just between countries but also between regions within
countries
– Where a lack of variation is seen, this may be due to the
geographical level chosen rather than no variation existing
– Researchers and policy makers need to be aware that lack
of evidence for differences may be a function of data
availability or reporting rather than the underlying truth
Summary
• Even with a low level of variation attributable to a regional
level, the results from fitting a statistical model may be
affected by the region being ignored
– There is potential for substantive differences in results to be
observed
– It is possible that, if data included regional information from
countries where it is currently limited or missing, results
from modelling may be affected
Summary