Embed Size (px)
Citation preview
1
How The Government Has Misled Parliament And The Public On The
Climate Change Impacts Of Shale Oil And Gas
Development In BritainA Report For Talk Fracking
Paul MobbsMobbsrsquo Environmental Investigations
February 2017
2
3
Table of ContentsThe debate over lsquofrackingrsquo and climate change in the UK 1The debate before the Mackay-Stone review 2lsquoBottom-uprsquo analysis 3lsquoTop-downrsquo analysis 3The lsquotop-downrsquo versus lsquobottom-uprsquo contention over shale emissions 4Government shale gas policy and the Howarth study 4The Mackay-Stone review of shale gas emissions 5Fugitive emission estimates 5Estimates of gas production per well 6Global warming potentials (GWPs) 6The impact of Mackay and Stonersquos decisions on their results 7Subsequent research on unconventional oil amp gas impacts 8The AllenUniversity of Texas study 8Discrepancy between inventory- and instrumental-based surveys 9Flaws in sensors and their implication for emissions estimates 9How the Mackay-Stone report has misled the debate on lsquofrackingrsquo 10Parliamentary debates and the Mackay-Stone report 10The Committee on Climate Changersquos onshore petroleum assessment 12The CCCrsquos report and emissions estimates 12Conclusion and recommendations 13Table 1 Recent research on the fugitive emissions from unconventional oil amp gas production
15
copy February 2017 Paul MobbsMobbsrsquo Environmental Investigations
This report is made available under the The Creative Commons Attribution Non-Commercial Share-Alike 20 Licence (CC BY-NC-SA 20 UK) ndash England amp Wales For a copy of this licence go to the Free Range Activism Website (FRAW) ndash httpwwwfraworguklibraryfrawby_nc_sa-uk-2htmlCorrespondence related to this report should be addressed to Paul Mobbs Mobbsrsquo Environmental Investigations and Research 3 Grosvenor Road Banbury OX16 5HN email ndash meifraworgukFor further information on Paul Mobbs Mobbsrsquo Environmental Investigations and Research go to ndash httpwwwfraworgukmei
4
What is science It is a process for how we find measure and then evaluate the real-world in order to identify lsquohow it worksrsquo In that process how things are measured and analysed is as important as the results ndash because the mechanics of the process have a large influence on what those results will beThe problem is particularly for contentious debates in the media and politics rarely does the process of science ever get discussed Only the results Seldom do we hear the lsquoconfidencersquo we might have in those results or their lsquouncertaintiesrsquo Rarely is the method of how those results were produced ever discussedIn such an environment it is easy to use lsquoresultsrsquo in a way that has no validity to the context in which they were formed
lsquoFrackingrsquo and Whitehallrsquos energy policyThe Government in Whitehall (distinct from those in Edinburgh or Cardiff who currently have moratoriums on development) has promoted onshore oil and gas not only as a source of energy but as a means to meet climate change obligations Gas as Ed Davey claimed in 2013 is a ldquobridgerdquo to a low carbon economyThat claim rests on the results of one key report written by the Department of Energy and Climate Changersquos (DECC) Chief Scientist David Mackay and the economist Timothy Stone The report published in September 2013 states thatWe have gathered available information on the carbon footprint of shale gas to inform our estimate of the potential impacts of shale gas exploration extraction and use in the UK on UK climate change objectiveshellip With the right safeguards in place the net effect on UK GHG emissions from shale
gas production in the UK will be relatively smallHowever as noted above the results of the study are the end-point of a process What is at question today is whether that process of evaluation was valid even when the report was first published in 2013
lsquoBottom-uprsquo versus lsquoTop-downrsquoHow we measure and evaluate the pollution emitted by industrial processes is a compromise between what is technically possible and realistically practicable Reliably measuring gases emitted from equipment outdoors is difficult so it requires some flexibilityThese historic difficulties mean that regulators have relied on a lsquobottom-uprsquo method to assess the leaks from oil and gas operations Small parts of the equipment are tested either in a laboratory or specially constructed test rigs the leaks are measured or estimated and the figures combined to produce a totalWhen the climate impacts of oil and gas production were first assessed at the end of the 1990s the assumption from these bottom-up evaluations was that the effects were ldquoinsignificantrdquoWhat has happened since is that the monitoring technology has improvedToday it is possible to equip aircraft or large ground vehicles as mobile gas monitoring laboratories These are flown or driven around oil and gas fields to sniff the air From that sampling it is possible to produce a lsquotop-downrsquo estimate of how much gas is leaking in order to create the measured concentrations in the airIn an ideal world the top-down and bottom-up measurements would within a reasonable boundary of uncertainty match The difficulty is that they do notWhat consistent studies carried out over
Executive SummaryHow The Government Has Misled Parliament And The Public On The Climate Change Impacts Of Shale Oil And Gas Development In Britain
lsquoWith the right safeguards in place the net effect on UK GHG emissions from shale gas production in the UK will be relatively smallrsquoMackay Stone
lsquoWhat is at question today is whether that process of evaluation was valid even when the report was first published in 2013rsquo
5
the last decade or so have found is that the leakage detected from real-world lsquotop-downrsquo monitoring exceeds the lsquobottom-uprsquo measurement of emissions by at least two to four times
Howarth and the significance of methaneThe research paper which highlighted the significance of this debate was produced by Howarth Santoro and Ingraffea in June 2011The lsquoHowarthrsquo paper gained prominence because it claimed to show that shale gas was not only worse than conventional gas Under certain circumstances it could be worse than coal-fired power generationThe reason why the paper claimed such high climate impacts was due to two main factorsFirstly because it was using lsquotop-downrsquo assessments of leakage from natural gas systems As noted above these have consistently produced much higher levels of leakage than lsquobottom-uprsquo dataSecondly they used a 20- rather than 100-year baseline for the impact of methane on climate change ndash which has gained prominence as a greenhouse gas because it has a far faster response in warming the climate than other gases and because new sampling techniques have been finding far higher concentrations in the environment than were expectedBoth the industry and regulators dismissed the findings of the paper precisely because they didnrsquot match the leakage which traditional lsquobottom-uprsquo studies had found
The Mackay-Stone reviewIn Britain DECC commissioned Mackay and Stone to evaluate the climate impacts of shale gas ndash although if you read the report it is clear that it is targeted squarely at the results of the Howarth studyVery roughly Mackay and Stonebull took a figure for how much gas leaks
from a gas well and then calculated the climate impact of those leaks
bull they added the impacts of the gas being burnt
bull then they divided the total figure for impacts by the amount of gas produced from each well to produce a figure for
impacts per unit of energybull then they compared that to other
available figures for conventional gas coal-fired power and imported liquefied natural gas (LNG)
That is a fair assessment procedure in order to test the impacts of shale gas against other sources of natural gas for power generation The problem with Mackay and Stonersquos report is not the process it is the data which they used in their calculationsbull Their figures for gas leakage were
predominantly from lsquobottom-uprsquo studies ndash which on the basis of a range of research studies have traditionally under-estimated emissions by two to four times
bull They deliberately excluded the figures in the Howarth study from their final calculations because they claimed they were a statistical lsquooutlierrsquo which would skew their results and
bull The figures used for gas production per well were at least twice what is seen in US gas wells ndash and had no clear independent source
Using a figure for leakage which was perhaps a half of what it should have been and using a figure for gas production which was twice what it should have been the level of impacts which their analysis found is arguably a quarter of what it should beMackay and Stone while rejecting Howarthrsquos figures also disregarded other US-government backed studies produced around that time which had produced similar results to Howarth Instead they promoted an as yet unpublished study by Allen et al which claimed that leakage rates could be minimized using what was called ldquoreduced emissions completionsrdquo (REC)
The Allen studyThe 2013 study by Allen et al was part-funded by the US Environmental Defense Fund It is a lsquobottomrsquouprsquo analysis of leakage from oil and gas operations and claimed levels of leakage far lower than similar studies ndash due to the improved operational practice of RECsHowever the study ran into problems from the start The journal PNAS had to publish a correction because the authors had failed to declare their conflicting industry affiliations More significantly the study does not disclose which and what type of sites were being tested Most seriously though the sites were not randomly selected for testing Their industry partners selected which
lsquoMackay-Stone report must be withdrawn and a moratorium implemented on all lsquofrackingrsquo operations until we can state the impacts with certaintyrsquo
lsquoUsing a figure for leakage which was perhaps a half of what it should have been and using a figure for gas production which was twice what it should have been the level of impacts which their analysis found is arguably a quarter of what it should bersquo
6
DECC was disbanded in 2016 but in January 2017 the new department ndash the Department of Business Energy and Industrial Strategy (BEIS) ndash issued revised guidance on shale gas once again echoing the results of the Mackay-Stone reportRecently the Committee on Climate Change (CCC) produced a report on onshore oil and gas production When Environment Secretary Andrea Leadsom reported this to Parliament she claimed that the CCC said that onshore oil and gas is compatible with the UKrsquos climate target This is misleading Parliament as this is not within the context of their conclusionsAs stated in the recent House of Commons Library briefing on Shale Gas the CCC concluded that lsquofrackingrsquo must pass three tests to be acceptable The third of those requires that we reduce emissions elsewhere in the economy to accommodate the emissions from onshore oil and gas And as Climate Change Secretary Nick Hurd stated in evidence to a Select Committee in January 2017 even finding the 50 of saving yet to be identified will be lsquohardrsquo
Whitehallrsquos fracking policies are completely flawedThe Mackay-Stone report which was arguably flawed on the day of its publication is today wholly discredited No minister can quote its conclusions without demonstrably misleading MPs and the public as to the current state of the science related to lsquofrackingrsquo and climate changeMackay-Stone report must be withdrawn and a moratorium implemented on all lsquofrackingrsquo operations until we can state the impacts with certainty
sites they were to testAll these problems are accepted in the supporting information published alongside the Allen paperThe real problem for the Allen study emerged in 2015 Research by Howard et al highlighted that one of the most widely used sensors to measure methane concentrations ndash which had been used in the Allen study ndash routinely malfunctioned under-reporting methane concentrations The US Argonne National Laboratory which co-ordinates the reporting of US carbon emissions noted that the sensor might be under-reporting methane levels by three to five timesIn 2016 the Environmental Defense Fund who had part-funded it rejected the Allen study results
Misleading Parliament and the publicFrom the date of its publication the Mackay-Stone report has been flawed ndash because of the approach taken to calculating the impacts of shale gas particularly the selection of data used in the calculationsDECC and its authors defended this by referencing the Allen study as proof that emissions could be reduced to levels where the impacts would be lsquosmallrsquoNow that the Allen study has been shown to be flawed the Mackay-Stone report has been definitively invalidated too However that has not stopped ministers and Parliamentarians quoting it to support the Governmentrsquos policies on oil and gas extractionCurrent serving ministers ndash such as Michael Fallon Andrea Leadsom and Amber Rudd ndash have all quoted Mackay-Stone to defend government policy Arguably this breaches the Ministerial Code as the ministers involved have given inaccurate information to MPs
lsquoone of the most widely used sensors to measure methane concentrations ndash which had been used in the Allen study ndash routinely malfunctioned under-reporting methane concentrationsrsquo
lsquothe sensor might be under-reporting methane levels by three to five timesrsquo
7
The representation of scientific research in the media and political debate primarily concentrates upon the results That can easily be misleadingWhat is often neglected in reporting is the process or method by which those results were generated and how the data fed into calculations was sourced or measured (or quite frequently estimated)Least of all do we find that the lsquocertaintyrsquo we might have in those results is explained as part of reporting and why the results are uncertainOver recent years a debate has emerged within the environmental sciences over how the impacts of the oil and gas industry are measured and reported Explaining why the differing sides in this debate produce such starkly differing results goes a long way to explaining why the debate exists ndash and what confidence we can have in those resultsIn its recent promotion of unconventional oil and gas extraction in Britain the Government in Whitehall (in contrast to Edinburgh or Cardiff) has always taken an industry-friendly stance As a result the scientific reviews commissioned by Whitehall have failed to look at the whole range of research available on the ecological impacts of fracking Consequently they fail to explain to the public why disagreements exist over the science of how we measure the impacts of lsquofrackingrsquoThis report seeks to explain how the debate over the gaseous emissions from lsquofrackingrsquo and their impacts on climate change has changed over the last few years ndash and precisely why that debate is critical to how the Whitehall Government has justified and promoted onshore oil and gas extraction in BritainFinally this report covers just one facet of the lsquofrackingrsquo issue in the UK ndash climate change The information presented here also has a significant effect for example on how we assess the health impacts of gaseous emissions Other similarly detailed studies could be written on critical issues such as waste management landscape impacts
Whitehallrsquos lsquoFrackingrsquo Science Failure
human and ecological health impacts or energy policyWhat this issue has lacked since the issuing of the first licences for exploration in 2008 is a full and transparent assessment of the Governmentrsquos policy taking into account the latest available research studies Until such a review takes place UK policy on on-shore oil and gas will remain demonstrably flawed and an arguable danger to human health and the localglobal environment
Paul MobbsMobbsrsquo Environmental Investigations amp ResearchFebruary 2017
How The Government Has Misled Parliament And The Public On The Climate Change Impacts Of Shale Oil And Gas Development In Britain
8
The debate over lsquofrackingrsquo and climate change in the UK1 In September 2013 launching the Mackay-Stone review on the climate change impacts of shale gas in the UK Energy Secretary Ed Davey stated 1Gas as the cleanest fossil fuel is part of the answer to climate change as a bridge in our transition to a green future especially in our move away from coal
2 This assertion that shale gas is a ldquobridgerdquo to a clean energy future has been repeated many times by Government ministers industry figures and Parliamentarians since that date Even the Church of England2 has thrown their support behind the climate benefits of shale gas using the same argument
3 The Governmentrsquos recent update3 to their guidance on shale gas was produced by the Department for Business Energy and Industrial Strategy (BEIS) on the 13th January 2017 In relation to the impacts upon climate change it statesIn September 2013 Professor David MacKay (then the Department of Energy and Climate Changersquos Chief Scientist) and Dr Timothy Stone wrote a report on potential greenhouse gas emissions from UK produced shale gas They concluded that the overall effect of UK shale gas production on national emissions is likely with the right safeguards to be relatively small Indeed emissions from the production and transport of UK shale gas would be comparable to imported Liquefied Natural Gas (LNG) and much lower than coal when both are used to generate electricity
4 This updated report was the first detailed statement on shale oil and gas to be produced by the new BEIS department since its formation almost six months earlier ndash after the Department of Energy and Climate Change (DECC) was disbanded However the substance of that statement has not changed since DECC evolved the bulk of the UKrsquos policy on shale oil and gas between 2010 and 2014 and in relation to the emissions from shale gas since Ed Davey launched the Mackay-Stone review in 2013
5 The purpose of this report is to examine whether there any is evidence
to back up these statements and the quality of the research that current unconventional oil and gas policy is based upon
6 The week before BEIS issued their updated shale guidance the House of Commons Library had reissued their research briefing on Shale Gas and Fracking4 for Members of Parliament This report depicts a far less certain case statingA report on this was published by the then Department for Energy and Climate Change in September 2013 in which shale gas emissions were said to be similar to those of conventional gas and lower than those of coal and LNG leading the Secretary of State to describe shale gas as a lsquobridgersquo to a low-carbon future However the Committee on Climate Change concluded in July 2016 that the implications of shale gas for greenhouse gas emissions are uncertain and that shale gas exploitation on a significant scale will not be compatible with UK carbon budgets unless tests in relation to emissions gas consumption and carbon reductions elsewhere are satisfied
7 At the heart of the Mackay-Stone review5 ndash which provides the core climate justifications for UK shale oil and gas alongside scientific reviews from the Royal Society6 and Public Health England7 ndash is a calculation of the emissions from shale gas operations The figures used in that calculation are based upon the findings of various studies of the emissions from shale oil and gas operations
8 The problem for the Governmentrsquos case is that not only that new evidence casts doubt on some of the figures quoted in the Mackay-Stone review the key study they cite ndash by Allen et al which at the time of the Mackay-Stone review had not yet been published ndash has since been shown to be seriously flawed by more recent research studies
The debate before the Mackay-Stone review9 Before shale gas and lsquofrackingrsquo provoked a scientific debate which has shone a light on the issue of emissions from the oil and gas industry as a whole very little was known about lsquofugitive emissionsrsquo (the gases which leak or are vented as part of the everyday operation of an industrial
lsquoGas as the cleanest fossil fuel is part of the answer to climate change as a bridge in our transition to a green future especially in our move away from coalrsquo Ed Davey
lsquoThis assertion that shale gas is a ldquobridgerdquo to a clean energy future has been repeated many times by Government ministers industry figures and Parliamentarians since that date Even the Church of England has thrown their support behind the climate benefits of shale gas using the same argumentrsquo
9
these components are then measured under test conditions either under specially engineered conditions in the field or under laboratory simulation
16 To assess the emissions from a single unit or a large area or production field an lsquoinventoryrsquo of all the component leakslosses is created The sum of the component losses then indicates the total level of emissions The problem with the inventory approach is that components or whole installations can sometimes go missing from the calculation process ndash artificially lowering the results
17 The main difficulty with inventory analysis from a lsquocertaintyrsquo point of view is that it often portrays emissions under idealized conditions
18 To fit monitoring equipment to an industrial process requires that the facility be built or modified to include that equipment For that reason the samples may not be representative of the lsquonormalrsquo levels of construction quality and design and may only reflect the emission standards of lsquonewrsquo plants ndash not the level of emissions after a long period of use wear and corrosion of the system
lsquoTop-downrsquo analysis19 lsquoTop-downrsquo analysis involves taking a sample of pollution levels in the environment ndash either from air water or even from soil if studies of solid deposition are being used Then the dilution of the
process) from oil and gas extraction What was considered to be lsquoknownrsquo was in fact largely an assumption based upon limited data from the oil and gas industry10 For example in January 2011 when the Tyndall Centre Manchester published its first review8 of the potential climate impacts of shale gas they considered the fugitive emissions from the process to be ldquoinsignificantrdquo This conclusion followed-on from the conclusions of a New York State Department of Environment and Conservation (NYDEP) study9 which in turn was based on US oil and gas industry studies carried out as far back as the 1980s
11 This illustrates the low priority given to the climate impacts of oil and gas production prior to 2011 ndash in part because the focus on methane and other gases was primarily an issue of physical health and safety for workers and the public not their climate impacts
12 What has always limited the ability to measure the emissions from oil and gas infrastructure in the field has been the accuracy and reliability of mobile gas monitoring equipment As a result two general forms of environmental sampling have arisen in order to produce an estimate of emissions from the industry lsquobottom-uprsquo or lsquoinventoryrsquo analysis and lsquotop-downrsquo or lsquoinstrumentalrsquo analysis
13 The public debate on fugitive emissions has tended to be over the numerical results of individual studies not the difference in numerical results which is the inevitable consequence of using two different analytical methods Thus the lsquoqualityrsquo or lsquoaccuracyrsquo of each approach is ignored
lsquoBottom-uprsquo analysis14 lsquoBottom-uprsquo analysis is used not only in the oil and gas industry but also in the chemicals industry and other large-scale polluting processes It is described as ldquobottom-uprdquo because it works from the level of emissions at each small part of the system scaling-up to the total emissions from the whole system under test It is synonymous with lsquoinventory analysisrsquo
15 In an lsquoinventoryrsquo analysis an industrial process is broken down into its component parts ndash valves pipes tanks vents etc The emissions from each of
lsquoThis illustrates the low priority given to the climate impacts of oil and gas production prior to 2011rsquo
10
a periods of many hours or days ndash meaning they are slow to respond to large short-term changes in pollution levels By taking almost instantaneous samples it is possible to find not only the level of pollution but also the statistical range of emissions varying over time
23 The principal draw-back with instrumental sampling is the ability to distinguish between different sources of the same pollutant which might be geographically near to each other As analytical techniques improve different ways have been found to discriminate between different sources of the same pollutant usually through more elaborate forms of testing which differentiate a lsquofingerprintrsquo for the source of interest against background levels
The lsquotop-downrsquo versus lsquobottom-uprsquo contention over shale emissions24 The oil and gas industry nearly always utilizes inventory-based lsquobottom-uprsquo analyses when quoting their environment emissions However the use of this data is
sample as a result of its transport from the source to the monitoring (or lsquoreceptorrsquo) point is calculated This gives a measure of how much pollution was emitted at the source Once other potential sources of pollution have been excluded ndash which can be a significant confounding factor in the process ndash it is possible to express the total emissions from a single site or with sufficient monitoring over a wide area an entire field
20 It is called ldquotop downrdquo because from a measure for the whole system the emissions from parts of it are broken down to their constituent parts
21 It is only with the recent development of mobile miniaturized and accurate sensors that reliable samples of environmental pollution can be carried out at low cost lsquoin the fieldrsquo Prior to this samples had to be physically collected and analysed under laboratory conditions or large and highly specialized equipment had to be assembled in the field ndash which restricted the scope of its use
22 The great benefit of top-down analysis is that it can give far better temporal resolution to the measurement of pollution Older monitoring technologies (for example diffusion tubes) are designed to assess the levels of pollution emitted over
looking more doubtful for environmental regulation10 as the emergence of more versatile methods of sampling over the last two decades which question the accuracy of bottom-up analyses
25 The problem is that the data itself ndash from either method ndash can be so variable that itrsquos not possible with reasonable confidence to state a fixed answer There can be so many factors involved that the quoted levels might vary over a wide range This is in part why the public debate is so lsquouncertainrsquo it allows the industry and regulators to exploit doubt11 in order to argue against changing the regulatory status quo
26 To address this uncertainty in the USA the National Oceanographic and Atmospheric Administration (NOAA) has funded a long-term project12 to measure levels of atmospheric gases around oil and gas facilities This involves the use of aircraft which are equipped with an array of gas monitoring equipment which are flown back and forth across the area of interest Other studies use trucks which can drive around production fields In Australia studies have used smaller land cruiser vehicles equipped as mobile gas laboratories which drive around gas production fields sampling a variety of gases13
11
27 What the results of instrumental analysis have shown is that the accuracy of bottom-upinventory analyses is far poorer than previously thought14 These assessments appear to always under-estimate the total level of emissions The discrepancy in results between the two methods can be a factor of two to four times or higher Another study15 of the use of the inventory method more generally including other sectors such as agriculture also found that it significantly under-estimated measured levels of emissions
28 What is more interesting is that as a result of safety valves or flare stacks operating emission levels can change enormously from moment to moment for short periods This creates what is statistically called a lsquoheavy-rsquo or lsquofat-tailedrsquo distribution where many sites produce a relatively similar level of pollution but a subset ndash often called lsquosuper-emittersrsquo ndash will produce far more16
29 While the wide swings in pollution levels have significance for climate change impacts it is far more relevant to the assessment of public health impacts17 The assessment of pollution on public health has also historically relied on inventory assessments of gaseous emissions Any large under-estimate of emissions under the current regulatory regime potentially has a high impact on public health For this reason there has been an apparent official reluctance to discuss the implications of recent top-down studies
Government shale gas policy and the Howarth study30 The Government began their push for lsquounconventionalrsquo oil and gas in Britain in 2008 as part of DECCrsquos 13th Landward Oil and Gas Licensing Round18 The licences issued by the Government in 2008 are the ones which are current being drilled for shale gas shaletight oil and coalbed methane Those issued more recently will be actively explored within the next few years
31 In 2010 as part of the 14th Licensing Round19 greater emphasis was put on opening up Britain to hydraulic fracturing for oil and gas That round should have been completed in 2012 but
due to the controversy created the final licences were not awarded until mid-2016
32 The contention of the Government has been that unconventional oil and gas production is broadly equivalent to conventional oil and gas production The flaws in that assumption can be clearly seen if you compare the Governmentrsquos first strategic environmental appraisal20 (SEA) report for the 14th Licensing Round in 2010 ndash which had to be withdrawn in 2012 due to its evidential flaws ndash with the second SEA report21 produced in December 2013 The second report indicated far higher levels of environmental impacts compared to the first
33 As evidence from the US Canada and Australia has accumulated over the last decade or so the Governmentrsquos assertion of lsquoequivalencersquo has become increasingly strained That includes both the economic impacts of shale gas its environmental impacts and its implications for climate change
34 The greatest challenge to the Governmentrsquos assertion of lsquoequivalencersquo came with the publication of a study22 by Howarth Santoro and Ingraffea in June 2011 The study not only said that shale gas was significantly worse than conventional gas but also potentially worse than coal This conclusion challenged the Governmentrsquos key claim that shale gas could be a ldquobridgerdquo to a low carbon economy
35 The reasons why the Howarth study produced such a different result to other industry studies are complex It is not just an issue about the lsquobottom-uprsquo versus lsquotop-downrsquo methodology outlined earlier It also encompasses a debate over the relative importance of different gases to climate change and how this is assessed and over what period of time as part of the analytical process within the study
36 The Howarth study utilizes data from a wider range of sources including top-down analyses What is also significant are the time-weighted lsquoglobal warming potentialrsquo (GWP) figures used to assess the impacts of methane This included an assessment over 20 years rather than 100 years This gives a far higher impact in the short-term due to the enhanced effect of methane on climate change compared to carbon dioxide
lsquoThe study not only said that shale gas was significantly worse than conventional gas but also potentially worse than coal This conclusion challenged the Governmentrsquos key claim that shale gas could be a ldquobridgerdquo to a low carbon economyrsquo
12
37 The justification for this subsequently backed by the IPCC23 is that the uncertainty regarding climate tipping points24 requires that we consider short-term impacts as well as those operating over a century
38 There was a critique of the Howarth study from Cathales et al25 published in January 2012 It was critical of the data sources used by the Howarth study ndash as they were not representative of the inventory-based estimates used by the industry and US Environmental Protection Agency ndash and the use of short- rather than long-term GWP figures for methane Howarthrsquos response to this paper26 published in July 2012 highlighted the failure of Cathales to model the whole gas system (their paper had only considered power generation) and included updated leakage information showing that their original paper had used representative data
The Mackay-Stone review of shale gas emissions39 The controversy over the climate emissions from shale gas led DECC to commission a detailed report from their Chief Scientific Adviser David Mackay and economist Timothy Stone Their report was commissioned as a general assessment of the climate change impacts of shale gas but when reading the report it is clear that one of the key aims was to deflect any criticisms of Government policy as a result of the Howarth study
40 The Mackay-Stone review concludedWe have used these US studies to estimate the potential for fugitive emissions from shale gas in the UK with the understanding that actual emissions will vary according to local circumstances and that we must be cautious when extrapolating results We have gathered available information on the carbon footprint of shale gas to inform our estimate of the potential impacts of shale gas exploration extraction and use in the UK on UK climate change objectivesWith the right safeguards in place the net effect on UK GHG [greenhouse gas] emissions from shale gas production in the UK will be relatively small
41 The method of calculation used in the Mackay-Stone report is acceptable The issue which is the subject of debate is the selection of the data fed into those calculations
42 In order to compare different energy sources such as natural gas and coal their impacts must be converted into a standard unit for comparison This also requires that the differing impacts of the greenhouse gases produced ndash such as carbon dioxide and methane ndash also be converted to a common value
43 Studies such as the Mackay-Stone report express values as lsquoequivalentrsquo greenhouse gas emissions per unit of energy produced Producing these figures requires that certain values are known precisely in order to calculate those equivalent figuresbull The amount of lsquofugitiversquo leaks
and system losses must be accurately known in order to take account of the greenhouse gas emissions lost from the process
bull The amount of energy produced by a gasoil well over its operating life must be known to get a figure for the energy produced and
bull There must be a standard approach to assessing the impacts of different greenhouse gases using lsquoglobal warming potentialsrsquo (GWPs) to produced a harmonized measure of climate impacts over time
44 On all of these points the Mackay-Stone report fails to adequately represent the range of available data correctly More critically because they failed to address the uncertainties involved in producing the data using different methodologies the way they express their results tends to improve the case for shale gas relative to other fossil fuel sources
Fugitive emission estimates45 To evaluate the range of figures for fugitive emissions of gas the Mackay-Stone study takes various figures for emissions and then produces a statistically weighted figure for the level of emissions However the figures from the Howarth study were specifically excluded from the results quoted in the final conclusion of the report (see paragraphs 5051 pages 2122 and paragraph 72 page 26 of their report)
lsquoThe method of calculation used in the Mackay-Stone report is acceptable The issue which is the subject of debate is the selection of the data fed into those calculationsrsquo
13
46 The results from the Howarth study were classed as an ldquooutlierrdquo to the other data and were excluded to prevent them skewing the reportrsquos final results
47 Though new research studies results were available at the time their report was compiled and although these results were consistent with the range of the results in the Howarth study these results were not included in the Mackay-Stone calculations either
48 To justify this Mackay and Stone referenced an as yet at that time unpublished study from the University of Texas ndash the Allen study27 This was believed to provide an authoritative response to the Howarth and the other top-down studies as it demonstrated that low levels of fugitive emissions could be achieved with lsquoreduced emissions completionsrsquo (RECs)
49 What this means is that the data upon which Mackay and Stone base their estimates of emissions are predominantly bottom-up lsquoinventory studiesrsquo ndash rather than the direct measurement of emissions in shale production areas produced by top-down studies There is growing concern about the accuracy of inventory-based statistics28 since in-field sampling has demonstrated that using inventory-based data routinely under-report emissions29
Estimates of gas production per well50 The figures for gas production used by Mackay and Stone are listed in paragraph 68 of their report They assumed that gas production per well ranges from 2 billion cubic feet (bcf) to 5bcf with a lsquocentralrsquo estimate of 3bcf There is no clear independent source for this data51 The report acknowledges that data from the US indicates a much lower range of gas production ndash 004 to 26bcf per well 30 In paragraph 35 of their report Mackay and Stone argue that ldquoeconomic factorsrdquo will determine the level of gas produced from a well rather than geophysics ndash an assertion which is not substantiated by independent evidence
52 The difficulty for Mackay and Stone is that the emissions data they use
is based upon wells operating at a lower range of production Higher levels of gas production per well ndash for example due to higher gas pressureflows or the result of more intensive hydraulic fracturing ndash would lead to greater levels of fugitive emissions Consequently using a higher gas production figure with existing emissions data is likely to lead to an under-estimate of fugitive emissions
53 Getting the correct figures for production is essential Recent research 31 highlights that the overall level of oil or gas production (the lsquoestimated ultimate recoveryrsquo or EUR) is a sensitive variable in life-cycle models Small variations have a significant impact upon results
54 Therefore even if we accept Mackay and Stonersquos arguments in relation to the amount of gas production per well that argument also requires that we must scale-up the level of impacts in order to reflect the greater gas flow and thus leakage
55 More importantly the use of an excessively high EUR figure in their calculations would lead to a significant under-estimate of the climate change impacts of unconventional oil and gas It would artificially lower the impacts reported in their results
Global warming potentials (GWPs)56 As outlined in paragraph 65 of their report Mackay and Stone assume that methane is 25 times more potent a greenhouse gas than carbon dioxide over a 100 year period (abbreviated lsquoGWP100rsquo) This is not the approach taken within Howarthrsquos calculations which considers both 20-year (lsquoGWP20rsquo) and 100-year lsquoglobal warming potentialsrsquo (GWPs)
57 Methane is significant in the short-term because it has a greater effect upon warming than carbon dioxide As we approach critical tipping points32 in the climate system though the long-term prognosis33 will be dominated by carbon dioxide the short-term impacts of methane could exacerbate the progress of climate change Therefore we must avoid large changes in the emission of critical greenhouse gases such as methane34
ldquoeconomic factorsrdquo will determine the level of gas produced from a well rather than geophysics ndash an assertion which is not substantiated by independent evidence
14
58 This is why Howarth uses a lsquoGWP20rsquo figure in his 2011 and subsequent papers
59 In his 2014 update35 of the original research paper Robert Howarth outlined how the case for higher methane emissions had become more certain as a result of further lsquotop-downrsquo environmental sampling He also considered new research from the Intergovernmental Panel on Climate Change (IPCC) which had made the case that studies should use the GWP20 figure in assessments as well as GWP100 to reflect the time-sensitive impact of emissions
60 The IPCCrsquos 2013 review36 of the science states thatThere is no scientific argument for selecting 100 years compared with other choices The choice of time horizon is a value judgement because it depends on the relative weight assigned to effects at different times Other important choices include the background atmosphere on which the GWP calculations are superimposed and the way indirect effects and feedbacks are included
61 Mackay and Stonersquos failure to consider the short-term impacts of methane emissions is questionable since methane emissions have become a significant concern in our attempts to limit climate change
62 GWPs are also significant because they affect the point at which leakage eliminates the climate benefits of using gas for power generation For example a recent modelling study by Sanchez and Mays37 indicates that compared to coal while over 9 of gas could leak at GWP100 before its climate benefits are negated less than 4 need leak for its benefits to be eliminated at GWP20 ndash which again is an issue which the Mackay-Stone report failed to elucidate
63 Given the dominant greenhouse gas footprint of methane Mackay and Stone should have used a 20-year GWP to properly assess the contribution of additional methane releases This also has implications for the level of acceptable leakage which is permissible by regulators
The impact of Mackay and Stonersquos decisions on their results64 The effect of the decisions over data selection and analysis taken by Mackay and Stone have very clear impacts on the results presented in the reportbull Selecting predominantly lsquoinventory-
basedrsquo measures of fugitive emissions gives a lower result ndash it has been known for some time that inventory analyses under-estimate emissions
bull Excluding as lsquooutliersrsquo the data from instrumental sampling in the field ndash from the studies by Howarth Peacutetron38 and Karion39 ndash significantly reduced the statistical range of the results produced especially with regard to the comparison with liquefied natural gas (LNG)
bull Using a very large figure for gas production when the figures for fugitive emissions are based on much lower well production figures artificially reduced the impacts of shale gas and
bull Using only a GWP100 figure rather than the GWP20 used by Howarth and others will also produce a lower result as it excludes the short-term effects of methane upon warming
65 The result of Mackay and Stonersquos decisions on their use of data is to improve the case for shale gas over other energy sources In general ldquoback of the enveloperdquo termsbull The figures used for emissions are
perhaps half or less of what is being observed in the field from actual shale gasoil operations
bull The figures used for gas production are roughly twice that found in the USA and therefore
bull If we divide half by two we can roughly say that Mackay and Stonersquos results under-estimated the impacts of shale gas production by a factor of four
66 In reality the band of potential results is very broad depending upon the assumptions made in the data Itrsquos this uncertainty in results which fuels the confusion of impacts within the current debate on emissions
lsquoThis also has implications for the level of acceptable leakage which is permissible by regulatorsrsquo
15
67 For example recent evidence suggests is that a large proportion of the methane leakage from shale gas production comes not only from the well site but also from the gas compressor stations40 where the raw gas is cleaned and standardized for injection into the gas network ndash a source not properly evaluated in Mackay and Stonersquos calculations
68 The appendices of the Mackay-Stone report contained tables produced from a spreadsheet That spreadsheet was not made available for further analysis by DECC when they released the report As part of my own analysis of the Mackay-Stone report I replicated this spreadsheet41 initially to reproduce the calculated results presented in the tables of the report Having established the baseline results presented in the report I was able to vary the data fed into the model (as outlined in Appendix A of the report written to document42 that analysis) in order to study the sensitivity of Mackay and Stonersquos assumptions
69 Remedying the perceived problems in the data used by Mackay and Stone the results presented in their report increased by around 250 That contrary to the claims of their report means that shale gas is less favourable than imported piped gas or LNG
70 It is difficult to modify the model to implement the 20-year GWP due to the conditions under which the data fed into the model was collected As a rough approximation using a 20-year GWP produces results which are not significantly lower than Howarthrsquos 2011 study In fact the use of Mackay and Stonersquos results to criticise the case as to why lsquoshale was worse than coalrsquo given the distinct analytical assumptions between each study is of itself misleading If you use a 20-year GWP like Howarthrsquos study the case for natural gas versus coal will almost inevitably disappear
71 The failures in data selection and analysis within Mackay and Stonersquos report creates questionable results This was clearly foreseeable in late 2013 as a result of the emerging research then available and their failure to highlight these uncertainties in their report and reflect this in their advice is a serious omission Their selection of data in particular the figures for gas production are highly suspect given that each
decision has the effect of enhancing the case in support of shale gas Consequently we can have little faith in the accuracy of their results
Subsequent research on unconventional oil amp gas impactsThe AllenUniversity of Texas study72 As stated by Mackay and Stone a few weeks after their report was published the Allen study43 was published in the Proceedings of the National Academy of Sciences (PNAS) Almost immediately it ran into problems
73 The first problem emerged only a few weeks after its initial release The authors had declared no conflict of interest at the time of publication A few weeks later PNAS had to publish a correction to note the various connections between certain authors of the study and the oil and gas industry
74 The most significant criticisms emerged in the months following publication when other researchers had a chance to study the data These criticisms not only call the results of this study into question but by their reliance upon it to justify excluding Howarthrsquos data it negates the conclusions drawn by Mackay and Stone in their report too
75 Allenrsquos research was an lsquoinventory-basedrsquo study Whatrsquos equally significant is the number and type of oil and gas facilities involved It statesEmission measurements were performed for 27 well completion flowbacks 9 liquids unloadings 4 well workovers and 150 production sites with 489 hydraulically fractured wells Data are summarized here for the well completion flowbacks liquids unloading and production site emissions
76 In reality no general trend can be drawn from the evidence in this paper since the sites under investigation were not properly identified It is not stated whether these operations were carried out at shale gas coalbed methane tight gas or associated oil and gas production sites ndash
lsquoThe figures used for emissions are perhaps half or less of what is being observed in the field from actual shale gasoil operationsrsquo
lsquoThe authors had declared no conflict of interest at the time of publication A few weeks later PNAS had to publish a correction to note the various connections between the authors of the study and the oil and gas industryrsquo
16
to minimise emissions during the tests
Discrepancy between inventory- and instrumental-based surveys83 The studies recently carried out by the NOAA of US facilities44 ndash not just oil and gas sites but also landfills and intensive agricultural operations ndash are enabling a far more accurate analysis of greenhouse gas emissions to be carried out What these studies show is that lsquobottom uprsquo inventory-based studies tend to significantly under-estimate the level of emissions as compared to lsquotop downrsquo environmental sampling
84 The significance of this debate for the Mackay-Stone review is that their data is based almost entirely on bottom-up inventory studies Recent top down sampling studies ndash such as those produced by Howarth ndash were left out of the calculations upon which the reportrsquos final conclusions were based This means that the true value of emissions is likely to be be much greater than those described by Mackay and Stone
85 At the time the Mackay-Stone review was compiled (JulyAugust 2013) there were already a number of research studies45 which indicated that there were problems with inventory-based estimates of emissions The Mackay-Stone report did not use this data to form the main conclusions of the report Instead they referenced the as yet unpublished bottom-up inventory study by Allen in order to justify their exclusion of these other research studies
86 Mackay and Stone also omitted the study by Peischl46 published in May 2013 This demonstrated that inventory-based studies did not correlate to the levels of atmospheric pollution observed from environmental sampling Using an aircraft-based analysis of particular trace gases they were able to break-down the emissions by source demonstrating that one large source of methane was likely to be the oil and gas industry (in addition to landfills and agriculture)
87 A study published shortly after Mackay and Stonersquos report by Miller47 indicated the scale of the problem In its analysis of methane emissions in the US
or a combination of all of these Different types of source rock produce different rates of flowback Without more detailed information on the precise source type and location it is not possible to integrate these results with other studies ndash and certainly not with the situation in the UK
77 For example all that the supplementary information appendix for the paper states is thatOf the 27 completions sampled in this work five were in the Appalachian region seven in the Gulf Coast region five in the Mid-Continent region and ten in the Rocky Mountain region
78 One of the significant flaws of this study is that the sites selected do not represent a randomized sample The sites were selected by their industry partners who were not identified in the study What is more the sites sampled represent only 01 of the on-shore conventional and unconventional wells in the USA
79 Therefore we must question whether such a small and non-randomized sample of the total population of on-shore wells can be considered statistically significant ndash or whether these results are applicable even to the national US emissions profile let alone that of other states such as the UK
80 As is stated in the Allen studyThe uncertainty estimate does not include factors such as uncertainty in national counts of wells or equipment and the issue of whether the companies that provided sampling sites are representative of the national population
81 This point is outlined further in the supporting information for the studyThe nine companies that participated in this study included mid-size and large companies While there are thousands of oil and gas companies in the US and small companies were not part of the participants the participants do represent a sizable sample of overall US production and well count Representativeness cannot be completely assured however since companies volunteered and were not randomly selected
82 It is entirely possible that all the sites selected by the industry for inclusion the Allen study were sites with the highest likelihood of achieving low emissions due to the characteristics of the site or because the operators took special care
even though the authorsrsquo own secondary measurements made by the downwind tracer ratio technique confirmed the BHFS sensor failure That such an obvious problem could escape notice in this high profile landmark study highlights the need for increased vigilance in all aspects of quality assurance for all CH4 emission rate measurement programs
17
it estimated the discrepancy between actual versus inventory based emissions to be 49 plusmn 26 times larger than the USEPArsquos most comprehensive global methane inventory Again that large lsquoplusmn26rsquo uncertainty illustrates the problem of assessing the true impacts
88 Since 2011 when Howarth et al published their study there have been many papers published which challenge the accuracy of inventory-based studies These are listed together with an extract of their significant findings in Table 1 ndash reproduced at the end of this report
89 Taken together what these studies are beginning to show is that inventory-based methods are systematically under-estimating the true level of emissions How great that discrepancy is varies across different industrial sectors and across sites within each sector For example due to the geophysical variations in the oil and gas basins within the USA environmental sampling shows that the emissions from each shale oilgas production region vary significantly
90 Irrespective of the precise level of the variation the problem for the Mackay-Stone review and for the UK Government in general is that the benefits claimed in the report cannot be supported when we look at the latest research on the emissions from shale oil and gas production Those benefits were uncertain in 2013 when the Mackay-Stone report was produced Today it is not possible to claim any validity for the findings of the report now there is extensive sampling to show that inventory-based emissions estimates are significantly understated
Flaws in sensors and their implication for emissions estimates91 The final blow for the Allen study and thus for the results of the Mackay-Stone report came in late 2015early 2016 Allen and other inventory studies use methane sensors installed within the system under test in order to quantify the levels of methane present in the system
Those levels inform the level of emissions using flow analysis to calculate the levels of methane which leak to atmosphere
92 In the Summer of 2015 a paper published by Howard48 highlighted the failure of a commonly used methane sensor under certain test conditions ndash and the implications this had for monitoring and emissions inventories in the natural gas industry In a subsequent paper49 in September Howard outlines how the Allen study had used these sensors to collect data and how the data presented in the paper demonstrated that the methane measurements were influenced by the failure of the sensor
93 As a result the data stated in the Allen study ndash irrespective of the issues with inventory analyses in general ndash were likely to understate the true level of emissions from the equipment under test
94 Howardrsquos second September 2015 paper concludedSensor transition failure is clearly apparent in the BHFS [Bacharach high flow sensor] measurements made in the UT study by Allen et al as evidenced by the rare occurrence of high emitters at sites with lower CH4 (lt91) content in the well-head gas The occurrence of this sensor transition failure was corroborated by field tests of the UT BHFS during which it exhibited this sensor failure as well as by tracer ratio measurements made at a subset of sites with lower well-head gas CH4 concentrationsFinally it is important to note that the BHFS sensor failure in the UT study went undetected in spite of the clear artefact that it created in the emission rate trend as a function of well-head gas CH4 content and even though the authorsrsquo own secondary measurements made by the downwind tracer ratio technique confirmed the BHFS sensor failure That such an obvious problem could escape notice in this high profile landmark study highlights the need for increased vigilance in all aspects of quality assurance for all CH4 emission rate measurement programs
95 These two papers in addition to the other research outlined above have caused a significant shift in the approach to both emissions sampling and inventory analysis
96 In October 2015 in an update50 to the US national greenhouse gas emission model the Argonne National Laboratory
lsquoThe final blow for the Allen study and thus for the results of the Mackay-Stone report came in late 2015early 2016rsquo
lsquothe data presented in the paper demonstrated that the methane measurements were influenced by the failure of the sensorrsquo
18
noted the growing discrepancy between the inventory-based model they used and the available real-world sampling On the evidence presented by the Howard studies the report notedHoward (2015) published a study indicating that the high-flow sampling equipment used in the University of Texas studies had a sensor failure that caused a systematic underestimation of CH4 emissions The key evidence was the lack of high emitting observations in those studies at gas compositions where the sensor is known to fail Separate tracer measurements done by Allen et al at some of the well sites suggest the high-flow measurements were a factor ranging from three to five too low
97 The implication is that emissions from the US oil and gas industry have been significantly underestimated That in turn has affected the models created to assess the emissions as part of the USArsquos monitoring of national emissions which are then reported to the United Nations Climate Change Convention
98 At the beginning of February 2016 a paper by Turner51 highlighted the growth in global methane emissions measured by satellite observations It also postulated that US unconventional oil and gas production could be a factor in the increased global methane footprint
99 This finding is also backed up by recent research52 published by the Environmental Defense Fund (EDF) EDF were the backers of the Allen study in 2013 Their 2016 publication contradicted that research having found that methane emissions are significantly greater than anticipated under inventory-based studies
100 Recent research suggests that confidence in the Allen study is misplaced not only because of its uncertainties regarding sample selection but also because the data it presents is demonstrably wrong As a result the reliance of Mackay and Stone upon the Allen study to justify their exclusion of environmental sampling-based studies from unconventional oil and gas sites has also failed Given the weight of available evidence BEIS and Parliament can have no confidence in the reliability of Mackay and Stonersquos conclusions
How the Mackay-Stone report has misled the debate on lsquofrackingrsquo101 The Department of Energy and Climate Change (DECC) commissioned the Mackay-Stone review to promote their shale gas policy ndash and to support their ldquolow carbonrdquo claims in relation to shale gas against the research published by Howarth and others between 2011 and 2013
102 Subsequent research on shale emissions ndash culminating in Howardrsquos research looking at flaws in the Allen paper on which the Mackay-Stone review relies in order to dismiss recent research findings as ldquooutliersrdquo ndash demonstrates that the data presented in the Mackay-Stone review is flawed
103 Despite this and though myself and others have pointed out the flaws in Whitehallrsquos policy on shale gas and climate change there has been no review of the findings of the Mackay-Stone report
Parliamentary debates and the Mackay-Stone report104 Arguably DECC and more recently the new Department of Business Energy and Industrial Strategy (BEIS) have actively misled the public over the likely emissions from shale oil and gas There are numerous examples of where ministers have quoted the Mackay-Stone report and have attributed to it a level of certainty which cannot be supported if we look at the available body of evidence on emissions
105 For examplebull In October 2013 then Minister of State
for Climate Change Greg Barker stated in response to a Parliamentary question53 and citing the Mackay-Stone report that shale gas was compatible with the Governmentrsquos climate change commitments
bull In March 2014 during a debate in the House of Lords54 DECC Parliamentary Under-Secretary of
lsquoemissions from the US oil and gas industry have been significantly underestimatedrsquo
lsquoGiven the weight of available evidence BEIS and Parliament can have no confidence in the reliability of Mackay and Stonersquos conclusionsrsquo
lsquoThere are numerous examples of where ministers have quoted the Mackay-Stone report and have attributed to it a level of certainty which cannot be supported if we look at the available body of evidence on emissionsrsquo
19
State Baroness Verma stated that the Mackay-Stone report concluded that the carbon footprint of UK-produced shale gas would be lower than imported gas
bull In June 2014 in response to a question55 the Minister of State for Energy Michael Fallon stated that the Mackay-Stone review concluded that emissions from shale gas production in the UK would be relatively small
bull In September 2015 Parliamentary Under-secretary of State for Climate Change Amber Rudd misled Parliament when she made a statement to the House56 saying lsquostudies have shown that the carbon footprint of electricity from UK shale gas would be likely to be significantly less than unabated coal and also lower than imported liquefied natural gasrsquo
bull In January 2015 Amber Rudd also gave a similar statement57 to the Public Bills Committee as part of the debate over the Infrastructure Bill ndash which created a legal imperative to maximize the production of the UKrsquos oil and gas resources
bull In January 2016 the Minister of State at the Department of Energy and Climate Change Andrea Leadsom stated in two Parliamentary questions58 that the carbon footprint of shale gas extraction and use is likely to be comparable to conventional sources of gas and lower than imported liquefied natural gas
106 The significance of the Mackay-Stone report in deflecting criticism can be illustrated when we look at instances when Parliamentarians have considered a wider range of evidence
107 For example in advance of the debate on amendment to the Infrastructure Bill the Commons Environmental Audit Select Committee conducted an inquiry into the Environmental Risks of Fracking Various respondents including myself59 gave evidence on the shortcomings of the analysis of the Mackay-Stone review In their final report60 the Committee referenced my evidence (para 81 of their report) and on the issue of the uncertainties in the science concluded thatWe called in Part 2 for a moratorium on fracking because it cannot be accommodated within our climate change obligations A halt is also needed on environmental grounds and it is essential that further independent studies into the impacts of fracking in the UK are
completed to help resolve the environmental risk uncertainties It is vital that the precautionary principle is applied Until uncertainties are fully resolved and the required regulatory and monitoring system improvements we identify are introduced there should also be a moratorium on the extraction of unconventional gas through fracking on environmental grounds
108 That call for a moratorium was ignored in the Parliamentary debate on the Infrastructure Bill which followed In part once again to the misleading conclusions of the Mackay-Stone cited by senior Parliamentarians during that debate
109 For example in an exchange between61 the chairman of the Commons Energy and Climate Change Committee Tim Yeo and the then Parliamentary Under-secretary of State for Climate Change Amber Rudd the Mackay-Stone report was quoted directly in support of the Governmentrsquos policies on shale gas
110 Objectively the assurances given by ministers in relation to shale gas and climate change are meaningless No such certainty existed in late 2013 and today the use of the Mackay-Stone report is wholly unsupported by the whole range of research evidence now available The Mackay-Stone report has been used by ministers at DECCBEIS and DEFRA to misled members of Parliament and Parliamentary committees into accepting shale gas exploration In quoting the report especially after the shortcomings of the report were repeated expressed by other bodies from early 2014 onwards ministers have misled Parliament and arguably breached the Ministerial Code62
The Committee on Climate Changersquos onshore petroleum assessment111 The Committee Climate Change (CCC) was set up under the Climate Change Act 2008 with the statutory duty to advise the Government on climate change issues
112 In March 2016 the CCC produced a report63 on the compatibility of onshore petroleum production with the UKrsquos
lsquoThat call for a moratorium was ignored in the Parliamentary debate on the Infrastructure Billrsquo
20
climate change commitments That report was not released by the Government64 until 7th July as part of the general dumping of information at the end of the Parliamentary session
113 In a statement to the House65 Andrea Leadsom Minister of State Department of Energy and Climate Change statedThe CCCrsquos report mainly focuses on shale gas extraction The Government welcome the CCCrsquos conclusion that shale gas is compatible with carbon budgets if certain conditions are met We believe that our strong regulatory regime and determination to meet our carbon budgets mean those conditions can and will be met
114 That is not a fair representation of what the CCCrsquos report concluded
115 Page 69 of the CCCrsquos report lists their conclusions and their three lsquotestsrsquo Without strict limits on emissions (test 1) reductions in fossil fuel use over time (test 2) and reduction consumption elsewhere in the economy to lsquomake spacersquo for shale gas production (test 3) what the CCCrsquos report actually concluded was (my emphasis in bold)Our assessment is therefore that onshore petroleum extraction on a significant scale is NOT compatible with UK climate targets unless three tests are met
116 Here it is possible to see why the Parliamentary briefing on Shale Gas cited at the beginning of the report (para6) differs markedly in its interpretation from the statement by Andrea Leadsom
117 In their formal response66 to the CCCrsquos report the Government acknowledge the need to make allowance for the additional emissions from shale production but they identify no mechanism or process to do this They blindly assume that it can and will be done without any evidence to demonstrate the possibility of compliance with lsquotest 3rsquo
118 Therefore there is no proof that they can meet the CCCrsquos tests and thus on a precautionary basis the policy on unconventional oil and gas should not be implemented
119 For example in his recent evidence to67 the Commons Business Energy and Industrial Strategy Committee Nick Hurd Minister of State for Climate Change and Industry made it clear that only half of
the necessary savings to meeting the UKrsquos climate change commitments had been identified ndash and that the remaining options for reduction were in his words ldquohardrdquo
120 Given our currently available knowledge of the scale on emissions we must be extremely sceptical of the Governmentrsquos ability to meet lsquotest 3rsquo
The CCCrsquos report and emissions estimates121 What is significant is that at no point has the CCC evaluated the flaws in the Mackay-Stone review ndash and therefore whether their current advice on emissions despite their sceptical stance is valid Not only the issues related to lsquobottom-uprsquo versus lsquotop downrsquo emission estimates and the large under-estimate of emissions which appears to be extant under many inventory-based studies but also the flaws of the Allen study and the use of faulty gas monitoring equipment identified by Howard which affects the overall reliability of the evidence presented in the Mackay-Stone report
122 The CCCrsquos uncritical use of data is not restricted to the Mackay-Stone review alone As part of their report on onshore petroleum the CCC draw heavily upon a report produced by the Sustainable Gas Institute68 (SGI) ndash an industry-funded research organisation based at Imperial College London That report not only fails to discuss the flaws identified within the Allen study They largely dismiss the recent top-down studies of fugitive emissions in a similar manner to Mackay and Stone (see section 442 of the SGIrsquos report) Compared to contemporary reviews of this issue which have sought to reconcile the divergent results69 their rejection appears to be biased towards the use of the lower bottom-up estimates of emissions
123 As many of the information sources the CCC rely upon are inventory-based studies the CCC should review their use of this information in general ndash in particular the disparity between bottom-up and top-down emissions estimates More specifically they must address the identified flaws within the Allen study and the effect this has upon the reliability of the Mackay-Stone report
lsquoThe CCCrsquos report concluded ldquoOur assessment is therefore that onshore petroleum extraction on a significant scale is NOT compatible with UK climate targets unless three tests are metrdquo
lsquoTest 3 reduction (in fossil fuel) consumption elsewhere in the economy to make space for shale gas productionrsquo
Given our currently available knowledge of the scale on emissions we must be extremely sceptical of the Governmentrsquos ability to meet lsquotest 3rsquo
21
Conclusion and recommendations124 The purpose of this report has been to examine the validity of the Department of Energy and Climate Changersquos (DECC) Mackay-Stone report This analysis has examined the events which led to its commissioning the validity of its conclusions at the time of its release and how those conclusions have stood-up within this fast-moving field of research
125 Arguably at the time of its publication the Mackay-Stone report was flawed Written primarily as a response to the Howarth study the report failed to examine fully why Howarth came to such different conclusions The way Mackay and Stone selected certain data while excluding other data and then assumed the value of other figures ndash such as the gas production per well ndash added to their failure to show why Howarthrsquos results were so different to previous studies
126 Today with over three years hindsight it is possible to say that the claims made in their report are demonstrably incorrect Recent research shows that not only was their faith in inventory-based emissions assessments misplaced but the figures they excluded as lsquooutliersrsquo have been shown by other research studies to have been broadly correct (given the wide variance of results all these studies embody)127 In their defence Mackay and Stone ndash later supported by DECC ndash cited the Allen study as a justification for their selection of certain data and the exclusion of other results At the time of its publication the Allen study on its own terms was statistically flawed More recently as shown in the recent papers by Howard it has become apparent that the equipment the Allen study used was faulty and significantly under-reported the true level of methane emissions by up to three to five times
128 In the case of the Mackay-Stone report the uncertainty of its conclusions was reasonably foreseeable at the time of its publication They should have understood and communicated the limitations of their results and the uncertainty they contained Arguably then DECCBEIS and DEFRA ministers have misled Parliament when repeating facts about shale gas which cannot be objectively substantiated
129 As outlined in this report over the past three years ministers at DECCBEIS have consistently misled Parliament the media and the public in their quoting of Mackay-Stonersquos conclusions It is not simply that more recent research has invalidated the report At the time of its publication it was not possible to state the conclusions of that report with such certainty ndash and at no point did DECC ministers properly communicate those uncertainties when making their statements
130 It should also be noted that the two other major reports on the safety of shale gas production produced for DECC ndash by the Royal Society (2012) and Public Health England (201314) ndash also suffer from similar evidential flaws to the Mackay-Stone report Their findings have been overtaken by the results of more recent research which invalidates their use in policy-making
131 In any case there is a wider debate70 at present as to whether the whole notion of a natural gas lsquobridgersquo is valid The IPCC in its 2014 review of the science71 (chapter 7 section 751 page 527) commenting on the rise of hydraulic fracturing notes thatEmpirical research is required to reduce uncertainties and to better understand the variability of fugitive gas emissions as well as to provide a more-global perspective Recent empirical research has not yet resolved these uncertainties
132 What research studies find when they test this assumption is that displacing coal with shale gas72 does not significantly reduce emissions73 in part due to the uncertainties of the fugitive methane leaks issue74 Only real-terms reductions in all fossil fuel use demand reduction and the fast transition to near-zero carbon energy sources can achieve significant cuts75 in global carbon emissions
133 The evidence produced by DECCBEIS to support its policies on unconventional oil and gas is no longer valid The conclusions of those reports ndash not just Mackay-Stone but also the Royal SocietyRAE and Public Health England reports ndash have been invalidated by subsequent research However in the case of the Mackay-Stone review its conclusions were never certain ndash and were thrown into doubt only a few weeks after its publication when the Allen study failed to provide a sound statistical case for the lsquolow carbonrsquo credentials of shale oil and gas extraction
134 In conclusion the Government must immediately put in place a moratorium on shale gas and oilextraction and order a review of policy on unconventional gas and oil taking account of all available research and Parliament must review the use of Mackay-Stone report when making recent decisions on energy policy and how the report has misinformed recent decisions over oil and gas extraction policy In particularbull The Commons Business
Energy and Industrial Strategy Committee must address the demonstrable flaws in the Mackay-Stone report with the BEIS department and undertake a similar review in relation to the two other key reports published by DECC ndash by the Royal SocietyRoyal Academy of Engineering and Public Health England
bull The Commons Environmental Audit Committee should undertake a full review of the Governmentrsquos oil and gas policies promised after their limited review published in January 2015 and
bull All Parliamentarians need to scrutinize the statements made by ministers in relation to on-shore oil and gas development and climate change and demand a full account of why the Government has failed to consider recent research which calls many of those claims into question
22
Table 1 Recent research on the fugitive emissions from unconventional oil amp gas production(in chronological order by publication date)
PAPERMethane and the greenhouse-gas footprint of natural gas from shale formations Howarth et al Climatic Change vol106 no4 pp679-690 June 2011
Life cycle greenhouse gas emissions of Marcellus shale gas Jiang et al Environ-mental Research Letters vol6 no034014 5th August 2011
Coal to gas the influence of methane leakage Tom Wigley Climatic Change vol108 pp601-608 26th August 2011
A commentary on lsquoThe greenhouse-gas footprint of natural gas in shale forma-tionsrsquo by RW Howarth R Santoro and Anthony Ingraffea Cathales et al Geochemistry-Geophysics-Geosystems (G3) vol13 no6 03012012
Air sampling reveals high emissions from gas field Jeff Tollefson Nature vol482 pp139-140 9th February 2012
EXTRACTWe evaluate the greenhouse gas footprint of natural gas obtained by high- volume hydrau-lic fracturing from shale formations focusing on methane emissions Natural gas is com-posed largely of methane and 36 to 79 of the methane from shale-gas production escapes to the atmosphere in venting and leaks over the life- time of a well These meth-ane emissions are at least 30 more than and perhaps more than twice as great as those from conventional gas The higher emissions from shale gas occur at the time wells are hy-draulically fractured ndash as methane escapes from flow-back return fluids ndash and during drill out following the fracturing The footprint for shale gas is greater than that for conventional gas or oil when viewed on any time horizon but particularly so over 20 years Compared to coal the footprint of shale gas is at least 20 greater and perhaps more than twice as great on the 20-year horizon and is comparable when compared over 100 years
This study estimates the life cycle greenhouse gas (GHG) emissions from the production of Marcellus shale natural gas and compares its emissions with national average US natu-ral gas emissions produced in the year 2008 prior to any significant Marcellus shale de-velopment We estimate that the development and completion of a typical Marcellus shale well results in roughly 5500t of carbon dioxide equivalent emissions or about 18gCO2eMJ of gas produced assuming conservative estimates of the production lifetime of a typi-cal well This represents an 11 increase in GHG emissions relative to average domestic gas (excluding combustion) and a 3 increase relative to the life cycle emissions when combustion is included There is significant uncertainty in our Marcellus shale GHG emis-sion estimates due to eventual production volumes and variability in flaring construction and transportation
Carbon dioxide (CO2) emissions from fossil fuel combustion may be reduced by using natural gas rather than coal to produce energy Gas produces approximately half the amount of CO2 per unit of primary energy compared with coal Here we consider a sce-nario where a fraction of coal usage is replaced by natural gas (ie methane CH4) over a given time period and where a percentage of the gas production is assumed to leak into the atmosphere The additional CH 4 from leakage adds to the radiative forcing of the cli-mate system offsetting the reduction in CO2 forcing that accompanies the transition from coal to gas We also consider the effects of methane leakage from coal mining changes in radiative forcing due to changes in the emissions of sulfur dioxide and carbonaceous aerosols and differences in the efficiency of electricity production between coal- and gas-fired power generation
Natural gas is widely considered to be an environmentally cleaner fuel than coal because it does not produce detrimental by-products such as sulfur mercury ash and particulates and because it provides twice the energy per unit of weight with half the carbon footprint during combustion These points are not in dispute However in their recent publication in Climatic Change Letters Howarth et al (2011) report that their life-cycle evaluation of shale gas drilling suggests that shale gas has a larger GHG footprint than coal and that this larger footprint ldquoundercuts the logic of its use as a bridging fuel over the coming decadesrdquo We argue here that their analysis is seriously flawed in that they significantly overestimate the fugitive emissions associated with unconventional gas extraction under-value the contribution of ldquogreen technologiesrdquo to reducing those emissions to a level ap-proaching that of conventional gas base their comparison between gas and coal on heat rather than electricity generation (almost the sole use of coal) and assume a time interval over which to compute the relative climate impact of gas compared to coal that does not capture the contrast between the long residence time of CO2 and the short residence time of methane in the atmosphere
Methane leaks during production may offset climate benefits of natural gas
23
PAPERHydrocarbon emissions characteriza-tion in the Colorado Front Range A pilot study Peacutetron et al Journal Of Geophysi-cal Research vol117 noD4 21st Febru-ary 2012
Assessing the greenhouse impact of natural gas LM Cathales Geochemistry-Geophysics-Geosystems (G3) vol13 no6 19th June 2012
Venting and Leaking of Methane from Shale Gas Development Response to Cathles et al Howarth et al Climatic Change vol113 no2 pp537-549 July 2012
Shale gas production potential versus ac-tual greenhouse gas emissions OrsquoSullivan amp Paltsev Environmental Research Let-ters vol7 26th November 2012
Methane leaks erode green credentials of natural gas Jeff Tollefson Nature vol493 p12 3rd January 2013
Enrichment of Radon and Carbon Dioxide in the Open Atmosphere of an Australian Coal Seam Gas Field Tait et al Environ-mental Science and Technology vol47 pp3099-3104 27th February 2013
EXTRACTThe multispecies analysis of daily air samples collected at the NOAA Boulder Atmospheric Observatory (BAO) in Weld County in northeastern Colorado since 2007 shows highly correlated alkane enhancements caused by a regionally distributed mix of sources in the Denver-Julesburg Basin To further characterize the emissions of methane and non-methane hydrocarbons (propane n-butane i-pentane n-pentane and benzene) around BAO a pilot study involving auto-mobile-based surveys was carried out during the summer of 2008 Our analysis suggests that the emissions of the species we measured are most likely underes-timated in current inventories and that the uncertainties attached to these esti-mates can be as high as a factor of two
The global warming impact of substituting natural gas for coal and oil is currently in de-bate We address this question here by comparing the reduction of greenhouse warming that would result from substituting gas for coal and some oil to the reduction which could be achieved by instead substituting zero carbon energy sources We show that substitu-tion of natural gas reduces global warming by 40 of that which could be attained by the substitution of zero carbon energy sources At methane leakage rates that are ~1 of production which is similar to todayrsquos probable leakage rate of ~15 of production the 40 benefit is realized as gas substitution occurs
In April 2011 we published the first comprehensive analysis of greenhouse gas (GHG) emissions from shale gas obtained by hydraulic fracturing with a focus on methane emis-sions Our analysis was challenged by Cathles et al (2012) Here we respond to those criticisms We stand by our approach and findings The latest EPA estimate for methane emissions from shale gas falls within the range of our estimates but not those of Cathles et al which are substantially lower Cathles et al believe the focus should be just on electric-ity generation and the global warming potential of methane should be considered only on a 100-year time scale We reiterate our conclusion from our April 2011 paper that shale gas is not a suitable bridge fuel for the 21st Century
Estimates of greenhouse gas (GHG) emissions from shale gas production and use are controversial Here we assess the level of GHG emissions from shale gas well hydraulic fracturing operations in the United States during 2010 Data from each of the approximate-ly 4000 horizontal shale gas wells brought online that year are used to show that about 900 Gg CH 4 of potential fugitive emissions were generated by these operations or 228 Mg CH 4 per well ndash a figure inappropriately used in analyses of the GHG impact of shale gas Although fugitive emissions from the overall natural gas sector are a proper concern it is incorrect to suggest that shale gas-related hydraulic fracturing has substantially altered the overall GHG intensity of natural gas production
Losses of up to 9 show need for broader data on US gas industryrsquos environmental im-pact
Atmospheric radon and carbon dioxide concentrations were used to gain insight into fugitive emissions in an Australian coal seam gas (CSG) field (Surat Basin Tara region Queensland)Average CO₂ concentrations over the 24-h period ranged from ~390 ppm at the control site to ~467 ppm near the center of the gas field A ~3 fold increase in maxi-mum Rn concentration was observed inside the gas field compared to outside of it There was a significant relationship between maximum and average Rn concentrations and the number of gas wells within a 3 km radius of the sampling sites (n = 5 stations p lt 005) A positive trend was observed between CO₂ concentrations and the number of CSG wells but the relationship was not statistically significant Radon may be useful in monitoring enhanced soil gas fluxes to the atmosphere due to changes in the geological structure associated with wells and hydraulic fracturing in CSG fields
24
PAPERQuantifying sources of methane using light alkanes in the Los Angeles basin California Peischl et al Journal of Geo-physical Research Atmospheres vol118 no10 pp4974-4990 27th May 2013
Methane emissions estimate from airborne measurements over a western United States natural gas field Karion et al Geo-physical Research Letters vol40 no16 27th August 2013
Anthropogenic emissions of methane in the United States Miller et al PNAS vol 110 no 50 pp20018ndash20022 10th Decem-ber 2013
Quantifying Fugitive Emission Factors from Unconventional Natural Gas Produc-tion Using IPCC Methodologies RP Glancy Institute for Global Environmen-tal Strategies December 2013
Methane Leaks from North American Natural Gas Systems Brandt et al Sci-ence vol343 pp733-735 14th February 2014
EXTRACTMethane (CH4) carbon dioxide (CO2) carbon monoxide (CO) and C2-C5 alkanes were measured throughout the Los Angeles (LA) basin in May and June 2010 We use these data to show that the emission ratios of CH4CO and CH4CO2 in the LA basin are larger than expected from population-apportioned bottom-up state inventories consistent with previously published work We use experimentally determined CH4CO and CH4CO2 emission ratios in combination with annual State of California CO and CO2 inventories to derive a yearly emission rate of CH4 to the LA basin We further use the airborne measurements to directly derive CH4 emission rates from dairy operations in Chino and from the two largest landfills in the LA basin and show these sources are accurately represented in the California Air Resources Board greenhouse gas inventory for CH4 The addition of CH4 emissions from natural gas pipelines and urban distribution systems andor geologic seeps and from the local oil and gas industry is sufficient to account for the differences between the top-down and bottom-up CH4 inventories identified in previously published work
Methane (CH4) emissions from natural gas production are not well quantified and have the potential to offset the climate benefits of natural gas over other fossil fuels We use atmo-spheric measurements in a mass balance approach to estimate CH4 emissions of 55 plusmn 15 times 10 kg h-1 from a natural gas and oil production field in Uintah County Utah on 1 day 3 February 2012 This emission rate corresponds to 62-117 (1σ) of average hourly natural gas production in Uintah County in the month of February This study demonstrates the mass balance technique as a valuable tool for estimating emissions from oil and gas production regions and illustrates the need for further atmospheric measurements to deter-mine the representativeness of our single-day estimate and to better assess inventories of CH4 emissions
This study quantitatively estimates the spatial distribution of anthropogenic methane sourc-es in the United States by combining comprehensive atmospheric methane observations extensive spatial datasets and a high-resolution atmospheric transport model Results show that current inventories from the US Environmental Protection Agency (EPA) and the Emissions Database for Global Atmospheric Research underestimate methane emissions nationally by a factor of ~15 and ~17 respectively Our study indicates that emissions due to ruminants and manure are up to twice the magnitude of existing inventories In addition the discrepancy in methane source estimates is particularly pronounced in the south-central United States where we find total emissions are ~27 times greater than in most inventories and account for 24 plusmn 3 of national emissions The spatial patterns of our emission fluxes and observed methane ndash propane correlations indicate that fossil fuel extraction and refining are major contributors (45 plusmn 13) in the south-central United States This result suggests that regional methane emissions due to fossil fuel extraction and processing could be 49 plusmn 26 times larger than in EDGAR the most comprehensive global methane inventory These results cast doubt on the US EPArsquos recent decision to downscale its estimate of national natural gas emissions by 25 ndash 30 Overall we con-clude that methane emissions associated with both the animal husbandry and fossil fuel industries have larger greenhouse gas impacts than indicated by existing inventories
This study reviews available literature and data sources related to the fugitive emissions from the production of unconventional gas sources Shale gas Tight sands gas and Coal-bed methane The results show that fugitive emissions arising from hydraulic fracturing activities are substantial when compared with typical conventional gas fugitive emissions Mean life-cycle values for fugitive emissions from Shale gas Tight sands gas and Coalbed methane are 133 100 and 36 higher respectively than those of conventional gas in the developed countries Developing countries show a similar scale of difference
Why might emissions inventories be under-predicting what is observed in the atmosphere Current inventory methods rely on key assumptions that are not generally satisfied First devices sampled are not likely to be representative of current technologies and practic-es Second measurements for generating EFs are expensive which limits sample sizes and representativeness Third if emissions distributions have ldquoheavy tailsrdquo (eg more high-emissions sources than would be expected in a normal distribution) small sample sizes are likely to under-represent high-consequence emissions sources
25
PAPERShale Oil and Natural Gas Nexus (SONG-NEX) Studying the Atmospheric Effects of Changing Energy Use in the US at the Nexus of Air Quality and Climate Change Earth System Research Laboratory Na-tional Oceanic and Atmospheric Admin-istration US Department of Commerce April 2014
Toward a better understanding and quanti-fication of methane emissions from shale gas development Caulton et al PNAS vol111 no17 pp6237-6242 29th April 2014
A bridge to nowhere methane emissions and the greenhouse gas footprint of natural gas Robert W Howarth Energy Science and Engineering vol2 no2 pp47-60 June 2014
A new look at methane and nonmeth-ane hydrocarbon emissions from oil and natural gas operations in the Colorado Denver-Julesburg Basin Peacutetron et al J Geophysical Research Atmospheres vol119 pp6836-6852 16th June 2014
Methane emissions from natural gas production and use reconciling bottom-up and top-down measurements David T Al-len Current Opinion in Chemical Engi-neering vol5 pp78-83 August 2014
Noble gases identify the mechanisms of fugitive gas contamination in drinking-water wells overlying the Marcellus and Barnett Shales Darrah et al PNAS 30th September 2014
EXTRACTEnergy production and use in the US have seen rapid changes over the past decade The domestic production of oil and natural gas has grown strongly natural gas is increas-ingly replacing coal for the generation of electrical power and the contribution from renew-ables has rapidly grown Many of these shifts have caused significant changes in the atmospheric emissions of trace gases and fine particles that are at the root of the Nationrsquos air quality and climate change issues However since the changes in emissions are poorly known the net effects for air quality and climate change are still very uncertain Over the past decades the US has effectively addressed air quality issues and it is important to assure that the changes in our energy infrastructure do not negate some of these posi-tive changes Likewise as the Nation is increasingly focused on mitigating the effects of climate change it is important to know the net changes in emissions of greenhouse gases and other trace gases and fine particles that force the climate to change
The range of regional leak rates found here for the OSA (3-17) is similar to leak rates found by recent studies across the United States Although a recent study found produc-tion sites to which they were given access to be emitting less CH4 than EPA inventories suggest these regional scale findings and a recent national study indicate that overall sites leak rates can be higher than current inventory estimates Additionally a recent comprehensive study of measured natural gas emission rates versus ldquoofficialrdquo inventory estimates found that the inventories consistently underestimated measured emissions and hypothesized that one explanation for this discrepancy could be a small number of high-emitting wells or components
In April 2011 we published the first peer-reviewed analysis of the greenhouse gas foot-print (GHG) of shale gas concluding that the climate impact of shale gas may be worse than that of other fossil fuels such as coal and oil because of methane emissions We noted the poor quality of publicly available data to support our analysis and called for further research The best data available now indicate that our estimates of methane emis-sion from both shale gas and conventional natural gas were relatively robust Using these new best available data and a 20-year time period for comparing the warming potential of methane to carbon dioxide the conclusion stands that both shale gas and conventional natural gas have a larger GHG than do coal or oil for any possible use of natural gas and particularly for the primary uses of residential and commercial heating The 20-year time period is appropriate because of the urgent need to reduce methane emissions over the coming 15-35 years
Overall our top-down emission estimates for CH4 and NMHCs from oil and natural gas sources are at least twice as large as available bottom-up emission estimates Accurate estimates of emissions from oil and natural gas operations at the regional and national lev-els are still needed to quantify (and minimize) their impacts on climate forcing and air qual-ity Future research should also include the investigation of the apparent gap between bottom-up and top-down hydrocarbon emission estimates at the regional and national scales to track down which sources are either missing or underestimated and to quantify the contribution of anomalously large emitters as suggested by Brandt et al [2014]
Methane emissions from the natural gas supply chain are a key factor in determining the greenhouse gas footprint of natural gas production and use Recent estimates of these emissions have varied widely because of the large population of sources because of dif-ferent measurement and estimation approaches and because of extreme values of emis-sion rates from individual sources that are much larger than population average values of emission rates from sources in the same category (a lsquofat-tailrsquo distribution) Reconciling differences between ambient methane concentration measurements (top-down methods) and direct measurement of emissions from individual sources (bottom-up methods) is criti-cal to understanding methane emissions from the natural gas supply chain A combination of top-down and bottom-up approaches is recommended
Using noble gas and hydrocarbon tracers we distinguish natural sources of methane from anthropogenic contamination and evaluate the mechanisms that cause elevated hydro-carbon concentrations in drinking water near natural-gas wells We document fugitive gases in eight clusters of domestic water wells overlying the Marcellus and Barnett Shales including declining water quality through time over the Barnett Gas geochemistry data implicate leaks through annulus cement (four cases) production casings (three cases) and underground well failure (one case) rather than gas migration induced by hydraulic fracturing deep underground
26
PAPEROil and gas wells and their integrity Im-plications for shale and unconventional re-source exploitation Davies et al Marine and Petroleum Geology September 2014
Remote sensing of fugitive methane emissions from oil and gas production in North American tight geologic formations Schneising et al Earthrsquos Future vol2 no10 pp548-558 October 2014
Limited impact on decadal-scale climate change from increased use of natural gas McJeon et al Nature vol514 pp482-485 15th October 2014
Mapping Methane and Carbon Dioxide Concentrations and δ13C Values in the Atmosphere of Two Australian Coal Seam Gas Fields Maher et al J Water Air and Soil Pollution vol225 18th November 2014
Methane Emissions from Process Equip-ment at Natural Gas Production Sites in the United States Pneumatic Controllers Allen et al Environmental Science and Technology vol49 no1 pp633-640 9th December 2014
EXTRACTThe datasets vary considerably in terms of the number of wells examined their age and their designs Therefore the percentage of wells that have had some form of well barrier or integrity failure is highly variable (19-75) Of the 8030 wells targeting the Marcel-lus shale inspected in Pennsylvania between 2005 and 2013 63 of these have been reported to the authorities for infringements related to well barrier or integrity failure In a separate study of 3533 Pennsylvanian wells monitored between 2008 and 2011 there were 85 examples of cement or casing failures 4 blowouts and 2 examples of gas venting
In the past decade there has been a massive growth in the horizontal drilling and hy-draulic fracturing of shale gas and tight oil reservoirs to exploit formerly inaccessible or unprofitable energy resources in rock formations with low permeability Here we demon-strate that positive methane anomalies associated with the oil and gas industries can be detected from space and that corresponding regional emissions can be constrained using satellite observations On the basis of a mass-balance approach we estimate that meth-ane emissions for two of the fastest growing production regions in the United States the Bakken and Eagle Ford formations have increased by 990 plusmn 650 ktCH4 yr-1 and 530 plusmn 330 ktCH4 yr-1 between the periods 2006-2008 and 2009-2011 Relative to the respective increases in oil and gas production these emission estimates correspond to leakages of 101 plusmn 73 and 91 plusmn 62 in terms of energy content calling immediate climate benefit into question and indicating that current inventories likely underestimate the fugitive emissions from Bakken and Eagle Ford
The most important energy development of the past decade has been the wide deploy-ment of hydraulic fracturing technologies that enable the production of previously uneco-nomic shale gas resources in North America The climate implications of such abundant natural gas have been hotly debated Here we show that market-driven increases in global supplies of unconventional natural gas do not discernibly reduce the trajectory of greenhouse gas emissions or climate forcing Our results based on simulations from five state-of-the-art integrated assessment models of energyndasheconomyndashclimate systems independently forced by an abundant gas scenario project large additional natural gas consumption of up to +170 per cent by 2050 The impact on CO2 emissions however is found to be much smaller (from minus2 per cent to +11 per cent) and a majority of the models reported a small increase in climate forcing (from minus03 per cent to +7 per cent) associated with the increased use of abundant gas Our results show that although market penetra-tion of globally abundant gas may substantially change the future energy system it is not necessarily an effective substitute for climate change mitigation policy
Data from this study indicates that unconventional gas may drive large-scale increases in atmospheric CH4 and CO2 concentrations which need to be accounted for when deter-mining the net GHG impact of using unconventional gas sources Considering the lack of previous similar studies in Australia the identified hotspots of GHGs and the distinct isotopic signature within the Tara gas field demonstrate the need to fully quantify GHG emissions before during and after CSG exploration commences in individual gas fields
Emissions from 377 gas actuated (pneumatic) controllers were measured at natural gas production sites and a small number of oil production sites throughout the United States A small subset of the devices (19) with whole gas emission rates in excess of 6 stan-dard cubic feet per hour (scfh) accounted for 95 of emissions More than half of the controllers recorded emissions of 0001 scfh or less during 15 min of measurement Pneumatic controllers in level control applications on separators and in compressor appli-cations had higher emission rates than controllers in other types of applications Regional differences in emissions were observed with the lowest emissions measured in the Rocky Mountains and the highest emissions in the Gulf Coast Average methane emissions per controller reported in this work are 17 higher than the average emissions per controller in the 2012 EPA greenhouse gas national emission inventory (2012 GHG NEI released in 2014) the average of 27 controllers per well observed in this work is higher than the 10 controllers per well reported in the 2012 GHG NEI
27
PAPERDirect measurements of methane emis-sions from abandoned oil and gas wells in Pennsylvania Kang et al PNAS vol111 no51 pp18173-18177 23rd December 2014
Allocating Methane Emissions to Natural Gas and Oil Production from Shale For-mations Zavala-Araiza et al Sustainable Chemical Engineering vol3 no3 pp492-498 28th January 2015
Measurements of Methane Emissions from Natural Gas Gathering Facilities and Processing Plants Measurement Results Mitchell et al Environmental Science and Technology vol49 no5 pp3219-3227 10th February 2015
Sensor transition failure in the high flow sampler Implications for methane emis-sion inventories of natural gas infrastruc-ture Howard et al Journal of the Air and Waste Management Association vol65 no7 id150324005609009 March 2015
Mobile Laboratory Observations of Methane Emissions in the Barnett Shale Region Yacovitch et al Environmen-tal Science Technology vol49 no13 pp7889-7895 9th March 2015
EXTRACTMethane emissions from abandoned oil and gas wells appear to be a significant source of methane emissions to the atmosphere The measured wells presented in this paper are likely to be half a century old or older and the positive flow rates measured at these wells indicate that the methane emissions from these wells may have been occurring for many decades and possibly more than a century Therefore the cumulative emissions from abandoned wells may be significantly larger than the cumulative leakage associated with oil and gas production which has a shorter lifetime of operation
The natural gas supply chain includes production processing and transmission of natural gas which originates from conventional shale coal bed and other reservoirs Because the hydrocarbon products and the emissions associated with extraction from different res-ervoir types can differ when expressing methane emissions from the natural gas supply chain it is important to allocate emissions to particular hydrocarbon products and reser-voir types In this work life cycle allocation methods have been used to assign methane emissions from production wells operating in shale formations to oil condensate and gas products from the wells The emission allocations are based on a data set of 489 gas wells in routine operation and 19 well completion events The methane emissions allocated to natural gas production are approximately 85 of total emissions (mass based allocation) but there is regional variability in the data and therefore this work demonstrates the need to track natural gas sources by both formation type and production region
Facility-level methane emissions were measured at 114 gathering facilities and 16 pro-cessing plants in the United States natural gas system At gathering facilities the mea-sured methane emission rates ranged from 07 to 700 kg per hour (kgh) (06 to 600 standard cubic feet per minute (scfm)) Normalized emissions (as a of total methane throughput) were less than 1 for 85 gathering facilities and 19 had normalized emis-sions less than 01 The range of methane emissions rates for processing plants was 3 to 600 kgh (3 to 524 scfm) corresponding to normalized methane emissions rates lt1 in all cases The distributions of methane emissions particularly for gathering facilities are skewed For example 30 of gathering facilities contribute 80 of the total emissions Emissions rates at these facilities were on average around four times the rates observed at similar facilities without substantial venting
Quantification of leaks from natural gas (NG) infrastructure is a key step in reducing emissions of the greenhouse gas methane (CH4) particularly as NG becomes a larger component of domestic energy supply The Bacharach Hi-Flow Sampler (BHFS) is the only commercially available high-flow instrument and it is also used throughout the NG supply chain for directed inspection and maintenance emission factor development and greenhouse gas reduction programs Here we document failure of the BHFS to transition from a catalytic oxidation sensor used to measure low NG (~5 or less) concentrations to a thermal conductivity sensor for higher concentrations (from ~5 to 100) resulting in underestimation of NG emission rates The extent to which this issue has affected recent emission studies is uncertain but the analysis presented here suggests that the problem could be widespread Furthermore it is critical that this problem be resolved before the onset of regulations on CH4 emissions from the oil and gas industry as the BHFS is a popular instrument for these measurements
Results of mobile ground-based atmospheric measurements conducted during the Barnett Shale Coordinated Campaign in spring and fall of 2013 are presented Methane and ethane are continuously measured downwind of facilities such as natural gas processing plants compressor stations and production well pads Gaussian dispersion simulations of these methane plumes using an iterative forward plume dispersion algorithm are used to estimate both the source location and the emission magnitude The regional distributions of source emissions and ethanemethane enhancement ratios are examined the larg-est methane emissions appear between Fort Worth and Dallas while the highest ethanemethane enhancement ratios occur for plumes observed in the northwestern potion of the region
28
PAPERQuantifying atmospheric methane emis-sions from the Haynesville Fayetteville and northeastern Marcellus shale gas production regions Peischl et al Journal of Geophysical Research Atmospheres vol120 pp2119-2139 13th March 2015
Stream Measurements Locate Thermogenic Methane Fluxes in Groundwater Discharge in an Area of Shale-Gas Development Heilweil et al Environmental Science and Technology vol49 no7 pp4057-4065 18th March 2015
Atmospheric Emission Characterization of Marcellus Shale Natural Gas Development Sites Goetz et al Environmental Science ampTechnology 21st April 2015
Measurements of methane emissions from natural gas gathering facilities and processing plants measurement methods Roscioli et al Atmospheric Measurement Technology vol8 pp2017-2035 7th May 2015
Fracking Cannot Be Reconciled with Climate Change Mitigation Policies Stad-don amp Depledge Environmental Science Technology vol49 no14 pp8269-8270 July 2015
Aircraft-Based Estimate of Total Methane Emissions from the Barnett Shale Region Karion et al Environmental Science amp Technology vol49 no13 pp8124-8131 7th July 2015
EXTRACTHowarth et al [2011] estimate that routine venting and equipment leaks lead to a loss of 03-19 of the CH4 produced over the life cycles of both conventional and shale wells The 10-21 and the 10-28 we report as loss rates from the Haynesville and Fayette-ville study regions respectively are at the upper end of this range The loss rate from the Marcellus study region 018-041 is at the lower end of this range Howarth et al esti-mated additional CH4 emissions from well completions liquid unloading gas processing and transport storage and distribution however we do not attempt to compare emissions from these activities at this time
The environmental impacts of shale-gas development on water resources including meth-ane migration to shallow groundwater have been difficult to assess Monitoring around gas wells is generally limited to domestic water-supply wells which often are not situated along predominant groundwater flow paths A new concept is tested here combining stream hydrocarbon and noble-gas measurements with reach mass-balance modeling to estimate thermogenic methane concentrations and fluxes in groundwater discharging to streams and to constrain methane sources Modeling indicates a groundwater ther-mogenic methane flux of about 05 kg d-1 discharging into Sugar Run possibly from this fugitive gas source Since flow paths often coalesce into gaining streams stream methane monitoring provides the first watershed-scale method to assess groundwater contamina-tion from shale-gas development
Emission rates from compressor stations ranged from 0006 to 0162 tons per day (tpd) for NOx 0029 to 0426 tpd for CO and 679 to 371 tpd for CO2 CH4 and C2H6 emission rates from compressor stations ranged from 0411 to 4936 tpd and 0023 to 0062 tpd respectively Although limited in sample size this study provides emission rate estimates for some processes in a newly developed natural gas resource and contributes valuable comparisons to other shale gas studies
Increased natural gas production in recent years has spurred intense interest in methane (CH4) emissions associated with its production gathering processing transmission and distribution Gathering and processing facilities are unique in that the wide range of gas sources (shale coal-bed tight gas conventional etc) results in a wide range of gas compositions which in turn requires an array of technologies to prepare the gas for pipeline transmission and distribution We present an overview and detailed description of the measurement method and analysis approach used during a 20-week field cam-paign studying CH4 emissions from the natural gas GampP facilities Combining downwind methane ethane (C2H6) carbon monoxide (CO) carbon dioxide (CO2) and tracer gas measurements with on-site tracer gas release allows for quantification of facility emissions and in some cases a more detailed picture of source locations
Addressing climate change and meeting our energy needs are two of the greatest chal-lenges that societies face Many obstacles hinder progress The search for inexpensive and plentiful energy supplies appears to be at odds with climate change mitigation commitments The desire for short-term (next 30 years) energy security has reinvigorated investment in fossil fuel technologies and led to a North American boom in hydraulic frac-turing for shale gas (fracking) However fracking contributes both directly and indirectly to greenhouse gas emissions further driving anthropogenic climate change Here we consider the implications and conclude that the expansion of fracking is incompatible with climate change mitigation
Our top-down final emissions estimate is lower per unit of natural gas produced (13minus19) than has been found in several previous airborne studies of other oil and gas basins current results for the Barnett region indicate that the EPArsquos GHGRP which relies on self-reported data only from large producers and facilities significantly underestimates (by a factor of 3) total natural gas and petroleum associated emissions from the Barnett We also find that the globally gridded EDGAR inventory underestimates emissions from the oil and gas sector in this geographic region by a factor of almost 5 indicating that it should be used with great caution for the oil and gas sector
29
PAPERCharacterizing Fugitive Methane Emis-sions in the Barnett Shale Area Using a Mobile Laboratory Lan et al Environ-mental Science amp Technology vol49 no13 pp8139-8146 7th July 2015
Aircraft-Based Measurements of Point Source Methane Emissions in the Barnett Shale Basin Lavoie et al Environmental Science amp Technology vol49 no13 pp7904-7913 7th July 2015
Constructing a Spatially Resolved Meth-ane Emission Inventory for the Barnett Shale Region Lyon et al Environmen-tal Science amp Technology vol49 no13 pp8147-8157 7th July 2015
Measurements of methane emissions from natural gas gathering facilities and processing plants measurement methods Roscioli et al Atmospheric Measurement Technology vol8 pp2017-2035 7th May 2015
Using Multi-Scale Measurements to Im-prove Methane Emission Estimates from Oil and Gas Operations in the Barnett Shale Region Texas Harriss et al Envi-ronmental Science and Technology vol49 no13 pp7524-7526 7th July 2015
Methane Emissions from Leak and Loss Audits of Natural Gas Compressor Sta-tions and Storage Facilities Johnson et al Environmental Science Technology vol49 no13 pp8132-8138 7th July 2015
EXTRACTModel results show that well pads emissions rates had a fat-tailed distribution with the emissions linearly correlated with gas production Using this correlation we estimated a total well pad emission rate of 150000 kgh in the Barnett Shale area It was found that CH4 emissions from compressor stations and gas processing plants were substantially higher with some ldquosuper emittersrdquo having emission rates up to 3447 kgh more then 36000-fold higher than reported by the Environmental Protection Agency (EPA) Green-house Gas Reporting Program (GHGRP)
For the eight sources CH4 emission measurements from the aircraft-based mass balance approach were a factor of 32-58 greater than the GHGRP-based estimates Summed emissions totalled 7022 plusmn 2000 kg hr-1 roughly 9 of the entire basin-wide CH4 emis-sions estimated from regional mass balance flights during the campaign Emission measurements from five natural gas management facilities were 12-46 times larger than emissions based on the national study
Our detailed spatially explicit methane emission inventory for the Barnett Shale region illustrates the limitations of relying on commonly used data sources such as Greenhouse Gas Inventory (GHGI) and Greenhouse Gas Reporting Program (GHGRP) to estimate re-gional emissions The GHGI Natural Gas Systems section relies primarily on national emis-sion factors developed in the 1990s to estimate natural gas industry emissions and may not reflect regional differences or recent changes in emission profiles The GHGRP only includes emissions from facilities meeting a reporting threshold and excludes most emis-sions from the gathering sector and certain emission sources therefore it is inherently an underestimate of emissions and should not be viewed as a complete emission inventory
Our detailed spatially explicit methane emission inventory for the Barnett Shale region illustrates the limitations of relying on commonly used data sources such as Greenhouse Gas Inventory (GHGI) and Greenhouse Gas Reporting Program (GHGRP) to estimate re-gional emissions The GHGI Natural Gas Systems section relies primarily on national emis-sion factors developed in the 1990s to estimate natural gas industry emissions and may not reflect regional differences or recent changes in emission profiles The GHGRP only includes emissions from facilities meeting a reporting threshold and excludes most emis-sions from the gathering sector and certain emission sources therefore it is inherently an underestimate of emissions and should not be viewed as a complete emission inventory
A growing body of work using varying analytical approaches is yielding estimates of methane emissions from the natural gas supply chain For shorthand the resulting emis-sion estimates can be broadly described as top-down or bottom-up Top-down estimates are determined from measured atmospheric methane enhancements at regional or larger scales Bottom-up estimates rely on emissions measurements made directly from com-ponents or at the site level (We note that bottom-up emission estimates may rely on data obtained with emission quantification methods sometimes labeled as top-down) Both approaches have strengths and weaknesses Top-down estimates cannot easily distin-guish emissions from specific source types limiting the development of informed mitiga-tion strategies Bottom-up estimates are resource intensive and may not provide sufficient statistical characterization of each source type to accurately estimate total emissions
As part of the Environmental Defense Fundrsquos Barnett Coordinated Campaign research-ers completed leak and loss audits for methane emissions at three natural gas compres-sor stations and two natural gas storage facilities All sites had a combined total methane emissions rate of 942 kgh yet only 12 of the emissions total resulted from leaks Meth-ane slip from exhausts represented 44 of the total emissions Remaining methane emis-sions were attributed to losses from pneumatic actuators and controls engine crankcases compressor packing vents wet seal vents and slop tanks Average measured wet seal emissions were 35 times higher than GRI values but 14 times lower than those reported by Allen et al Reciprocating compressor packing vent emissions were 39 times higher than values reported by GRI but about half of values reported by Allen et al
30
PAPERAirborne Ethane Observations in the Barnett Shale Quantification of Ethane Flux and Attribution of Methane Emissions Smith et al Environmental Science Technology vol49 no13 pp8158-8166 7th July 2015
Integrating Source Apportionment Tracers into a Bottom-up Inventory of Methane Emissions in the Barnett Shale Hydraulic Fracturing Region Townsend-Small et al Environmental Science Technology vol49 no13 pp8175-8182 7th July 2015
Constructing a Spatially Resolved Meth-ane Emission Inventory for the Barnett Shale Region Lyon et al Environmen-tal Science amp Technology vol49 no13 pp8147-8157 7th July 2015
Toward a Functional Definition of Meth-ane Super-Emitters Application to Natural Gas Production Sites Zavala-Araiza et al Environmental Science Technology vol49 no13 pp8167-8174 7th July 2015
University of Texas study underestimates national methane emissions at natural gas production sites due to instrument sensor failure Toucheacute Howard Energy Science and Engineering vol3 no5 p443-455 4th August 2015
EXTRACTWe present high time resolution airborne ethane (C2H6) and methane (CH4) measure-ments made in March and October 2013 as part of the Barnett Coordinated Campaign over the Barnett Shale formation in Texas Ethane fluxes are quantified using a downwind flight strategy a first demonstration of this approach for C2H6 Additionally ethane-to-methane emissions ratios (C2H6CH4) of point sources were observationally determined from simultaneous airborne C2H6 and CH4 measurements during a survey flight over the source region On the basis of two analyses we find 71-85 of the observed methane emissions quantified in the Barnett Shale are derived from fossil sources The average ethane flux observed from the studied region of the Barnett Shale was 66 plusmn 02 times 103 kg hr-1 and consistent across six days in spring and fall of 2013
A growing dependence on natural gas for energy may exacerbate emissions of the greenhouse gas methane (CH4) Identifying fingerprints of these emissions is critical to our understanding of potential impacts Here we compare stable isotopic and alkane ratio tracers of natural gas agricultural and urban CH4 sources in the Barnett Shale hydraulic fracturing region near Fort Worth Texas Thermogenic and biogenic sources were com-positionally distinct and emissions from oil wells were enriched in alkanes and isotopically depleted relative to natural gas wells Future top-down studies may benefit from the addi-tion of δD-CH4 to distinguish thermogenic and biogenic sources
Our detailed spatially explicit methane emission inventory for the Barnett Shale region illustrates the limitations of relying on commonly used data sources such as Greenhouse Gas Inventory (GHGI) and Greenhouse Gas Reporting Program (GHGRP) to estimate re-gional emissions The GHGI Natural Gas Systems section relies primarily on national emis-sion factors developed in the 1990s to estimate natural gas industry emissions and may not reflect regional differences or recent changes in emission profiles The GHGRP only includes emissions from facilities meeting a reporting threshold and excludes most emis-sions from the gathering sector and certain emission sources therefore it is inherently an underestimate of emissions and should not be viewed as a complete emission inventory
Emissions from natural gas production sites are characterized by skewed distributions where a small percentage of sitesmdashcommonly labelled super-emittersmdashaccount for a ma-jority of emissions A better characterization of super-emitters is needed to operationalize ways to identify them and reduce emissions We designed a conceptual framework that functionally defines super-emitting sites as those with the highest proportional loss rates (methane emitted relative to methane produced) Because the population of functionally super-emitting sites is not expected to be static over time continuous monitoring will likely be necessary to identify them and improve their operation This work suggests that achiev-ing and maintaining uniformly low emissions across the entire population of production sites will require mitigation steps at a large fraction of sites
The University of Texas reported on a campaign to measure methane (CH4) emissions from United States natural gas (NG) production sites as part of an improved national inventory Unfortunately their study appears to have systematically underestimated emis-sions They used the Bacharach Hi-Flowreg Sampler (BHFS) which in previous studies has been shown to exhibit sensor failures leading to under-reporting of NG emissions The data reported by the University of Texas study suggest their measurements exhibit this sensor failure as shown by the paucity of high-emitting observations when the well-head gas composition was less than 91 CH4 where sensor failures are most likely during follow-up testing the BHFS used in that study indeed exhibited sensor failure consistent with under-reporting of these high emitters The presence of such an obvious problem in this high profile landmark study highlights the need for increased quality assurance in all greenhouse gas measurement programs
31
PAPERMethane emissions and climatic warming risk from hydraulic fracturing and shale gas development implications for policy Robert Howarth Energy and Emission Control Technologies vol3 pp45-54 8th October 2015
Effect of methane leakage on the greenhouse gas footprint of electricity generation Sanchez amp Mays Climatic Change vol133 no2 pp 169-17 November 2015
Fugitive emissions of methane from aban-doned decommissioned oil and gas wells Boothroyd et al Science of The Total Environment 15th March 2016
Reconciling divergent estimates of oil and gas methane emissions Zavala-Araiza et al PNAS vol112 no51 pp15597-15602 22nd December 2015
A large increase in US methane emis-sions over the past decade inferred from satellite data and surface observations Turner et al Geophysical Research Let-ters vol43 16th March 2016
Climate benefits of natural gas as a bridge fuel and potential delay of near-zero ener-gy systems Zhang et al Applied Energy vol167 pp317-322 April 2016
EXTRACTOver the past decade shale gas production has increased from negligible to providing gt40 of national gas and 14 of all fossil fuel energy in the USA in 2013 This shale gas is often promoted as a bridge fuel that allows society to continue to use fossil fuels while re-ducing carbon emissions since less carbon dioxide is emitted from natural gas (including shale gas) than from coal and oil per unit of heat energy However significant quantities of methane are emitted into the atmosphere from shale gas development an estimated 12 of total production considered over the full life cycle from well to delivery to consumers based on recent satellite data When methane emissions are included the greenhouse gas footprint of shale gas is significantly larger than that of conventional natural gas coal and oil Because of the increase in shale gas development over recent years the total greenhouse gas emissions from fossil fuel use in the USA rose between 2009 and 2013 despite the decrease in carbon dioxide emissions Given the projections for continued ex-pansion of shale gas production this trend of increasing greenhouse gas emissions from fossil fuels is predicted to continue through 2040
This paper answers this question using a simple model which assumes that the com-prehensive GHG footprint is the sum of the carbon dioxide-equivalent emissions result-ing from (1) electricity generation and (2) natural gas leakage Results presented on a straightforward plot of GHG footprint versus time horizon show that natural gas leakage of 20 or 48 eliminates half of natural gasrsquos GHG footprint advantage over coal at 20- or 100-year time horizons respectively Leakage of 39 or 91 completely eliminates the GHG footprint advantage at 20- and 100-year time horizons respectively A two-parameter power law approximation of the IPCCrsquos equation for GWP is utilized and gives equivalent results Results indicate that leakage control is essential for natural gas to deliver a smaller GHG footprint than coal
The study has detected elevated concentrations of soil gas methane above decommis-sioned (abandoned) oil and gas wells The study showed that for 31 of the 102 wells (30) the soil gas CH4 was significantly higher than that for their respective control sites with the maximum observed being 147 greater than the control The relative CH4 concentration above wells did not significantly increase with the age of the well since drilling and 40 of the most recent wells surveyed showed leaks implying that leaks develop early in the post-production life of a decommissioned well
Published estimates of methane emissions from atmospheric data (top-down approaches) exceed those from source-based inventories (bottom-up approaches) leading to conflict-ing claims about the climate implications of fuel switching from coal or petroleum to natural gas Based on data from a coordinated campaign in the Barnett Shale oil and gas-produc-ing region of Texas we find that top-down and bottom-up estimates of both total and fossil methane emissions agree within statistical confidence intervals Measured oil and gas methane emissions are 90 larger than estimates based on the US Environmental Protec-tion Agencyrsquos Greenhouse Gas Inventory and correspond to 15 of natural gas produc-tion This rate of methane loss increases the 20-y climate impacts of natural gas consumed in the region by roughly 50
National inventory estimates from the US Environmental Protection Agency indicate no significant trend in US anthropogenic methane emissions from 2002 to present Here we use satellite retrievals and surface observations of atmospheric methane to suggest that US methane emissions have increased by more than 30 over the 2002ndash2014 period The trend is largest in the central part of the country but we cannot readily attribute it to any specific source type This large increase in US methane emissions could account for 30ndash60 of the global growth of atmospheric methane seen in the past decade
Natural gas has been suggested as a ldquobridge fuelrdquo in the transition from coal to a near-zero emission energy system However the expansion of natural gas risks a delay in the introduction of near-zero emission energy systems possibly offsetting the potential climate benefits of a gas-for-coal substitution We use a schematic climate model to estimate CO2 and CH4 emissions from integrated energy systems and the resulting changes in global warming over various time-frames Then we evaluate conditions under which delayed deployment of near-zero emission systems would result in loss of all net climate benefit (if any) from using natural gas as a bridge Considering only physical climate system effects we find that there is potential for delays in deployment of near-zero-emission technologies to offset all climate benefits from replacing coal energy systems with natural gas energy systems especially if natural gas leakage is high the natural gas energy system is inef-ficient and the climate change metric emphasizes decadal time scale changes
32
PAPERFugitive emissions from the Bakken shale illustrate role of shale production in global ethane shift Kort et al Geophysical Research Letters vol43 no9 pp4617-4623 16th May 2016
Airborne methane remote measurements reveal heavy-tail flux distribution in Four Corners region Frankenberg et al PNAS vol113 no35 pp9734-9739 30th August 2016
Identification and characterization of high methane-emitting abandoned oil and gas wells Kang et al PNAS (preprint) Sep-tember 2016
An improved method for estimating GHG emissions from onshore oil and gas explo-ration and development in China Chen et al Science of The Total Environment vol574 pp707-715 1st January 2017
EXTRACTEthane is the second most abundant atmospheric hydrocarbon exerts a strong influence on tropospheric ozone and reduces the atmospherersquos oxidative capacity Global observa-tions showed declining ethane abundances from 1984 to 2010 while a regional measure-ment indicated increasing levels since 2009 with the reason for this subject to specula-tion The Bakken shale is an oil and gas-producing formation centered in North Dakota that experienced a rapid increase in production beginning in 2010 We use airborne data collected over the North Dakota portion of the Bakken shale in 2014 to calculate ethane emissions of 023 plusmn 007 (2σ) Tgyr equivalent to 1ndash3 of total global sources Emissions of this magnitude impact air quality via concurrent increases in tropospheric ozone This recently developed large ethane source from one location illustrates the key role of shale oil and gas production in rising global ethane levels
Space-based observations have identified the Four Corners region in the Southwest United States as an area of large CH4 enhancements We conducted an airborne cam-paign in Four Corners during April 2015 with the next-generation Airborne VisibleInfrared Imaging Spectrometer (near-infrared) and Hyperspectral Thermal Emission Spectrometer (thermal infrared) imaging spectrometers to better understand the source of methane by measuring methane plumes at 1- to 3-m spatial resolution Our analysis detected more than 250 individual methane plumes from fossil fuel harvesting processing and distribut-ing infrastructures spanning an emission range from the detection limit 2 kgh to 5 kgh through 5000 kgh Observed sources include gas processing facilities storage tanks pipeline leaks and well pads as well as a coal mine venting shaft
Recent measurements of methane emissions from abandoned oilgas wells show that these wells can be a substantial source of methane to the atmosphere particularly from a small proportion of high-emitting wells However identifying high emitters remains a chal-lenge We couple 163 well measurements of methane flow rates ethane propane and n-butane concentrations isotopes of methane and noble gas concentrations from 88 wells in Pennsylvania with synthesized data from historical documents field investigations and state databases Repeat measurements over 2 years show that flow rates of high emitters are sustained through time
Greenhouse gas (GHG) emissions from oil and gas exploration and development are major contributors to emission inventories in oil and natural gas (ONG) systems For the developing countries including China studies of this aspect of the industry being at an early stage lack a unified method of calculation and this leads to varied projections of national emissions In this paper progress is reported on direct measurement of CH4 and CO2 emissions along the oil and gas value chain for four oil and gas fields An improved calculation method (classification calculation method) which considers the production sta-tus of each type of oil and gas field in China is proposed for the first time in this study
_____________________________
1 Edward Davey today made the case for the safe and responsible exploration of shale gas in the UK in line with UKrsquos climate change targets DECC 9th September 2013 ndash httpswwwgovukgovernmentnewsdavey-uk-shale-gas-development-will-not-be-at-expense-of-climate-change-targets
2 Shale Gas and Fracking A Briefing Paper from the Mission and Public Affairs Council Environ-ment Working Group of the Church of England December 2016 ndash httpswwwchurchofenglandorgme-dia3856131shale-gas-and-frackingpdf
3 Guidance on fracking developing shale gas in the UK Department for Business Energy and Industrial Strategy (BEIS) 13th January 2017 ndash httpswwwgovukgovernmentpublicationsabout-shale-gas-and-hydraulic-fracturing-frackingdeveloping-shale-oil-and-gas-in-the-uk
4 Shale Gas and Fracking (No6073) Jeanne Delebarre Elena Ares Louise Smith House of Commons Library 4th January 2017 ndash httpresearchbriefingsfilesparliamentukdocumentsSN06073SN06073pdf
5 Potential Greenhouse Gas Emissions Associated with Shale Gas Extraction and Use David Mackay and Timothy Stone DECC September 2013 ndash httpswwwgovukgovernmentuploadssystemuploadsattach-ment_datafile237330MacKay_Stone_shale_study_report_09092013pdf
6 Shale gas extraction in the UK Royal SocietyRoyal Academy of Engineering June 2012 ndash httpsroy-
33
alsocietyorg~mediapolicyprojectsshale-gas-extraction2012-06-28-shale-gaspdf 7 Review of the potential public health impacts of exposures to chemical and radioactive pollutants as a
result of shale gas extraction Public Health England June 2014 ndash httpswwwgovukgovernmentuploadssystemuploadsattachment_datafile332837PHE-CRCE-009_3-7-14pdf
8 Shale gas A provisional assessment of climate change and environmental impacts Tyndall Centre Man-chester January 2011 ndash httpwwwfraworgukfilesextremetyndall_coop_2011-1pdf
9 Well Permit Issuance for Horizontal Drilling And High-Volume Hydraulic Fracturing to Develop the Marcellus Shale and Other Low-Permeability Gas Reservoir New York State Department of Environmental Conservation September 2009 ndash ftpftpdecstatenyusdmndownloadOGdSGEISFullpdf
10 Air Impacts of Increased Natural Gas Acquisition Processing and Use A Critical Review Christopher W Moore et al Science of the Total Environment March 2014 ndash httpwwwfraworguklibraryextrememoore_2014pdf
11 Doubt is Their Product How industryrsquos assault on science threatens your health David Michaels Ox-ford University Press May 2008 ISBN 9780-1953-0067-3
12 Shale Oil and Natural Gas Nexus Studying the Atmospheric Effects of Changing Energy Use in the US at the Nexus of Air Quality and Climate Change National Oceanic and Atmospheric Administration US Department of Commerce April 2014 ndash httpwwwesrlnoaagovcsdprojectssongnexwhitepaperpdf
13 Enrichment of Radon and Carbon Dioxide in the Open Atmosphere of an Australian Coal Seam Gas Field Tait et al Environmental Science and Technology vol47 pp3099-3104 27th February 2013 ndash httppubsacsorgdoipdf101021es304538g
14 Air Impacts of Increased Natural Gas Acquisition Processing and Use A Critical Review Christopher W Moore et al Science of the Total Environment vol48 no15 pp8349-8359 March 2014 ndash httpwwwfraworgukfilesextrememoore_2014pdf
15 Anthropogenic emissions of methane in the United States Scot M Miller et al PNAS 18 th October 2013 ndash httpwwwpnasorgcontent1105020018fullpdfwith-ds=yes
16 Methane Leaks from North American Natural Gas Systems AR Brandt et al Science vol343 pp733-735 14th February 2014 ndash httpwwwfraworgukfilesextremebrandt_2014pdf
17 Understanding exposure from natural gas drilling puts current air standards to the test David Brown et al Reviews on Environmental Health vol29 29th March 2014 ndash httpwwwfraworgukfilesextremebrown_lewis_2014pdf
18 13th Landward Licensing Round DECC hosted at the National Archives ndash httpwebarchivenation-alarchivesgovukcontent20121114093642httpogdeccgovukenolgscmslicenceslic_rounds13th_round13th_roundaspx
19 14th Licensing Round DECCOil and Gas Authority 2016 ndash httpswwwogauthoritycouklicensing-consentslicensing-roundsonshore-licensing-rounds
20 Strategic Environmental Assessment for 14th and Subsequent Onshore Oil amp Gas Licensing Rounds DECC 2010 ndash httpwebarchivenationalarchivesgovukcontent20110508074721httpswwwogdeccgovukinformationpapersindexhtm
21 Environmental report for further onshore oil and gas licensing DECC December 2013 ndash httpswwwgovukgovernmentconsultationsenvironmental-report-for-further-onshore-oil-and-gas-licensing
22 Methane and the greenhouse-gas footprint of natural gas from shale formations Robert W Howarth et al Climatic Change vol106 no4 pp679-690 June 2011 ndash httplinkspringercomcontentpdf101007s10584-011-0061-5pdf
23 Climate Change 2013 The Physical Science Basis (Assessment Report 5 Working Group I) Intergov-ernmental Panel on Climate Change 2013 ndash httpswwwipccchpdfassessment-reportar5wg1WG1AR5_Chapter08_FINALpdf
24 Climate forcing growth rates doubling down on our Faustian bargain Hansen et al Environmental Research Letters vol8 no1 id011006 March 2013 ndash httpiopscienceioporg1748-932681011006pdf1748-9326_8_1_011006pdf
25 A commentary on ldquoThe greenhouse-gas footprint of natural gas in shale formationsrdquo by RW Howarth R Santoro and Anthony Ingraffea Lawrence M Cathles III Larry Brown Milton Taam Andrew Hunter Geochemistry-Geophysics-Geosystems (G3) vol13 no6 3rd January 2012 ndash httpwwwgeocornelledu
34
easPeoplePlacesFacultycathlesNatural20Gas201220Cathles20et20al20Commentary20on20Howarthpdf
26 Venting and Leaking of Methane from Shale Gas Development Response to Cathles et al Robert W Howarth et al Climatic Change vol113 no2 pp537-549 July 2012 ndash httpwwwfraworguklibraryex-tremehowarth_2012pdf
27 Measurements of methane emissions at natural gas production sites in the United States Allen et al PNAS vol110 no44 pp17768-17773 29th October 2013 ndash httpwwwpnasorgcontent1104417768fullpdfwith-ds=yes
28 Reconciling divergent estimates of oil and gas methane emissions Zavala-Araiza et al PNAS vol112 no51 pp15597-15602 22nd December 2015 ndash httpwwwpnasorgcontent1125115597fullpdfwith-ds=yes
29 Anthropogenic emissions of methane in the United States Miller et al PNAS vol110 no50 pp20018-20022 10th December 2013 ndash httpwwwpnasorgcontent1105020018fullpdfwith-ds=yes
30 Variability of Distributions of Well-Scale Estimated Ultimate Recovery for Continuous (Unconvention-al) Oil and Gas Resources in the United States Open-File Report 2012ndash1118 US Geological Survey US Department of the Interior June 2012 ndash httppubsusgsgovof20121118OF12-1118pdf
31 Harmonization of initial estimates of shale gas life cycle greenhouse gas emissions for electric power generation Heath et al PNAS vol111 no31 ppE3167-E3176 5th August 2014 ndash httpwwwpnasorgcontent11131E3167fullpdfwith-ds=yes
32 Early warning of climate tipping points Timothy M Lenton Nature Climate Change vol1 pp201-209 July 2011 ndash httpwwwfraworguklibraryclimatelenton_2011pdf
33 The Greenhouse Gas Emissions Profile of Coal Bed Methane (CBM) Production A Review of Exist-ing Research John Broderick Maria Sharmina Tyndall Centre Manchester January 2014 ndash httpswwwescholarmanchesteracukapidatastreampublicationPid=uk-ac-man-scw225295ampdatastreamId=FULL-TEXTPDF
34 Climate forcing growth rates doubling down on our Faustian bargain Hansen et al Environmental Research Letters vol8 no1 id011006 March 2013 ndash httpiopscienceioporg1748-932681011006pdf1748-9326_8_1_011006pdf
35 A bridge to nowhere methane emissions and the greenhouse gas footprint of natural gas Robert W Howarth Energy Science and Engineering vol2 no2 pp47-60 June 2014 ndash httponlinelibrarywileycomdoi101002ese335pdf
36 Climate Change 2013 The Physical Science Basis (Assessment Report 5 Working Group I) Intergov-ernmental Panel on Climate Change 2013 ndash httpswwwipccchpdfassessment-reportar5wg1WG1AR5_Chapter08_FINALpdf
37 Effect of methane leakage on the greenhouse gas footprint of electricity generation Sanchez and Mays Climatic Change vol133 no2 pp169-178 November 2015 ndash httpwwwfraworguklibraryextremesan-chez_2015pdf
38 Hydrocarbon emissions characterization in the Colorado Front Range A pilot study Peacutetron et al Jour-nal of Geophysical Research vol117 noD4 21st February 2012 ndash httpwwwfraworguklibraryextremepetron_2012pdf
39 Methane emissions estimate from airborne measurements over a western United States natural gas field Karion et al Geophysical Research Letters vol40 no16 27th August 2013 ndash httponlinelibrarywileycomdoi101002grl50811pdf
40 Aircraft-Based Measurements of Point Source Methane Emissions in the Barnett Shale Basin Lavoie et al Environmental Science and Technology vol49 no13 pp7904-7913 7th July 2015 ndash httppubsacsorgdoipdf101021acsest5b00410
41 Mackay-Stone Shale Gas and Climate Review ndash spreadsheet model Paul Mobbs Mobbsrsquo Environmen-tal Investigations May 2014 ndash httpwwwfraworgukmeiarchivereportspollutionmackay_stone_shale_gas_review_spreadsheetods
42 Extreme Energy and Climate A critical review of the UK Governmentrsquos policy on unconventional fossil fuels and climate change Paul Mobbs Mobbsrsquo Environmental Investigations May 2014 ndash httpwwwfraworgukmeiarchivereportspollutionextreme_energy_and_climate-critical_reviewpdf
35
43 Measurements of methane emissions at natural gas production sites in the United States Allen et al PNAS vol110 no44 pp17768-17773 29th October 2013 ndash httpwwwpnasorgcontent1104417768fullpdfwith-ds=yes
44 Methane leaks erode green credentials of natural gas Jeff Tollefson Nature vol493 23rd January 2013 ndash httpwwwnaturecompolopoly_fs112123menumaintopColumnstopLeftColumnpdf493012apdf
45 Methane And The Greenhouse-Gas Footprint Of Natural Gas From Shale Formations ndash A Letter Howarth et al Climatic Change vol106 no4 pp679-690 June 2011 ndash httplinkspringercomcontentpdf1010072Fs10584-011-0061-5pdf Methane emissions estimate from airborne measurements over a western United States natural gas field Karion et al Geophysical Research Letters vol40 no16 27th Au-gust 2013 ndash httponlinelibrarywileycomdoi101002grl50811pdf Hydrocarbon emissions character-ization in the Colorado Front Range A pilot study Peacutetron et al Journal Of Geophysical Research vol117 noD4 21st February 2012 ndash httpwwwfraworguklibraryextremepetron_2012pdf
46 Quantifying sources of methane using light alkanes in the Los Angeles basin California Peischl et al Journal of Geophysical Research Atmospheres vol118 no10 pp4974-4990 27th May 2013 ndash httpon-linelibrarywileycomdoi101002jgrd50413pdf
47 Anthropogenic emissions of methane in the United States Miller et al PNAS vol110 no50 pp20018-20022 10th December 2013 ndash httpwwwpnasorgcontent1105020018fullpdfwith-ds=yes
48 Sensor transition failure in the high flow sampler Implications for methane emission inventories of natural gas infrastructure Howard et al Journal of the Air amp Waste Management Association vol65 no7 pp856-862 July 2015 ndash httpwwwtandfonlinecomdoipdf1010801096224720151025925
49 University of Texas study underestimates national methane emissions at natural gas production sites due to instrument sensor failure Toucheacute Howard Journal of Energy Science and Engineering vol3 no5 pp443-455 September 2015 ndash httponlinelibrarywileycomdoi101002ese381pdf
50 Updated Fugitive Greenhouse Gas Emissions for Natural Gas Pathways in the GREET1_2015 Model Burnham et al Argonne National Laboratory October 2015 ndash httpsgreetesanlgovfilesfugitive-ch4-2015
51 A large increase in US methane emissions over the past decade inferred from satellite data and surface observations Turner et al Geophysical Research Letters (preprint) 2016 ndash httponlinelibrarywileycomdoi1010022016GL067987pdf
52 Methane Research The 16 Study Series an unprecedented look at methane from the natural gas system Environmental Defense Fund January 2016 ndash httpwwwedforgsitesdefaultfilesmethane_studies_fact_sheetpdf
53 Carbon Emissions Fracking column 427W Commons Hansard 14th October 2013 ndash httpwwwpubli-cationsparliamentukpacm201314cmhansrdcm131014text131014w0001htmcolumn_427W
54 Energy Fracking column GC57 Lords Hansard 17th March 2014 ndash httpwwwpublicationsparlia-mentukpald201314ldhansrdtext140317-gc0002htmcolumn_GC57
55 Energy and Climate Change questions lsquofrackingrsquo columns 297W298W Commons Hansard 26th June 2014 ndash httpwwwpublicationsparliamentukpacm201415cmhansrdcm140626text140626w0002htmcolumn_297W
56 Shale GasOil Policy column 35WS Commons Hansard 16th September 2015 ndash httpwwwpublica-tionsparliamentukpacm201516cmhansrdcm150916wmstext150916m0001htmcolumn_35WS
57 Infrastructure Bill [Lords] column 313 Commons Hansard 13th January 2015 ndash httpwwwpublica-tionsparliamentukpacm201415cmpublicinfrastructure150113pm150113s01htmColumn313
58 Fracking Written question 21730 Written Questions and Answers and Written Statements 18th January 2016 ndash httpwwwparliamentukwritten-questions-answers-statementswritten-questioncom-mons2016-01-1121730
59 Fracking Written question 22951 Written Questions and Answers and Written Statements 28th January 2016 ndash httpwwwparliamentukwritten-questions-answers-statementswritten-questioncom-mons2016-01-1822951
60 The Environmental Risks of ldquoFrackingrdquo A submission to the House of Commons Environmental Audit Committee Inquiry Paul MobbsMobbsrsquo Environmental Investigations December 2014 ndash httpwwwfraworgukmeiarchivereportspollutioneac_submission-the_environmental_risks_of_frackingpdf
36
61 Environmental risks of fracking (HC856) Eighth Report of Session 2014-15 Commons Environ-mental Audit Committee January 2015 ndash httpwwwpublicationsparliamentukpacm201415cmse-lectcmenvaud856856pdf Infrastructure Bill [Lords] column 583 Commons Hansard 26th January 2015 ndash httpwwwpublicationsparliamentukpacm201415cmhansrdcm150126debtext150126-0001htmcolumn_583
62 See section 12 Ministerial Code Cabinet Office December 2016 ndash httpswwwgovukgovernmentuploadssystemuploadsattachment_datafile579752ministerial_code_december_2016pdf
63 Onshore Petroleum The compatibility of UK onshore petroleum with meeting the UKrsquos carbon budgets Committee on Climate Change March 2016 ndash httpswwwthecccorgukwp-contentuploads201607CCC-Compatibility-of-onshore-petroleum-with-meeting-UK-carbon-budgetspdf
64 Committee on Climate Change UKrsquos Carbon Budgets Statement by Andrea Leadsom Minister of State Department of Energy and Climate Change Volume 612 Hansard 7th July 2016 ndash httpshansardparliamentukcommons2016-07-07debates16070737000020CommitteeOnClimateChangeUKSCarbon-Budgets
65 Committee on Climate Change UKrsquos Carbon Budgets The Minister of State Department of Energy and Climate Change Andrea Leadsom Hansard 7th July 2016 ndash httpshansardparliamentukCom-mons2016-07-07debates16070737000020CommitteeOnClimateChangeUKSCarbonBudgetshighlight=shale20gas20climate20changecontribution-16070737000046
66 Onshore Petroleum The Compatibility Of UK Onshore Petroleum With Meeting The UKrsquos Carbon Budgets Government Response to the Committee on Climate Change Report July 2016 ndash httpswwwgovukgovernmentuploadssystemuploadsattachment_datafile535208CCC_Response_new_template_FI-NALpdf
67 Evidence from Nick Hurd MP Minister of State for Climate Change and Industry Business Energy and Industrial Strategy Committee Tuesday 10th January 2017 ndash httpwwwparliamentlivetvEventIndexb8d4021c-1011-436e-b2e6-3705f225f7d7
68 Methane amp CO2 emissions from the natural gas supply chain Balcombe et al Sustainable Gas Insti-tute September 2015 ndash httpwwwsustainablegasinstituteorgpublicationswhite-paper-1
69 Reconciling divergent estimates of oil and gas methane emissions Zavala-Araiza et al PNAS vol112 no51 pp15597-15602 15th December 2015 ndash httpwwwpnasorgcontent1125115597fullpdfwith-ds=yes
70 Natural Gas Guardrails For A Potential Climate Bridge Lazarus et al Stockholm Environment Insti-tute May 2015 ndash httpswwwsei-internationalorgmediamanagerdocumentsPublicationsClimateNCE-SEI-2015-Natural-gas-guardrails-climate-bridgepdf
71 Climate Change 2014 Mitigation of Climate Change (Assessment Report 5 Working Group III) IPCC April 2014 ndash httpwwwipccchpdfassessment-reportar5wg3ipcc_wg3_ar5_chapter7pdf
72 Fracking Cannot Be Reconciled with Climate Change Mitigation Policies Staddon amp Depledge En-vironmental Science Technology vol49 no14 pp8269-8270 2nd July 2015 ndash httppubsacsorgdoipdf101021acsest5b02441
73 Climate benefits of natural gas as a bridge fuel and potential delay of near-zero energy systems Zhang et al Applied Energy vol167 pp317-322 April 2016 ndash httpwwwfraworguklibraryclimatezhang_2015pdf
74 Coal to gas the influence of methane leakage Tom M L Wigley Climatic Change vol108 pp601-608 26th August 2011 ndash httplinkspringercomcontentpdf1010072Fs10584-011-0217-3pdf
75 Greenhouse gases climate change and the transition from coal to low-carbon electricity Myhrvold and Caldeira Environmental Research Letters vol7 id014019 February 2012 ndash httpiopscienceioporg1748-932671014019pdf1748-9326_7_1_014019pdf
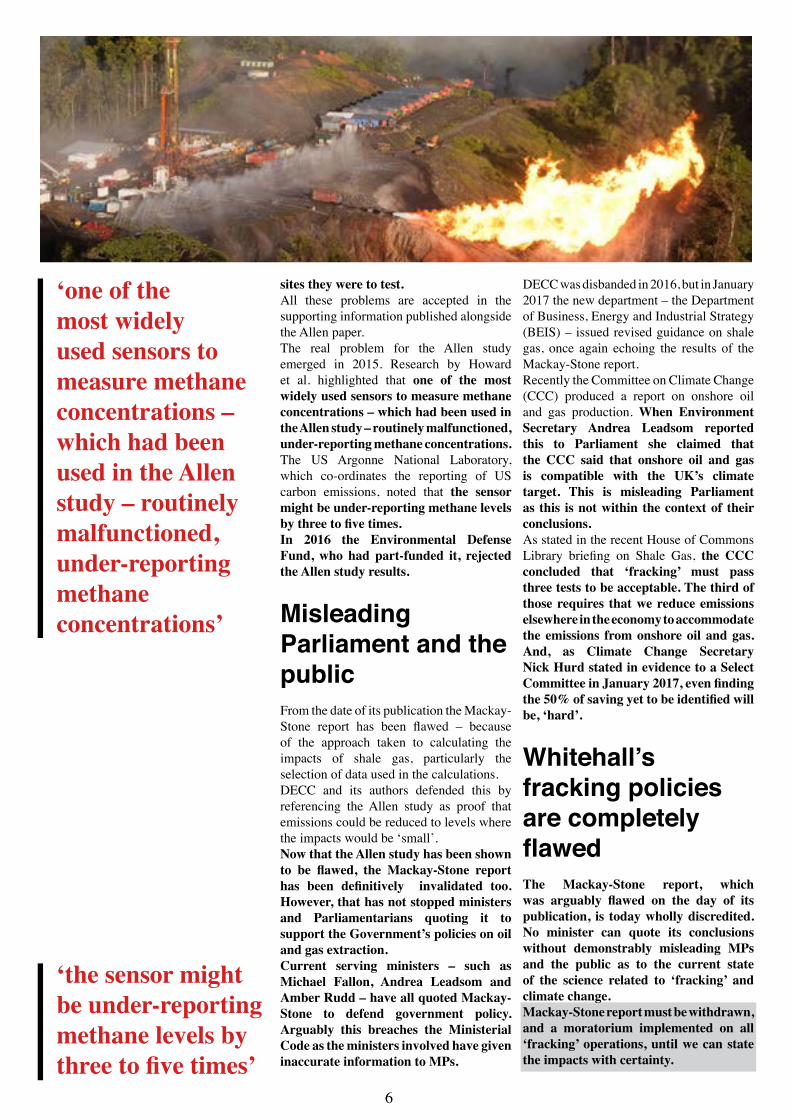
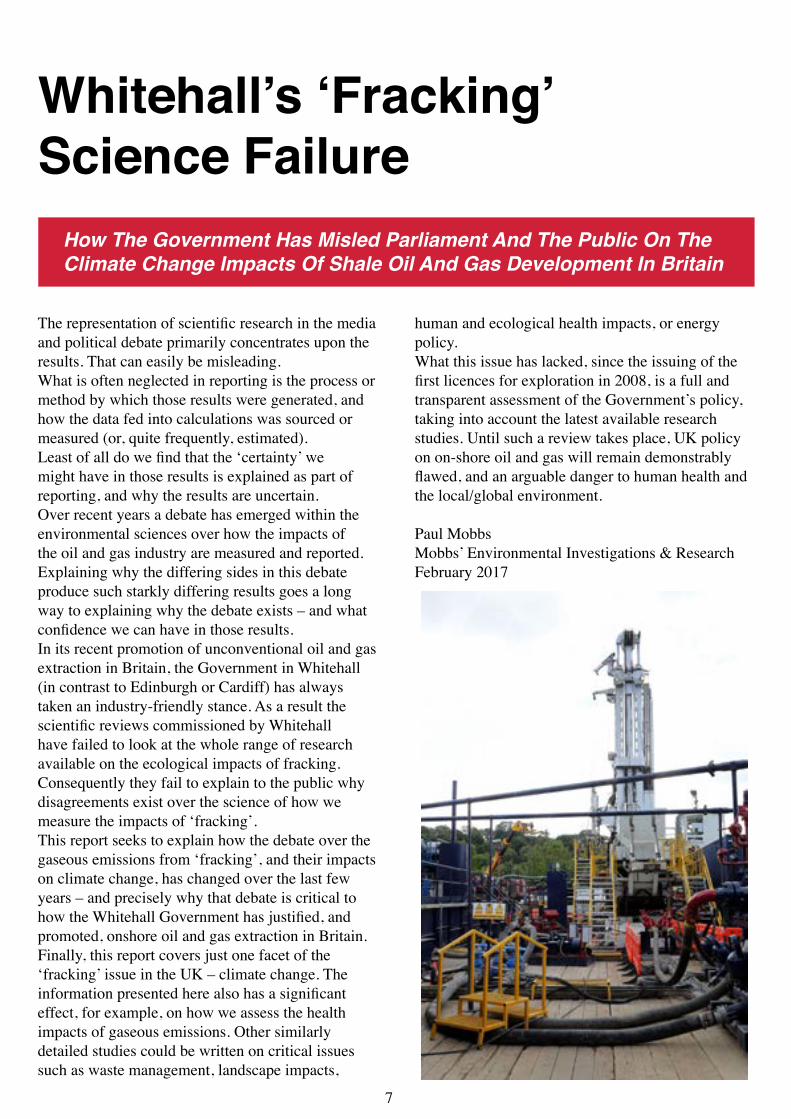
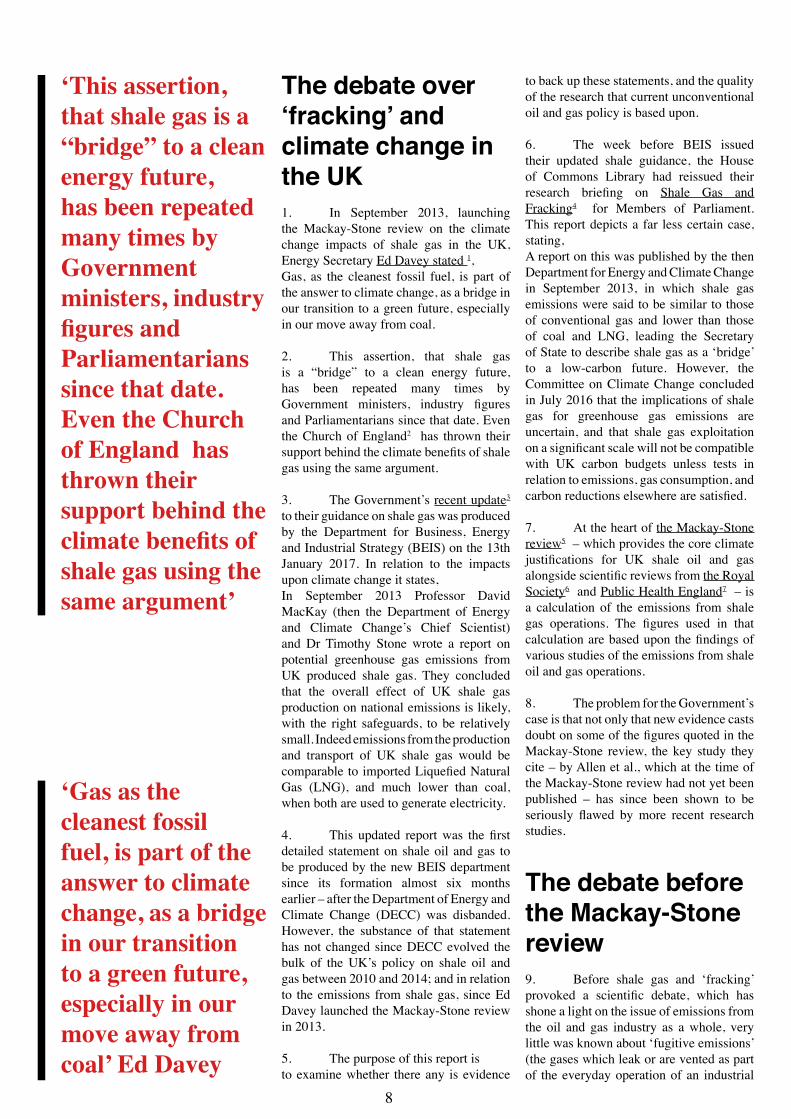
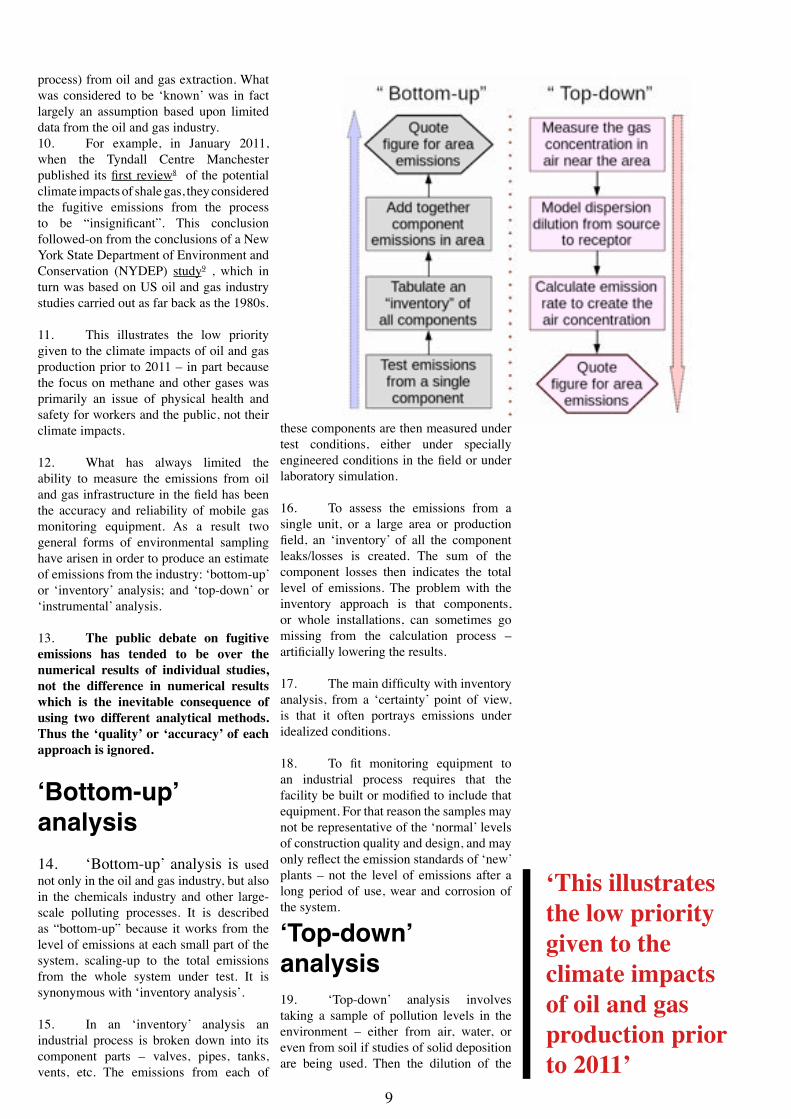
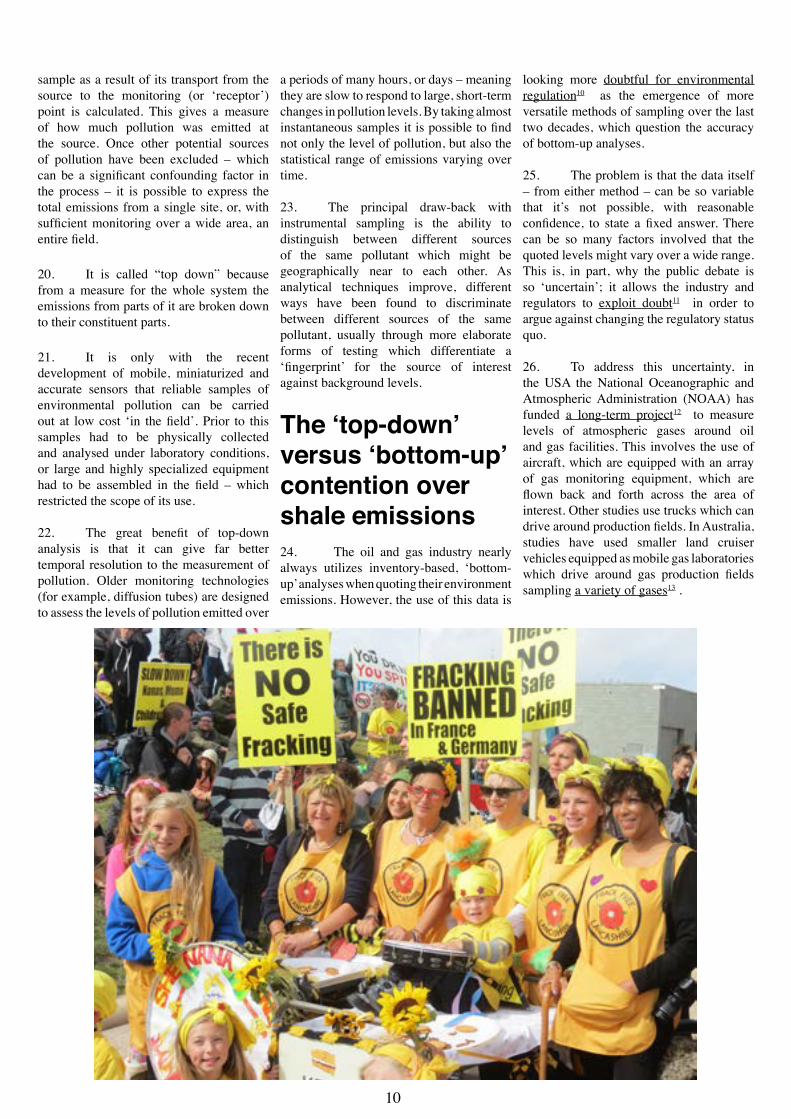
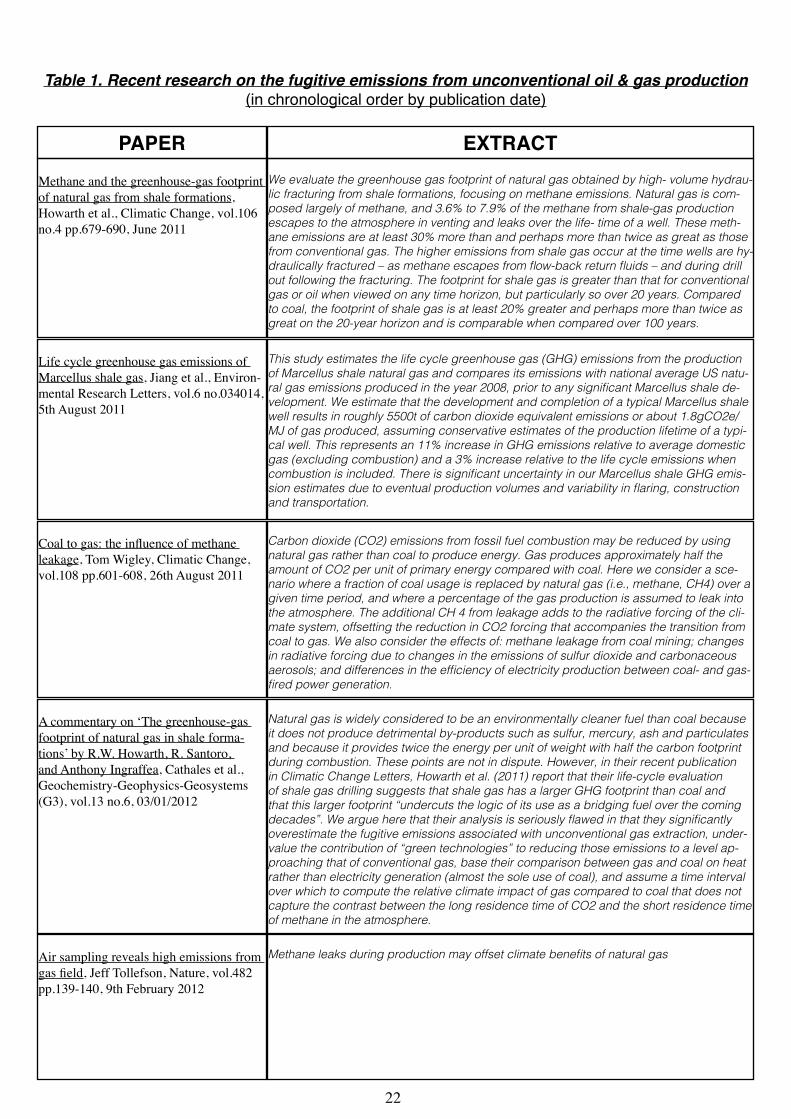