Embed Size (px)
Citation preview

Eastern white pine (Pinus strobus )
White pine is one of the largest and most long-lived species in Wisconsin. Once a significant
component of our northern forests, most large trees were harvested during the Cutover
Period of the late 19th century. Today, white pine is making a comeback.
The white pine resource has doubled in volume in the last two decades. The number of trees
in all size classes has increased significantly indicating that white pine should remain a major
species in future forests. Models indicate a sharp increase in volume in the next 40 years.
Growth rates are high and increasing. Mortality rates which are relatively quite low, have
increased slightly since 1996. Currently, white pine accounts for 8.1% of volume and 12.5%
of growth statewide but only 2.3% of total mortality.
White pine makes up 3.2% of roundwood production and is mainly used for pulpwood and
sawlogs. The density of white pine wood is very low making it a less desirable species for
biomass production.
Division of Forestry WI Dept of Natural Resources
Feb 2017
How has the white pine resource changed? Volume and diameter class distribution:
Where is white pine found in Wisconsin? Growing stock volume by region with map
What kind of sites does white pine grow on? Habitat type and site index distribution
How fast is white pine growing? Average annual net growth: trends and ratio of growth to volume
How healthy is white pine in Wisconsin? Average annual mortality: trends and ratio of mortality to volume
Does white pine have any disease or pest issues? White pine blister rust: biology, symptoms and impact
How much white pine do we harvest? Roundwood production by product and ratio of growth to removals
How much white pine biomass do we have? Tons of aboveground biomass by region of the state
Can we predict the future of white pine? Modelling future volumes

0
50
100
150
200
250
0-19 20-39 40-59 60-79 80-99 100-119
Change in acreage of red pine forest type
1983
1996
2005
“How has the white pine resource changed?” Growing stock volume and diameter class distribution
The growing stock volume of white pine is 1.8 billion cubic feet or
about 8.1% of total statewide volume (chart on right). White pine
volume has risen steadily and dramatically in the last 50 years,
tripling since 1983 and increasing 43% since 2004. Volume in all
diameter classes has increased significantly (chart below left).
The numbers of trees in all size classes has increased over 60% (chart
below right), including a more than doubling in the number of
saplings. This indicates that white pine will probably play a very
significant role in future forests of Wisconsin.
Percentage change in the number of live trees by size class between 1996 and 2015. Source: USDA Forest Inventory and Analysis data 1996 and 2015.
Growing stock volume (million cubic feet) by diameter class (inches). Source: USDA Forest Inventory and Analysis data
Growing stock volume (million cubic feet) by inventory year. Source: USDA Forest Inventory and Analysis data
1,765
0
300
600
900
1200
1500
1800
1938 1943 1948 1953 1958 1963 1968 1973 1978 1983 1988 1993 1996 2004 2009 2015
Mill
ion
cft
Growing stock volume of white pine
127%
64% 69%
0%
20%
40%
60%
80%
100%
120%
140%
Sapling Pole Sawtimber
Percentage change in tree numbers:
Eastern white pine
0
50
100
150
200
250
300
350
400
1983 1996 2015
Mill
ion
cft
Volume of white pine by diameter class
5-8.9
9-12.9
13-16.9
17-20.9
21-24.9
25+

“Where is white pine found in Wisconsin?”
Growing stock volume by region with map
Eastern white pine is a common species in northern and central
forests (Table 1).
In addition to the pine forest types, white pine is typically found in
combination with hardwoods in the oak-hickory, oak-pine, aspen-
birch and maple-basswood forest types. About 25% of the white
pine forest type is planted.
Table 1. Growing stock volume (million cft) by species and region of the state.
Species Central North east
North west
South east
South west
Total
White Pine 540 612 388 100 124 1,765
Percent of total 31% 35% 22% 6% 7% 100%
Source: USDA Forest Service, Forest Inventory and Analysis
For a table of Volume by County go to: http://dnr.wi.gov/topic/ForestBusinesses/documents/tables/VolumeCountySpecies.pdf

“What kind of sites does white pine grow on?”
Habitat type1 and site index distribution
White pine grows on a wide variety of habitat types (chart below). About 40% of growing stock volume occurs on
The majority of white pine growing stock volume, 62%,
occurs in stands with site indices over 60 (chart on
left).
The average site index by volume for white pine is 66,
equal to the average for all species which is also 66.
drier sites, another 16% on more mesic habitat types and 21% on wetter sites.
Percent distribution of growing stock volume by habitat type group (USDA Forest Inventory & Analysis data).
Percent distribution of growing stock volume by site index class (USDA Forest Inventory & Analysis data).
1 For more information on habitat types see Schmidt, Thomas L. 1997. Wisconsin forest statistics, 1996. Resource Bulletin NC-183. St. Paul, MN: U.S. Dept. of Agriculture, Forest Service, North Central
Habitat type group1
Very Dry to Dry, 13%
Dry to Dry-mesic, 11%
Dry-mesic,16%
2%Mesic, 14%
Mesic to Wet-mesic, 17%
Wet, 4%
Undefined, 22%
Eastern White PineVery Dry to Dry
Dry to Dry-mesic
Dry-mesic
Dry-mesic to Mesic
Mesic
Mesic to Wet-mesic
Wet
Undefined
0%
5%
10%
15%
20%
25%
30%
<41 41 - 50 51 - 60 61 - 70 71 - 80 81 - 90 91+
Site index class
Percent of volume by site index
E. White Pine
All Species

“How fast is white pine growing?”
Average annual net growth: trends and ratio of growth to volume
Region Net
growth Percent of Total
Ratio of growth to volume
Northeast 21.0 29% 3.4%
Northwest 13.3 18% 3.4%
Central 24.6 34% 4.5%
Southwest 6.6 9% 5.3%
Southeast 6.7 9% 6.6%
Statewide 72.1 100% 4.1%
Source: USDA Forest Inventory and Analysis
Table 2. Average annual net growth (million cft/year) of growing stock and the ratio of growth to volume by region of the state.
Volume growth of white pine is highest in central and northeastern
Wisconsin but growth rates are highest in the south (Table 2).
The average ratio of net growth to volume for white pine is 4.1%, much
higher than the statewide average of 2.7% for all species.
Average annual net growth (million cubic feet). Source: USDA Forest Inventory & Analysis data
For a table of Average annual growth, mortality and removals by region go to:
http://dnr.wi.gov/topic/ForestBusinesses/documents/tables/GrowthMortalityRemovals.pdf
Average annual net growth of eastern white pine was about
72.1 million cubic feet per year between 2010 and 2015,
representing 12.5% of statewide volume growth (chart on
right). Growth rates have increased significantly in the last
three decades, quadrupling since 1983.
13.5 16.9 28.9 53.5 72.10
10
20
30
40
50
60
70
80
90
1968 1983 1996 2009 2015
Mil
lio
n c
ft
Average annual net growth of white pine
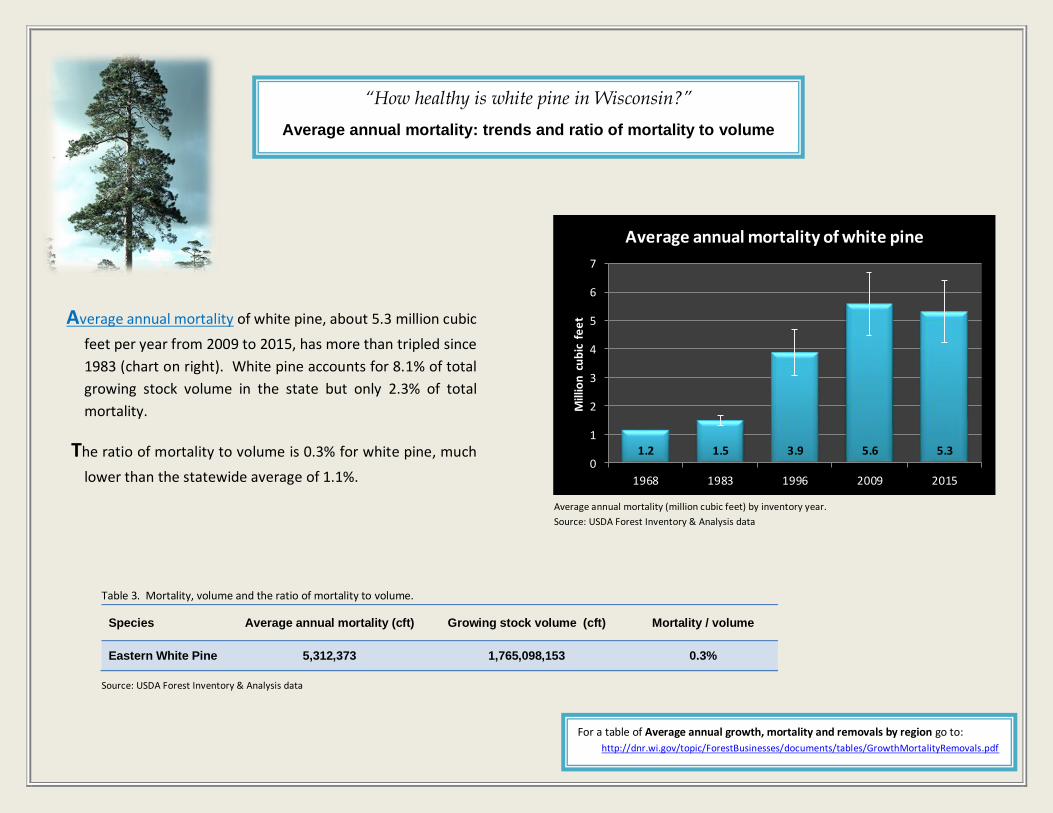
“How healthy is white pine in Wisconsin?”
Average annual mortality: trends and ratio of mortality to volume
Average annual mortality of white pine, about 5.3 million cubic
feet per year from 2009 to 2015, has more than tripled since
1983 (chart on right). White pine accounts for 8.1% of total
growing stock volume in the state but only 2.3% of total
mortality.
The ratio of mortality to volume is 0.3% for white pine, much
lower than the statewide average of 1.1%.
Species Average annual mortality (cft) Growing stock volume (cft) Mortality / volume
Eastern White Pine 5,312,373 1,765,098,153 0.3%
Table 3. Mortality, volume and the ratio of mortality to volume.
Source: USDA Forest Inventory & Analysis data
Average annual mortality (million cubic feet) by inventory year.
Source: USDA Forest Inventory & Analysis data
For a table of Average annual growth, mortality and removals by region go to:
http://dnr.wi.gov/topic/ForestBusinesses/documents/tables/GrowthMortalityRemovals.pdf
1.2 1.5 3.9 5.6 5.30
1
2
3
4
5
6
7
1968 1983 1996 2009 2015
Mill
ion
cu
bic
fe
et
Average annual mortality of white pine

“Does white pine have any major disease or pest issues?” White pine blister rust: biology, symptoms and impact
Jack pine budworm: biology, symptoms and impact
White pine blister rust (WPBR) is a devastating disease of five-needled pines. Caused
by the fungus, Cronartium ribicola, it can kill branches, create stem cankers and
result in eventual death of a tree. The alternate host for this rust is most commonly
a species of gooseberry or Ribes.
WPBR can be found throughout Wisconsin wherever Ribes is abundant. Ribes species
grow mostly on mesic to wet habitat types and much less on dry sites (Figure on
right). White pine volume is evenly distributed between mesic and dry types but
white pine has a much higher mortality rate on mesic to wet sites (Figure on right).
The white pine blister rust fungus, Cronartium ribicola, needs to infect both white
pine and a Ribes spp. to complete its lifecycle. Spores from infected gooseberry
(Figure on left) are carried to white pine trees on cool moist air currents in late
summer or fall. These spores infect pine needles if moisture is present. The fungus
kills the needle and moves into the shoot or branch
Once the fungus reaches the branch, a canker is formed. The canker will girdle the
branch and the infection will continue down into the main trunk. Seedlings and
small trees are in great danger of dying from this disease when a canker girdles the
main stem.
Girdling stem cankers on older trees result in top-killing and the death of branches.
This may not kill the tree but will expose it to increased stress. Branch flagging as
seen in the figure on the left is a sign of probable rust infection.
0%
10%
20%
30%
40%
50%
60%
70%
Very dry-dry mesic
Mesic toWet
0.0%
0.2%
0.4%
0.6%
0.8%
Very dry-dry mesic
Mesic toWet
Left. Frequency of Ribes species on very dry to dry mesic habitat types compared
to mesic to wet types. Source: FIA 1996 data Right. Mortality rate of white pine by habitat type group. Soutce: FIA 2015 data
Upper left. Spores growing on gooseberry leaves.
Upper right: Aeciaspores growing on pine stem.
Lower left. Canker on stem with orange elevated margin. Lower right. Flagging branch indicates probably blister rust infection.

“How much white pine do we harvest?”
Roundwood production by product and ratio of removals to growth
Removals of white pine were 11.9 million cubic feet per year from 2010
to 2015 or 3.9% of total removals.
The ratio of average annual net growth to removals for eastern white pine
was 6.1 from 2010 to 2015 (chart on left), much higher than the average
ratio of 1.7 for all species. The ratio of growth to removals has
increased slightly from 1996 due to a more than doubling of growth.
In 2009-2012, white pine roundwood accounted for 12.3
million cubic feet or about 3.2% of Wisconsin’s total
production, an increase of 16% since 2004. About half is used for
pulpwood , a quarter for sawlogs and veneer and 20% for
fuelwood and miscellaneous products (chart on right).
From 2004 to 2012, pulpwood production increased by 47%.
White pine supplies 6.4 million cubic feet or 3.8% of total
pulpwood production.
Source: USDA Forest Inventory & Analysis data
For a table of Average annual growth, mortality and removals by region go to:
http://dnr.wi.gov/topic/ForestBusinesses/documents/tables/GrowthMortalityRemovals.pdf
9.2 4.7 3.3 6.10.0
2.0
4.0
6.0
8.0
10.0
12.0
1983 1996 2009 2015
Ratio of growth to removals: White pine
Volume of roundwood. Most recent figures for pulpwood and composite products are from 2012 while other product volumes are from 2009. * Miscellaneous products include poles, posts and pilings.
Source: Ronald Piva, USDA Forest Service, Northern Research Station, St. Paul MN
0.0
2.0
4.0
6.0
8.0
Pulpwood Compositeproducts
Saw /veneer logs
Fuelwood Miscproducts*
Mill
ion
cft
Volume of roundwood by product: White pine1999 2004 2009-2012

“How much white pine biomass do we have?”
Aboveground biomass by region of the state
There are 31.1 million tons of aboveground biomass in live white pine trees, an
increase of 194% from 1983. This is equivalent to approximately 15.5 million
tons of carbon and represents 4.9% of all aboveground biomass statewide. As
with volume, most white pine is located in northeast and central Wisconsin
(chart below).
The density of white pine wood is fairly low
with a ratio of biomass to volume of only
26 oven-dry lbs. per cubic foot
(ODP/cubic feet). The average for all
softwoods is about 26 ODP/cubic feet
and for all species is 33 ODP/cubic feet.
Over 78% of all white pine biomass is
located in the main stem, 3% in the
stump, 5% in saplings and 13% in the
branches.
Biomass (above ground dry weight of live trees >1 in dbh, short tons) by year and region of the state. Source: USDA Forest Inventory & Analysis data
For a table of Biomass by County go to:
http://dnr.wi.gov/topic/ForestBusinesses/documents/tables/BiomassByCounty.pdf
-
2
4
6
8
10
12
Northeast Northwest Central Southwest Southeast
Mil
lio
n o
ven
dry
to
ns
Biomass of all live trees: White pine1983 1996 2015

The 5-year ratio of growth to volume is significantly higher for white pine compared to all
species in the state (chart on right) and the rates of both mortality to volume and
removals to volume are significantly lower. This would indicate a large volume increase
in the future all else being equal.
The Forest Vegetation Simulator (FVS1) was used to predict future volumes of white pine
through 2054. Three scenarios are forecast. One with current rates of mortality and
removals (i.e. average annual mortality and removals for 2009 to 2014). Another with
current mortality rates and the lower 67% confidence interval for current removals and
another with the upper 67% confidence interval for removals.
“Can we predict the future of white pine?”
Predicted volumes based on current rates of mortality and harvest
0%
5%
10%
15%
20%
25%
Growth/volume Mortality/volume Removals/volume
White pine All species
1.7
3.2
3.4
3.0
0.0
0.5
1.0
1.5
2.0
2.5
3.0
3.5
4.0
2014 2019 2024 2029 2034 2039 2044 2049 2054
Bil
lio
n c
ub
ic fe
et
Predicted growing stock volume under different harvest levels
Average harvest levels Low Harvest level High harvest level
Volume increases in all three scenarios (chart on left),
86% by 2054 for current average removal levels, 100%
for the lower confidence interval for removals and 74%
for the upper confidence interval for removals.
Volume continues to increase linearly for all three
scenarios, not peaking in the next 40 years. White pine
will replace northern red oak by 2024 as the species
with the third highest volume.
The Forest Vegetation Simulator is a forest growth and yield simulation model created by the USDA Forest Service, see http://www.fs.fed.us/fmsc/fvs/.
Five year ratios of growth, mortality and removals to volume. Source: USDA Forest Inventory & Analysis data