Embed Size (px)
Citation preview

White Paper: Using Laser-Based Headspace Moisture Analysis
for Rapid Nondestructive Moisture Determination
of Sterile Freeze-Dried Product

General IntroductionHeadspace moisture analysis
This section describes the application of headspace
gas analysis, specifically frequency modulation spec-
troscopy (FMS), to non-destructive measurement of
moisture content in freeze dried product. Water is
present in a lyophilized cake in a variety of forms, in-
cluding free, adsorbed, chemically bound, and water
of crystallization. Not all of these water forms are
linked to product stability through degradation of ex-
cipients and active ingredients. Generally, free or ac-
tive water is available for chemical reaction and has
the greatest impact on product stability. Traditional
moisture analysis methods for pharmaceutical prod-
ucts such as Karl Fischer (KF) titration and thermo-gra-
vimetric analysis (TGA) do not distinguish between ac-
tive water and bound water. For example, KF measures
the total water in the freeze dried cake if the sample is
wholly soluble in the KF medium. From a practical
point of view, the KF and TGA methods are time con-
suming, involve chemical reagents, and destroy the
sample. Aseptic processing would benefit from non-
1 LIGHTHOUSE Instruments, Biomatrix Building, Science Park 406, 1098 XH Amsterdam, The Netherlands2 LIGHTHOUSE Instruments, 2030 Avon Court, Charlottesville, VA. 22902, USA3 Biopharma Technology Ltd., 9 Winnall Valley Road, Winchester, SO23 0LD, UK 1
ABSTRACT: Residual product moisture content is a critical parameter when considering the stability and shelf
life of lyophilized pharmaceutical product. Consequently, moisture analysis is performed in product and pro-
cess development, as well as in commercial manufacturing to specify and control the maximum allowable
moisture content. This is traditionally performed using Karl Fischer titration or thermo-gravimetric analysis
(TGA) methods, which are destructive and labor & time intensive. Replacing these slow traditional methods
with a rapid non-destructive method would streamline moisture analysis efforts and help improve the quality
of finished product. Laser-based headspace inspection utilizing frequency modulation spectroscopy (FMS) is a
rapid analytical method used for the analysis and inspection of finished sterile drug product. Quantifying the
physical conditions in the headspace of sterile containers enables the monitoring of critical quality parame-
ters and gives detailed insight into the process. In particular, quantifying the amount of water vapor in the
headspace of freeze dried vials with an optical method enables rapid non-destructive moisture determina-
tion. Experiments have demonstrated that the amount of headspace water vapor directly correlates to the lyo
cake moisture content. Stability studies have shown that the degradation of the active pharmaceutical ingre-
dient correlates to the initial water vapor concentration present in the freeze-dried vial. These results indicate
that rapid water vapor determination with an optical method could replace the slow destructive traditional
methods for the moisture analysis of freeze-dried product. Industry applications of headspace moisture analy-
sis described in this white paper include freeze drying cycle optimization, lyo chamber moisture distribution
mapping, and 100% moisture inspection of commercial freeze-dried product.
White Paper: Using Laser-Based Headspace Moisture Analysis for Rapid Nondestructive Moisture Determination of Sterile Freeze-Dried Product D.I. Duncan1, J.R. Veale2, I. Cook3, K. Ward3
LIGHTHOUSEThe Science of Pharmaceutical Manufacturing
destructive measurement technologies that provide
information on each individual vial not just a small
statistical sampling. Testing entire batches can pro-
vide insight into the efficiency of the drying process
and the dynamics of freeze drying in different loca-
tions within the freeze dryer. In addition, quality con-
trol groups would benefit from being able to non-de-
structively sample a statistically significant number of
finished product vials as part of a release test as well as
monitoring individual vials repeatedly over the prod-
uct shelf life. Finally, 100% moisture inspection of fin-
ished vials in manufacturing would guarantee the
quality of finished product with respect to stability
against moisture.
This white paper describes the correlation between
the headspace moisture, as measured by FMS, and the
cake moisture as measured by Karl Fischer titration, as
well as the direct correlation between headspace mois-
ture and degradation of the active pharmaceutical in-
gredient as measured by high performance liquid
chromatography (HPLC) methods. A case study is pre-
sented showing how freeze-drying cycles can be devel-
oped and moisture content optimized through mea-
surement of headspace moisture. The data show that
even for an apparently well developed lyophilization
cycle a number of random vials are produced with out-
of-specification moisture content. The only way to
identify those random out-of-specification vials is to
perform 100% moisture inspection. The results sug-
gest that laser measurement technologies provide use-
ful insight into monitoring and controlling freeze dry-
ing processes and inspecting individual finished
samples. Data is also presented demonstrating how
the laser-based headspace technique enables moisture
distribution mapping across the shelves of a freeze
dryer. Insight is then gained not only into the lyo-
philization cycle but also into the performance of indi-
vidual freeze dryers.
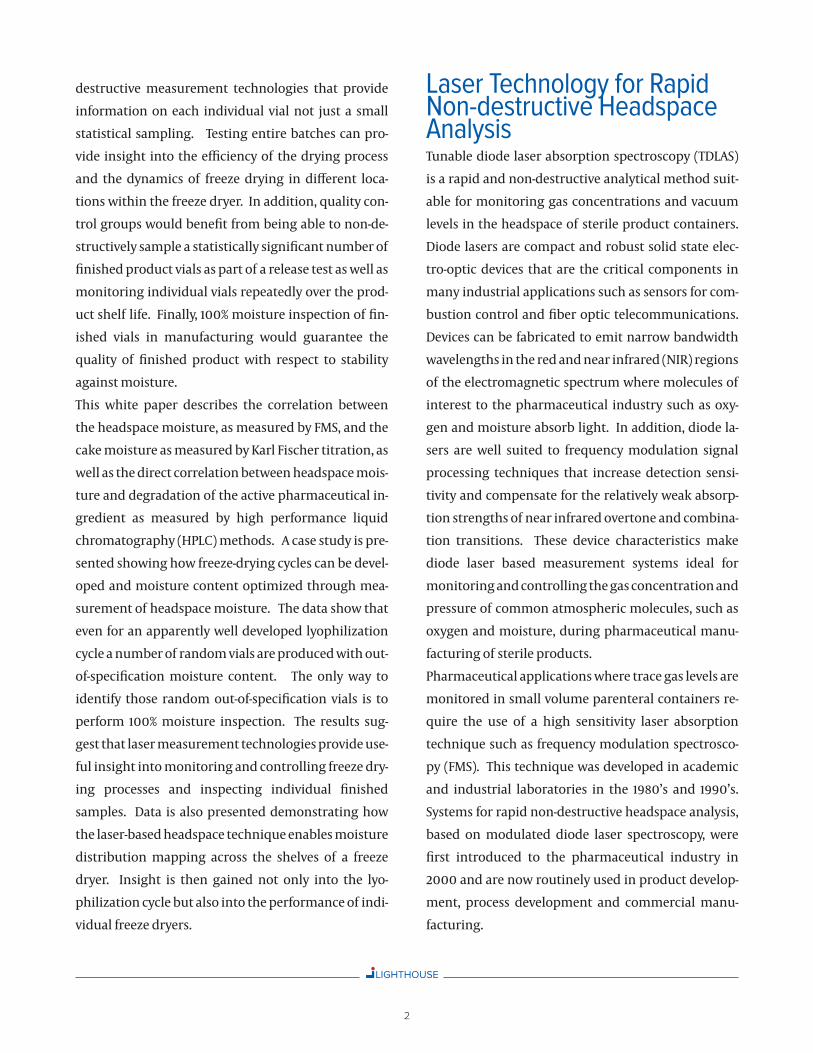
Laser Technology for Rapid Non-destructive Headspace AnalysisTunable diode laser absorption spectroscopy (TDLAS)
is a rapid and non-destructive analytical method suit-
able for monitoring gas concentrations and vacuum
levels in the headspace of sterile product containers.
Diode lasers are compact and robust solid state elec-
tro-optic devices that are the critical components in
many industrial applications such as sensors for com-
bustion control and fiber optic telecommunications.
Devices can be fabricated to emit narrow bandwidth
wavelengths in the red and near infrared (NIR) regions
of the electromagnetic spectrum where molecules of
interest to the pharmaceutical industry such as oxy-
gen and moisture absorb light. In addition, diode la-
sers are well suited to frequency modulation signal
processing techniques that increase detection sensi-
tivity and compensate for the relatively weak absorp-
tion strengths of near infrared overtone and combina-
tion transitions. These device characteristics make
diode laser based measurement systems ideal for
monitoring and controlling the gas concentration and
pressure of common atmospheric molecules, such as
oxygen and moisture, during pharmaceutical manu-
facturing of sterile products.
Pharmaceutical applications where trace gas levels are
monitored in small volume parenteral containers re-
quire the use of a high sensitivity laser absorption
technique such as frequency modulation spectrosco-
py (FMS). This technique was developed in academic
and industrial laboratories in the 1980’s and 1990’s.
Systems for rapid non-destructive headspace analysis,
based on modulated diode laser spectroscopy, were
first introduced to the pharmaceutical industry in
2000 and are now routinely used in product develop-
ment, process development and commercial manu-
facturing.
1 2
LIGHTHOUSEThe Science of Pharmaceutical Manufacturing
Laser diode
Container(Tubing, Molded, Clear, Amber)
Detector
Figure 1. Overview of laser-based headspace measurement method
Headspace Inspection Systems
Diode laser based systems can be configured in a vari-
ety of ways to monitor and control processes and/or
inspect individual containers for headspace oxygen,
moisture or vacuum. The two basic configurations in-
clude bench-top Systems for use off- or at-line, and fully
automated Systems for 100% monitoring, control and
inspection
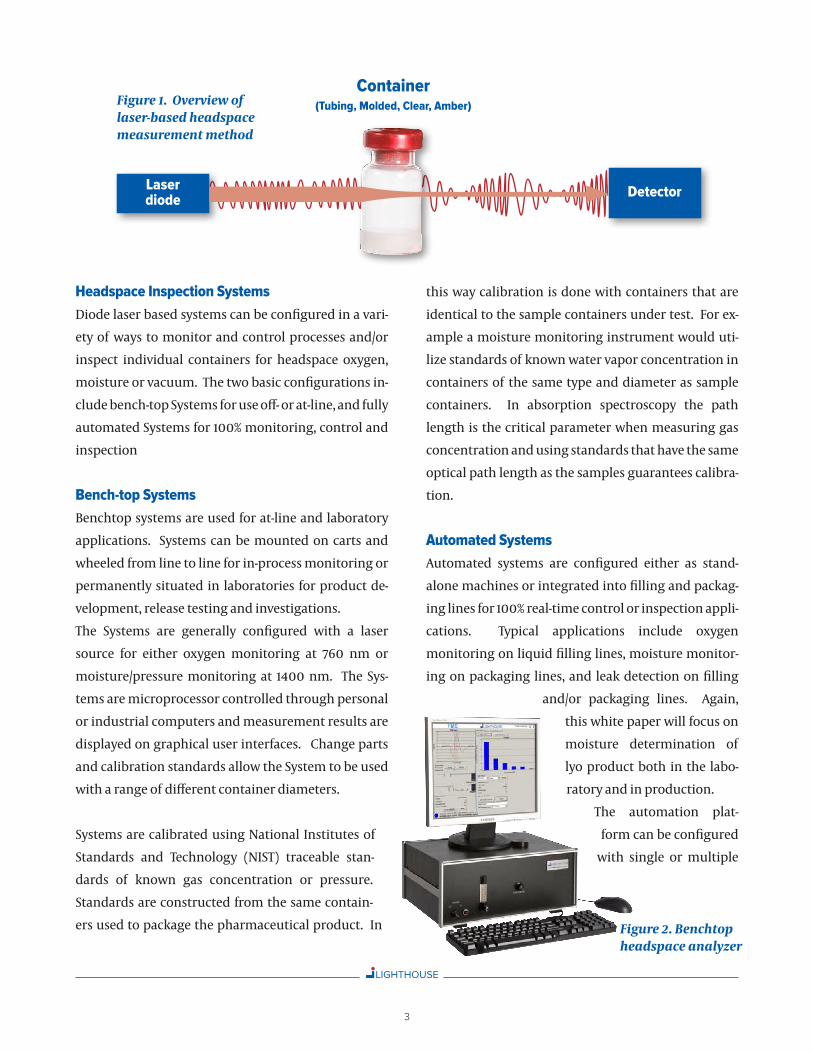
Bench-top Systems
Benchtop systems are used for at-line and laboratory
applications. Systems can be mounted on carts and
wheeled from line to line for in-process monitoring or
permanently situated in laboratories for product de-
velopment, release testing and investigations.
The Systems are generally configured with a laser
source for either oxygen monitoring at 760 nm or
moisture/pressure monitoring at 1400 nm. The Sys-
tems are microprocessor controlled through personal
or industrial computers and measurement results are
displayed on graphical user interfaces. Change parts
and calibration standards allow the System to be used
with a range of different container diameters.
Systems are calibrated using National Institutes of
Standards and Technology (NIST) traceable stan-
dards of known gas concentration or pressure.
Standards are constructed from the same contain-
ers used to package the pharmaceutical product. In
this way calibration is done with containers that are
identical to the sample containers under test. For ex-
ample a moisture monitoring instrument would uti-
lize standards of known water vapor concentration in
containers of the same type and diameter as sample
containers. In absorption spectroscopy the path
length is the critical parameter when measuring gas
concentration and using standards that have the same
optical path length as the samples guarantees calibra-
tion.
Automated Systems
Automated systems are configured either as stand-
alone machines or integrated into filling and packag-
ing lines for 100% real-time control or inspection appli-
cations. Typical applications include oxygen
monitoring on liquid filling lines, moisture monitor-
ing on packaging lines, and leak detection on filling
and/or packaging lines. Again,
this white paper will focus on
moisture determination of
lyo product both in the labo-
ratory and in production.
The automation plat-
form can be configured
with single or multiple
Figure 2. Benchtop headspace analyzer
LIGHTHOUSEThe Science of Pharmaceutical Manufacturing
3

measurement heads to allow for oxygen monitoring
and/or simultaneous moisture/pressure monitoring.
The vial handling system (conveyors, motors, pneu-
matics, etc.) is plc controlled and the laser measure-
ment systems are microprocessor controlled. Machine
change parts (rails and starwheels) and calibration
standards are customized for each different container
diameter and typically 20 minutes are required for a
no-tool change over between vial sizes.
Calibration is performed using National Institutes of
Standards and Technology (NIST) traceable standards
of known gas concentration or pressure. In automated
systems these calibration vials can be permanently
fixed on the main starwheel and used to automatically
calibrate the system during use.
Correlation of Headspace Moisture to Cake Moisture and Product StabilityCorrelation to cake moisture as measured by Karl
Fischer titration
As described in previous sections, headspace mois-
ture is measured by shining laser light through the
vial headspace, tuning the laser to an absorption
wavelength of the water molecule, and analyzing the
absorption signal to determine the headspace water
vapor pressure. The vial headspace water vapor pres-
sure can determine the moisture content of a lyo-
philized cake by performing a correlation between
FMS and Karl Fischer using a set of samples with mois-
ture ranging from below the target moisture level to
150% above the specification.
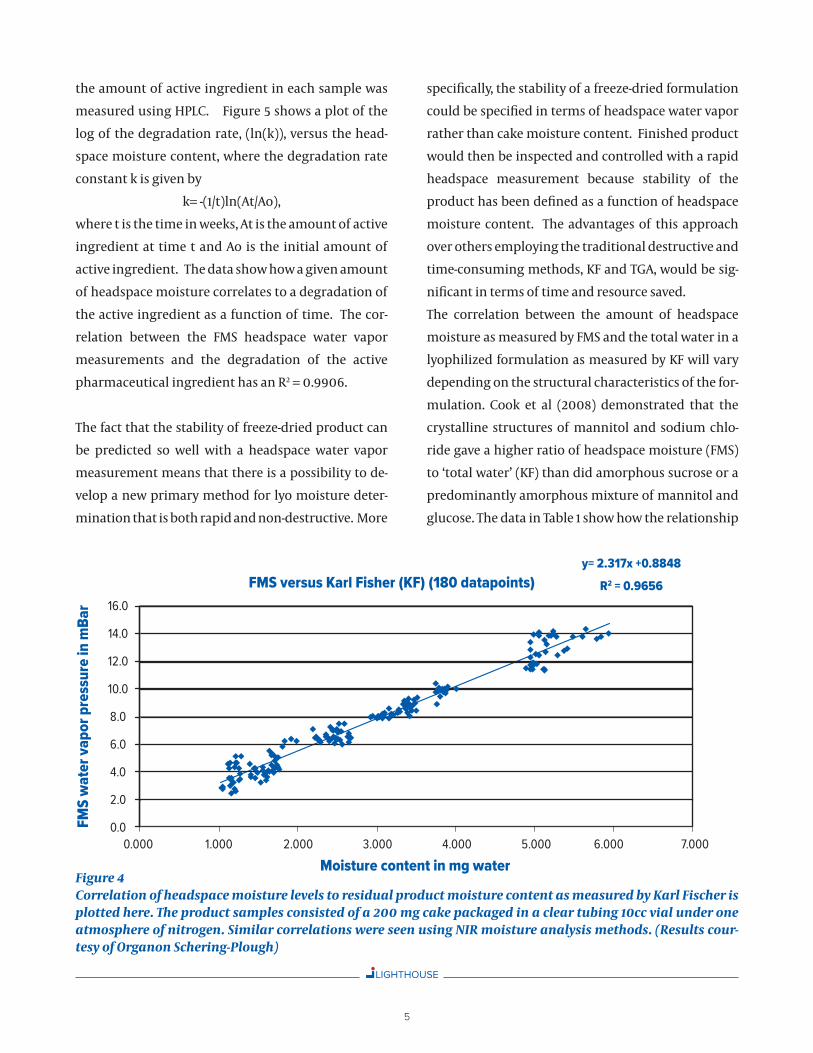
The data (Peeters, 2006) presented in Figure 4 shows
this correlation between the headspace moisture as
measured by FMS and the total moisture content as
measured by KF for a set of lyophilized samples of a
biological pharmaceutical product with a range of
moisture from 0.5% by weight to 3% by weight. The
samples were prepared with a range of moistures by
drying five sets of samples to five different end points.
Vial headspace moisture was then measured using
the FMS method and total product moisture content
was then destructively measured using KF. The sam-
ples measuring 0.5% moisture by weight through KF
measured approximately 3 mbar of headspace mois-
ture and the vials measuring 3% moisture by weight
correlated to approximately 13 mbar of headspace
moisture. The plot in Figure 4 shows 180 data points
with a linear correlation between the two methods of
R2 = 0.9656.
Correlation to degradation of the active
pharmaceutical ingredient
In addition to the moisture correlation between FMS
and KF, there is also a direct correlation between the
headspace moisture and the amount of active ingre-
dient as measured by high performance liquid chro-
matography (HPLC) (Peeters 2006). Samples from the
same set, with amounts of moisture in the cake/head-
space ranging from 0.5%/3mbar to 3%/13mbar, were
stored at 60oC for 12 weeks. At the end of twelve weeks
Figure 3. Automated headspace inspecion machine
LIGHTHOUSEThe Science of Pharmaceutical Manufacturing
4
LIGHTHOUSEThe Science of Pharmaceutical Manufacturing
the amount of active ingredient in each sample was
measured using HPLC. Figure 5 shows a plot of the
log of the degradation rate, (ln(k)), versus the head-
space moisture content, where the degradation rate
constant k is given by
k= -(1/t)ln(At/Ao),
where t is the time in weeks, At is the amount of active
ingredient at time t and Ao is the initial amount of
active ingredient. The data show how a given amount
of headspace moisture correlates to a degradation of
the active ingredient as a function of time. The cor-
relation between the FMS headspace water vapor
measurements and the degradation of the active
pharmaceutical ingredient has an R2 = 0.9906.
The fact that the stability of freeze-dried product can
be predicted so well with a headspace water vapor
measurement means that there is a possibility to de-
velop a new primary method for lyo moisture deter-
mination that is both rapid and non-destructive. More
specifically, the stability of a freeze-dried formulation
could be specified in terms of headspace water vapor
rather than cake moisture content. Finished product
would then be inspected and controlled with a rapid
headspace measurement because stability of the
product has been defined as a function of headspace
moisture content. The advantages of this approach
over others employing the traditional destructive and
time-consuming methods, KF and TGA, would be sig-
nificant in terms of time and resource saved.
The correlation between the amount of headspace
moisture as measured by FMS and the total water in a
lyophilized formulation as measured by KF will vary
depending on the structural characteristics of the for-
mulation. Cook et al (2008) demonstrated that the
crystalline structures of mannitol and sodium chlo-
ride gave a higher ratio of headspace moisture (FMS)
to ‘total water’ (KF) than did amorphous sucrose or a
predominantly amorphous mixture of mannitol and
glucose. The data in Table 1 show how the relationship
Figure 4 Correlation of headspace moisture levels to residual product moisture content as measured by Karl Fischer is plotted here. The product samples consisted of a 200 mg cake packaged in a clear tubing 10cc vial under one atmosphere of nitrogen. Similar correlations were seen using NIR moisture analysis methods. (Results cour-tesy of Organon Schering-Plough)
FMS
wat
er v
apo
r p
ress
ure
in m
Bar
0.000 1.000 2.000 3.000 4.000 5.000 6.000 7.000
0.0
2.0
4.0
6.0
8.0
10.0
12.0
14.0
16.0
FMS versus Karl Fisher (KF) (180 datapoints)
Moisture content in mg water
y= 2.317x +0.8848
R2 = 0.9656
5

LIGHTHOUSEThe Science of Pharmaceutical Manufacturing
varies between total water by percentage weight in
the freeze dried cake and the amount of moisture in
the headspace above the cake as a function of the cake
material. Row 3 of the table shows the ratio of head-
space moisture as measured by FMS to total water as
measured by KF. The ratios show roughly the vapor
pressure of water above the cake for given KF moisture
values for these excipient formulations resulting from
the cycle and processing conditions employed.
The rapid and non-destructive nature of the FMS meth-
od makes it an ideal tool to characterize lyophilization
cycle efficiency and freeze dryer performance across
shelves, between shelves and as a function of drying
cycle parameters. The method is also suitable for per-
forming 100% moisture inspection of finished product
and monitoring moisture content of individual vials
over the shelf-life. The following sections describe
some practical implementations of the method.
Industry Case Study
In the case study described here, two batches of freeze
dried product were manufactured using two different
lyophilization cycles. The first batch was manufac-
tured with an initially defined lyophilization cycle.
The second batch of product was manufactured with
an optimized version of the initial lyophilization cycle.
Each batch contained 1600 clear tubing 10cc vials (a to-
tal of 3200 lyophilized samples). At the end of second-
ary drying each vial was stoppered under 800 mbar of
nitrogen. The chamber was vented to atmosphere,
and the vials were removed and crimped.
Industry case study results
The headspace moisture in all samples from each
batch was measured using the FMS laser absorption
method described in this white paper. Results of the
Sucrose 4% Mannitol 2% Mannitol 2% NaCl 5% + Glucose 1% Karl Fischer (% w/w) 2.87 3.9 5.04 1.03
FMS Headspace Moisture (Torr) 2.03 3.3 6.32 6.13
FMS:KF Ratio 0.71 0.85 1.25 5.95
Table 1 Comparison of Karl Fischer measurements to headspace moisture measurements for amorphous, crystalline and combination structures.
6
-5.0
-4.0
-3.0
-2.0
-1.0
0.00.0 2.0 4.0
Ln (k) versus FMS water vapor pressure
(At 60ºC)
y = 0.3786x - 5.6590
R2 = 0.9906
Water vapor pressure (mBar)
Ln(k
) (1
/wee
ks)
6.0 8.0 10.0 12.0 14.0 16.0
Figure 5 FMS vs HPLC for a pharmaceutical formulation

LIGHTHOUSEThe Science of Pharmaceutical Manufacturing
headspace moisture analysis of product manufactured
using the initial lyo cycle are shown in Figures 6 & 7.
The results are plotted in two ways. Figure 6 displays
the headspace moisture values of all samples from all
trays plotted from low to high values. This moisture
distribution gives insight into the efficiency of the lyo-
philization cycle as a whole. The high moisture tail in
this distribution indicates a significant portion of
samples did not dry efficiently and contain elevated
levels of water, signifying non-homogenous drying
across the shelves.
Figure 7 displays the headspace moisture value as a
function of tray position. For each tray the average,
standard deviation, maximum and minimum mois-
ture values are reported. It is clear from this graph
and the statistics that the drying efficiency for this lyo
cycle is dependent on location within the freeze dryer.
For example, average headspace moisture values and
the standard deviation across tray 2 were much lower
than samples in tray 4.
7
Hea
dsp
ace
mo
istu
re (
mb
ar)
Headspace moisture distribution from
low to high Initial lyo cycle
Sample number
Figure 6The headspace moisture distribution for all samples in the initial lyo cycle is plot-ted from low to high values. The high moisture tail in this distribution indi-cates a significant portion of samples that have not dried efficiently and contain ele-vated levels of water. Visual inspection verified that some samples in the high moisture tail also had a defective cake ap-pearance. The moisture distribution has a significant slope from low to high values indicating non-homogenous drying.0.0
0 200 400 600 800 1000 1200
2.0
4.0
0.5
2.5
4.5
1.0
3.0
5.0
1.5
3.5
5.5
6.0
800 1000 1200
Avg Moisture2.28 mbarStdev 0.40Min 1.60Max 3.63
Avg Moisture2.34 mbarStdev 0.49Min 1.47Max 4.88
isturer1
.444
Tray 5Tray 4
Hea
dsp
ace
mo
istu
re (
mb
ar)
Sample number
Headspace moisture as a function of tray
position Initial lyo cycle
0 200 400 6000.00.51.01.52.02.53.03.54.04.55.05.56.06.57.07.58.08.59.0
Avg Mo2.19 mbaStdev 0.4Min 1Max 3.4
Avg Moisture1.90 mbarStdev 0.38Min 1.16Max 3.17
Tray 3Tray 2Avg Moisture2.14 mbarStdev 0.44Min 1.39Max 3.96
Tray 1
Figure 7 Headspace moisture values as a function of tray position are plotted for samples from the initial lyo cycle. It is clear that the drying efficiency for this lyo cycle depends on location within the freeze dryer. For example, average headspace moisture values and standard deviations across the tray show that samples in Tray 2 dried more efficiently than samples in Tray 4.

LIGHTHOUSEThe Science of Pharmaceutical Manufacturing
The lyophlization cycle was modified and a second set
of 1600 vials was produced.
Results of the headspace moisture analysis on product
manufactured using the modified lyo cycle are shown
in Figures 8 & 9. The overall headspace moisture values
are lower indicating dryer product on average. Head-
space moisture as a function of tray position (Figure 9)
shows more consistent drying across the freeze dryer
shelf. The overall moisture distribution plotted in Fig-
ure 8 clearly shows that the modified freeze drying cy-
cle has produced more consistent, homogenous and
dryer product. This distribution is now much flatter
than the moisture distribution in Figure 6. However,
there is still a small high moisture tail indicating that a
number of samples have not dried efficiently during
the lyophilization cycle.
The high headspace moisture samples produced in
each cycle offer some interesting insight. The sample
with the highest moisture content in the first cycle
(Figure 6) was in tray 4 and had a moisture value of 4.88
mbar. In the second cycle where average moisture val-
ues dropped by 44% compared to the first cycle, the
sample with the highest moisture content (Figure 8)
was in tray 6 and had a moisture value of 7.96 mbar, a
factor of 1.6 times higher than the highest moisture
sample in the first batch. This seems to indicate that
cycles which appear to be optimized may still need fur-
ther study; for example, the level of exposure to radia-
tive heat can vary depending on vial location and pack-
ing density, while the nucleation of the sample could
be non-uniform leading to a different frozen structure
that may affect the drying time in certain vials, which
may require freezing rate studies. Additionally, the pri-
mary drying cycle temperature may not be based on
the critical temperature of the formulation, which may
lead to the collapse/partial collapse of a sample; there
are a number of reasons for the above observation, of
which only a few are mentioned here. Only 100% mois-
8
Hea
dsp
ace
mo
istu
re (
mb
ar)
Headspace moisture as a function of tray
position Optimized lyo cycle
Sample number
0 200 400 600 800 1000 1200 1400 1600 18000.00.51.01.52.02.53.03.54.04.55.05.56.06.57.07.58.08.59.0
Avg Moisture1.34 mbarStdev 0.25Min 0.97Max 3.67
Tray 8
Avg Moisture1.29 mbarStdev 0.24Min 0.99Max 3.53
Tray 7
Avg Moisture1.29 mbarStdev 0.48Min 0.92Max 7.96
Tray 6
Avg Moisture1.21 mbarStdev 0.16Min 0.87Max 1.93
Tray 5
Avg Moisture1.19 mbarStdev 0.18Min 0.89Max 2.27
Tray 4
Avg Moisture1.17 mbarStdev 0.17Min 0.79Max 2.01
Tray 3Tray 2
Avg Moisture1.23 mbarStdev 0.16Min 0.84Max 1.92
Avg Moisture1.24 mbarStdev 0.30Min 0.93Max 4.97
Tray 1
Figure 9Headspace moisture as a function of tray position for the optimized lyo cycle shows more consistent drying across the freeze dryer shelf. Average headspace moisture values are also lower indicating better drying. It should be noted that even for this improved lyo cycle there are a number of vials (6 out of 1898) that have elevated levels of moisture content. The trays containing these ‘wet’ samples can eas-ily be identified from the higher standard deviations mea-sured across those trays (Trays 1, 6, 7, and 8).
Hea
dsp
ace
mo
istu
re (
mb
ar)
Headspace moisture distribution from
low to high Optimized lyo cycle
Sample number0 200 400 600 800 1000 1200 1400 1600 1800
0
1
2
3
4
7
8
Figure8 The headspace moisture distribution plotted from low to high values clearly shows that the optimized freeze drying cycle has produced more consistent, ho-mogenous drying. This distribution is now much flatter than the moisture distribution of the initial lyo cycle.

LIGHTHOUSEThe Science of Pharmaceutical Manufacturing
ture inspection of the finished product samples could
find these high moisture samples and keep them from
entering the market. Even in the apparently optimized
lyophilization cycle there were still a significant num-
ber of vials (6 out of 1898) that have moisture content
that is a factor of x2 or more above the average. The
potency of these out-of-specification product samples
will certainly degrade over the product shelf-life.
Industry case study conclusions
Headspace gas analysis can characterize freeze drying
cycles and provide insight to freeze dryer dependent
drying effects. The technique can also provide 100% in-
spection capabilities for identifying out of specifica-
tion product. The total time for the moisture analysis
of the two batches described above (~3200 samples)
was approximately nine hours using a manual bench-
top system. Automated systems could inspect this
number of vials in minutes. The results of this indus-
try case study demonstrate that laser-based headspace
moisture analysis has application to lyo cycle develop-
ment, characterization of freeze dryer performance,
and quality control of finished lyo product.
Moisture mapping in a freeze dryer
Regulatory authorities require proof that lyophilisa-
tion cycles have been developed logically and demon-
strate uniformity. One measure of uniformity can be
consistency of residual water content throughout a
batch. In primary drying heat transfer is affected by
gaseous convection and conduction as well as the de-
gree of shelf contact and evenness of heat applied.
Therefore cycle length can be affected by vial location,
degree of vial/(tray)/shelf contact, radiative heating,
packing density, product formulation and the cycle
conditions themselves.
Once a KF/FMS correlation is established for the prod-
uct in question the moisture variation can be mapped
for an entire shelf. The correlation between KF and FMS
headspace water vapor measurements for the 4% freeze
dried sucrose was R2 = 0.9894. The following graphs in
figures 10 & 11 show a headspace moisture map for an
entire shelf of vials of 4% sucrose, which were pro-
cessed using the same freeze drying cycle in a small
research scale freeze dryer. However, Figure 10 shows
data for vials contained in a steel bottomed tray and
Figure 11 shows data for vials that were in direct con-
tact with the freeze dryer shelf.
It can be clearly seen in Figure 10 that partial vapour
pressure values are relatively uniform at the far left
and right of the graph (front and back rows of the
tray), whereas for the centre vials which represent vials
closer to the middle of the tray, the partial vapour pres-
Colour key 0.4-0.9 1.0-1.6 1.6-1.9 2.0-3.2
0.8 0.7 0.5 0.5 0.7 0.5 0.5 0.9 0.7 0.8 0.7 0.7 0.9 0.7 0.8 0.8 0.6 0.8 0.5 0.7 0.7 1.1 0.7
0.5 0.5 0.6 0.5 0.7 0.5 0.5 0.8 0.7 1.2 0.8 1.4 0.8 1.1 0.8 1.1 1.0 1.0 0.7 0.7 0.6 0.6 0.6
0.4 0.5 0.9 0.9 0.7 1.2 0.9 1.2 1.3 1.3 1.9 1.5 1.3 1.5 1.5 1.8 1.2 1.4 1.1 1.2 0.7 0.7 0.7
0.6 0.7 0.6 0.9 0.6 0.9 1.0 1.2 1.2 1.4 1.3 1.7 1.6 2.2 1.5 1.7 1.7 1.6 1.8 1.0 0.9 0.8 0.6
0.6 0.5 1.2 0.9 0.8 1.1 1.3 1.2 1.6 1.6 1.3 1.6 2.1 2.0 2.1 2.0 2.1 1.5 1.4 1.3 0.8 0.8 0.6
0.4 0.6 0.6 0.6 0.7 1.1 1.2 2.3 1.6 1.7 1.4 1.7 1.9 2.5 1.4 2.0 2.2 3.2 1.4 1.2 1.2 0.6 1.0
0.9 0.4 1.1 0.8 0.7 0.8 1.0 1.3 1.4 1.5 1.9 1.6 2.6 1.8 2.1 1.7 2.1 1.5 1.6 0.9 0.9 0.5 0.7
0.5 0.5 0.5 0.9 1.0 0.6 0.9 0.9 1.1 1.1 2.6 1.5 1.6 1.6 1.6 1.4 1.6 1.8 1.3 1.0 0.7 0.8 0.7
0.9 0.8 0.6 0.4 0.6 0.6 0.9 0.7 1.2 1.2 1.1 1.0 1.2 1.4 1.5 1.1 1.3 0.8 1.2 0.7 0.9 0.6 0.7
0.6 0.7 0.7 0.6 0.8 0.5 0.8 1.1 0.7 0.9 0.9 0.6 1.0 0.7 0.9 0.7 1.2 0.6 0.9 0.9 1.2 0.9 0.9
0.5 0.5 1.2 0.9 0.5 0.6 0.9 0.8 0.6 1.1 0.8 0.6
Colour key 0.1-0.4 0.5-0.6 0.7-1.0
0.6 0.7 0.5 0.4 0.5 0.5 0.5 0.5 0.7 0.4 0.4 0.7 0.2 0.5 0.4 0.8 0.5 0.6 0.3 0.5 0.8 0.8
0.4 0.2 0.3 0.4 0.7 0.3 0.7 0.4 0.4 0.3 0.6 0.4 0.2 0.6 0.6 0.4 0.6 0.6 0.6 0.3 0.5 0.4
0.4 0.5 0.4 0.7 0.7 0.4 0.6 0.5 0.5 0.5 0.2 0.4 0.3 0.7 0.5 0.4 0.4 0.8 0.7 0.5 0.4 0.5
0.6 0.5 0.3 0.5 0.4 0.5 0.3 0.5 0.4 0.3 0.5 0.6 0.5 0.4 0.4 0.4 0.6 0.4 0.6 0.5 0.6 1.0
0.5 0.4 0.6 0.3 0.4 0.3 0.5 0.6 0.3 0.4 0.2 0.6 0.4 0.7 0.5 0.4 0.3 0.3 0.4 0.4 0.5 0.6
0.7 0.7 0.3 0.5 0.7 0.5 0.4 0.5 0.4 0.6 0.4 0.3 0.5 0.3 0.5 0.5 0.4 0.3 0.5 0.3 0.6 0.4
0.4 0.5 0.4 0.6 0.4 0.7 0.7 0.3 0.7 0.4 0.4 0.7 0.8 0.5 0.1 0.6 0.6 0.6 0.3 0.6 0.4 0.7
0.6 0.3 0.3 0.5 0.6 0.3 0.5 0.7 0.5 0.6 0.3 0.5 0.8 0.4 0.4 0.8 0.4 0.4 0.5 0.4 0.8 0.4
0.5 0.5 0.3 0.2 0.4 0.3 0.4 0.4 0.4 0.5 0.4 0.5 0.4 0.5 0.8 0.4 0.2 0.5 0.3 0.6 0.8 0.6
0.6 0.6 0.4 0.4 0.5 0.4 0.5 0.5 0.5 0.6 0.3 0.4 0.4 0.7 0.5 0.7 0.3 0.8 0.5 0.5 0.6 0.4
0.7 0.8 0.7 0.4 0.4 0.5 0.8 0.5 0.6 0.8 0.4
Figure 10 – Moisture map for samples with a steel bottomed tray (units given in torr)
9

LIGHTHOUSEThe Science of Pharmaceutical Manufacturing
sures are much higher and less uniform. This moisture
variation may be attributable to a reduced level of ra-
diative heat that the central vials can experience, as a
result of which, the shelf contact plays a more signifi-
cant role. This is reflected by the fact that the central
vials in the middle rows furthest from the edge exhibit
the highest moisture values, with the highest value of
3.2 torr corresponding to 4% water w/w by KF.
In Figure 11, the partial vapour pressures are much
more uniform and the absolute values lower as the vi-
als were in direct shelf contact. In addition to this, the
sample vials would have been less reliant on radiative
heat input due to more efficient shelf heat transfer
from direct contact. Based on the KF/FMS correlation
the lowest value of 0.2 torr corresponds to 1% water
w/w by KF and the highest value of 1.0 torr equates to
1.8% water w/w by KF.
The above is just one example of the type of informa-
tion that can be yielded from moisture mapping.
There are many factors involved in order to develop an
optimized cycle in order to achieve uniform drying,
not all of which can be covered here. Factors such as
primary and secondary drying temperature and time,
thermal properties of the material, container used,
loading conditions, freeze dryer capacity all play an
important role.
ConclusionsRapid non-destructive headspace moisture analysis
has been enabled by FMS, a high-sensitivity laser ab-
sorption technique. The ability to rapidly and non-de-
structively determine the water vapor content in
freeze-dried vials has opened up the possibility for new
practical applications in lyo product moisture deter-
mination, lyo cycle development, and moisture map-
ping of freeze dryers. From a scientific point-of-view,
there are a number of interesting problems involved
in understanding the nature of the water present in
lyophilized products (Cook et al, 2008). Using head-
space moisture analysis as a tool while building a thor-
ough understanding of the excipients, the various pro-
cess conditions, temperature, storage, and stopper
properties, may enable a deeper understanding of the
location and dynamics of water present in lyophilized
cakes. The current industry implementations de-
scribed in this white paper demonstrate that the tech-
nique already provides practical insight into the lyo-
philization process and can be used to control the
quality of finished product.
References
Cook, I., Ward, K. and Duncan, D. (2008) “Freeze dried cakes
–Where is the water?,” Conference on Freeze Drying of Pharma-
ceuticals and Biologicals Breckenridge, Colorado August 7-8,
Peeters, M., (2006) “Results FMS vs KF Analysis,” Lighthouse
Instruments European User Symposium June.
Colour key 0.4-0.9 1.0-1.6 1.6-1.9 2.0-3.2
0.8 0.7 0.5 0.5 0.7 0.5 0.5 0.9 0.7 0.8 0.7 0.7 0.9 0.7 0.8 0.8 0.6 0.8 0.5 0.7 0.7 1.1 0.7
0.5 0.5 0.6 0.5 0.7 0.5 0.5 0.8 0.7 1.2 0.8 1.4 0.8 1.1 0.8 1.1 1.0 1.0 0.7 0.7 0.6 0.6 0.6
0.4 0.5 0.9 0.9 0.7 1.2 0.9 1.2 1.3 1.3 1.9 1.5 1.3 1.5 1.5 1.8 1.2 1.4 1.1 1.2 0.7 0.7 0.7
0.6 0.7 0.6 0.9 0.6 0.9 1.0 1.2 1.2 1.4 1.3 1.7 1.6 2.2 1.5 1.7 1.7 1.6 1.8 1.0 0.9 0.8 0.6
0.6 0.5 1.2 0.9 0.8 1.1 1.3 1.2 1.6 1.6 1.3 1.6 2.1 2.0 2.1 2.0 2.1 1.5 1.4 1.3 0.8 0.8 0.6
0.4 0.6 0.6 0.6 0.7 1.1 1.2 2.3 1.6 1.7 1.4 1.7 1.9 2.5 1.4 2.0 2.2 3.2 1.4 1.2 1.2 0.6 1.0
0.9 0.4 1.1 0.8 0.7 0.8 1.0 1.3 1.4 1.5 1.9 1.6 2.6 1.8 2.1 1.7 2.1 1.5 1.6 0.9 0.9 0.5 0.7
0.5 0.5 0.5 0.9 1.0 0.6 0.9 0.9 1.1 1.1 2.6 1.5 1.6 1.6 1.6 1.4 1.6 1.8 1.3 1.0 0.7 0.8 0.7
0.9 0.8 0.6 0.4 0.6 0.6 0.9 0.7 1.2 1.2 1.1 1.0 1.2 1.4 1.5 1.1 1.3 0.8 1.2 0.7 0.9 0.6 0.7
0.6 0.7 0.7 0.6 0.8 0.5 0.8 1.1 0.7 0.9 0.9 0.6 1.0 0.7 0.9 0.7 1.2 0.6 0.9 0.9 1.2 0.9 0.9
0.5 0.5 1.2 0.9 0.5 0.6 0.9 0.8 0.6 1.1 0.8 0.6
Colour key 0.1-0.4 0.5-0.6 0.7-1.0
0.6 0.7 0.5 0.4 0.5 0.5 0.5 0.5 0.7 0.4 0.4 0.7 0.2 0.5 0.4 0.8 0.5 0.6 0.3 0.5 0.8 0.8
0.4 0.2 0.3 0.4 0.7 0.3 0.7 0.4 0.4 0.3 0.6 0.4 0.2 0.6 0.6 0.4 0.6 0.6 0.6 0.3 0.5 0.4
0.4 0.5 0.4 0.7 0.7 0.4 0.6 0.5 0.5 0.5 0.2 0.4 0.3 0.7 0.5 0.4 0.4 0.8 0.7 0.5 0.4 0.5
0.6 0.5 0.3 0.5 0.4 0.5 0.3 0.5 0.4 0.3 0.5 0.6 0.5 0.4 0.4 0.4 0.6 0.4 0.6 0.5 0.6 1.0
0.5 0.4 0.6 0.3 0.4 0.3 0.5 0.6 0.3 0.4 0.2 0.6 0.4 0.7 0.5 0.4 0.3 0.3 0.4 0.4 0.5 0.6
0.7 0.7 0.3 0.5 0.7 0.5 0.4 0.5 0.4 0.6 0.4 0.3 0.5 0.3 0.5 0.5 0.4 0.3 0.5 0.3 0.6 0.4
0.4 0.5 0.4 0.6 0.4 0.7 0.7 0.3 0.7 0.4 0.4 0.7 0.8 0.5 0.1 0.6 0.6 0.6 0.3 0.6 0.4 0.7
0.6 0.3 0.3 0.5 0.6 0.3 0.5 0.7 0.5 0.6 0.3 0.5 0.8 0.4 0.4 0.8 0.4 0.4 0.5 0.4 0.8 0.4
0.5 0.5 0.3 0.2 0.4 0.3 0.4 0.4 0.4 0.5 0.4 0.5 0.4 0.5 0.8 0.4 0.2 0.5 0.3 0.6 0.8 0.6
0.6 0.6 0.4 0.4 0.5 0.4 0.5 0.5 0.5 0.6 0.3 0.4 0.4 0.7 0.5 0.7 0.3 0.8 0.5 0.5 0.6 0.4
0.7 0.8 0.7 0.4 0.4 0.5 0.8 0.5 0.6 0.8 0.4
Colour key 0.4-0.9 1.0-1.6 1.6-1.9 2.0-3.2
0.8 0.7 0.5 0.5 0.7 0.5 0.5 0.9 0.7 0.8 0.7 0.7 0.9 0.7 0.8 0.8 0.6 0.8 0.5 0.7 0.7 1.1 0.7
0.5 0.5 0.6 0.5 0.7 0.5 0.5 0.8 0.7 1.2 0.8 1.4 0.8 1.1 0.8 1.1 1.0 1.0 0.7 0.7 0.6 0.6 0.6
0.4 0.5 0.9 0.9 0.7 1.2 0.9 1.2 1.3 1.3 1.9 1.5 1.3 1.5 1.5 1.8 1.2 1.4 1.1 1.2 0.7 0.7 0.7
0.6 0.7 0.6 0.9 0.6 0.9 1.0 1.2 1.2 1.4 1.3 1.7 1.6 2.2 1.5 1.7 1.7 1.6 1.8 1.0 0.9 0.8 0.6
0.6 0.5 1.2 0.9 0.8 1.1 1.3 1.2 1.6 1.6 1.3 1.6 2.1 2.0 2.1 2.0 2.1 1.5 1.4 1.3 0.8 0.8 0.6
0.4 0.6 0.6 0.6 0.7 1.1 1.2 2.3 1.6 1.7 1.4 1.7 1.9 2.5 1.4 2.0 2.2 3.2 1.4 1.2 1.2 0.6 1.0
0.9 0.4 1.1 0.8 0.7 0.8 1.0 1.3 1.4 1.5 1.9 1.6 2.6 1.8 2.1 1.7 2.1 1.5 1.6 0.9 0.9 0.5 0.7
0.5 0.5 0.5 0.9 1.0 0.6 0.9 0.9 1.1 1.1 2.6 1.5 1.6 1.6 1.6 1.4 1.6 1.8 1.3 1.0 0.7 0.8 0.7
0.9 0.8 0.6 0.4 0.6 0.6 0.9 0.7 1.2 1.2 1.1 1.0 1.2 1.4 1.5 1.1 1.3 0.8 1.2 0.7 0.9 0.6 0.7
0.6 0.7 0.7 0.6 0.8 0.5 0.8 1.1 0.7 0.9 0.9 0.6 1.0 0.7 0.9 0.7 1.2 0.6 0.9 0.9 1.2 0.9 0.9
0.5 0.5 1.2 0.9 0.5 0.6 0.9 0.8 0.6 1.1 0.8 0.6
Colour key 0.1-0.4 0.5-0.6 0.7-1.0
0.6 0.7 0.5 0.4 0.5 0.5 0.5 0.5 0.7 0.4 0.4 0.7 0.2 0.5 0.4 0.8 0.5 0.6 0.3 0.5 0.8 0.8
0.4 0.2 0.3 0.4 0.7 0.3 0.7 0.4 0.4 0.3 0.6 0.4 0.2 0.6 0.6 0.4 0.6 0.6 0.6 0.3 0.5 0.4
0.4 0.5 0.4 0.7 0.7 0.4 0.6 0.5 0.5 0.5 0.2 0.4 0.3 0.7 0.5 0.4 0.4 0.8 0.7 0.5 0.4 0.5
0.6 0.5 0.3 0.5 0.4 0.5 0.3 0.5 0.4 0.3 0.5 0.6 0.5 0.4 0.4 0.4 0.6 0.4 0.6 0.5 0.6 1.0
0.5 0.4 0.6 0.3 0.4 0.3 0.5 0.6 0.3 0.4 0.2 0.6 0.4 0.7 0.5 0.4 0.3 0.3 0.4 0.4 0.5 0.6
0.7 0.7 0.3 0.5 0.7 0.5 0.4 0.5 0.4 0.6 0.4 0.3 0.5 0.3 0.5 0.5 0.4 0.3 0.5 0.3 0.6 0.4
0.4 0.5 0.4 0.6 0.4 0.7 0.7 0.3 0.7 0.4 0.4 0.7 0.8 0.5 0.1 0.6 0.6 0.6 0.3 0.6 0.4 0.7
0.6 0.3 0.3 0.5 0.6 0.3 0.5 0.7 0.5 0.6 0.3 0.5 0.8 0.4 0.4 0.8 0.4 0.4 0.5 0.4 0.8 0.4
0.5 0.5 0.3 0.2 0.4 0.3 0.4 0.4 0.4 0.5 0.4 0.5 0.4 0.5 0.8 0.4 0.2 0.5 0.3 0.6 0.8 0.6
0.6 0.6 0.4 0.4 0.5 0.4 0.5 0.5 0.5 0.6 0.3 0.4 0.4 0.7 0.5 0.7 0.3 0.8 0.5 0.5 0.6 0.4
0.7 0.8 0.7 0.4 0.4 0.5 0.8 0.5 0.6 0.8 0.4 Figure 11 – Moisture map for samples with direct shelf contact (units given in torr)
10

LIGHTHOUSEThe Science of Pharmaceutical Manufacturing
North America
LIGHTHOUSE
2030 Avon Court
Charlottesville, VA 22902
+1 434-293-3081 – Main number
+1 434-293-7773 – Fax
www.lighthouseinstruments.com
Europe
LIGHTHOUSE
Dr. Derek Duncan
Biomatrix Building
Kruislaan 406
1098 NX Amsterdam
The Netherlands
+31 6 2017 6502
LIGHTHOUSE
London, UK
Mr. Richard Millett
+44 1435 868284
Japan & China
Japan Machinery Company
Mr. Igor G. Vishtak
Ginza 8-5-6, Chuo-ku
Tokyo, Japan 104-0061
+81-3-3573-5421 – Main number
+81-3-3574-9185 0 Fax
http://www.japanmachinery.com/
english/index.html
About Us
LIGHTHOUSE is the leading manufacturer and provider of optical, non-destructive headspace
inspection systems for in-line, at-line, and R&D applications specific to the pharmaceutical industry.
LIGHTHOUSE developed the non-destructive headspace inspection systems with funding from the
Food and Drug Administration. We have close to 200 laser based systems installed around the world
at some of the world’s leading pharmaceutical, biopharmaceutical and contracting manufacturing
companies including: Amgen, Baxter, Bayer, Boehringer Ingelheim, BMS, DSM, Eli Lilly, Genentech,
GlaxoSmithKline, Helvoet Pharma, Hospira, Johnson & Johnson, Merck, Novartis, Patheon, Pfizer,
Roche, Serum Institute of India, Sankyo, Sanofi-Aventis, Schering-Plough, West Pharmaceutical
Services, and Wyeth.
Contact Us
This white paper was written in collaboration with Biopharma Technology Ltd who are
specialists in freeze drying
http://www.lyophilizationtechnology.com / [email protected]