Embed Size (px)
Citation preview
3DMark05 WHITE PAPER v1.0 Page 1 of 25 September 22nd, 2004
White Paper v1.0
Patric Ojala & Nicklas Renqvist Futuremark Corporation
12930 Saratoga Avenue, Suite B-7
Saratoga, CA 95070. USA
September 22nd, 2004
3DMark05 WHITE PAPER v1.0 Page 2 of 25 September 22nd, 2004
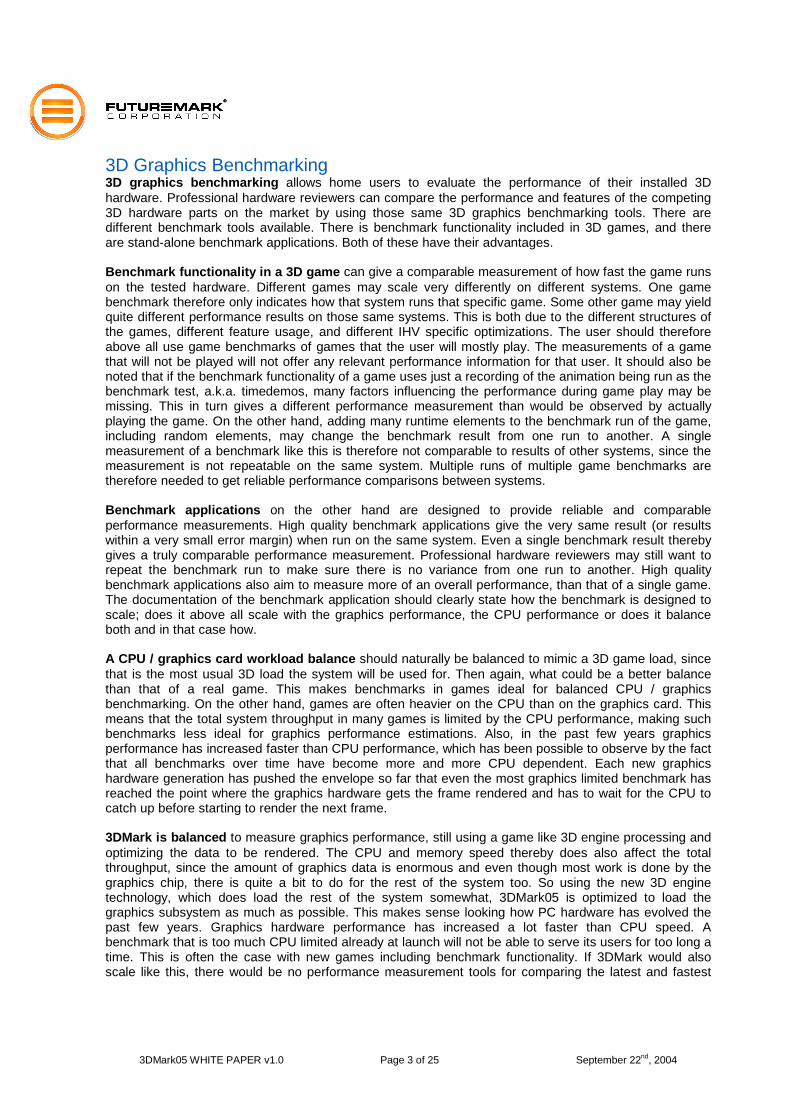
Overview This paper introduces 3DMark®05, the latest in the 3DMark benchmark series built by Futuremark®
Corporation. The name 3DMark has become a standard in 3D graphics benchmarking; since the first version released in 1998 it has grown to be used by virtually all on-line and paper publications. It has proven itself as an impartial and highly accurate tool for benchmarking 3D graphics performance of the latest PC hardware. 3DMark has a very large following worldwide among individual PC owners. More than 10 million benchmark results have been submitted to Futuremark’s Online ResultBrowser database. Over 24 million copies of 3DMark03 alone, the previous version of the series, has been distributed world wide. 3DMark has become a point of great prestige to be the holder of the highest 3DMark score among PC enthusiasts as well as among the graphics hardware vendors. A compelling, easy download and installation, and easy-to-use interface have made 3DMark very popular among game enthusiasts. Futuremark’s latest benchmark, 3DMark05, continues this tradition by providing a state-of-the-art Microsoft® DirectX®
9 3D performance benchmark.
Figure 1: 3DMark05 is Futuremark’s complete DirectX9 Benchmark
3DMark05 is an all new 3DMark version taking the most out of Microsoft’s DirectX 9. The previous version, 3DMark03, did a nice introduction into this level of technology. However 3DMark03 used DirectX 9 specific features in a limited manner, because fully supporting hardware was rare at the time of its launch. In contrast, 3DMark05 requires DirectX 9 hardware with full support for at least Shader Model 2, and takes shader usage to never before seen levels.
3DMark05 WHITE PAPER v1.0 Page 3 of 25 September 22nd, 2004
3D Graphics Benchmarking 3D graphics benchmarking allows home users to evaluate the performance of their installed 3D hardware. Professional hardware reviewers can compare the performance and features of the competing 3D hardware parts on the market by using those same 3D graphics benchmarking tools. There are different benchmark tools available. There is benchmark functionality included in 3D games, and there are stand-alone benchmark applications. Both of these have their advantages. Benchmark functionality in a 3D game can give a comparable measurement of how fast the game runs on the tested hardware. Different games may scale very differently on different systems. One game benchmark therefore only indicates how that system runs that specific game. Some other game may yield quite different performance results on those same systems. This is both due to the different structures of the games, different feature usage, and different IHV specific optimizations. The user should therefore above all use game benchmarks of games that the user will mostly play. The measurements of a game that will not be played will not offer any relevant performance information for that user. It should also be noted that if the benchmark functionality of a game uses just a recording of the animation being run as the benchmark test, a.k.a. timedemos, many factors influencing the performance during game play may be missing. This in turn gives a different performance measurement than would be observed by actually playing the game. On the other hand, adding many runtime elements to the benchmark run of the game, including random elements, may change the benchmark result from one run to another. A single measurement of a benchmark like this is therefore not comparable to results of other systems, since the measurement is not repeatable on the same system. Multiple runs of multiple game benchmarks are therefore needed to get reliable performance comparisons between systems. Benchmark applications on the other hand are designed to provide reliable and comparable performance measurements. High quality benchmark applications give the very same result (or results within a very small error margin) when run on the same system. Even a single benchmark result thereby gives a truly comparable performance measurement. Professional hardware reviewers may still want to repeat the benchmark run to make sure there is no variance from one run to another. High quality benchmark applications also aim to measure more of an overall performance, than that of a single game. The documentation of the benchmark application should clearly state how the benchmark is designed to scale; does it above all scale with the graphics performance, the CPU performance or does it balance both and in that case how. A CPU / graphics card workload balance should naturally be balanced to mimic a 3D game load, since that is the most usual 3D load the system will be used for. Then again, what could be a better balance than that of a real game. This makes benchmarks in games ideal for balanced CPU / graphics benchmarking. On the other hand, games are often heavier on the CPU than on the graphics card. This means that the total system throughput in many games is limited by the CPU performance, making such benchmarks less ideal for graphics performance estimations. Also, in the past few years graphics performance has increased faster than CPU performance, which has been possible to observe by the fact that all benchmarks over time have become more and more CPU dependent. Each new graphics hardware generation has pushed the envelope so far that even the most graphics limited benchmark has reached the point where the graphics hardware gets the frame rendered and has to wait for the CPU to catch up before starting to render the next frame. 3DMark is balanced to measure graphics performance, still using a game like 3D engine processing and optimizing the data to be rendered. The CPU and memory speed thereby does also affect the total throughput, since the amount of graphics data is enormous and even though most work is done by the graphics chip, there is quite a bit to do for the rest of the system too. So using the new 3D engine technology, which does load the rest of the system somewhat, 3DMark05 is optimized to load the graphics subsystem as much as possible. This makes sense looking how PC hardware has evolved the past few years. Graphics hardware performance has increased a lot faster than CPU speed. A benchmark that is too much CPU limited already at launch will not be able to serve its users for too long a time. This is often the case with new games including benchmark functionality. If 3DMark would also scale like this, there would be no performance measurement tools for comparing the latest and fastest
3DMark05 WHITE PAPER v1.0 Page 4 of 25 September 22nd, 2004
graphics hardware. This is why 3DMark05 provides new information that is difficult to get from anywhere else.
3DMark05 Compared to Previous Versions 3DMark99 concentrated on measuring fixed function vertex transformation and lighting, and multitexturing. 3DMark2000 added support for graphics hardware supporting transformation and lighting, and the complexity of the game tests was increased. 3DMark2001 increased the complexity of the fixed function game scenes to tens of thousands polygons per frame on average and also introduced shader technology. The scenes mainly used fixed function vertex and pixel processing, while shaders were used for special effects. There was skinning, morphing and massive amount of animated grass and leaves, all using 1.1 vertex shaders. Game test 4 presented the first higher level material using a 1.1 pixel shader. 3DMark03 concentrated on testing the 1.x and 2.0 shader model. Only one game test, meant for legacy systems, offered fixed function multitexturing, while the other three used pixel shaders for all materials. All vertex processing used vertex shaders, mainly of the 1.x model. The last game test presented the first vertex and pixel shaders of shader model 2, while the majority of the shaders in that test still were of the 1.x model. The scene complexity was raised to several hundred thousand polygons per frame on average. 3DMark05 raises the technology bar and uses exclusively shader model 2 and 3 for all vertex and pixel processing. DirectX 9 also presents shader model 2a, 2b and 3.0. All compatible shaders can be run using any of the shader model 2.x profiles or 3.0. This is enabled throughout 3DMark05 based on our understanding that this is what future games will offer. The scene complexity has been raised to over one million rendered polygons per frame on average.
Shader Model 2 DirectX shader technology was introduced with DirectX 8, which brought shader model 1 (SM1). Shaders are short programs for manipulating vertices and pixels in a Direct3D scene, and these can be efficiently executed on dedicated graphics hardware. There are two types of shaders: vertex shaders and pixel shaders. SM1 brought quite a huge leap forwards from fixed function vertex transformation and lighting to fully programmable vertex shaders, and from fixed function multitexturing to programmable pixel shaders. Just transformation and lighting, and multitexturing, naturally can be done using shaders, but they can do so much more. With the introduction of SM1, it was possible to perform character skinning also on the graphics hardware, while previously the only option was to execute it on the system CPU. On the pixel processing side, the earlier DirectX versions always illuminated everything per vertex and only offered some very limited fixed function per pixel lighting functionality, like environment bump mapping, or DOT3. Pixel shaders made it possible to illuminate all surfaces in the scene per pixel, using custom programmed surface materials. This was a huge step towards more photorealistic rendering. SM1 was still fairly limited. Each shader, especially pixel shader, could only be very short and the operations available were limited. SM1 was extended with pixel shader 1.4, offering more flexibility, but shader usage was still limited. The shaders themselves had to be written in the so-called shader language, which closely resembles CPU assembly code. It is very low level, hard to learn for a less experienced programmer, and is far from modern elegant and structured programming languages. Most games utilizing SM1 therefore do traditional multitexturing on most surfaces, and use pixel shaders only for special effects on some surfaces. The most common pixel shader use in games still today is probably for water surfaces. Shader model 2 (SM2) extended shaders greatly, offering both longer and more complex shaders and more operations to choose from. SM2 additionally added the ability to perform the calculations using floating point values. This is significant, since the physical lighting calculations of the real world are all floating point dominated. SM1 fixed point lighting calculations were therefore only crude approximations, offering a lower level of photorealism. DirectX9 and SM2 also brought the higher level shader language (HLSL). Instead of writing shaders in the assembly type shader language, developers could now use a
3DMark05 WHITE PAPER v1.0 Page 5 of 25 September 22nd, 2004
higher level language somewhat like C-code. DirectX provides an efficient compiler that compiles HLSL to the low level shader language - but that’s not all. DirectX includes a number of shader profiles dedicated to different hardware architectures, usually also extending SM2. The developer can now write one HLSL shader and DirectX compiles it to optimal shader language for the installed hardware. The available profiles in the DirectX 9 Summer Update 2004, also called DirectX 9c are: the basic 2.0, 2a, 2b and 3.0 (or also expressed as 2_0, 2_a, 2_b and 3_0). The 3.0 profile is actually an all new shader model offering quite a large extension to SM2, including program control in the shaders (like ‘for loops’ in C-code, for example). It can still be handled in the code as a SM2 profile. When enabled, all shaders are compiled to shader model 3 for supporting hardware. 3DMark05 uses SM2 extensively, and uses by default the highest compilation profile supported by the hardware, including 3.0. The profile can also be manually selected for interesting performance comparisons between the different profiles.
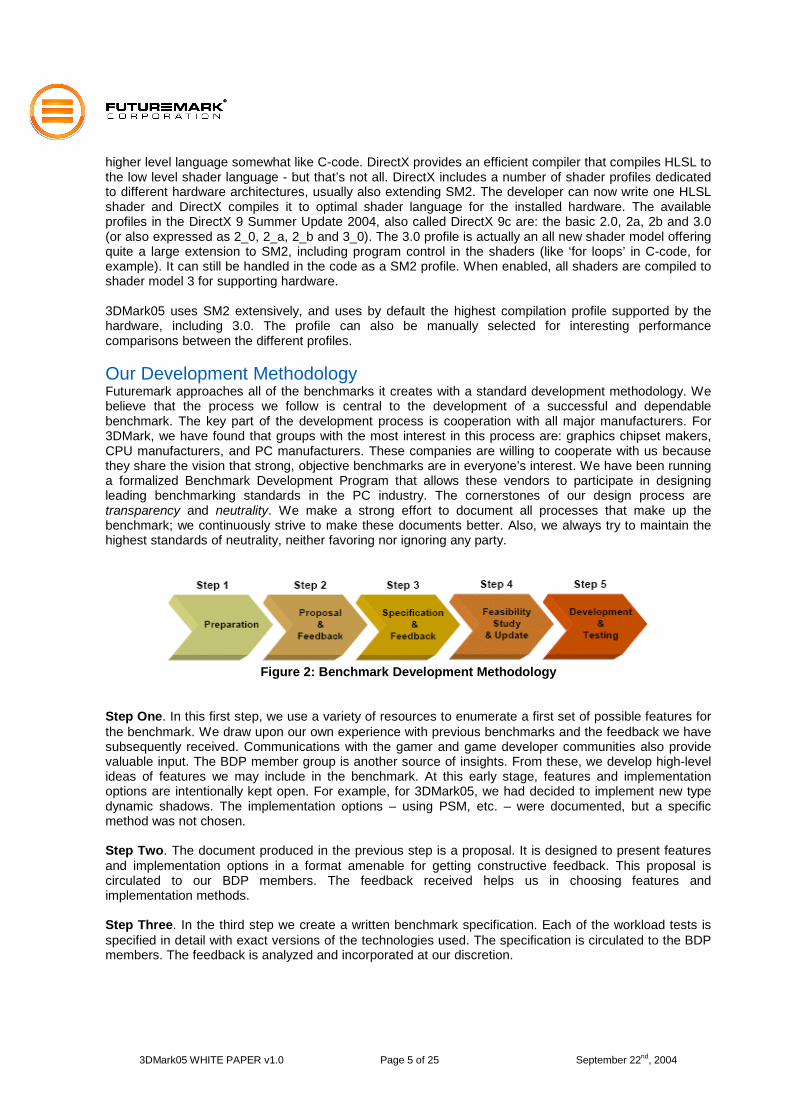
Our Development Methodology Futuremark approaches all of the benchmarks it creates with a standard development methodology. We believe that the process we follow is central to the development of a successful and dependable benchmark. The key part of the development process is cooperation with all major manufacturers. For 3DMark, we have found that groups with the most interest in this process are: graphics chipset makers, CPU manufacturers, and PC manufacturers. These companies are willing to cooperate with us because they share the vision that strong, objective benchmarks are in everyone’s interest. We have been running a formalized Benchmark Development Program that allows these vendors to participate in designing leading benchmarking standards in the PC industry. The cornerstones of our design process are transparency and neutrality. We make a strong effort to document all processes that make up the benchmark; we continuously strive to make these documents better. Also, we always try to maintain the highest standards of neutrality, neither favoring nor ignoring any party.
Figure 2: Benchmark Development Methodology
Step One. In this first step, we use a variety of resources to enumerate a first set of possible features for the benchmark. We draw upon our own experience with previous benchmarks and the feedback we have subsequently received. Communications with the gamer and game developer communities also provide valuable input. The BDP member group is another source of insights. From these, we develop high-level ideas of features we may include in the benchmark. At this early stage, features and implementation options are intentionally kept open. For example, for 3DMark05, we had decided to implement new type dynamic shadows. The implementation options – using PSM, etc. – were documented, but a specific method was not chosen. Step Two. The document produced in the previous step is a proposal. It is designed to present features and implementation options in a format amenable for getting constructive feedback. This proposal is circulated to our BDP members. The feedback received helps us in choosing features and implementation methods. Step Three. In the third step we create a written benchmark specification. Each of the workload tests is specified in detail with exact versions of the technologies used. The specification is circulated to the BDP members. The feedback is analyzed and incorporated at our discretion.
3DMark05 WHITE PAPER v1.0 Page 6 of 25 September 22nd, 2004
Step Four. In the next step we implement prototype code to see if the available technology will support our plans. We may discover the certain tests are not possible, or may be surprised to discover that more can be achieved. The results are incorporated into the specification and again circulated. Step Five. The fifth step consists of implementing the workloads or tests. Periodic releases are made to the BDP members and their feedback may again be taken into account. For more information and an up-to-date list of participating BDP members, please refer to www.futuremark.com/bdp.
3DMark05 Overview Benchmark Structure. 3DMark05 is a collection of 3D tests. These include a set of three game tests; these are the tests used to calculate the overall 3DMark05 score. The benchmark also includes a set of CPU, feature, image quality, and batch size tests. Each of these tests measures specific 3D-related functionality, but their result is not included in the overall score. They do not fall into the target usage, but are included to allow the user to evaluate these features. The CPU test is a convenient way to measure the performance of the CPU for a 3D rendering workload. The feature tests isolate the performance of some key 3D features. The batch size tests expose a traditional weakness of 3D drivers; executing rendering batches of different sizes. The software also includes a set of image quality tools. These help studying more closely the different benchmark settings improving the rendering quality, and provide a powerful way to ensure integrity of the graphics hardware and drivers. Real-Time Rendering. Each 3DMark05 game test is a real-time rendering of a 3D scenario. It is important to note that these renderings are not merely animations or a set of recorded events; they are designed to function like 3D games work. As with 3D games, all computations are performed in real time. This is a critical part of our philosophy of 3D graphics benchmarking. DirectX. All tests have been compiled and linked with DirectX 9.0c libraries. Every game test and almost all other benchmark tests too require DirectX 9 hardware with support for Pixel Shader 2.0 or higher. 3D Engine. Early versions of 3DMark used the MAX-FX 3D engine. 3DMark03 used a very lightweight DirectX wrapper as more work was transitioned to the API and graphics card with the introduction of the shader technology. The engine only had to load the artwork and the shader language shaders. Game tests 2 and 3 and the “Ragtroll” test used a more complex engine version rendering the dynamic stencil shadows. For 3DMark05, we have an all new rendering engine. This is a more ‘game like’ engine using the CPU for preparing and optimizing the content to be rendered for the graphics hardware. Still, there are only rendering related tasks for the CPU in the Game Tests, no other CPU tasks typical for games. Then again, this is how many benchmarks in games work too. For example, according to id Software, the DOOM 3 benchmark functionality only does rendering tasks on the CPU (http://www.beyond3d.com/interviews/carmack04/). Obviously all physics, AI and other CPU tasks typical for game play are disabled, leaving only 3D rendering tasks for the benchmark, just like 3DMark05 does. The engine in 3DMark05 dynamically builds shaders for each material in HLSL format. These shaders are then runtime compiled to best fit the installed hardware, or the user may manually set which compilation profile to use. A professional hardware reviewer can compare the performance difference using different shader compiler profiles for the same hardware. Handling all materials and shaders, and all other rendering related tasks like the shadow system discussed below, adds quite a bit of work to the CPU and memory. This makes the 3DMark05 engine heavier on the system than the 3DMark03 engine was. 3DMark05 will therefore scale more with the whole system throughput than just with the graphics card performance as 3DMark03 did. The 3DMark05 engine works more like the engines that will be used in future 3D games.
3DMark05 WHITE PAPER v1.0 Page 7 of 25 September 22nd, 2004
Dynamic Shadow Rendering. Ever since 3DMark2001, an essential part of the 3DMark game tests has been the rendering of dynamic shadows. 3DMark2001 used projection shadow maps for dynamic shadow rendering. This is a fairly light method to render shadows and games released lately have used this method a lot, but it has limitations. For example, self shadowing does not work; an object cannot throw a shadow at itself. Also, the shadow is projected on all surfaces behind the object, even on a floor of a room three floors below the light source and the object! 3DMark03 used stencil shadows, which is a very different approach. Here, edges of the object seen from the light source are extruded as polygons away from the light. Objects in that shadow volume are then in the shadow. This technique works well and correctly as a global lighting solution and includes self shadowing. Then again, it is better suited for certain types of scenes and low polygon objects. The selection of the edges to be extruded to become a shadow volume is quite expensive CPU work, the shadow volumes adds polygon load and the shadow volume polygons take up a lot of fill rate, even though they are invisible. 3DMark05 uses a type of depth shadow maps called perspective shadow maps (PSM). The implementation is actually a refinement of what is commonly known as PSM, since these have problems with certain angles of light in the simplest form. The scene is rendered from the direction of the light, as in projection shadow maps, but the depth of each texel in the shadowmap is also stored. This results in a shadow map implementation that has no need for object edge vertex selection, does not add the vertex load with shadow volume polygons and does not add fill load with the invisible but usually large and numerous shadow volume polygons. PSM (or our refined implementation) still offers a global lighting solution that projects shadows correctly, including self shadowing, and is suited for a wide range of different types of 3D scenes and lighting types. Shadows from directional light sources use a 2048x2048 resolution depth map of the format R32F. If the hardware supports depth stencil textures (DST), a D24X8 depth map is used of the same size. The 2K maps are actually used twice: once for rendering the depth of objects closer to the camera and second time for the rest of the scene. Shadows from point light sources use a 512x512x6 cube map of the format R32F as depth map. These depth maps sound enormous, and one would think they take up quite a bit of fill rate. They most certainly do, and 3DMark05 is therefore less sensitive to changes of the screen resolution. Still, in some cases even two 2K maps are not enough. Game test 3 shows one of the most difficult environments for PSM use. The large and rounded rock face far away from the camera is likely to have some surfaces’ normal almost always nearly perpendicular to the light direction. In these places there may be some flickering at the edge of the shadow. This is caused by a worst case projection of the PSM shadows, when there just is not enough resolution in the depth map. So this is not caused by a driver issue, it is just a compromise of implementation between how large depth maps to use and how much shadow artifacts to allow. The depth maps DST or R32F are both sampled using Percentage Closest Filtering (PCF). If the hardware supports DST and hardware accelerated PCF, a single bilinearly filtered sample is taken. The non-DST rendering path uses four point samples. These two implementations produce a bit different rendering, which can be seen in close inspection, by magnifying parts of frames with some shadow artifacts, and comparing these side by side. In theory, the bilinear filtering is of higher quality than point sampling, but in point sampling, the samples are taken from a larger area, and so in some cases point sampling can produce a smoother looking rendering. One could argue that the DST and hardware accelerated PCF implementation vs. the non-DST and point sampling code paths do not produce comparable performance measurements, since the resulting rendering shows slight differences. 3DMark05 was designed with the firm belief that those two are indeed comparable, and in the fact that it is the right way to reflect future 3D game performance. Our study has proved that over a dozen of the biggest game developers are using DST and hardware PCF for dynamic shadow rending in their latest or upcoming titles. So if DST and hardware PCF are supported, they should be used in depth shadow map implementations, because that is what is done also in the latest and future games. However, if the benchmark user wishes to compare exactly identical rendering performance
3DMark05 WHITE PAPER v1.0 Page 8 of 25 September 22nd, 2004
across different architectures, DST can be disabled in the benchmark settings, and the dynamic shadows are then always rendered using R32F depth maps and four point sample PCF. Texture compression. All color maps are DXT 1 compressed, the alpha maps are DXT3 compressed, and all normal maps are DXT 5 compressed.
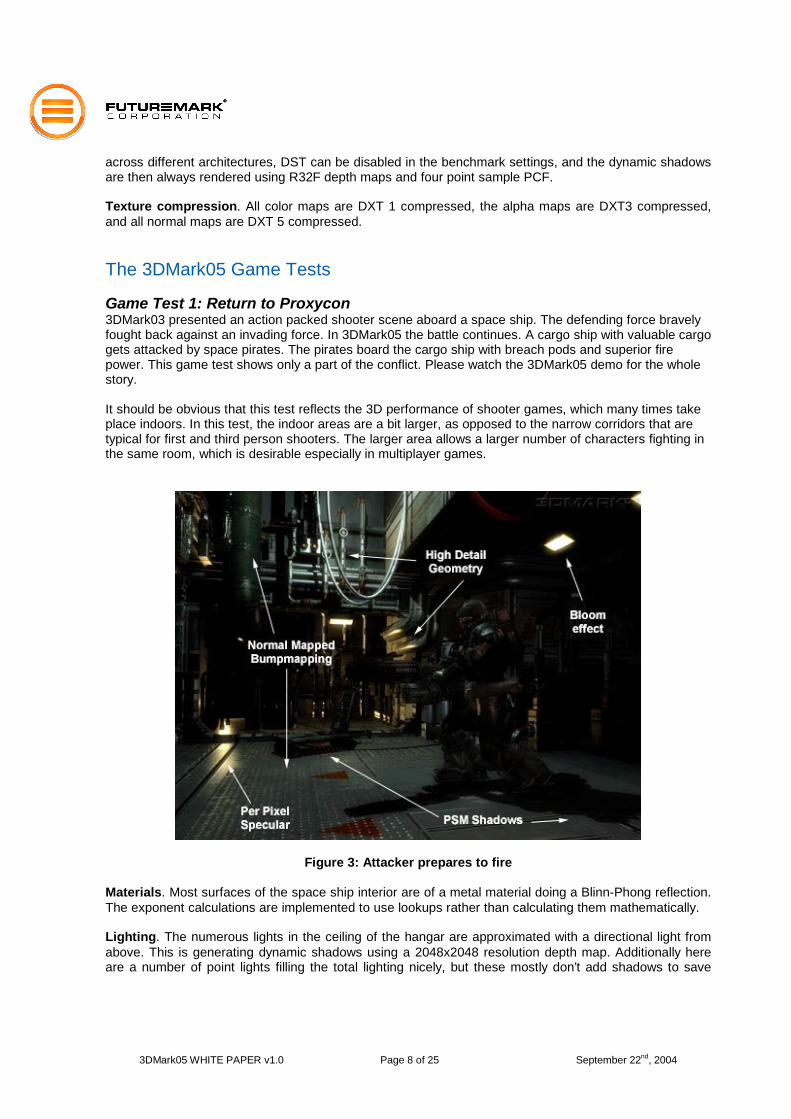
The 3DMark05 Game Tests Game Test 1: Return to Proxycon 3DMark03 presented an action packed shooter scene aboard a space ship. The defending force bravely fought back against an invading force. In 3DMark05 the battle continues. A cargo ship with valuable cargo gets attacked by space pirates. The pirates board the cargo ship with breach pods and superior fire power. This game test shows only a part of the conflict. Please watch the 3DMark05 demo for the whole story. It should be obvious that this test reflects the 3D performance of shooter games, which many times take place indoors. In this test, the indoor areas are a bit larger, as opposed to the narrow corridors that are typical for first and third person shooters. The larger area allows a larger number of characters fighting in the same room, which is desirable especially in multiplayer games.
Figure 3: Attacker prepares to fire Materials. Most surfaces of the space ship interior are of a metal material doing a Blinn-Phong reflection. The exponent calculations are implemented to use lookups rather than calculating them mathematically. Lighting. The numerous lights in the ceiling of the hangar are approximated with a directional light from above. This is generating dynamic shadows using a 2048x2048 resolution depth map. Additionally here are a number of point lights filling the total lighting nicely, but these mostly don’t add shadows to save
3DMark05 WHITE PAPER v1.0 Page 9 of 25 September 22nd, 2004
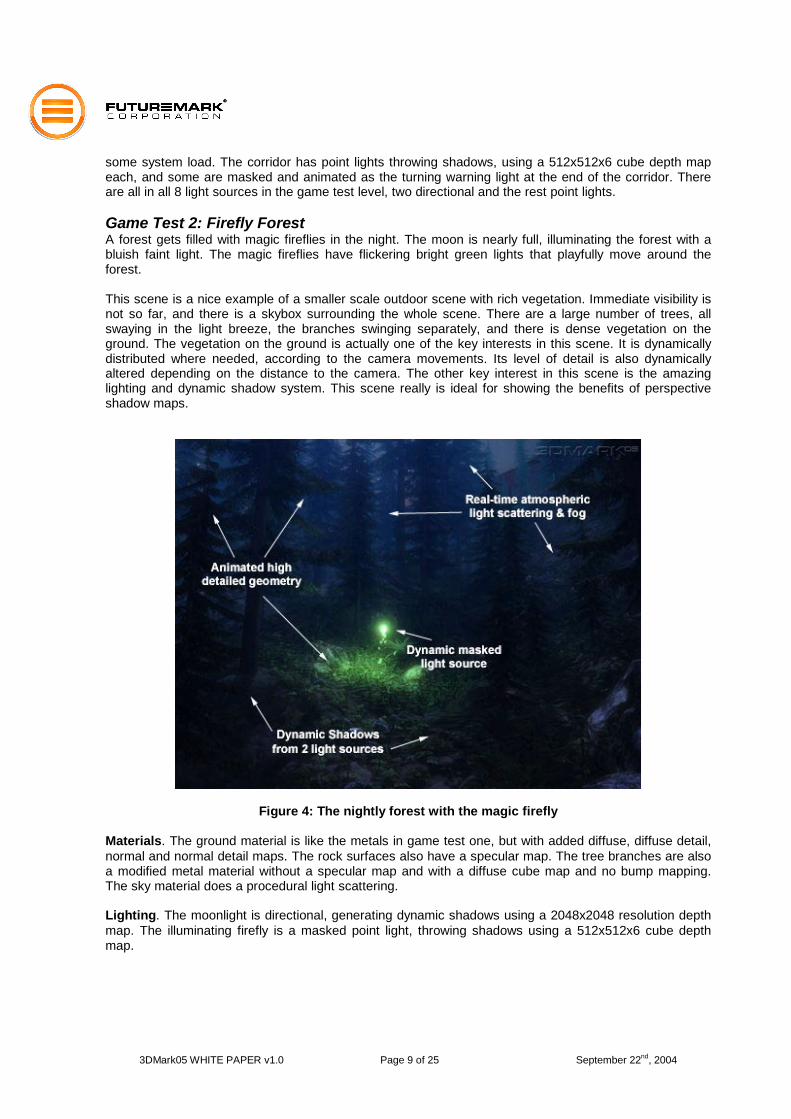
some system load. The corridor has point lights throwing shadows, using a 512x512x6 cube depth map each, and some are masked and animated as the turning warning light at the end of the corridor. There are all in all 8 light sources in the game test level, two directional and the rest point lights. Game Test 2: Firefly Forest A forest gets filled with magic fireflies in the night. The moon is nearly full, illuminating the forest with a bluish faint light. The magic fireflies have flickering bright green lights that playfully move around the forest. This scene is a nice example of a smaller scale outdoor scene with rich vegetation. Immediate visibility is not so far, and there is a skybox surrounding the whole scene. There are a large number of trees, all swaying in the light breeze, the branches swinging separately, and there is dense vegetation on the ground. The vegetation on the ground is actually one of the key interests in this scene. It is dynamically distributed where needed, according to the camera movements. Its level of detail is also dynamically altered depending on the distance to the camera. The other key interest in this scene is the amazing lighting and dynamic shadow system. This scene really is ideal for showing the benefits of perspective shadow maps. Dynamic Shadows Normal Mapping (, Pants)
Figure 4: The nightly forest with the magic firefly Materials. The ground material is like the metals in game test one, but with added diffuse, diffuse detail, normal and normal detail maps. The rock surfaces also have a specular map. The tree branches are also a modified metal material without a specular map and with a diffuse cube map and no bump mapping. The sky material does a procedural light scattering. Lighting. The moonlight is directional, generating dynamic shadows using a 2048x2048 resolution depth map. The illuminating firefly is a masked point light, throwing shadows using a 512x512x6 cube depth map.
3DMark05 WHITE PAPER v1.0 Page 10 of 25 September 22nd, 2004
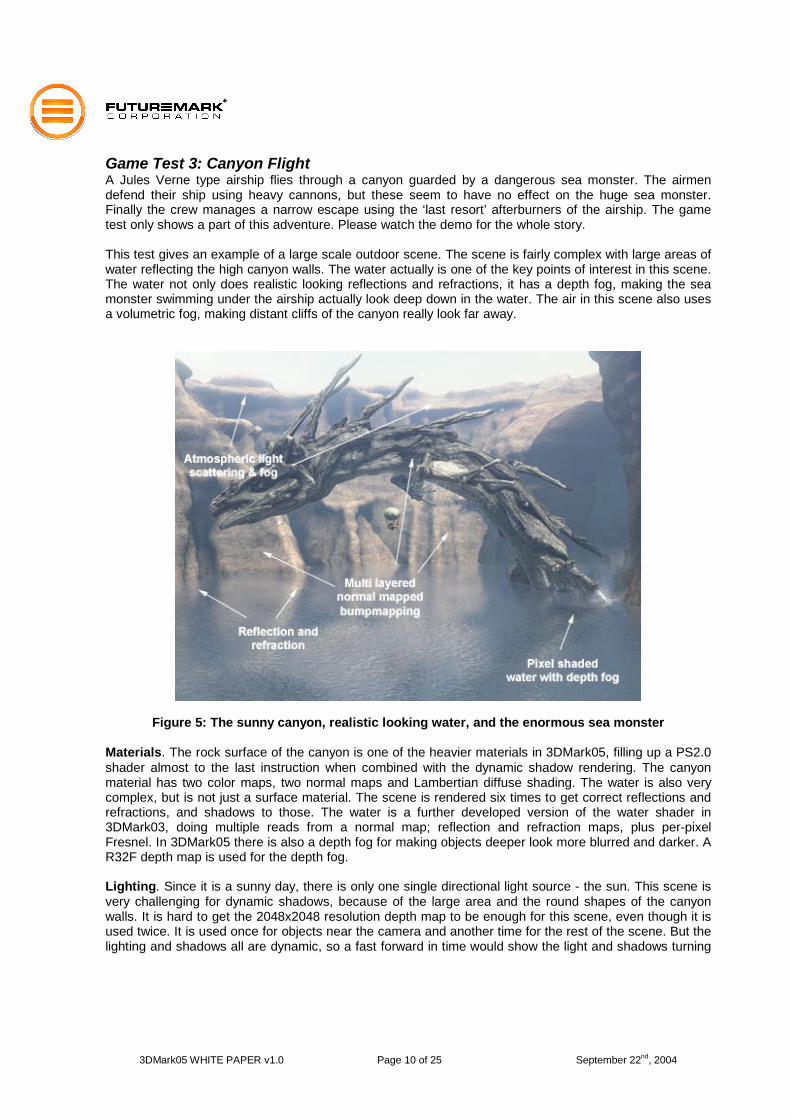
Game Test 3: Canyon Flight A Jules Verne type airship flies through a canyon guarded by a dangerous sea monster. The airmen defend their ship using heavy cannons, but these seem to have no effect on the huge sea monster. Finally the crew manages a narrow escape using the ‘last resort’ afterburners of the airship. The game test only shows a part of this adventure. Please watch the demo for the whole story. This test gives an example of a large scale outdoor scene. The scene is fairly complex with large areas of water reflecting the high canyon walls. The water actually is one of the key points of interest in this scene. The water not only does realistic looking reflections and refractions, it has a depth fog, making the sea monster swimming under the airship actually look deep down in the water. The air in this scene also uses a volumetric fog, making distant cliffs of the canyon really look far away.
Figure 5: The sunny canyon, realistic looking water, and the enormous sea monster Materials. The rock surface of the canyon is one of the heavier materials in 3DMark05, filling up a PS2.0 shader almost to the last instruction when combined with the dynamic shadow rendering. The canyon material has two color maps, two normal maps and Lambertian diffuse shading. The water is also very complex, but is not just a surface material. The scene is rendered six times to get correct reflections and refractions, and shadows to those. The water is a further developed version of the water shader in 3DMark03, doing multiple reads from a normal map; reflection and refraction maps, plus per-pixel Fresnel. In 3DMark05 there is also a depth fog for making objects deeper look more blurred and darker. A R32F depth map is used for the depth fog. Lighting. Since it is a sunny day, there is only one single directional light source - the sun. This scene is very challenging for dynamic shadows, because of the large area and the round shapes of the canyon walls. It is hard to get the 2048x2048 resolution depth map to be enough for this scene, even though it is used twice. It is used once for objects near the camera and another time for the rest of the scene. But the lighting and shadows all are dynamic, so a fast forward in time would show the light and shadows turning
3DMark05 WHITE PAPER v1.0 Page 11 of 25 September 22nd, 2004
correctly as the day passes. Actually, the demo end credits show the HDR sun turn red when setting. The sky material does a procedural light scattering.
CPU Test As in the previous 3DMark version, the CPU test runs game tests in low resolution using software vertex processing and disabled post-processing. This decreases the graphics card workload, and makes the test result reflect above all the CPU’s performance rendering 3D scenes and performing other 3D game related tasks like performing matrix calculations. The CPU test also uses fixed frame rendering to further ensure the workload stays the same for all systems. In 3DMark05, an additional workload typical for the CPU in 3D games has been added. The CPU not only calculates the vertex shaders; it also continuously calculates the flight path of the air ship. The air ship actually flies the same path every time, in order to keep the workload the same between different systems, but the calculations are performed as if it would intelligently steer according to the canyon shape and other obstacles like the sea monster jumping up from the water. The path finding algorithm used is D* Lite (http://www.cc.gatech.edu/fac/Sven.Koenig/). The D* Lite algorithm is implemented in a different thread than the rendering. This is a forward looking approach, since CPU technology is clearly is moving towards either virtual or physical dual core technology. So far only few high-end gaming systems have two separate processors. A single virtual or physical dual core processor is on the other hand becoming a more common choice for high-end gaming systems. The CPU test is therefore run in two threads and not more than that. DirectX software vertex shading is actually also threaded, which may bring further advantage to systems with a virtual or physical dual core processor. Professional reviewers can disable the other CPU or the other core of a virtual or physical dual core system, and compare the results. The second CPU test runs game test 1 in 640x480 resolution, 2 fps fixed frame mode, software vertex shaders forced and post-processing disabled. This is just like CPU test 1, except that there is no AI calculations is CPU test 2.
Feature Tests 3DMark05 includes a set of feature tests. These do not affect the overall score. However, their results provide valuable information for the benchmarking professional, as they often cannot be obtained from any other source. 3DMark05 feature tests measure the performance of a few important 3D graphics features primarily relating to vertex and pixel shader technologies. It should be noted that even though the feature tests have been designed to measure a certain characteristic, other features of the hardware may affect the measurement. Please read this chapter carefully for more info on what may affect the measurements of the feature tests. Fill Rate 3DMarks have included fill rate tests ever since 3DMark2000. These have been pretty much the same, and why not, since fill rate is one of the central features in graphics hardware regarding performance. Some professional reviewers have noted that the fill rate tests of previous 3DMark versions have been somewhat bandwidth limited. Bandwidth is tightly tied to fill rate, since any game that does lots of fill, also has to use a large amount of large texture maps, which in turn stresses the bandwidth. The fill rate tests of 3DMark05 are a bit different than before, more theoretical, minimizing the influence of bandwidth and attempting to concentrate on measuring fill rate. The tests do not look as nice as the previous versions, but any nicer effect would require larger texture maps and thereby again move the bottleneck towards graphics memory bandwidth.
3DMark05 WHITE PAPER v1.0 Page 12 of 25 September 22nd, 2004
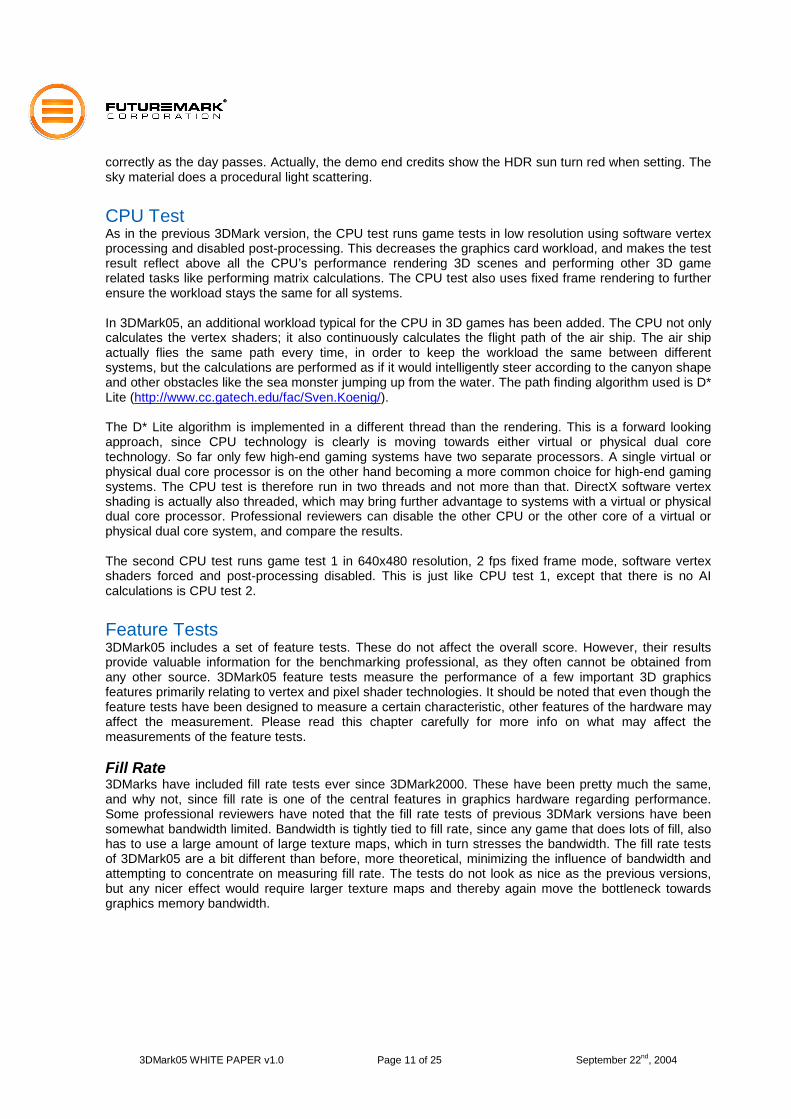
Single-Texturing. 64 screen size quads are single textured by a 2x2 map. This is basically the same test as in 3DMark03, except for the smaller texture to reduce bandwidth influence. This test uses the DirectX fixed function rendering path. Multi-Texturing. 8 screen size quads are mapped with 8 additively blended textures. The maximum amount of fixed function texture layers rendered in a single path is 8, otherwise there could have been more textures per object. This is also basically the same test as in 3DMark03, except with only a 2x2 texture. DirectX 9 hardware should support in addition to PS 2.0 also the capability to render 8 texture layers per pass. We therefore don’t need the functionality that 3DMark03 had, where quad texture cards for example rendered 16 objects with four texture layers each. Pixel Shader One of the most complex materials in the game tests is the rock face shader of game test 3. This is separated to a feature test, showing the light moving on the rough surface. There are no real time shadows, only vertex lighting. There is also no water surface, only the rock face.
Figure 6: Pixel Shader Test Filling the screen with a rock face is naturally fairly fast, since the game test shows huge amounts of that rock face in addition to the water air ship and sea monster. This test will be also bandwidth dependent, since any game like material with a complex shader will also have a number of lookups to large textures. The alternative is to do some procedural texturing, but we did that already in 3DMark03. It seems that most PC games will stick to normal color maps mainly that have been made during development, instead of loading the pixel shader with creating procedural textures.
3DMark05 WHITE PAPER v1.0 Page 13 of 25 September 22nd, 2004
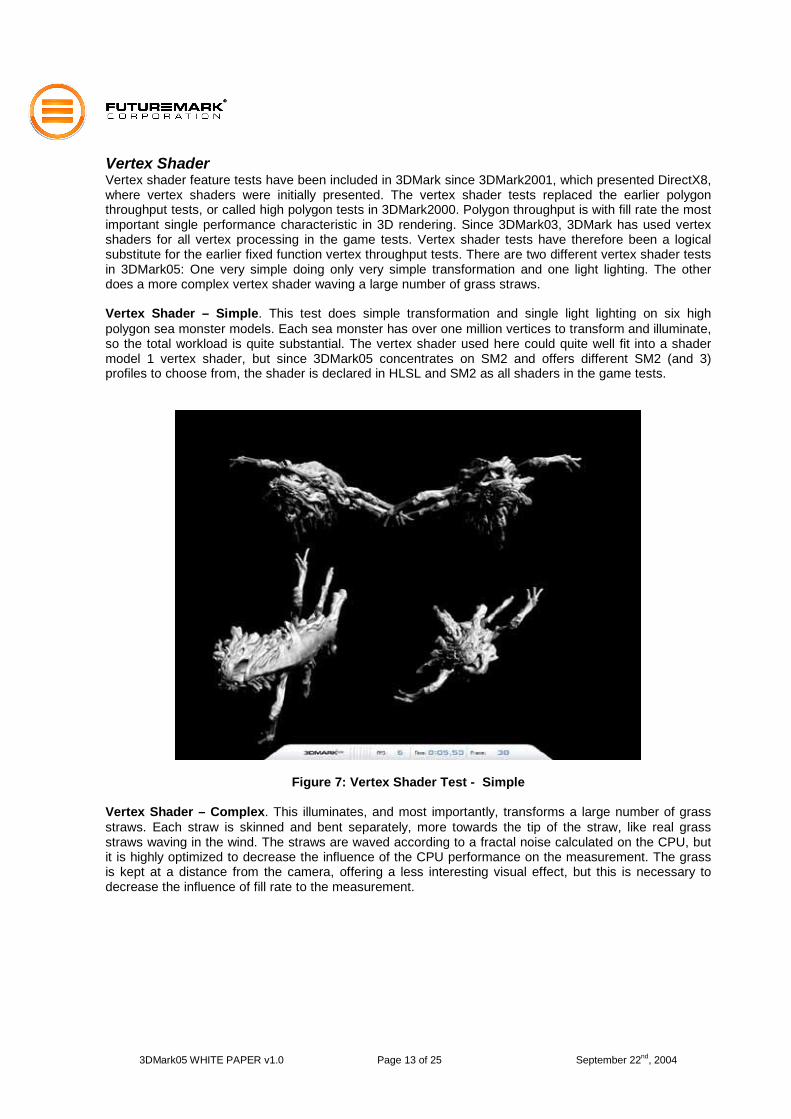
Vertex Shader Vertex shader feature tests have been included in 3DMark since 3DMark2001, which presented DirectX8, where vertex shaders were initially presented. The vertex shader tests replaced the earlier polygon throughput tests, or called high polygon tests in 3DMark2000. Polygon throughput is with fill rate the most important single performance characteristic in 3D rendering. Since 3DMark03, 3DMark has used vertex shaders for all vertex processing in the game tests. Vertex shader tests have therefore been a logical substitute for the earlier fixed function vertex throughput tests. There are two different vertex shader tests in 3DMark05: One very simple doing only very simple transformation and one light lighting. The other does a more complex vertex shader waving a large number of grass straws. Vertex Shader – Simple. This test does simple transformation and single light lighting on six high polygon sea monster models. Each sea monster has over one million vertices to transform and illuminate, so the total workload is quite substantial. The vertex shader used here could quite well fit into a shader model 1 vertex shader, but since 3DMark05 concentrates on SM2 and offers different SM2 (and 3) profiles to choose from, the shader is declared in HLSL and SM2 as all shaders in the game tests.
Figure 7: Vertex Shader Test - Simple
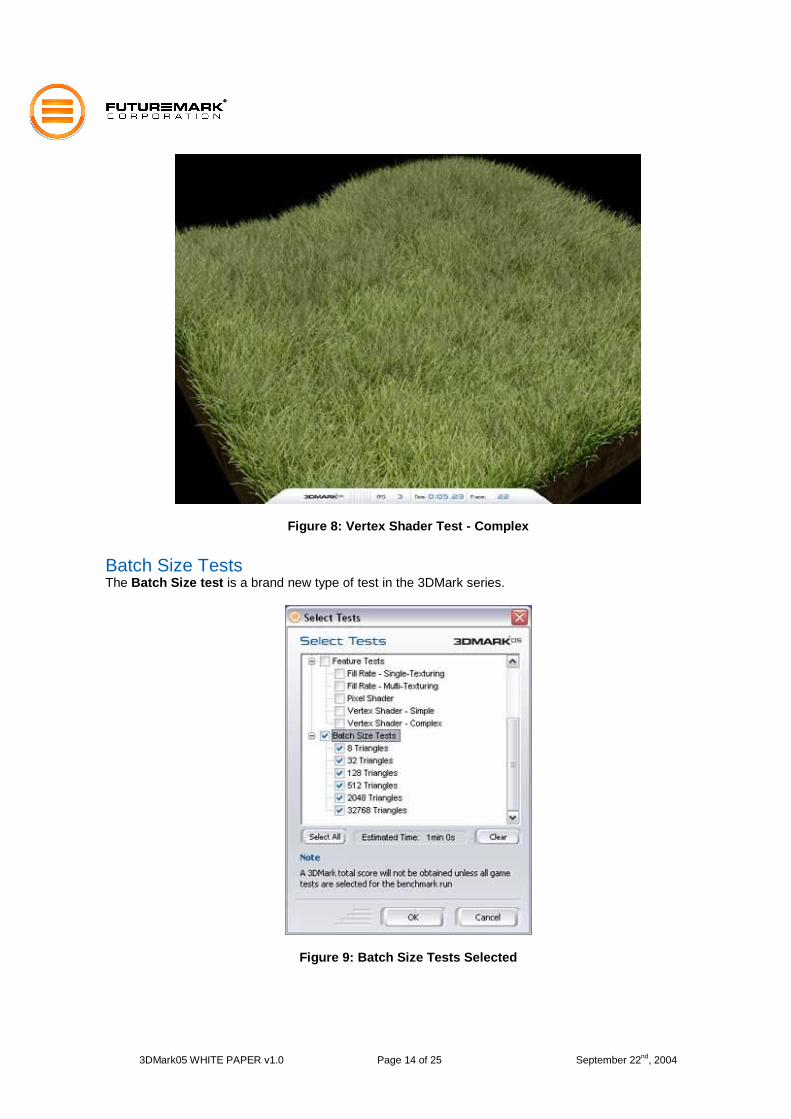
Vertex Shader – Complex. This illuminates, and most importantly, transforms a large number of grass straws. Each straw is skinned and bent separately, more towards the tip of the straw, like real grass straws waving in the wind. The straws are waved according to a fractal noise calculated on the CPU, but it is highly optimized to decrease the influence of the CPU performance on the measurement. The grass is kept at a distance from the camera, offering a less interesting visual effect, but this is necessary to decrease the influence of fill rate to the measurement.
3DMark05 WHITE PAPER v1.0 Page 14 of 25 September 22nd, 2004
Figure 8: Vertex Shader Test - Complex
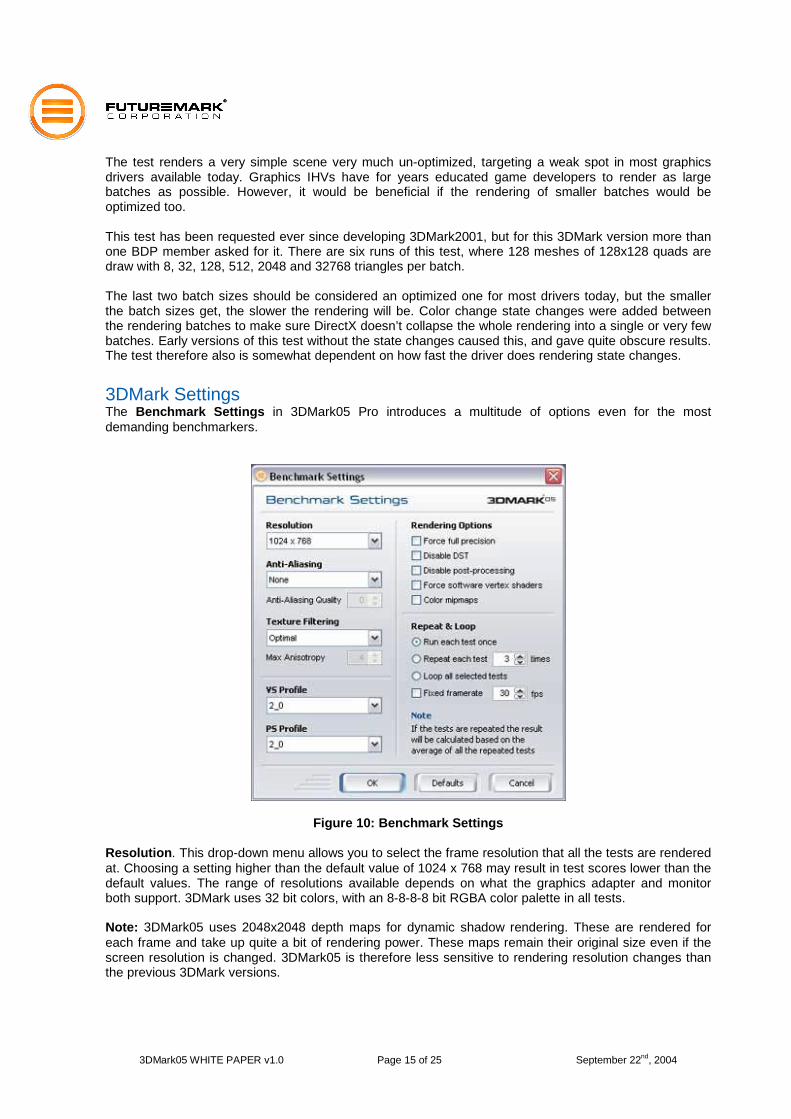
Batch Size Tests The Batch Size test is a brand new type of test in the 3DMark series.
Figure 9: Batch Size Tests Selected
3DMark05 WHITE PAPER v1.0 Page 15 of 25 September 22nd, 2004
The test renders a very simple scene very much un-optimized, targeting a weak spot in most graphics drivers available today. Graphics IHVs have for years educated game developers to render as large batches as possible. However, it would be beneficial if the rendering of smaller batches would be optimized too. This test has been requested ever since developing 3DMark2001, but for this 3DMark version more than one BDP member asked for it. There are six runs of this test, where 128 meshes of 128x128 quads are draw with 8, 32, 128, 512, 2048 and 32768 triangles per batch. The last two batch sizes should be considered an optimized one for most drivers today, but the smaller the batch sizes get, the slower the rendering will be. Color change state changes were added between the rendering batches to make sure DirectX doesn’t collapse the whole rendering into a single or very few batches. Early versions of this test without the state changes caused this, and gave quite obscure results. The test therefore also is somewhat dependent on how fast the driver does rendering state changes.
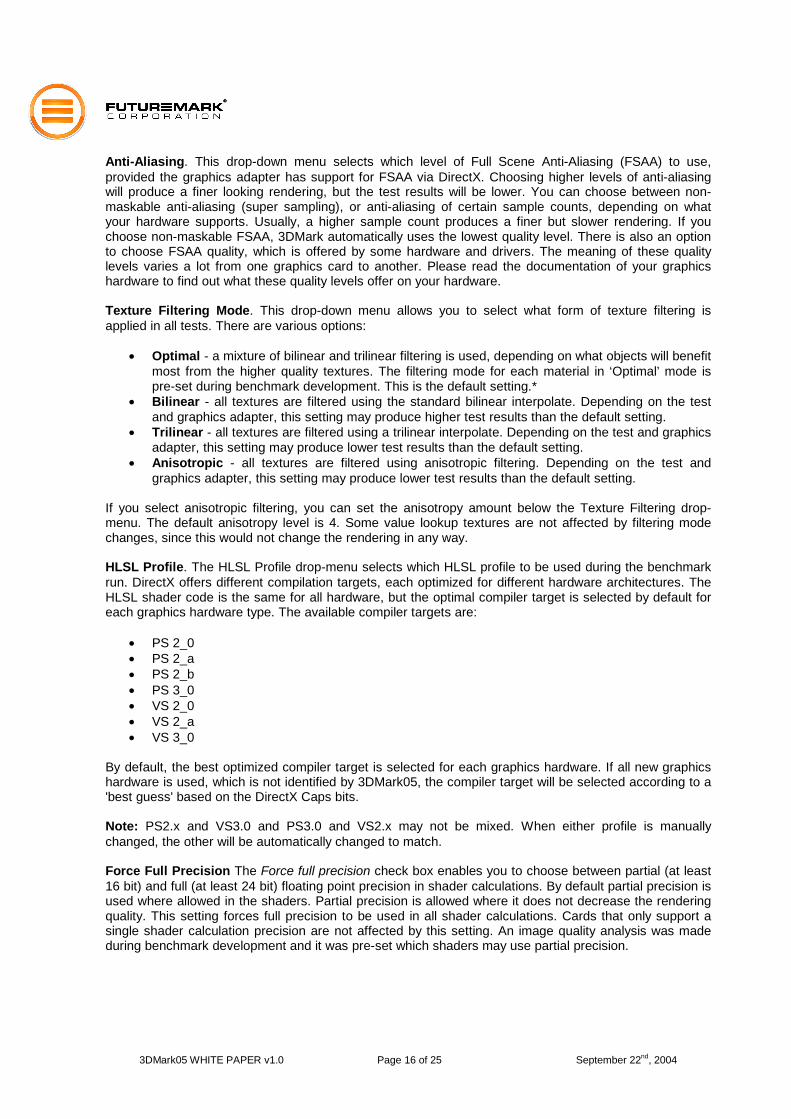
3DMark Settings The Benchmark Settings in 3DMark05 Pro introduces a multitude of options even for the most demanding benchmarkers.
Figure 10: Benchmark Settings Resolution. This drop-down menu allows you to select the frame resolution that all the tests are rendered at. Choosing a setting higher than the default value of 1024 x 768 may result in test scores lower than the default values. The range of resolutions available depends on what the graphics adapter and monitor both support. 3DMark uses 32 bit colors, with an 8-8-8-8 bit RGBA color palette in all tests. Note: 3DMark05 uses 2048x2048 depth maps for dynamic shadow rendering. These are rendered for each frame and take up quite a bit of rendering power. These maps remain their original size even if the screen resolution is changed. 3DMark05 is therefore less sensitive to rendering resolution changes than the previous 3DMark versions.
3DMark05 WHITE PAPER v1.0 Page 16 of 25 September 22nd, 2004
Anti-Aliasing. This drop-down menu selects which level of Full Scene Anti-Aliasing (FSAA) to use, provided the graphics adapter has support for FSAA via DirectX. Choosing higher levels of anti-aliasing will produce a finer looking rendering, but the test results will be lower. You can choose between non-maskable anti-aliasing (super sampling), or anti-aliasing of certain sample counts, depending on what your hardware supports. Usually, a higher sample count produces a finer but slower rendering. If you choose non-maskable FSAA, 3DMark automatically uses the lowest quality level. There is also an option to choose FSAA quality, which is offered by some hardware and drivers. The meaning of these quality levels varies a lot from one graphics card to another. Please read the documentation of your graphics hardware to find out what these quality levels offer on your hardware. Texture Filtering Mode. This drop-down menu allows you to select what form of texture filtering is applied in all tests. There are various options:
• Optimal - a mixture of bilinear and trilinear filtering is used, depending on what objects will benefit most from the higher quality textures. The filtering mode for each material in ‘Optimal’ mode is pre-set during benchmark development. This is the default setting.*
• Bilinear - all textures are filtered using the standard bilinear interpolate. Depending on the test and graphics adapter, this setting may produce higher test results than the default setting.
• Trilinear - all textures are filtered using a trilinear interpolate. Depending on the test and graphics adapter, this setting may produce lower test results than the default setting.
• Anisotropic - all textures are filtered using anisotropic filtering. Depending on the test and graphics adapter, this setting may produce lower test results than the default setting.
If you select anisotropic filtering, you can set the anisotropy amount below the Texture Filtering drop-menu. The default anisotropy level is 4. Some value lookup textures are not affected by filtering mode changes, since this would not change the rendering in any way. HLSL Profile. The HLSL Profile drop-menu selects which HLSL profile to be used during the benchmark run. DirectX offers different compilation targets, each optimized for different hardware architectures. The HLSL shader code is the same for all hardware, but the optimal compiler target is selected by default for each graphics hardware type. The available compiler targets are:
• PS 2_0 • PS 2_a • PS 2_b • PS 3_0 • VS 2_0 • VS 2_a • VS 3_0
By default, the best optimized compiler target is selected for each graphics hardware. If all new graphics hardware is used, which is not identified by 3DMark05, the compiler target will be selected according to a 'best guess' based on the DirectX Caps bits. Note: PS2.x and VS3.0 and PS3.0 and VS2.x may not be mixed. When either profile is manually changed, the other will be automatically changed to match. Force Full Precision The Force full precision check box enables you to choose between partial (at least 16 bit) and full (at least 24 bit) floating point precision in shader calculations. By default partial precision is used where allowed in the shaders. Partial precision is allowed where it does not decrease the rendering quality. This setting forces full precision to be used in all shader calculations. Cards that only support a single shader calculation precision are not affected by this setting. An image quality analysis was made during benchmark development and it was pre-set which shaders may use partial precision.
3DMark05 WHITE PAPER v1.0 Page 17 of 25 September 22nd, 2004
Disable DST. The Disable DST check box allows you to disable Depth-Stencil Texture usage in dynamic shadow rendering. DST is enabled by default on hardware supporting it. DST is an additional hardware feature that can be used to optimize dynamic shadow rendering for example. This setting is implemented for professional reviewers that may want an identical rendering comparison for some hardware reviews. Please read more about the DST shadow implementation in 3DMark05 earlier in this paper in the chapter about the dynamic shadows. Disable Post-Processing. The Disable post-processing checkbox disables full frame filtering in all game tests. 3DMark05 post-processing does bloom filtering that is done by rendering every frame to a texture and modifying the frame using a pixel shader. The bloom filter is a cinematic effect that makes bright surfaces appear over bright. The bright surface not only gets brighter discarding any details too small to be visible in the intense reflection, the light partly spills over darker areas in the frame surrounding the bright surface. In 3DMark03 post-processing was an optional feature in the game tests. In 3DMark05 it is always on by default. Force Software Vertex Shaders. The Force software vertex shaders check box controls whether vertex shading routines in the tests are processed by the graphics adapter or the CPU. Note that if the graphics adapter does not support hardware processing, all vertex shaders will be processed by the CPU anyway. Selecting Force software vertex shaders, if hardware accelerated is available, may result in some tests producing significantly lower results. On the other hand, running the default benchmark with forced software vertex shaders is an excellent way to test CPU performance. By default all vertex shaders are run in the graphics hardware if supported. Color Mipmaps. The Color mipmaps check box colors mipmaps red, green and blue. Mipmaps allow textures to be decreased in resolution if they are further away from the camera, thus saving GPU processing power and reducing annoying flickering of sub-pixel texels. Coloring mipmaps produces a somewhat distorted rendering, but it is a useful feature for inspecting texture filtering quality. The full size textures are not colored. Repeat & Loop. Selecting Repeat will cause each test to run the number of times chosen. The final result is given as an average of the repeated runs. Loop will make 3DMark05 run all of the selected tests in a continuous loop until the ESC key is pressed during a test. This is feature is useful for testing the long-term stability of a system. Please note that other issues than system stability may cause the loop to be interrupted. Fixed Framerate. 3DMark05 provides two different real-time rendering mechanisms: time-based rendering and frame-based rendering. Each game scene has a timeline or natural pace of action. Time-based rendering adjusts the frame-rate to maintain this timeline. For simple scenes, the hardware may be able keep up a high frame-rate; for complex ones, it may need to lower the frame-rate to maintain the timeline. For very low-end hardware, the user may even see a “slide-show” effect, as the hardware struggles to keep up the natural pace of action. This is the typical mechanism used by 3D games and hence 3DMark05 scores are only generated with time-based rendering. In addition to time-based rendering, 3DMark05 provides an option for a frame-based rendering mechanism that renders a fixed number of frames for each second of the timeline. The number of frames is user configurable. Frame-based rendering forces each run to generate exactly the same number of total frames regardless of the PC used. Of course, the hardware would render these frames at the fastest pace that it can handle, so a fluctuating frame-rate is still observed. Frame based rendering is a great mechanism for comparing performance of two PCs running exactly the same workload.
3DMark05 WHITE PAPER v1.0 Page 18 of 25 September 22nd, 2004
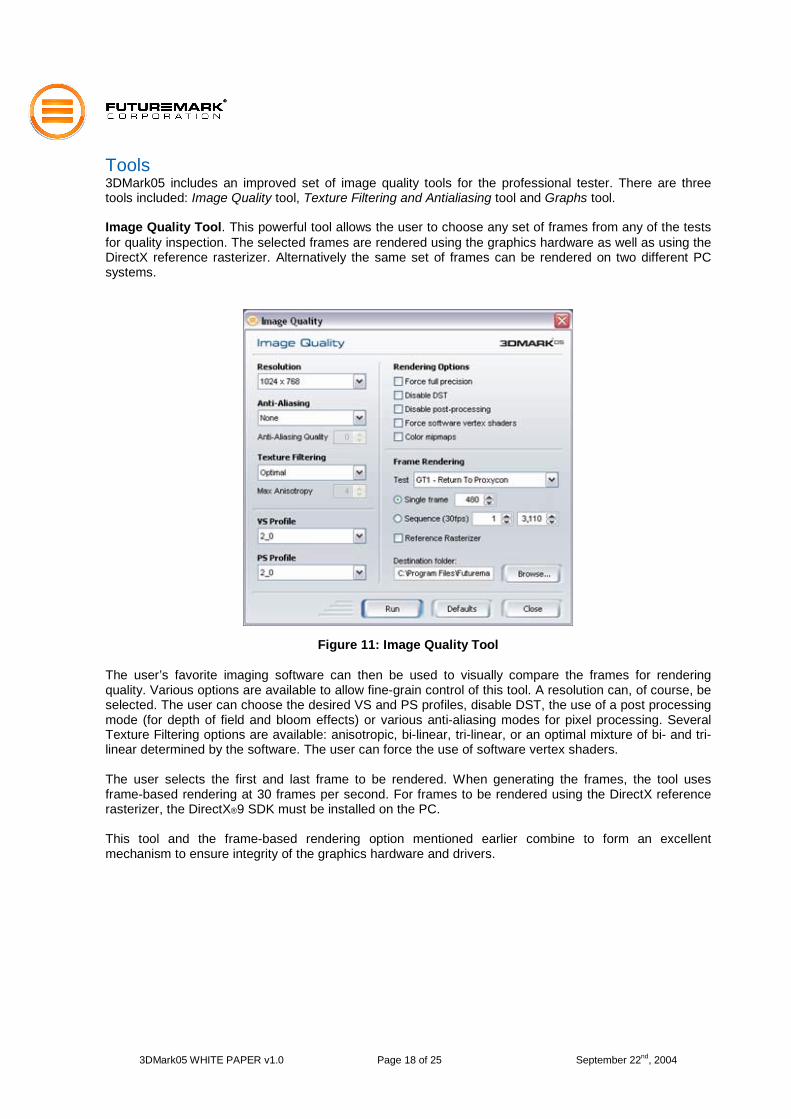
Tools 3DMark05 includes an improved set of image quality tools for the professional tester. There are three tools included: Image Quality tool, Texture Filtering and Antialiasing tool and Graphs tool. Image Quality Tool. This powerful tool allows the user to choose any set of frames from any of the tests for quality inspection. The selected frames are rendered using the graphics hardware as well as using the DirectX reference rasterizer. Alternatively the same set of frames can be rendered on two different PC systems.
Figure 11: Image Quality Tool The user’s favorite imaging software can then be used to visually compare the frames for rendering quality. Various options are available to allow fine-grain control of this tool. A resolution can, of course, be selected. The user can choose the desired VS and PS profiles, disable DST, the use of a post processing mode (for depth of field and bloom effects) or various anti-aliasing modes for pixel processing. Several Texture Filtering options are available: anisotropic, bi-linear, tri-linear, or an optimal mixture of bi- and tri-linear determined by the software. The user can force the use of software vertex shaders. The user selects the first and last frame to be rendered. When generating the frames, the tool uses frame-based rendering at 30 frames per second. For frames to be rendered using the DirectX reference rasterizer, the DirectX®9 SDK must be installed on the PC. This tool and the frame-based rendering option mentioned earlier combine to form an excellent mechanism to ensure integrity of the graphics hardware and drivers.
3DMark05 WHITE PAPER v1.0 Page 19 of 25 September 22nd, 2004
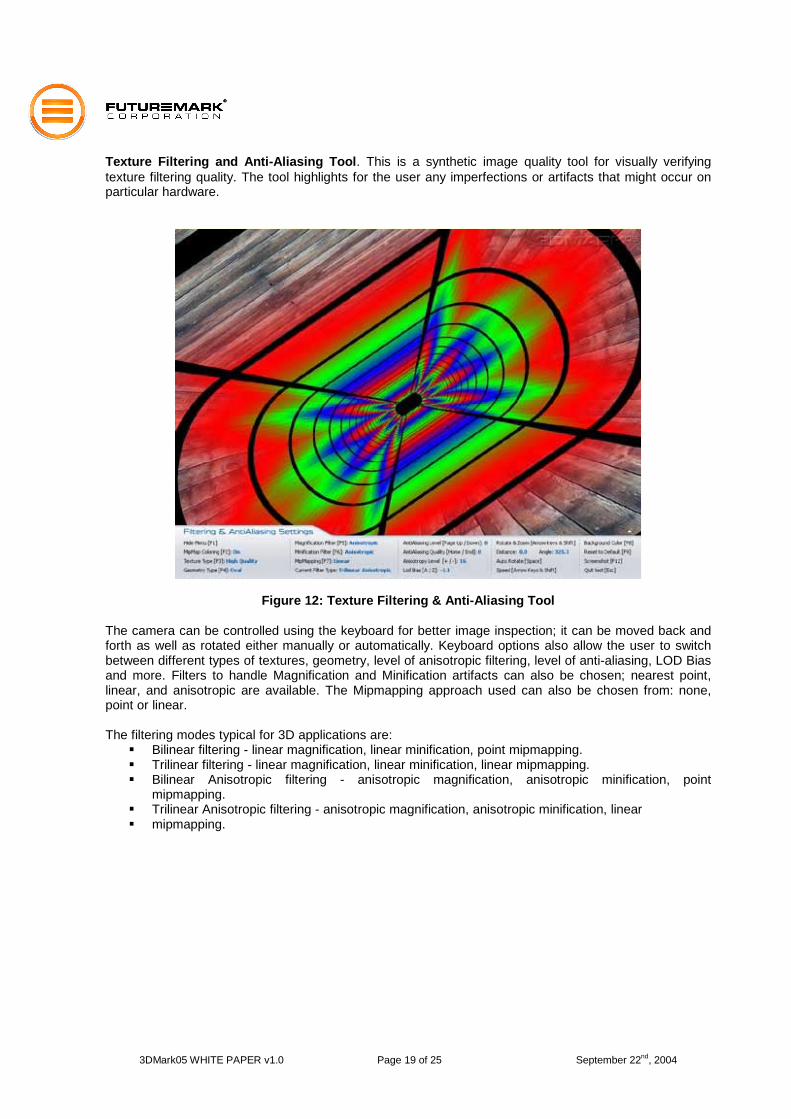
Texture Filtering and Anti-Aliasing Tool. This is a synthetic image quality tool for visually verifying texture filtering quality. The tool highlights for the user any imperfections or artifacts that might occur on particular hardware.
Figure 12: Texture Filtering & Anti-Aliasing Tool
The camera can be controlled using the keyboard for better image inspection; it can be moved back and forth as well as rotated either manually or automatically. Keyboard options also allow the user to switch between different types of textures, geometry, level of anisotropic filtering, level of anti-aliasing, LOD Bias and more. Filters to handle Magnification and Minification artifacts can also be chosen; nearest point, linear, and anisotropic are available. The Mipmapping approach used can also be chosen from: none, point or linear. The filtering modes typical for 3D applications are:
�� Bilinear filtering - linear magnification, linear minification, point mipmapping. �� Trilinear filtering - linear magnification, linear minification, linear mipmapping. �� Bilinear Anisotropic filtering - anisotropic magnification, anisotropic minification, point
mipmapping. �� Trilinear Anisotropic filtering - anisotropic magnification, anisotropic minification, linear �� mipmapping.
3DMark05 WHITE PAPER v1.0 Page 20 of 25 September 22nd, 2004
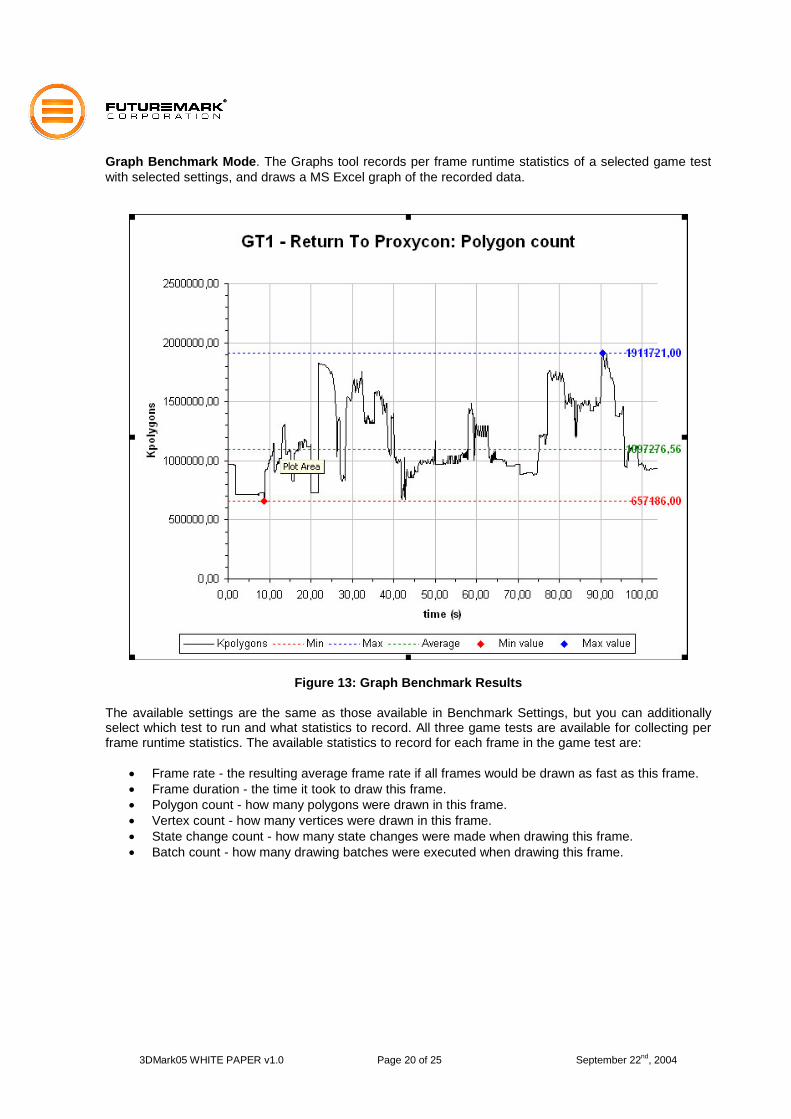
Graph Benchmark Mode. The Graphs tool records per frame runtime statistics of a selected game test with selected settings, and draws a MS Excel graph of the recorded data.
Figure 13: Graph Benchmark Results The available settings are the same as those available in Benchmark Settings, but you can additionally select which test to run and what statistics to record. All three game tests are available for collecting per frame runtime statistics. The available statistics to record for each frame in the game test are:
• Frame rate - the resulting average frame rate if all frames would be drawn as fast as this frame. • Frame duration - the time it took to draw this frame. • Polygon count - how many polygons were drawn in this frame. • Vertex count - how many vertices were drawn in this frame. • State change count - how many state changes were made when drawing this frame. • Batch count - how many drawing batches were executed when drawing this frame.
3DMark05 WHITE PAPER v1.0 Page 21 of 25 September 22nd, 2004
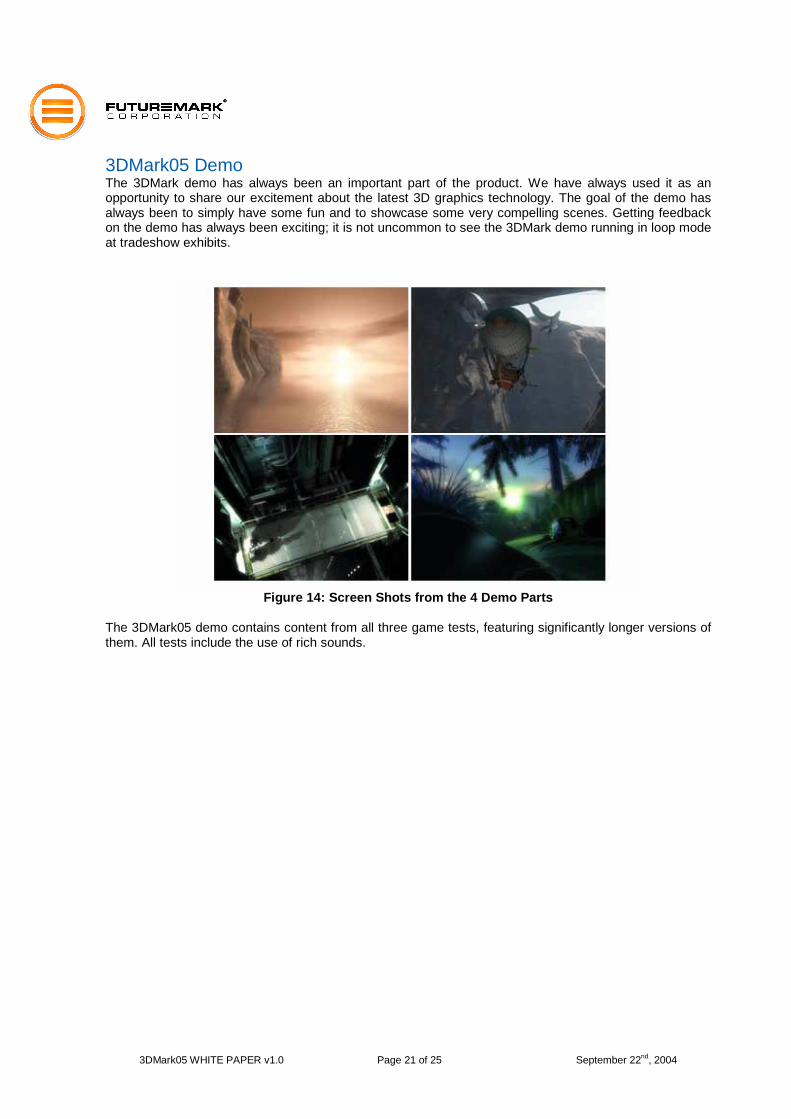
3DMark05 Demo The 3DMark demo has always been an important part of the product. We have always used it as an opportunity to share our excitement about the latest 3D graphics technology. The goal of the demo has always been to simply have some fun and to showcase some very compelling scenes. Getting feedback on the demo has always been exciting; it is not uncommon to see the 3DMark demo running in loop mode at tradeshow exhibits.
Figure 14: Screen Shots from the 4 Demo Parts
The 3DMark05 demo contains content from all three game tests, featuring significantly longer versions of them. All tests include the use of rich sounds.
3DMark05 WHITE PAPER v1.0 Page 22 of 25 September 22nd, 2004
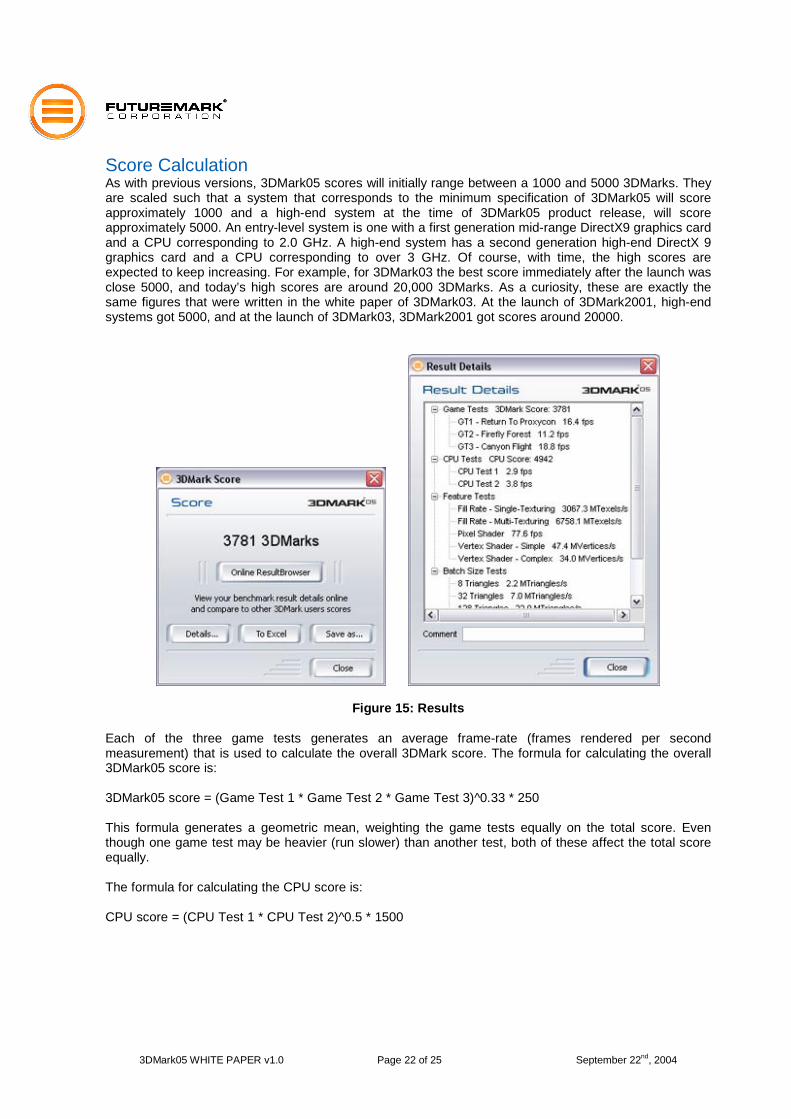
Score Calculation As with previous versions, 3DMark05 scores will initially range between a 1000 and 5000 3DMarks. They are scaled such that a system that corresponds to the minimum specification of 3DMark05 will score approximately 1000 and a high-end system at the time of 3DMark05 product release, will score approximately 5000. An entry-level system is one with a first generation mid-range DirectX9 graphics card and a CPU corresponding to 2.0 GHz. A high-end system has a second generation high-end DirectX 9 graphics card and a CPU corresponding to over 3 GHz. Of course, with time, the high scores are expected to keep increasing. For example, for 3DMark03 the best score immediately after the launch was close 5000, and today’s high scores are around 20,000 3DMarks. As a curiosity, these are exactly the same figures that were written in the white paper of 3DMark03. At the launch of 3DMark2001, high-end systems got 5000, and at the launch of 3DMark03, 3DMark2001 got scores around 20000.
Figure 15: Results Each of the three game tests generates an average frame-rate (frames rendered per second measurement) that is used to calculate the overall 3DMark score. The formula for calculating the overall 3DMark05 score is: 3DMark05 score = (Game Test 1 * Game Test 2 * Game Test 3)^0.33 * 250 This formula generates a geometric mean, weighting the game tests equally on the total score. Even though one game test may be heavier (run slower) than another test, both of these affect the total score equally. The formula for calculating the CPU score is: CPU score = (CPU Test 1 * CPU Test 2)^0.5 * 1500
3DMark05 WHITE PAPER v1.0 Page 23 of 25 September 22nd, 2004
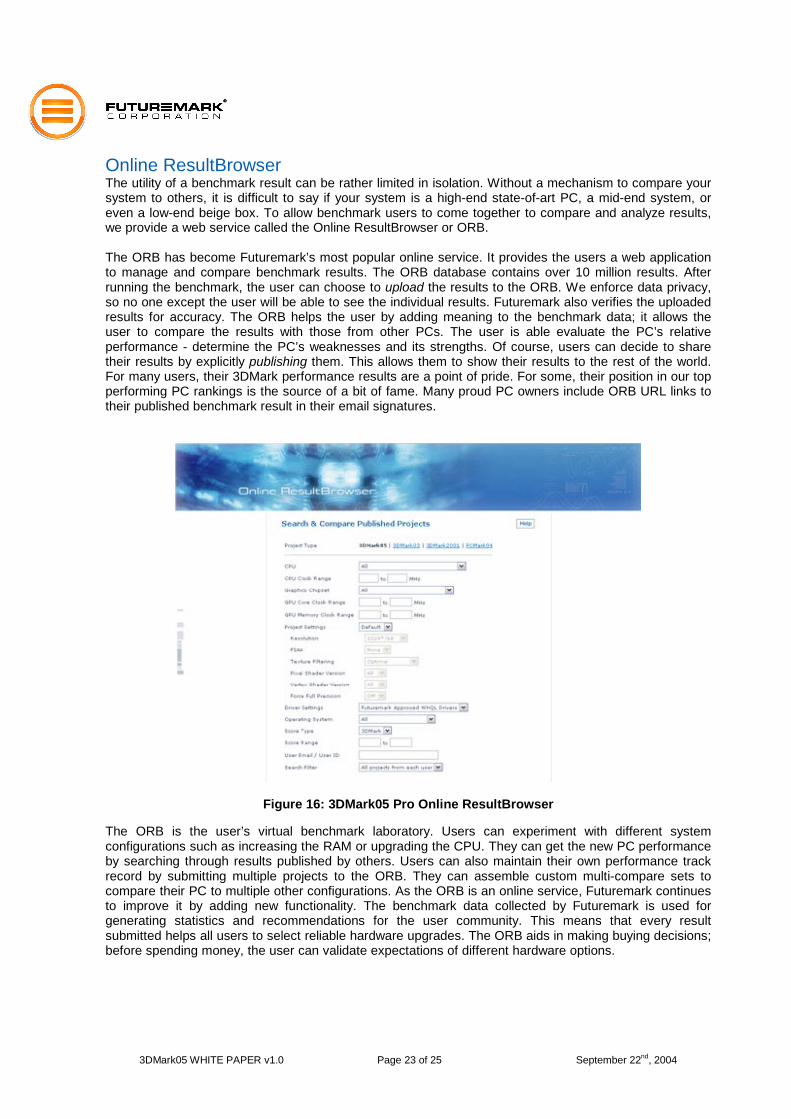
Online ResultBrowser The utility of a benchmark result can be rather limited in isolation. Without a mechanism to compare your system to others, it is difficult to say if your system is a high-end state-of-art PC, a mid-end system, or even a low-end beige box. To allow benchmark users to come together to compare and analyze results, we provide a web service called the Online ResultBrowser or ORB. The ORB has become Futuremark’s most popular online service. It provides the users a web application to manage and compare benchmark results. The ORB database contains over 10 million results. After running the benchmark, the user can choose to upload the results to the ORB. We enforce data privacy, so no one except the user will be able to see the individual results. Futuremark also verifies the uploaded results for accuracy. The ORB helps the user by adding meaning to the benchmark data; it allows the user to compare the results with those from other PCs. The user is able evaluate the PC’s relative performance - determine the PC’s weaknesses and its strengths. Of course, users can decide to share their results by explicitly publishing them. This allows them to show their results to the rest of the world. For many users, their 3DMark performance results are a point of pride. For some, their position in our top performing PC rankings is the source of a bit of fame. Many proud PC owners include ORB URL links to their published benchmark result in their email signatures.
Figure 16: 3DMark05 Pro Online ResultBrowser The ORB is the user’s virtual benchmark laboratory. Users can experiment with different system configurations such as increasing the RAM or upgrading the CPU. They can get the new PC performance by searching through results published by others. Users can also maintain their own performance track record by submitting multiple projects to the ORB. They can assemble custom multi-compare sets to compare their PC to multiple other configurations. As the ORB is an online service, Futuremark continues to improve it by adding new functionality. The benchmark data collected by Futuremark is used for generating statistics and recommendations for the user community. This means that every result submitted helps all users to select reliable hardware upgrades. The ORB aids in making buying decisions; before spending money, the user can validate expectations of different hardware options.
3DMark05 WHITE PAPER v1.0 Page 24 of 25 September 22nd, 2004
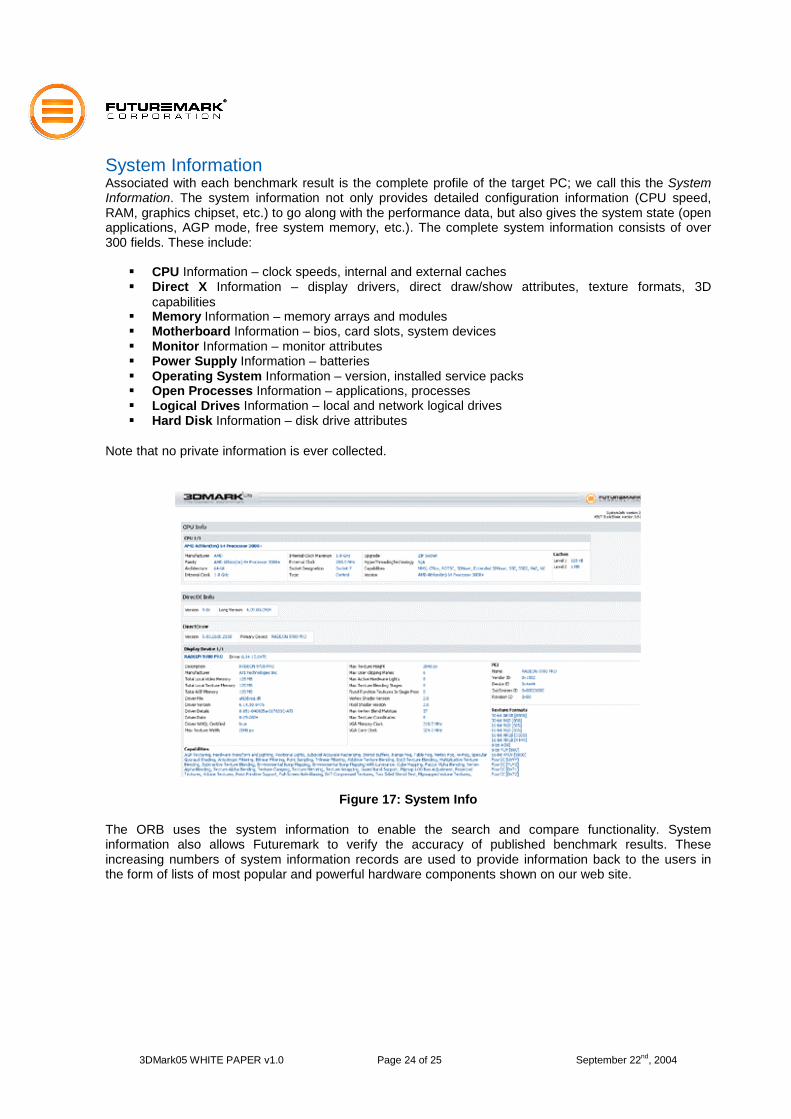
System Information Associated with each benchmark result is the complete profile of the target PC; we call this the System Information. The system information not only provides detailed configuration information (CPU speed, RAM, graphics chipset, etc.) to go along with the performance data, but also gives the system state (open applications, AGP mode, free system memory, etc.). The complete system information consists of over 300 fields. These include:
�� CPU Information – clock speeds, internal and external caches �� Direct X Information – display drivers, direct draw/show attributes, texture formats, 3D
capabilities �� Memory Information – memory arrays and modules �� Motherboard Information – bios, card slots, system devices �� Monitor Information – monitor attributes �� Power Supply Information – batteries �� Operating System Information – version, installed service packs �� Open Processes Information – applications, processes �� Logical Drives Information – local and network logical drives �� Hard Disk Information – disk drive attributes
Note that no private information is ever collected.
Figure 17: System Info
The ORB uses the system information to enable the search and compare functionality. System information also allows Futuremark to verify the accuracy of published benchmark results. These increasing numbers of system information records are used to provide information back to the users in the form of lists of most popular and powerful hardware components shown on our web site.

3DMark05 WHITE PAPER v1.0 Page 25 of 25 September 22nd, 2004
Conclusion Over the last six years, 3DMark has become a trusted standard in 3D graphics benchmarking. Futuremark’s latest version, 3DMark05, continues the tradition of providing an easy-to-use tool for benchmarking next generation 3D graphics technology. This time, powered by the latest DirectX 9 features and supporting graphics hardware, we showcase 3D graphics likely to be seen over the next year and a half. More importantly we provide a neutral and transparent benchmarking tool to allow the user to evaluate the capabilities of the latest hardware. As graphics hardware becomes more powerful, especially with new sophisticated shader support, stunning 3D graphics will become accessible to more applications. We believe 3DMark05 will serve as a highly dependable tool for the benchmarking professional in this new environment. Futuremark is a registered trademark of Futuremark Corporation. 3DMark and PCMark are registered trademarks of Futuremark Corporation. Microsoft, DirectX, and Direct3D are either registered trademarks or trademarks of Microsoft Corporation in the United States and/or other countries. AMD and Athlon are registered trademarks or trademarks of Advanced Micro Devices, Inc. in the United States and/or other countries. ATI and Radeon are registered trademarks or trademarks of ATI Technologies, Inc. in the United States and/or other countries. NVIDIA and GeForce are registered trademarks or trademarks of NVIDIA. DOOM 3 is a registered trademark or trademark of id Software. All other names mentioned are trademarks, or registered trademarks of their respective companies...
All rights reserved Futuremark® Corporation, 2004.