Embed Size (px)
Citation preview

White Paper on International Economy
and Trade 2016 [Outline]
June 2016 Ministry of Economy, Trade
and Industry
1
<Table of Contents>
Chapter 1 Global economic trends and challenges Section 1 Structural change in the economy of emerging countries Section 2 Worldwide decline in growth expectations Section 3 Emergence of new sources for growth
Chapter 2 Our challenges for exploring new global frontiers Section 1 Current status and challenges of Japan’s external economic
relationships Section 2 Expanding services trade by taking advantage of Japan’s
strengths Section 3 Globalization of local economies and export stimulus by SMEs
and export stimulus by SMEs and middle-sized enterprises Section 4 Exploring the “new frontier of emerging economies”
Chapter 3 Our international economy and trade policies Section 1 Policies reflecting global challenges in economy and trade Section 2 Policies reflecting Japan’s challenges in international economy
and trade
●White Paper on International Economy and Trade ・The white paper has been published since 1949, and this year’s edition is the 68th.
*Unlike the other four statutory white paper published by the Ministry of Economy, Trade and Industry as follows, the White Paper on International Economy and Trade has been circulated to the Cabinet annually without any legal obligations. ・White Paper on Small and Medium Enterprises in Japan (Small and Medium-sized Enterprise Basic Act)
・ White Paper on Small Enterprises in Japan (Basic Act for Promoting Small Enterprises )
・White Paper on Manufacturing Industries (Basic Act on the Promotion of Core Manufacturing Technology)
・Annual Report on Energy (Energy White Paper) (Basic Act on Energy Policy)
90
110
130
150
170
1985 1990 1995 2000 2005 2010 2015
C. The ratio of the balance of debts owed by non-financial private companies to GDP in Japan and China
China Japan
37.9%
13.5%
44.0%
0%
10%
20%
30%
40%
50%
60%
1970
1972
1974
1976
1978
1980
1982
1984
1986
1988
1990
1992
1994
1996
1998
2000
2002
2004
2006
2008
2010
2012
2014
A. Changes in the GDP by expenditure in China Exports of goods and servicesImports of goods and servicesHousehold consumption expenditureGeneral government final consumption expenditureGross fixed capital formation
24.4%
9.3%
Gross fixed capital formation Final consumption expenditure
B. Global GDP by expenditure and by country (2014)
2
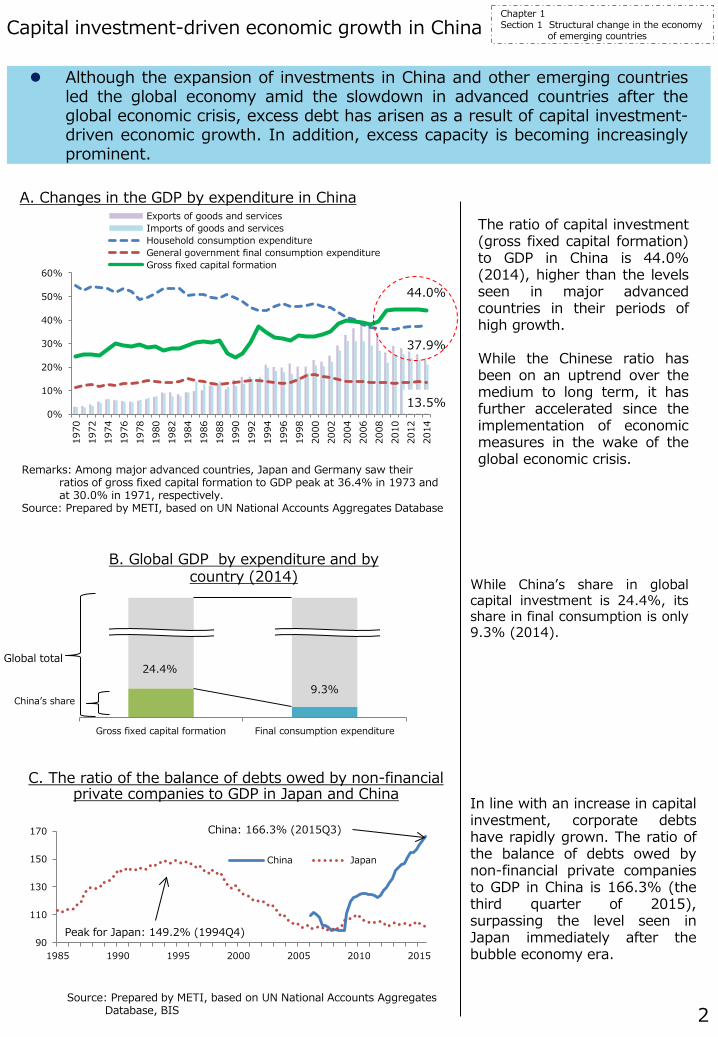
Although the expansion of investments in China and other emerging countries led the global economy amid the slowdown in advanced countries after the global economic crisis, excess debt has arisen as a result of capital investment-driven economic growth. In addition, excess capacity is becoming increasingly prominent.
Capital investment-driven economic growth in China
Remarks: Among major advanced countries, Japan and Germany saw their ratios of gross fixed capital formation to GDP peak at 36.4% in 1973 and at 30.0% in 1971, respectively.
Source: Prepared by METI, based on UN National Accounts Aggregates Database
The ratio of capital investment (gross fixed capital formation) to GDP in China is 44.0% (2014), higher than the levels seen in major advanced countries in their periods of high growth. While the Chinese ratio has been on an uptrend over the medium to long term, it has further accelerated since the implementation of economic measures in the wake of the global economic crisis.
China’s share
Global total
While China’s share in global capital investment is 24.4%, its share in final consumption is only 9.3% (2014).
Peak for Japan: 149.2% (1994Q4)
China: 166.3% (2015Q3)
Source: Prepared by METI, based on UN National Accounts Aggregates Database, BIS
In line with an increase in capital investment, corporate debts have rapidly grown. The ratio of the balance of debts owed by non-financial private companies to GDP in China is 166.3% (the third quarter of 2015), surpassing the level seen in Japan immediately after the bubble economy era.
Chapter 1 Section 1 Structural change in the economy
of emerging countries
-10.9
-5.5
-4.3
-4.3
-2.2
-1.8
-1.4
-1.2
-12 -10 -8 -6 -4 -2 0
Iron and steel
Chemicals
Total
Non-metallic minerals
Electrical machinery
Computers/…
Machinery
General automobiles
70%
75%
80%
85%
90%
0
2
4
6
8
10
12
2004 2005 2006 2007 2008 2009 2010 2011 2012 2013 2014 2015
Excess capacityCrude steel production volumeCapacity utilization rate
61
31
157
0
50
100
150
200
250
1995
1996
1997
1998
1999
2000
2001
2002
2003
2004
2005
2006
2007
2008
2009
2010
2011
2012
2013
2014
Others
Textiles
Machinery and electrical equipment
Resins
Products of chemicals
Base metals
3
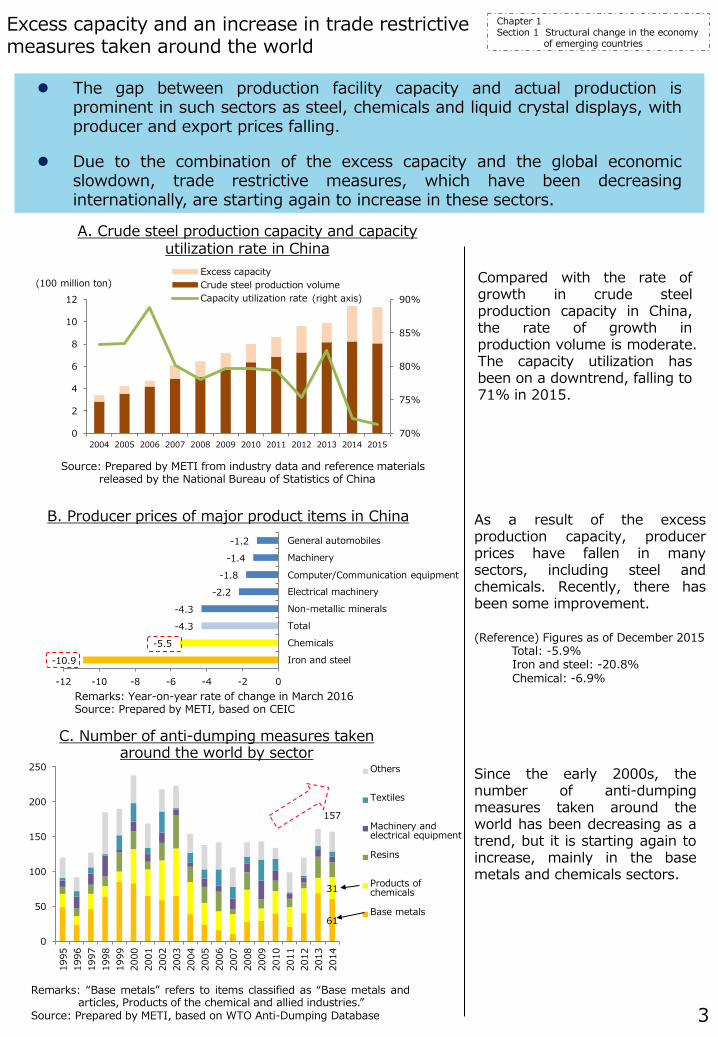
Remarks: Year-on-year rate of change in March 2016 Source: Prepared by METI, based on CEIC
The gap between production facility capacity and actual production is prominent in such sectors as steel, chemicals and liquid crystal displays, with producer and export prices falling.
Due to the combination of the excess capacity and the global economic slowdown, trade restrictive measures, which have been decreasing internationally, are starting again to increase in these sectors.
Excess capacity and an increase in trade restrictive measures taken around the world
(100 million ton)
Remarks: “Base metals” refers to items classified as “Base metals and articles, Products of the chemical and allied industries.”
Source: Prepared by METI, based on WTO Anti-Dumping Database
Since the early 2000s, the number of anti-dumping measures taken around the world has been decreasing as a trend, but it is starting again to increase, mainly in the base metals and chemicals sectors.
Compared with the rate of growth in crude steel production capacity in China, the rate of growth in production volume is moderate. The capacity utilization has been on a downtrend, falling to 71% in 2015.
As a result of the excess production capacity, producer prices have fallen in many sectors, including steel and chemicals. Recently, there has been some improvement. (Reference) Figures as of December 2015 Total: -5.9%
Iron and steel: -20.8% Chemical: -6.9%
Source: Prepared by METI from industry data and reference materials released by the National Bureau of Statistics of China
Chapter 1 Section 1 Structural change in the economy
of emerging countries
B. Producer prices of major product items in China
C. Number of anti-dumping measures taken around the world by sector
A. Crude steel production capacity and capacity utilization rate in China
(right axis)
Computer/Communication equipment
0
20
40
60
80
100
120
140
160
180
2010 2011 2012 2013 2014 2015 2016
(Index: January 1, 2010=100)
4
Crude oil
Iron ore
Coal
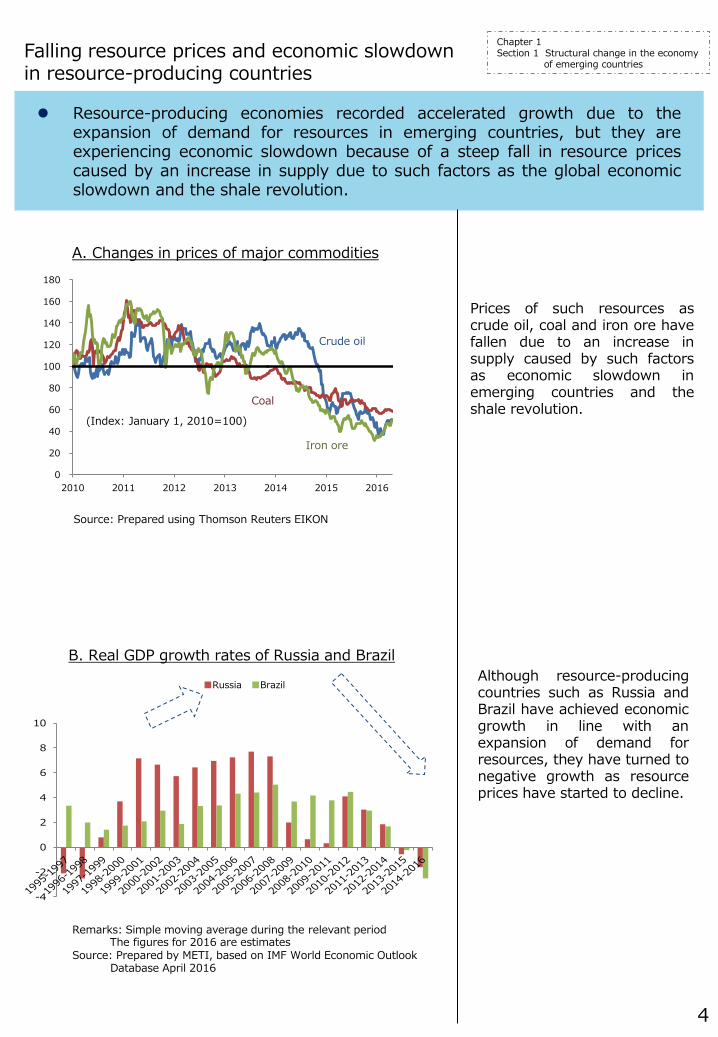
Resource-producing economies recorded accelerated growth due to the expansion of demand for resources in emerging countries, but they are experiencing economic slowdown because of a steep fall in resource prices caused by an increase in supply due to such factors as the global economic slowdown and the shale revolution.
Falling resource prices and economic slowdown in resource-producing countries
Source: Prepared using Thomson Reuters EIKON
Remarks: Simple moving average during the relevant period The figures for 2016 are estimates
Source: Prepared by METI, based on IMF World Economic Outlook Database April 2016
Prices of such resources as crude oil, coal and iron ore have fallen due to an increase in supply caused by such factors as economic slowdown in emerging countries and the shale revolution.
Although resource-producing countries such as Russia and Brazil have achieved economic growth in line with an expansion of demand for resources, they have turned to negative growth as resource prices have started to decline.
Chapter 1 Section 1 Structural change in the economy
of emerging countries
A. Changes in prices of major commodities
B. Real GDP growth rates of Russia and Brazil
-4
-2
0
2
4
6
8
10
■Russia ■Brazil
0.0
0.5
1.0
1.5
2.0
2.5
3.0
0
250
500
750
1,000
1,250
1,500 (Billion RMB) (%)
5
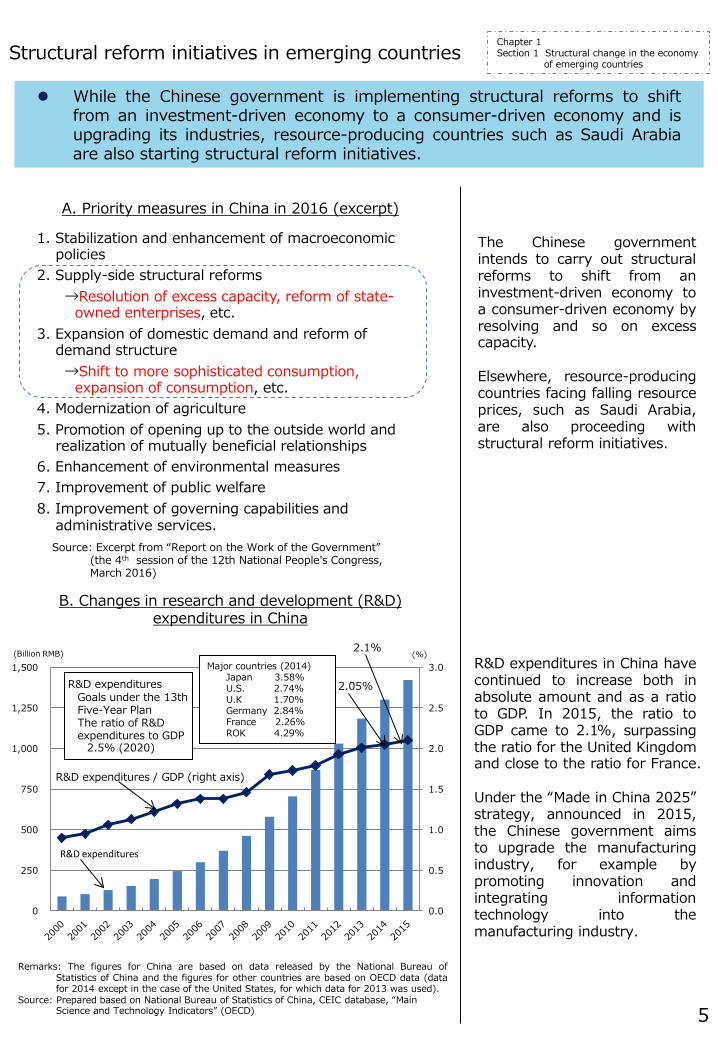
While the Chinese government is implementing structural reforms to shift from an investment-driven economy to a consumer-driven economy and is upgrading its industries, resource-producing countries such as Saudi Arabia are also starting structural reform initiatives.
Structural reform initiatives in emerging countries
The Chinese government intends to carry out structural reforms to shift from an investment-driven economy to a consumer-driven economy by resolving and so on excess capacity. Elsewhere, resource-producing countries facing falling resource prices, such as Saudi Arabia, are also proceeding with structural reform initiatives.
R&D expenditures in China have continued to increase both in absolute amount and as a ratio to GDP. In 2015, the ratio to GDP came to 2.1%, surpassing the ratio for the United Kingdom and close to the ratio for France. Under the “Made in China 2025” strategy, announced in 2015, the Chinese government aims to upgrade the manufacturing industry, for example by promoting innovation and integrating information technology into the manufacturing industry.
A. Priority measures in China in 2016 (excerpt)
1. Stabilization and enhancement of macroeconomic policies
2. Supply-side structural reforms →Resolution of excess capacity, reform of state-
owned enterprises, etc. 3. Expansion of domestic demand and reform of
demand structure →Shift to more sophisticated consumption,
expansion of consumption, etc. 4. Modernization of agriculture 5. Promotion of opening up to the outside world and
realization of mutually beneficial relationships 6. Enhancement of environmental measures 7. Improvement of public welfare 8. Improvement of governing capabilities and
administrative services. Source: Excerpt from “Report on the Work of the Government”
(the 4th session of the 12th National People's Congress, March 2016)
B. Changes in research and development (R&D) expenditures in China
Chapter 1 Section 1 Structural change in the economy
of emerging countries
R&D expenditures / GDP (right axis)
R&D expenditures
Major countries (2014) Japan 3.58% U.S. 2.74% U.K 1.70% Germany 2.84% France 2.26% ROK 4.29%
2.05%
2.1%
R&D expenditures Goals under the 13th Five-Year Plan The ratio of R&D expenditures to GDP
2.5% (2020)
Remarks: The figures for China are based on data released by the National Bureau of Statistics of China and the figures for other countries are based on OECD data (data for 2014 except in the case of the United States, for which data for 2013 was used).
Source: Prepared based on National Bureau of Statistics of China, CEIC database, “Main Science and Technology Indicators” (OECD)
0.0%
5.0%
10.0%
15.0%
20.0%
25.0%
1995
1996
1997
1998
1999
2000
2001
2002
2003
2004
2005
2006
2007
2008
2009
2010
2011
2012
2013
2014
2015
Japan (nominal value) China (nominal value)
Japan (value added) China (value added)
6
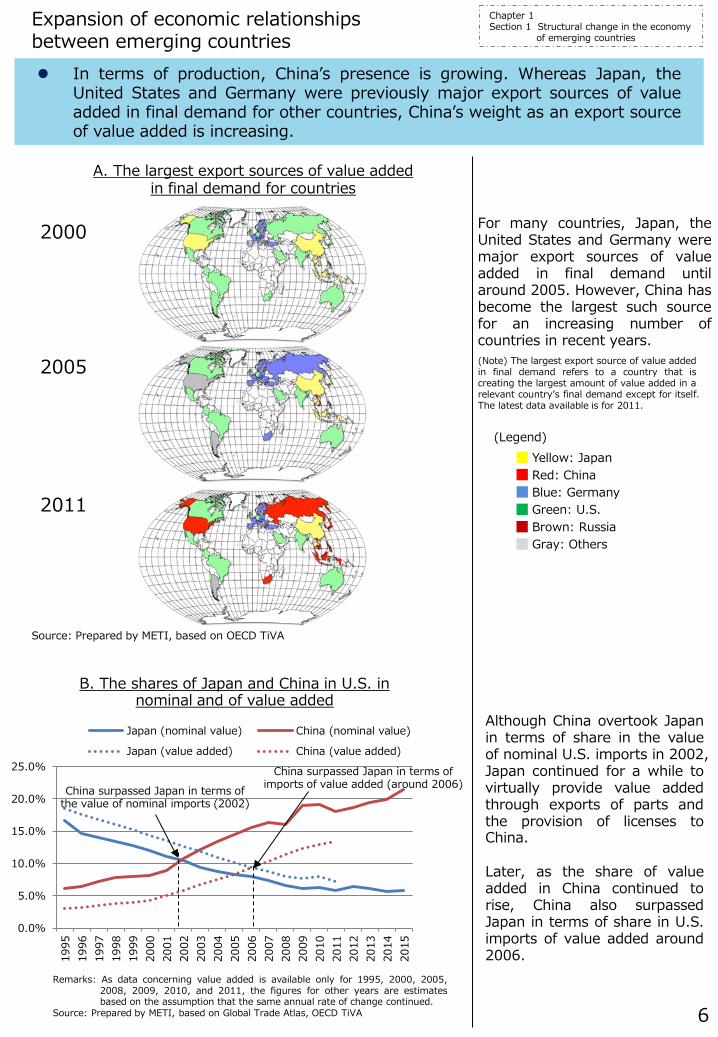
In terms of production, China’s presence is growing. Whereas Japan, the United States and Germany were previously major export sources of value added in final demand for other countries, China’s weight as an export source of value added is increasing.
Expansion of economic relationships between emerging countries
For many countries, Japan, the United States and Germany were major export sources of value added in final demand until around 2005. However, China has become the largest such source for an increasing number of countries in recent years.
Although China overtook Japan in terms of share in the value of nominal U.S. imports in 2002, Japan continued for a while to virtually provide value added through exports of parts and the provision of licenses to China. Later, as the share of value added in China continued to rise, China also surpassed Japan in terms of share in U.S. imports of value added around 2006.
2000
2011
Yellow: Japan Red: China Blue: Germany Green: U.S. Brown: Russia Gray: Others
2005
A. The largest export sources of value added in final demand for countries
Remarks: As data concerning value added is available only for 1995, 2000, 2005, 2008, 2009, 2010, and 2011, the figures for other years are estimates based on the assumption that the same annual rate of change continued.
Source: Prepared by METI, based on Global Trade Atlas, OECD TiVA
China surpassed Japan in terms of the value of nominal imports (2002)
China surpassed Japan in terms of imports of value added (around 2006)
(Note) The largest export source of value added in final demand refers to a country that is creating the largest amount of value added in a relevant country’s final demand except for itself. The latest data available is for 2011.
(Legend)
Source: Prepared by METI, based on OECD TiVA
Chapter 1 Section 1 Structural change in the economy
of emerging countries
B. The shares of Japan and China in U.S. in nominal and of value added
-4
-2
0
2
4
7
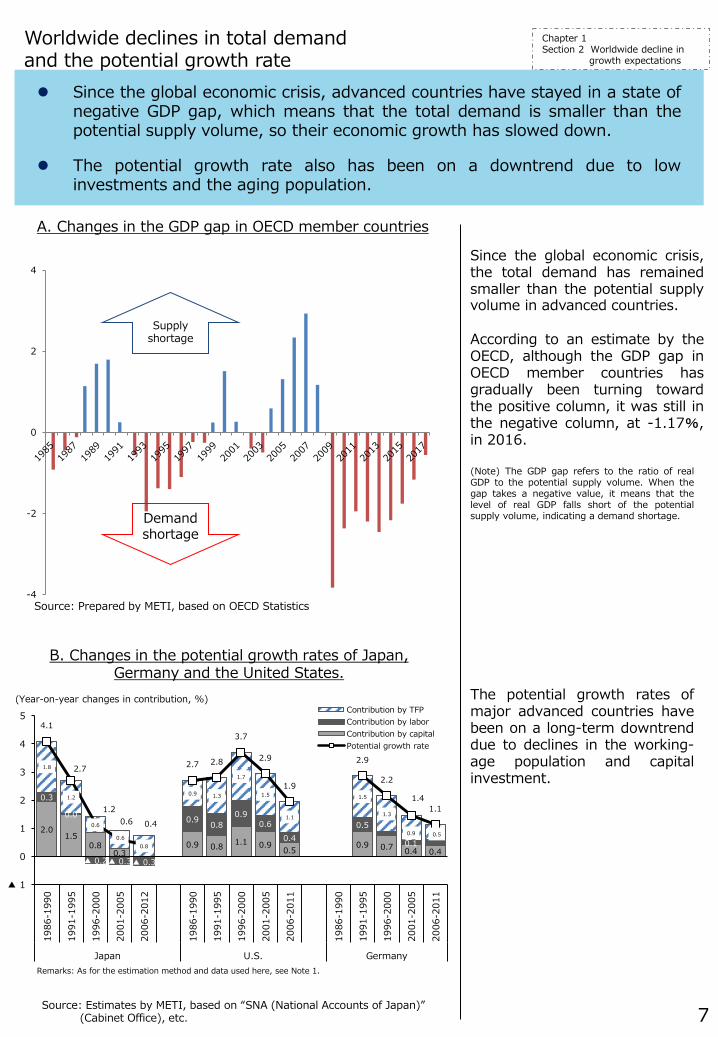
Since the global economic crisis, advanced countries have stayed in a state of negative GDP gap, which means that the total demand is smaller than the potential supply volume, so their economic growth has slowed down.
The potential growth rate also has been on a downtrend due to low investments and the aging population.
Worldwide declines in total demand and the potential growth rate
Since the global economic crisis, the total demand has remained smaller than the potential supply volume in advanced countries. According to an estimate by the OECD, although the GDP gap in OECD member countries has gradually been turning toward the positive column, it was still in the negative column, at -1.17%, in 2016.
The potential growth rates of major advanced countries have been on a long-term downtrend due to declines in the working-age population and capital investment.
(Note) The GDP gap refers to the ratio of real GDP to the potential supply volume. When the gap takes a negative value, it means that the level of real GDP falls short of the potential supply volume, indicating a demand shortage. Demand
shortage
Supply shortage
Source: Prepared by METI, based on OECD Statistics
Source: Estimates by METI, based on “SNA (National Accounts of Japan)” (Cabinet Office), etc.
Chapter 1 Section 2 Worldwide decline in
growth expectations
B. Changes in the potential growth rates of Japan, Germany and the United States.
A. Changes in the GDP gap in OECD member countries
(Year-on-year changes in contribution, %)
2.0 1.5
0.8 0.3
0.9 0.8 1.1 0.9 0.5 0.9 0.7 0.4 0.4
0.3
0.0
▲ 0.2 ▲ 0.3 ▲ 0.3
0.9 0.8 0.9
0.6 0.4
0.5
0.1 0.2
1.8
1.2
0.6
0.6 0.8
0.9 1.3
1.7
1.5
1.1
1.5
1.3
0.9 0.5
4.1
2.7
1.2 0.6 0.4
2.7 2.8
3.7
2.9
1.9
2.9
2.2
1.4 1.1
▲ 1
0
1
2
3
4
5
1986
-199
0
1991
-199
5
1996
-200
0
2001
-200
5
2006
-201
2
1986
-199
0
1991
-199
5
1996
-200
0
2001
-200
5
2006
-201
1
1986
-199
0
1991
-199
5
1996
-200
0
2001
-200
5
2006
-201
1
Japan U.S. Germany
Contribution by TFPContribution by laborContribution by capitalPotential growth rate
Remarks: As for the estimation method and data used here, see Note 1.
0.0
10.0
20.0
30.0
40.0
50.0
60.0
0.0% 10.0% 20.0% 30.0% 40.0% 50.0% 60.0%
Germany Japan ROK U.K. U.S.
7.7%
5.8%
4.3%
2.8%
1.5%
5.1%
1.9%
11.4
%
7.6%
7.0%
4.1%
3.5%
7.6%
3.5%
0%
4%
8%
12%
U.K
.
ROK
Germ
any
U.S
.
Japa
n
Germ
any
(Out
side
EU
)
U.K
.(O
utsi
de E
U)
2000
2014
8
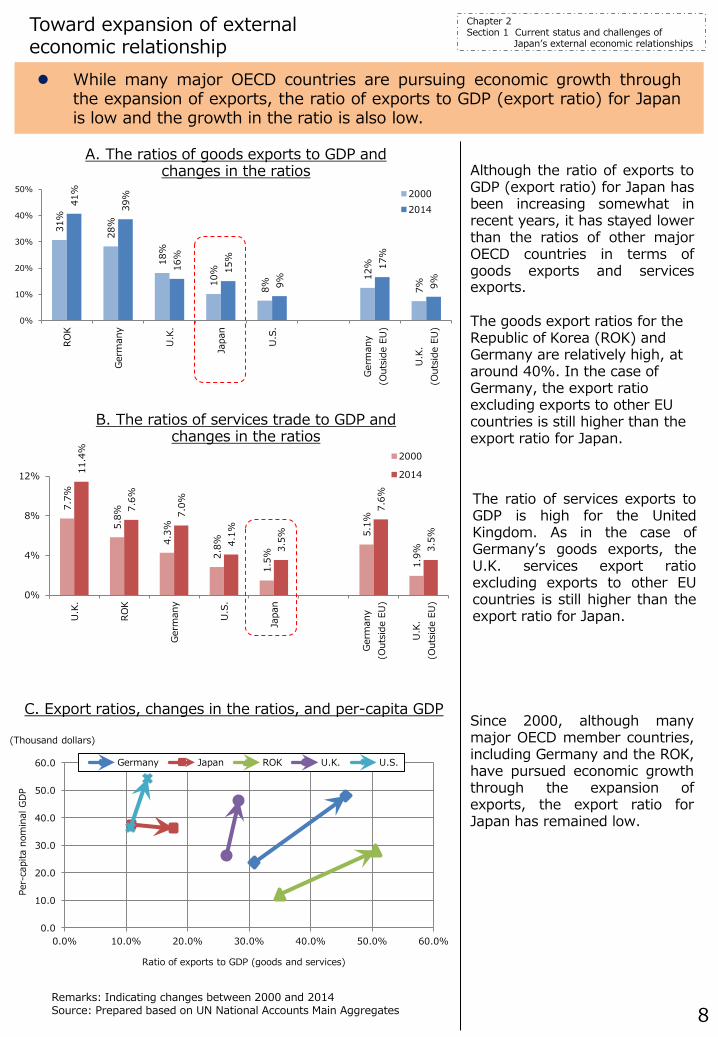
While many major OECD countries are pursuing economic growth through the expansion of exports, the ratio of exports to GDP (export ratio) for Japan is low and the growth in the ratio is also low.
Toward expansion of external economic relationship
Although the ratio of exports to GDP (export ratio) for Japan has been increasing somewhat in recent years, it has stayed lower than the ratios of other major OECD countries in terms of goods exports and services exports. The goods export ratios for the Republic of Korea (ROK) and Germany are relatively high, at around 40%. In the case of Germany, the export ratio excluding exports to other EU countries is still higher than the export ratio for Japan.
Since 2000, although many major OECD member countries, including Germany and the ROK, have pursued economic growth through the expansion of exports, the export ratio for Japan has remained low.
C. Export ratios, changes in the ratios, and per-capita GDP
Remarks: Indicating changes between 2000 and 2014 Source: Prepared based on UN National Accounts Main Aggregates
Chapter 2 Section 1 Current status and challenges of
Japan’s external economic relationships
The ratio of services exports to GDP is high for the United Kingdom. As in the case of Germany’s goods exports, the U.K. services export ratio excluding exports to other EU countries is still higher than the export ratio for Japan.
A. The ratios of goods exports to GDP and changes in the ratios
B. The ratios of services trade to GDP and changes in the ratios
Per-
capi
ta n
omin
al G
DP
Ratio of exports to GDP (goods and services)
(Thousand dollars)
31%
28%
18%
10%
8% 12
%
7%
41%
39%
16%
15%
9% 17
%
9%
0%
10%
20%
30%
40%
50%
ROK
Germ
any
U.K
.
Japa
n
U.S
.
Germ
any
(Out
side
EU
)
U.K
.(O
utsi
de E
U)
20002014
9
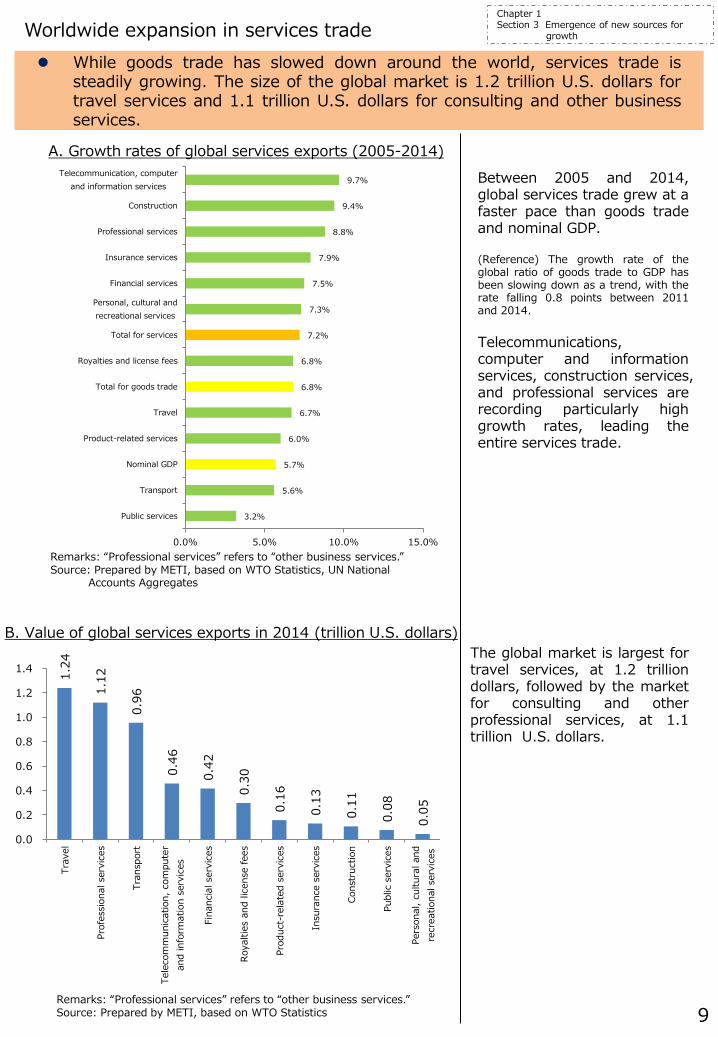
While goods trade has slowed down around the world, services trade is steadily growing. The size of the global market is 1.2 trillion U.S. dollars for travel services and 1.1 trillion U.S. dollars for consulting and other business services.
Worldwide expansion in services trade
Between 2005 and 2014, global services trade grew at a faster pace than goods trade and nominal GDP. (Reference) The growth rate of the global ratio of goods trade to GDP has been slowing down as a trend, with the rate falling 0.8 points between 2011 and 2014. Telecommunications, computer and information services, construction services, and professional services are recording particularly high growth rates, leading the entire services trade.
The global market is largest for travel services, at 1.2 trillion dollars, followed by the market for consulting and other professional services, at 1.1 trillion U.S. dollars.
Remarks: “Professional services” refers to “other business services.” Source: Prepared by METI, based on WTO Statistics, UN National
Accounts Aggregates
Remarks: “Professional services” refers to “other business services.” Source: Prepared by METI, based on WTO Statistics
Chapter 1 Section 3 Emergence of new sources for growth
A. Growth rates of global services exports (2005-2014)
B. Value of global services exports in 2014 (trillion U.S. dollars)
3.2%
5.6%
5.7%
6.0%
6.7%
6.8%
6.8%
7.2%
7.3%
7.5%
7.9%
8.8%
9.4%
9.7%
0.0% 5.0% 10.0% 15.0%
Public services
Transport
Nominal GDP
Product-related services
Travel
Total for goods trade
Royalties and license fees
Total for services
Personal, cultural andrecreational services
Financial services
Insurance services
Professional services
Construction
Telecommunication, computerand information services
1.24
1.12
0.96
0.46
0.42
0.30
0.16
0.13
0.11
0.08
0.05
0.0
0.2
0.4
0.6
0.8
1.0
1.2
1.4
Trav
el
Prof
essi
onal
ser
vice
s
Tran
spor
t
Tele
com
mun
icat
ion,
com
pute
ran
d in
form
atio
n se
rvic
es
Fina
ncia
l ser
vice
s
Roya
lties
and
lice
nse
fees
Prod
uct-
rela
ted
serv
ices
Insu
ranc
e se
rvic
es
Cons
truc
tion
Publ
ic s
ervi
ces
Pers
onal
, cul
tura
l and
recr
eatio
nal s
ervi
ces
3.1%
3.0%
2.3%
2.0%
1.5%
1.5%
1.4%
0.9%
0.9%
0.8%
0.8%
0.7%
0.7%
0.7%
0.6%
0.5%
0.0%
0.0%
0.0%
1.4%
0.0%
0.5%
1.0%
1.5%
2.0%
2.5%
3.0%
3.5%
U.K
.
Fran
ce
Indi
a
Germ
any
Cana
da
ROK
Ital
y
Braz
il
Russ
ia
Arge
ntin
a
Japa
n
U.S
.
Indo
nesi
a
Chin
a
Sout
h Af
rica
Aust
ralia
Turk
ey
Saud
i Ara
bia
Mex
ico
Aver
age
6.2 9.3
7.8
2.5
012345678910
0
10
20
30
40
50
60
70
U.S. U.K. Germany Japan
Export value (2014)
Average annualgrowth rates (2010-2014, right axis)
10
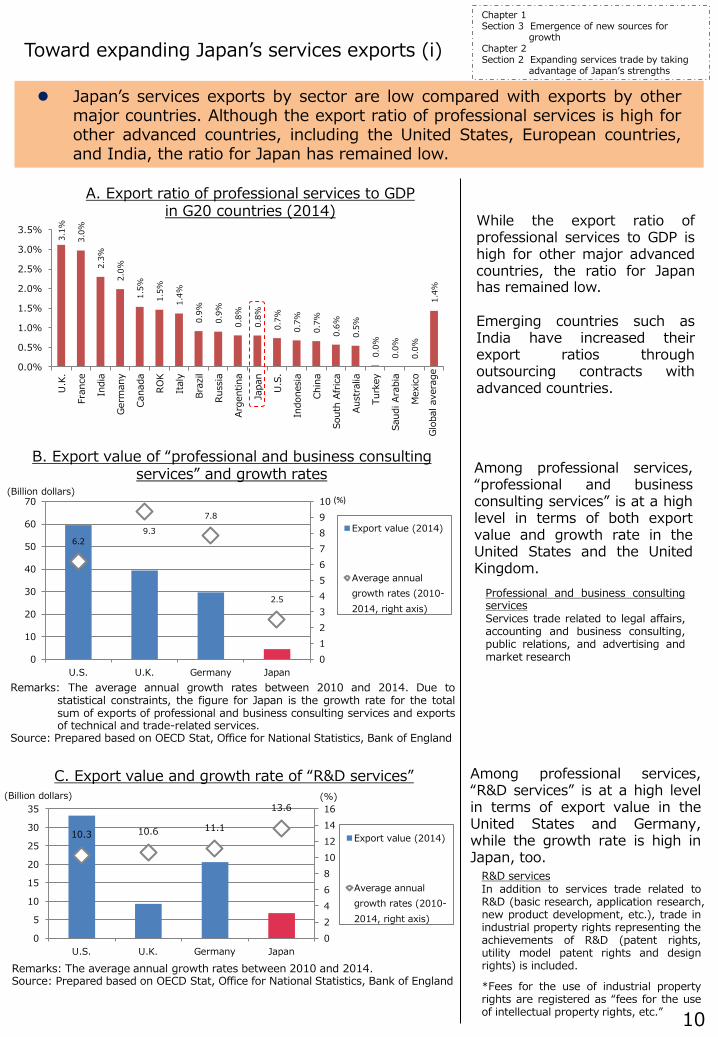
Japan’s services exports by sector are low compared with exports by other major countries. Although the export ratio of professional services is high for other advanced countries, including the United States, European countries, and India, the ratio for Japan has remained low.
Toward expanding Japan’s services exports (i)
While the export ratio of professional services to GDP is high for other major advanced countries, the ratio for Japan has remained low. Emerging countries such as India have increased their export ratios through outsourcing contracts with advanced countries.
Among professional services, “professional and business consulting services” is at a high level in terms of both export value and growth rate in the United States and the United Kingdom.
A. Export ratio of professional services to GDP in G20 countries (2014)
B. Export value of “professional and business consulting services” and growth rates
C. Export value and growth rate of “R&D services” Among professional services, “R&D services” is at a high level in terms of export value in the United States and Germany, while the growth rate is high in Japan, too.
Professional and business consulting services Services trade related to legal affairs, accounting and business consulting, public relations, and advertising and market research
R&D services In addition to services trade related to R&D (basic research, application research, new product development, etc.), trade in industrial property rights representing the achievements of R&D (patent rights, utility model patent rights and design rights) is included.
*Fees for the use of industrial property rights are registered as “fees for the use of intellectual property rights, etc.”
Chapter 1 Section 3 Emergence of new sources for
growth Chapter 2 Section 2 Expanding services trade by taking
advantage of Japan’s strengths
(Billion dollars) (%)
(Billion dollars) (%)
10.3 10.6 11.1
13.6
0246810121416
0
5
10
15
20
25
30
35
U.S. U.K. Germany Japan
Export value (2014)
Average annualgrowth rates (2010-2014, right axis)
Remarks: The average annual growth rates between 2010 and 2014. Source: Prepared based on OECD Stat, Office for National Statistics, Bank of England
Remarks: The average annual growth rates between 2010 and 2014. Due to statistical constraints, the figure for Japan is the growth rate for the total sum of exports of professional and business consulting services and exports of technical and trade-related services.
Source: Prepared based on OECD Stat, Office for National Statistics, Bank of England
Glob
al a
vera
ge
0.8% 0.8%
0.5% 0.4% 0.4% 0.4%
0.2% 0.2% 0.1%
0.0% 0.0% 0.0% 0.0% 0.0% 0.0% 0.0% 0.0%
0.4%
0.0%
0.2%
0.4%
0.6%
0.8%
1.0%
Japa
n
U.S.
U.K.
Fran
ce
ROK
Germ
any
Cana
da
Ital
y
Aust
ralia
Russ
ia
Sout
h Af
rica
Indi
a
Arge
ntin
a
Braz
il
Mex
ico
Indo
nesi
a
Chin
a
Aver
age
2.5%
1.8% 1.8% 1.5%
1.3% 1.1%
0.9% 0.9% 0.9% 0.7% 0.7%
0.5% 0.5% 0.4% 0.4% 0.4% 0.4% 0.2% 0.1%
1.2%
0.0%
0.5%
1.0%
1.5%
2.0%
2.5%
3.0%
ROK
Fran
ce
Turk
ey
Germ
any
U.K.
Russ
ia
Indi
a
Sout
h Af
rica
Japa
n
Cana
da
Ital
y
U.S.
Arge
ntin
a
Indo
nesi
a
Aust
ralia
Chin
a
Saud
i Ara
bia
Braz
il
Mex
ico
Aver
age
2.5%
0.5% 0.5% 0.5% 0.4% 0.3% 0.3% 0.2% 0.2% 0.2% 0.1% 0.1% 0.1% 0.1% 0.0% 0.0% 0.0% 0.0% 0.0%
0.5%
0.0%
0.5%
1.0%
1.5%
2.0%
2.5%
3.0%
U.K.
Germ
any
Fran
ce
U.S.
Cana
da
Indi
a
Ital
y
Sout
h Af
rica
Aust
ralia
Japa
n
Turk
ey
ROK
Russ
ia
Braz
il
Chin
a
Saud
i Ara
bia
Indo
nesi
a
Arge
ntin
a
Mex
ico
Aver
age
0
0.2
0.4
0.6Accounting
Architecture
Engineering
Legal
Motion pictures
Broadcasting
Sound recording
Telecommunications
Air transportMaritime transport
Freight transport
Rail freight transport
Courier
Distribution
Commercial banking
Insurance
Computer services
Construction
Average for OECDmember countries
Average for OECDmember countries
11
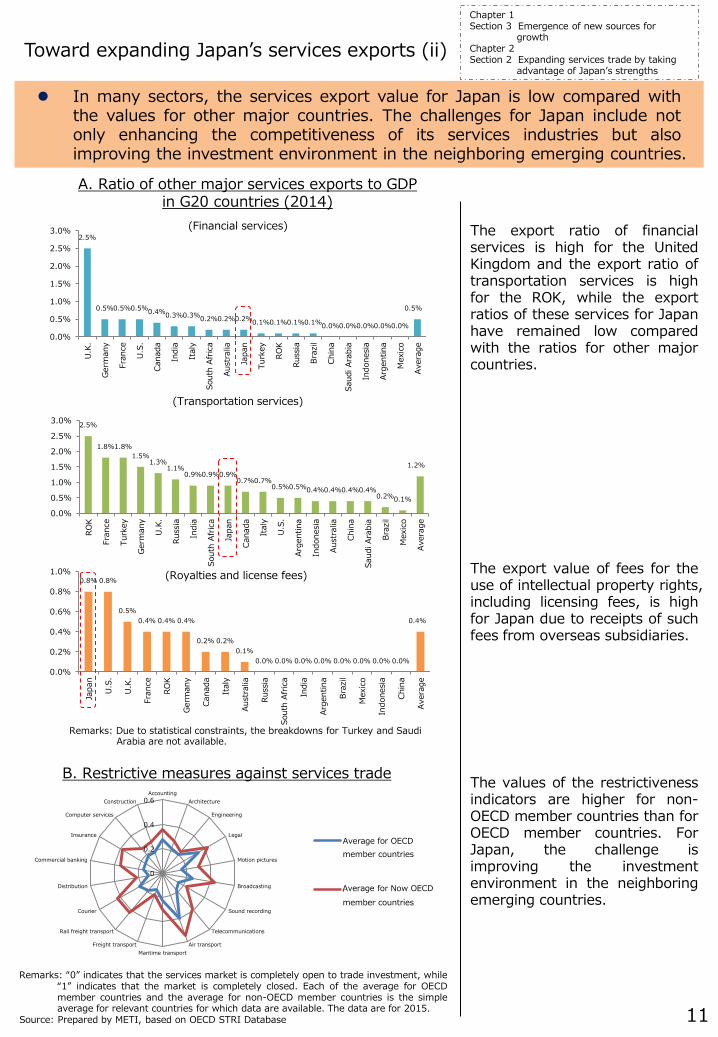
In many sectors, the services export value for Japan is low compared with the values for other major countries. The challenges for Japan include not only enhancing the competitiveness of its services industries but also improving the investment environment in the neighboring emerging countries.
Toward expanding Japan’s services exports (ii)
The export ratio of financial services is high for the United Kingdom and the export ratio of transportation services is high for the ROK, while the export ratios of these services for Japan have remained low compared with the ratios for other major countries.
The export value of fees for the use of intellectual property rights, including licensing fees, is high for Japan due to receipts of such fees from overseas subsidiaries.
A. Ratio of other major services exports to GDP in G20 countries (2014)
The values of the restrictiveness indicators are higher for non-OECD member countries than for OECD member countries. For Japan, the challenge is improving the investment environment in the neighboring emerging countries.
Remarks: “0” indicates that the services market is completely open to trade investment, while “1” indicates that the market is completely closed. Each of the average for OECD member countries and the average for non-OECD member countries is the simple average for relevant countries for which data are available. The data are for 2015.
Source: Prepared by METI, based on OECD STRI Database
Chapter 1 Section 3 Emergence of new sources for
growth Chapter 2 Section 2 Expanding services trade by taking
advantage of Japan’s strengths
Remarks: Due to statistical constraints, the breakdowns for Turkey and Saudi Arabia are not available.
(Financial services)
(Transportation services)
(Royalties and license fees)
B. Restrictive measures against services trade
Average for Now OECD
2.7%
0.8%
0.7%
0.6%
0.5%
0.4%
0.3%
0.2%
0.2%
0.2%
0.2%
0.2%
0.1%
0.1%
0.1%
0.1%
0.0%
0.0%
0.0%
0.6%
0.0%
0.5%
1.0%
1.5%
2.0%
2.5%
3.0%
Indi
a
Germ
any
U.K
.
Fran
ce
Cana
da
Ital
y
Arge
ntin
a
Russ
ia
ROK
U.S
.
Chin
a
Sout
h Af
rica
Aust
ralia
Indo
nesi
a
Japa
n
Braz
il
Turk
ey
Saud
i Ara
bia
Mex
ico
Aver
age
A. Export ratio of telecommunications, computer and information services to GDP in major countries (2014)
11.7 12.3 12.1
6.0
10.3
25.1
32.8
0
5
10
15
20
25
30
35
0
2
4
6
8
10
12
14
16
18
20
U.S. Singapore France Germany Switzerland Japan U.K.
12
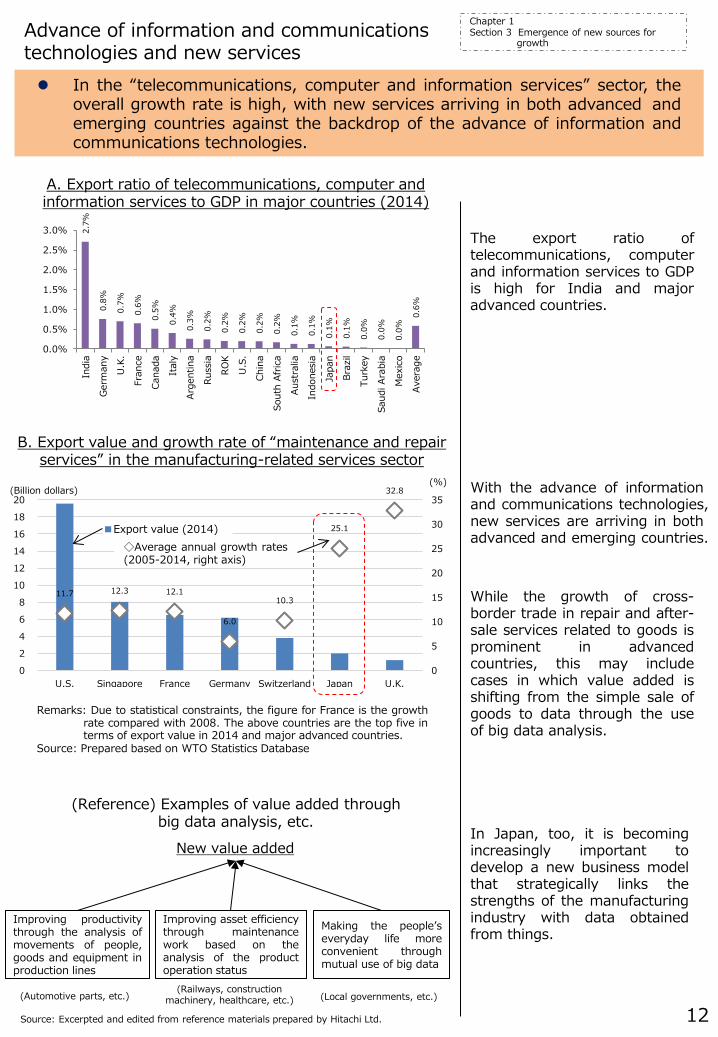
In the “telecommunications, computer and information services” sector, the overall growth rate is high, with new services arriving in both advanced and emerging countries against the backdrop of the advance of information and communications technologies.
Advance of information and communications technologies and new services
The export ratio of telecommunications, computer and information services to GDP is high for India and major advanced countries.
While the growth of cross-border trade in repair and after-sale services related to goods is prominent in advanced countries, this may include cases in which value added is shifting from the simple sale of goods to data through the use of big data analysis.
B. Export value and growth rate of “maintenance and repair services” in the manufacturing-related services sector
Chapter 1 Section 3 Emergence of new sources for
growth
With the advance of information and communications technologies, new services are arriving in both advanced and emerging countries.
(Reference) Examples of value added through big data analysis, etc.
Remarks: Due to statistical constraints, the figure for France is the growth rate compared with 2008. The above countries are the top five in terms of export value in 2014 and major advanced countries.
Source: Prepared based on WTO Statistics Database
■Export value (2014) ◇Average annual growth rates (2005-2014, right axis)
In Japan, too, it is becoming increasingly important to develop a new business model that strategically links the strengths of the manufacturing industry with data obtained from things.
Improving productivity through the analysis of movements of people, goods and equipment in production lines
Improving asset efficiency through maintenance work based on the analysis of the product operation status
Making the people’s everyday life more convenient through mutual use of big data
(Automotive parts, etc.) (Railways, construction
machinery, healthcare, etc.) (Local governments, etc.)
New value added
Source: Excerpted and edited from reference materials prepared by Hitachi Ltd.
(Billion dollars) (%)
0
500
1000
1500
2000
(Tb/s)
13
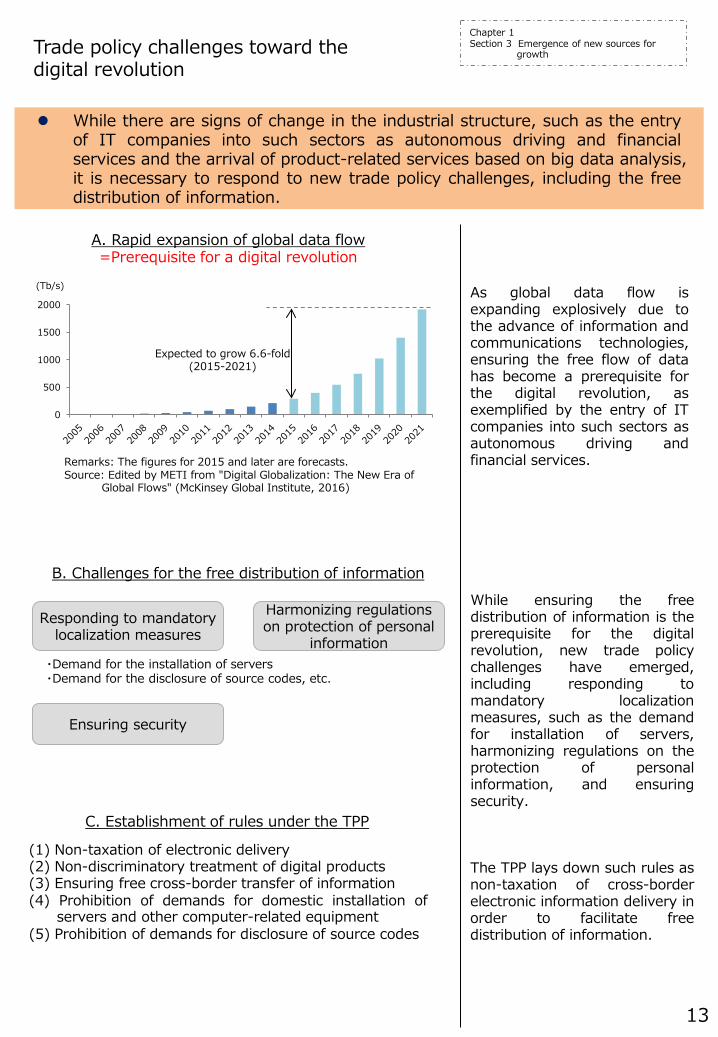
While there are signs of change in the industrial structure, such as the entry of IT companies into such sectors as autonomous driving and financial services and the arrival of product-related services based on big data analysis, it is necessary to respond to new trade policy challenges, including the free distribution of information.
Trade policy challenges toward the digital revolution
As global data flow is expanding explosively due to the advance of information and communications technologies, ensuring the free flow of data has become a prerequisite for the digital revolution, as exemplified by the entry of IT companies into such sectors as autonomous driving and financial services.
While ensuring the free distribution of information is the prerequisite for the digital revolution, new trade policy challenges have emerged, including responding to mandatory localization measures, such as the demand for installation of servers, harmonizing regulations on the protection of personal information, and ensuring security.
Remarks: The figures for 2015 and later are forecasts. Source: Edited by METI from "Digital Globalization: The New Era of
Global Flows" (McKinsey Global Institute, 2016)
Responding to mandatory localization measures
Harmonizing regulations on protection of personal
information
Ensuring security
・Demand for the installation of servers ・Demand for the disclosure of source codes, etc.
B. Challenges for the free distribution of information
C. Establishment of rules under the TPP
(1) Non-taxation of electronic delivery (2) Non-discriminatory treatment of digital products (3) Ensuring free cross-border transfer of information (4) Prohibition of demands for domestic installation of
servers and other computer-related equipment (5) Prohibition of demands for disclosure of source codes
The TPP lays down such rules as non-taxation of cross-border electronic information delivery in order to facilitate free distribution of information.
Chapter 1 Section 3 Emergence of new sources for
growth
Expected to grow 6.6-fold (2015-2021)
A. Rapid expansion of global data flow =Prerequisite for a digital revolution
8 17
11 8
6
5
57
55
50
51
47
47
0
20
40
60Salary
Working hours
Sense of fulfillment/sense of doing something
worthwhile
Evaluation of achievements
Career prospects within the company
In-house education and training and support for self-
improvement JapanU.S.
18.9
24.3
26.8
52.5
22.1
37.9
36.9
29.2
55.3
21.9
58.4
26.6
79.7
73.1
50.5
0
10
20
30
40
50
60
70
80
90
India China U.S. Indonesia
JapanGermanyU.K.U.S.
14
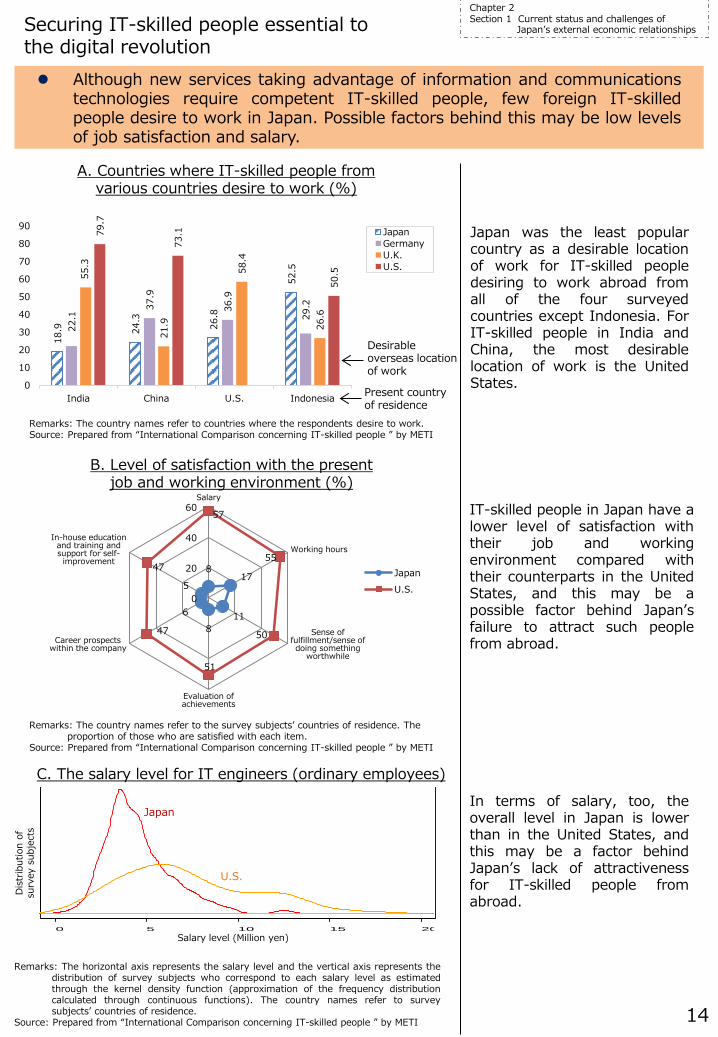
Although new services taking advantage of information and communications technologies require competent IT-skilled people, few foreign IT-skilled people desire to work in Japan. Possible factors behind this may be low levels of job satisfaction and salary.
Securing IT-skilled people essential to the digital revolution
B. Level of satisfaction with the present job and working environment (%)
Remarks: The country names refer to countries where the respondents desire to work. Source: Prepared from “International Comparison concerning IT-skilled people ” by METI
A. Countries where IT-skilled people from various countries desire to work (%)
Present country of residence
Desirable overseas location of work
Remarks: The country names refer to the survey subjects’ countries of residence. The proportion of those who are satisfied with each item.
Source: Prepared from “International Comparison concerning IT-skilled people ” by METI
C. The salary level for IT engineers (ordinary employees)
Remarks: The horizontal axis represents the salary level and the vertical axis represents the distribution of survey subjects who correspond to each salary level as estimated through the kernel density function (approximation of the frequency distribution calculated through continuous functions). The country names refer to survey subjects’ countries of residence.
Source: Prepared from “International Comparison concerning IT-skilled people ” by METI
Japan was the least popular country as a desirable location of work for IT-skilled people desiring to work abroad from all of the four surveyed countries except Indonesia. For IT-skilled people in India and China, the most desirable location of work is the United States.
IT-skilled people in Japan have a lower level of satisfaction with their job and working environment compared with their counterparts in the United States, and this may be a possible factor behind Japan’s failure to attract such people from abroad.
In terms of salary, too, the overall level in Japan is lower than in the United States, and this may be a factor behind Japan’s lack of attractiveness for IT-skilled people from abroad.
Chapter 2 Section 1 Current status and challenges of
Japan’s external economic relationships
0 5 10 15 20
Dis
trib
utio
n of
su
rvey
sub
ject
s
Salary level (Million yen)
Japan
U.S.
9.5%
3.7%
2.7%
2.2%
2.1%
2.0%
1.6%
1.3%
1.3%
1.2%
1.1%
1.1%
1.0%
1.0%
1.0%
0.9%
0.6%
0.5%
0.4%
0.3%
1.6%
0%
2%
4%
6%
8%
10%
Thai
land
Turk
ey
Sout
h Af
rica
Aust
ralia
Ital
y
Fran
ce
U.K.
ROK
Mex
ico
Indo
nesi
a
Germ
any
Saud
i Ara
bia
U.S.
Cana
da
Indi
a
Arge
ntin
a
Russ
ia
Chin
a
Japa
n
Braz
il
Glob
al to
tal
2.6 (4.63 million)
1.3 (7.9 nights) 0.6
(169 dollars)
2.1 (6.2 billion dollars)
The number of tourists Number of days ofovernight stay/person
Value ofconsumption/day
Tourism revenue
1.2 (0.73 million)
1.4 (14.3 nights) 1.0
(153 dollars)
1.8 (1.6 billion dollars)
The number of tourists Number of days ofovernight stay/person
Value ofconsumption/day
Tourism revenue
6.0 (0.87 million)
1.3 (17.1 nights)
1.0 (126 dollars)
7.5 (1.9 billion dollars)
The number of tourists Number of days ofovernight stay/person
Value ofconsumption/day
Tourism revenue
15
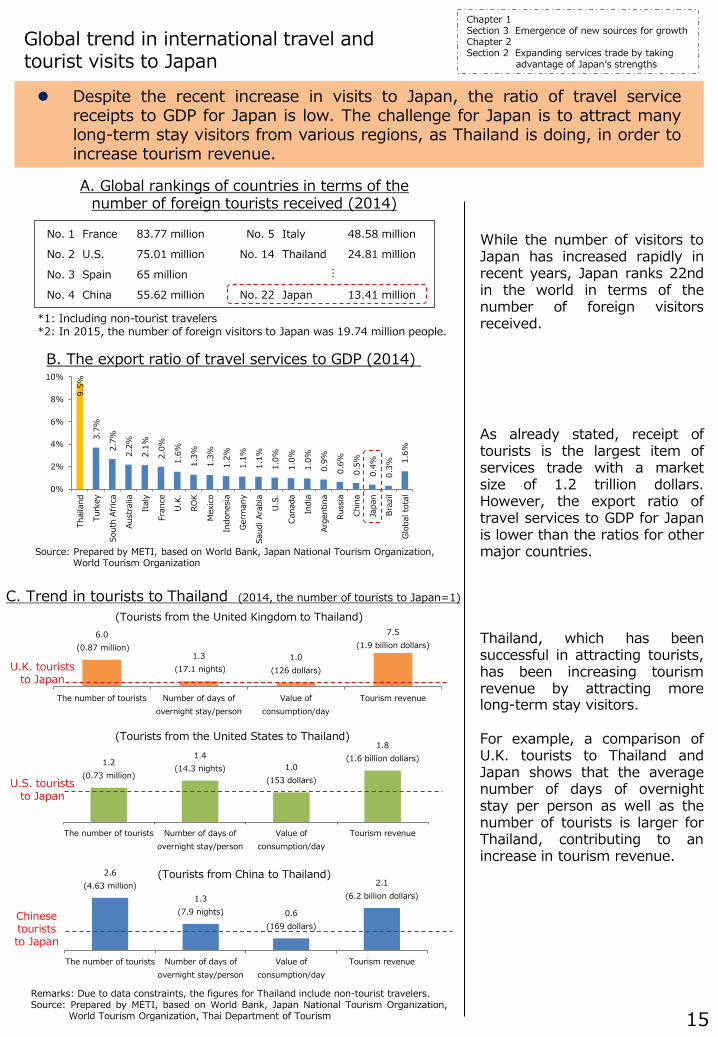
Despite the recent increase in visits to Japan, the ratio of travel service receipts to GDP for Japan is low. The challenge for Japan is to attract many long-term stay visitors from various regions, as Thailand is doing, in order to increase tourism revenue.
Global trend in international travel and tourist visits to Japan
While the number of visitors to Japan has increased rapidly in recent years, Japan ranks 22nd in the world in terms of the number of foreign visitors received.
As already stated, receipt of tourists is the largest item of services trade with a market size of 1.2 trillion dollars. However, the export ratio of travel services to GDP for Japan is lower than the ratios for other major countries.
Thailand, which has been successful in attracting tourists, has been increasing tourism revenue by attracting more long-term stay visitors. For example, a comparison of U.K. tourists to Thailand and Japan shows that the average number of days of overnight stay per person as well as the number of tourists is larger for Thailand, contributing to an increase in tourism revenue.
No. 1 France 83.77 million No. 5 Italy 48.58 million
No. 2 U.S. 75.01 million No. 14 Thailand 24.81 million
No. 3 Spain 65 million
…
No. 4 China 55.62 million No. 22 Japan 13.41 million
A. Global rankings of countries in terms of the number of foreign tourists received (2014)
B. The export ratio of travel services to GDP (2014)
*1: Including non-tourist travelers *2: In 2015, the number of foreign visitors to Japan was 19.74 million people.
Source: Prepared by METI, based on World Bank, Japan National Tourism Organization, World Tourism Organization
U.K. tourists to Japan
U.S. tourists to Japan
C. Trend in tourists to Thailand (2014, the number of tourists to Japan=1)
Chinese tourists to Japan
Remarks: Due to data constraints, the figures for Thailand include non-tourist travelers. Source: Prepared by METI, based on World Bank, Japan National Tourism Organization,
World Tourism Organization, Thai Department of Tourism
Chapter 1 Section 3 Emergence of new sources for growth Chapter 2 Section 2 Expanding services trade by taking advantage of Japan’s strengths
(Tourists from the United Kingdom to Thailand)
(Tourists from the United States to Thailand)
(Tourists from China to Thailand)
0% 20% 40% 60% 80%
Medical treatment/medical check-up
Other sports (golf, etc.)
None of the above
Spectator sport (Sumo, soccer, etc.)
Performance (Kabuki, theater, music, etc.)
Ski/snowboard
Visiting film/anime settings
Nature tours, experience in farming/fishing village
Enjoying Japanese pop culture (fashion, animation, etc.)
Seasons (cherry blossoms, autumn leaves, winter etc.)
Galleries/museums
Experiencing Japanese everyday life
Experiencing Japanese history/culture
Drinking Japanese alcoholic beverages (Japanese Sake & Shochu)
Theme parks
Staying in a Japanese-style inn
Bathing in a hot spring
Walking in shopping districts
Nature/Scenery sightseeing
Shopping
Eating Japanese food
What to do next timeWanted to do before visiting Japan
1time 45%
2 times 19%
3 times 10%
4 times 6%
5 times 5%
6~9 times 6%
10~19 times 5%
20 times and over 4%
16
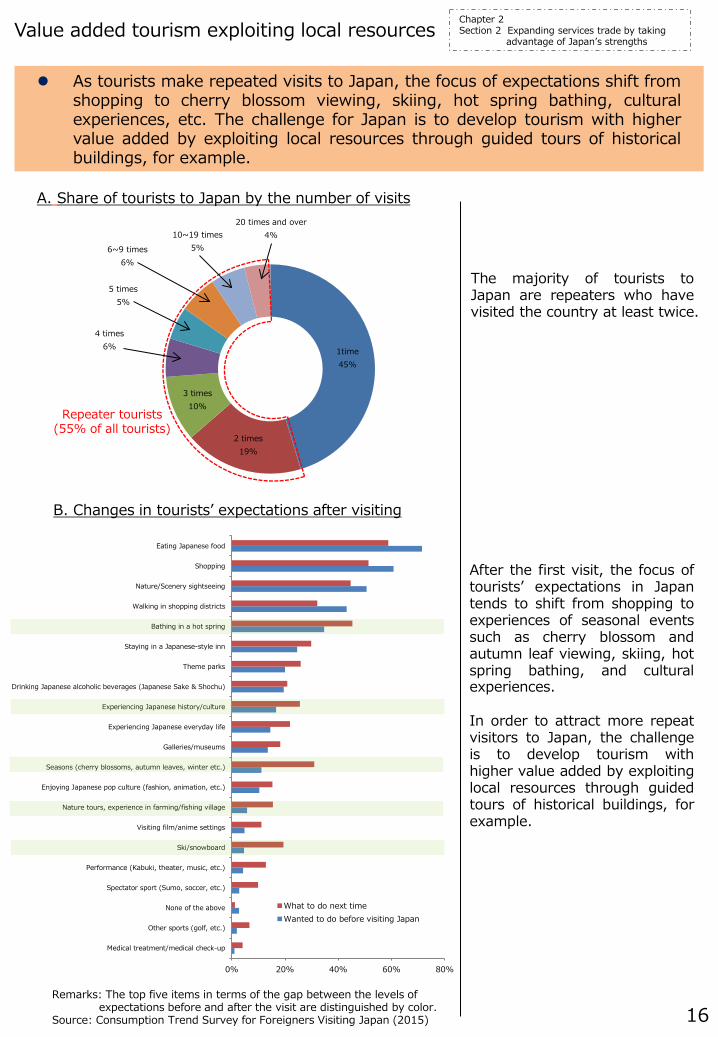
As tourists make repeated visits to Japan, the focus of expectations shift from shopping to cherry blossom viewing, skiing, hot spring bathing, cultural experiences, etc. The challenge for Japan is to develop tourism with higher value added by exploiting local resources through guided tours of historical buildings, for example.
Value added tourism exploiting local resources
Repeater tourists (55% of all tourists)
The majority of tourists to Japan are repeaters who have visited the country at least twice.
After the first visit, the focus of tourists’ expectations in Japan tends to shift from shopping to experiences of seasonal events such as cherry blossom and autumn leaf viewing, skiing, hot spring bathing, and cultural experiences. In order to attract more repeat visitors to Japan, the challenge is to develop tourism with higher value added by exploiting local resources through guided tours of historical buildings, for example.
Chapter 2 Section 2 Expanding services trade by taking
advantage of Japan’s strengths
B. Changes in tourists’ expectations after visiting
Remarks: The top five items in terms of the gap between the levels of expectations before and after the visit are distinguished by color.
Source: Consumption Trend Survey for Foreigners Visiting Japan (2015)
A. Share of tourists to Japan by the number of visits
U.S. EU China Asian NIEs Others World1. Foods 0.01% 0.00% 0.00% 0.02% 0.02% 0.05%2. Crude materials 0.01% 0.00% 0.01% 0.00% 0.03% 0.05%3. Mineral fuel 0.00% -0.01% -0.02% 0.03% 0.04% 0.04%4. Chemicals 0.06% 0.01% 0.10% 0.00% 0.06% 0.24%5. Manufactured goods 0.10% 0.01% -0.05% -0.13% 0.19% 0.12%6. Machinery 0.32% 0.03% -0.11% -0.08% 0.16% 0.31%7. Electrical machinery 0.15% -0.01% 0.02% 0.01% 0.02% 0.18%8. Transport equipment 0.61% 0.08% -0.04% 0.04% 0.13% 0.82%9. Others 0.12% -0.01% 0.14% 0.23% 0.02% 0.51%Total 1.37% 0.10% 0.04% 0.13% 0.68% 2.33%
U.S. 20.1%
EU 10.6%
China 17.5%
Asian NIEs 21.7%
Others 30.1%
17
Source: Prepared by METI from “Trade Statistics of Japan” (MOF) “Census of Manufacture” (METI)
Japanese exports are concentrated in some specific sectors
A. Shares of items in Japanese exports and contributions to the growth rate
Total growth: 2.3% (2010-2015)
B. Countries’ shares in Japanese exports and contributions to the growth rate
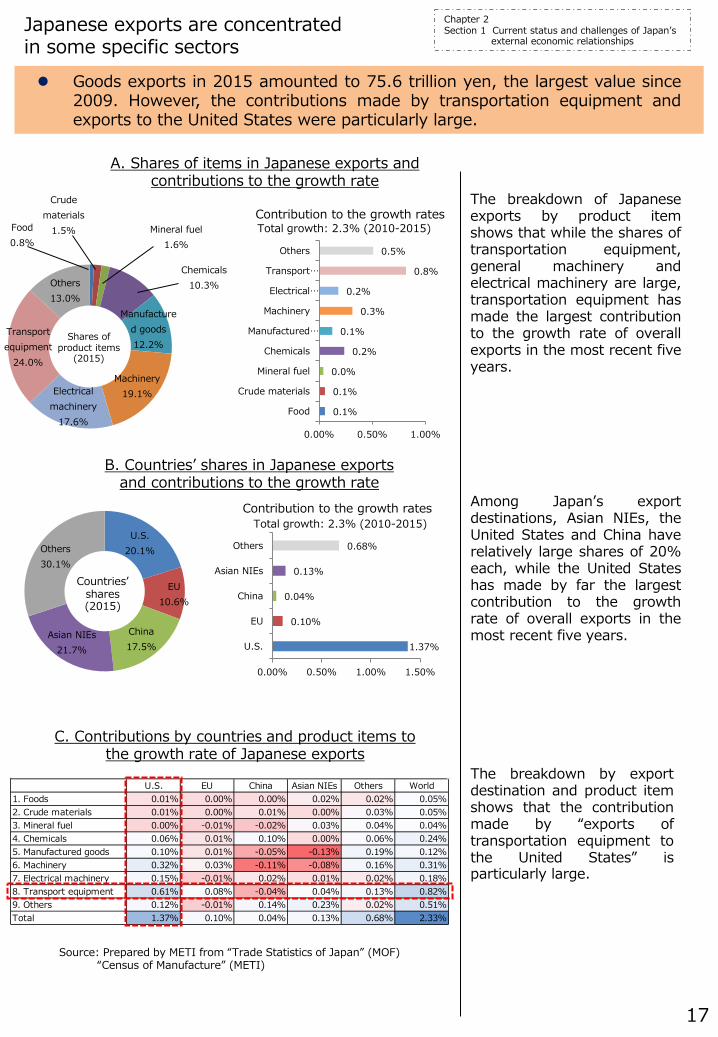
The breakdown of Japanese exports by product item shows that while the shares of transportation equipment, general machinery and electrical machinery are large, transportation equipment has made the largest contribution to the growth rate of overall exports in the most recent five years.
Goods exports in 2015 amounted to 75.6 trillion yen, the largest value since 2009. However, the contributions made by transportation equipment and exports to the United States were particularly large.
Among Japan’s export destinations, Asian NIEs, the United States and China have relatively large shares of 20% each, while the United States has made by far the largest contribution to the growth rate of overall exports in the most recent five years.
C. Contributions by countries and product items to the growth rate of Japanese exports
The breakdown by export destination and product item shows that the contribution made by “exports of transportation equipment to the United States” is particularly large.
Chapter 2 Section 1 Current status and challenges of Japan’s
external economic relationships
Shares of product items
(2015)
Food 0.8%
Crude materials
1.5% Mineral fuel 1.6%
Chemicals 10.3%
Manufactured goods 12.2%
Machinery 19.1% Electrical
machinery 17.6%
Transport equipment
24.0%
Others 13.0%
Countries’ shares (2015)
1.37%
0.10%
0.04%
0.13%
0.68%
0.00% 0.50% 1.00% 1.50%
U.S.
EU
China
Asian NIEs
Others
0.1%
0.1%
0.0%
0.2%
0.1%
0.3%
0.2%
0.8%
0.5%
0.00% 0.50% 1.00%
Food
Crude materials
Mineral fuel
Chemicals
Manufactured…
Machinery
Electrical…
Transport…
Others
Contribution to the growth rates
Total growth: 2.3% (2010-2015) Contribution to the growth rates
18
Source: Prepared by METI from “Trade Statistics of Japan” (MOF), “Census of Manufacture” (METI)
Japanese exports are concentrated in some specific sectors
A. Annual average growth rate of the manufacturing industry by region (2010-2014)
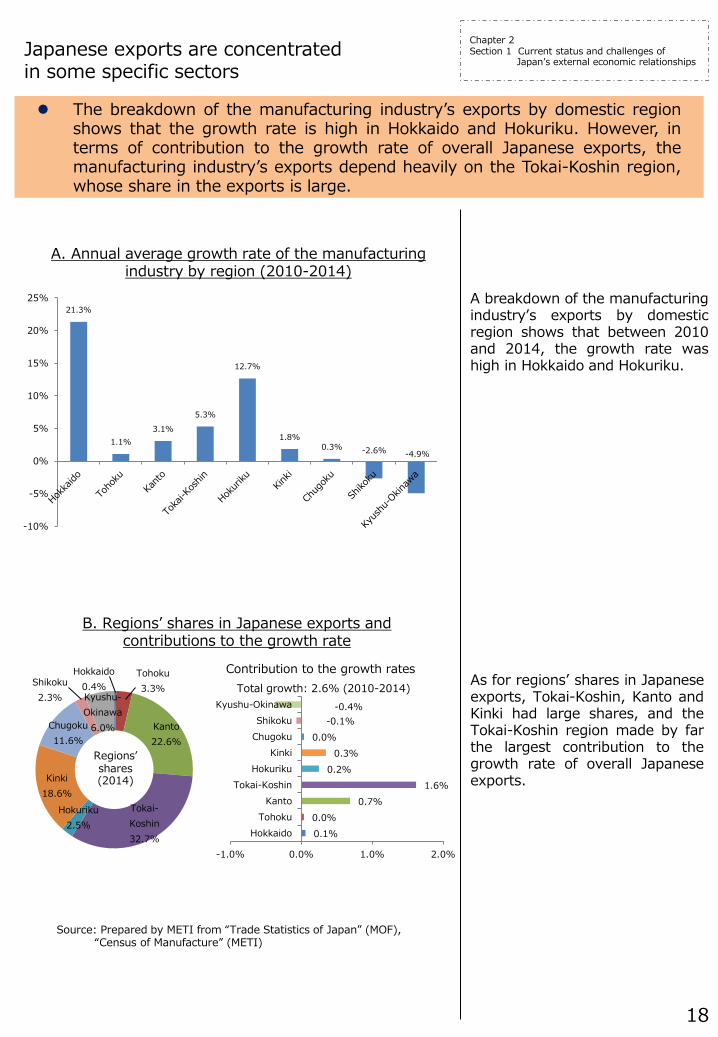
A breakdown of the manufacturing industry’s exports by domestic region shows that between 2010 and 2014, the growth rate was high in Hokkaido and Hokuriku.
The breakdown of the manufacturing industry’s exports by domestic region shows that the growth rate is high in Hokkaido and Hokuriku. However, in terms of contribution to the growth rate of overall Japanese exports, the manufacturing industry’s exports depend heavily on the Tokai-Koshin region, whose share in the exports is large.
As for regions’ shares in Japanese exports, Tokai-Koshin, Kanto and Kinki had large shares, and the Tokai-Koshin region made by far the largest contribution to the growth rate of overall Japanese exports.
B. Regions’ shares in Japanese exports and contributions to the growth rate
Total growth: 2.6% (2010-2014)
Chapter 2 Section 1 Current status and challenges of
Japan’s external economic relationships
Regions’ shares (2014)
21.3%
1.1% 3.1%
5.3%
12.7%
1.8% 0.3% -2.6% -4.9%
-10%
-5%
0%
5%
10%
15%
20%
25%
Hokkaido 0.4%
Tohoku 3.3%
Kanto 22.6%
Tokai-Koshin 32.7%
Hokuriku 2.5%
Kinki 18.6%
Chugoku 11.6%
Shikoku 2.3% Kyushu-
Okinawa 6.0%
0.1% 0.0%
0.7% 1.6%
0.2% 0.3%
0.0% -0.1%
-0.4%
-1.0% 0.0% 1.0% 2.0%
HokkaidoTohoku
KantoTokai-Koshin
HokurikuKinki
ChugokuShikoku
Kyushu-Okinawa
Contribution to the growth rates
0 1 2 3 4 5
0.00.5
1.01.5
2.0
19
Current status of Germany, where exports by regions are robust
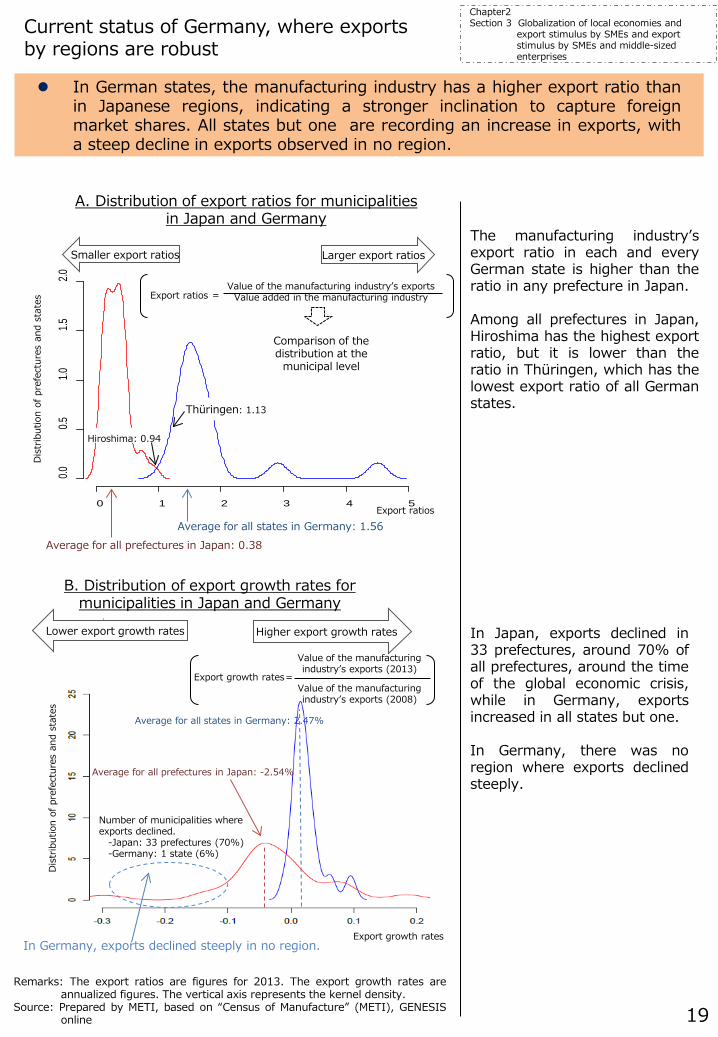
The manufacturing industry’s export ratio in each and every German state is higher than the ratio in any prefecture in Japan. Among all prefectures in Japan, Hiroshima has the highest export ratio, but it is lower than the ratio in Thüringen, which has the lowest export ratio of all German states.
In German states, the manufacturing industry has a higher export ratio than in Japanese regions, indicating a stronger inclination to capture foreign market shares. All states but one are recording an increase in exports, with a steep decline in exports observed in no region.
Remarks: The export ratios are figures for 2013. The export growth rates are annualized figures. The vertical axis represents the kernel density.
Source: Prepared by METI, based on “Census of Manufacture” (METI), GENESIS online
A. Distribution of export ratios for municipalities in Japan and Germany
Average for all prefectures in Japan: 0.38 Average for all states in Germany: 1.56
Larger export ratios Smaller export ratios
Export ratios = Value of the manufacturing industry’s exports
Value added in the manufacturing industry
Comparison of the distribution at the
municipal level
Hiroshima: 0.94
Thüringen: 1.13
Dis
trib
utio
n of
pre
fect
ures
and
sta
tes
Export ratios
In Germany, exports declined steeply in no region.
B. Distribution of export growth rates for municipalities in Japan and Germany
Export growth rates=
Value of the manufacturing industry’s exports (2013)
Value of the manufacturing industry’s exports (2008)
Higher export growth rates Lower export growth rates
Average for all prefectures in Japan: -2.54%
Average for all states in Germany: 2.47%
Dis
trib
utio
n of
pre
fect
ures
and
sta
tes
Number of municipalities where exports declined.
-Japan: 33 prefectures (70%) -Germany: 1 state (6%)
Export growth rates
In Japan, exports declined in 33 prefectures, around 70% of all prefectures, around the time of the global economic crisis, while in Germany, exports increased in all states but one. In Germany, there was no region where exports declined steeply.
Chapter2 Section 3 Globalization of local economies and
export stimulus by SMEs and export stimulus by SMEs and middle-sized enterprises
20
Increase in exporting establishments in Japan
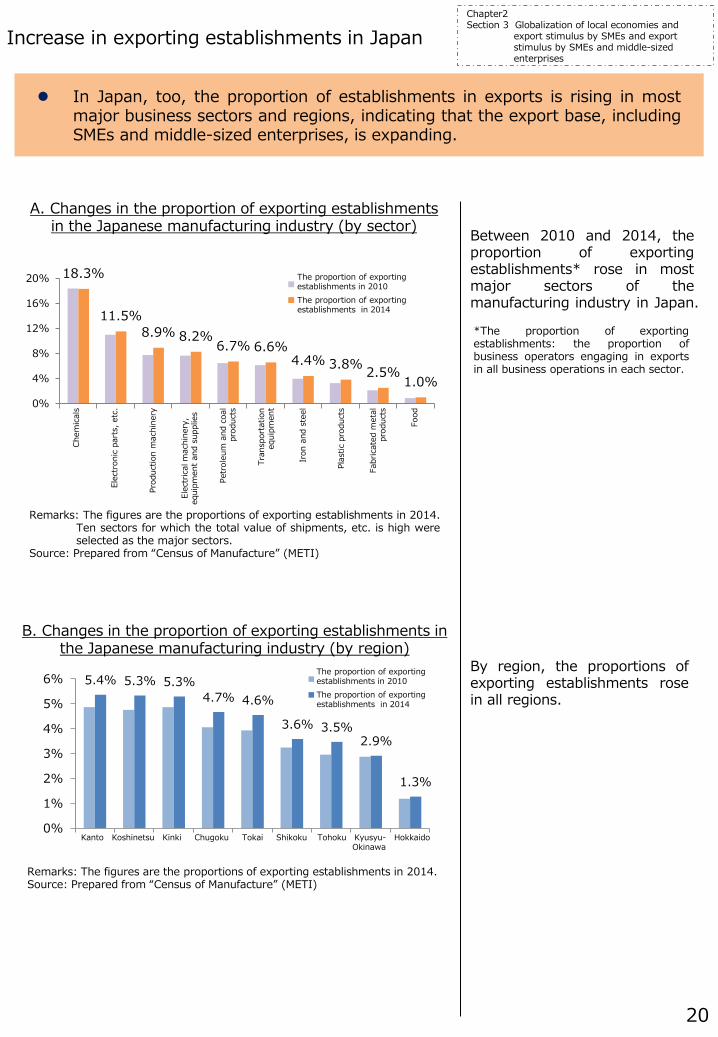
Between 2010 and 2014, the proportion of exporting establishments* rose in most major sectors of the manufacturing industry in Japan.
In Japan, too, the proportion of establishments in exports is rising in most major business sectors and regions, indicating that the export base, including SMEs and middle-sized enterprises, is expanding.
By region, the proportions of exporting establishments rose in all regions.
Chapter2 Section 3 Globalization of local economies and
export stimulus by SMEs and export stimulus by SMEs and middle-sized enterprises
A. Changes in the proportion of exporting establishments in the Japanese manufacturing industry (by sector)
*The proportion of exporting establishments: the proportion of business operators engaging in exports in all business operations in each sector.
Remarks: The figures are the proportions of exporting establishments in 2014. Ten sectors for which the total value of shipments, etc. is high were selected as the major sectors.
Source: Prepared from “Census of Manufacture” (METI)
B. Changes in the proportion of exporting establishments in the Japanese manufacturing industry (by region)
18.3%
11.5%8.9% 8.2%
6.7% 6.6%4.4% 3.8% 2.5%
1.0%0%
4%
8%
12%
16%
20% 輸出事業所比率2010輸出事業所比率2014
5.4% 5.3% 5.3%4.7% 4.6%
3.6% 3.5%2.9%
1.3%
0%
1%
2%
3%
4%
5%
6% 輸出事業諸比率2010輸出事業所比率2014
Chem
ical
s El
ectr
onic
par
ts, e
tc.
Prod
uctio
n m
achi
nery
Elec
tric
al m
achi
nery
, eq
uipm
ent a
nd s
uppl
ies
Pe
trol
eum
and
coa
l pr
oduc
ts
Tran
spor
tatio
n eq
uipm
ent
Iron
and
ste
el
Plas
tic p
rodu
cts
Fabr
icat
ed m
etal
pr
oduc
ts
Food
The proportion of exporting establishments in 2010 The proportion of exporting establishments in 2014
The proportion of exporting establishments in 2010 The proportion of exporting establishments in 2014
Kanto Koshinetsu Kinki Chugoku Tokai Shikoku Tohoku Kyusyu- Hokkaido Okinawa
Remarks: The figures are the proportions of exporting establishments in 2014. Source: Prepared from “Census of Manufacture” (METI)
18.3%
6.7% 8.9% 11.5%
2.5%
8.2% 4.4% 3.8%
6.6% 1.0%
10.0%
19.0% 9.9% 5.5%
14.0% 7.6%
10.7% 7.7%
4.5%
5.5%
0%
10%
20%
30%
Chem
ical
s
Petr
oleu
m a
nd c
oal p
rodu
cts
Prod
uctio
n m
achi
nery
Elec
tron
ic p
arts
, etc
.
Fabr
icat
ed m
etal
pro
duct
s
Elec
tric
al m
achi
nery
,eq
uipm
ent a
nd s
uppl
ies
Iron
and
ste
el
Plas
tic p
rodu
cts
Tran
spor
tatio
n eq
uipm
ent
Food
Non-exporting establishmentswith high export potentialExporting establishments
1.3% 5.3% 5.4% 5.3% 4.7% 4.6% 3.6% 2.9% 3.5%
13.4% 8.1% 7.7% 7.1%
6.6% 6.0% 5.9% 6.3% 5.6%
0%
5%
10%
15%Non-exporting establishments with high export potentialExporting establishments
21
Non-exporting establishments with high export potential
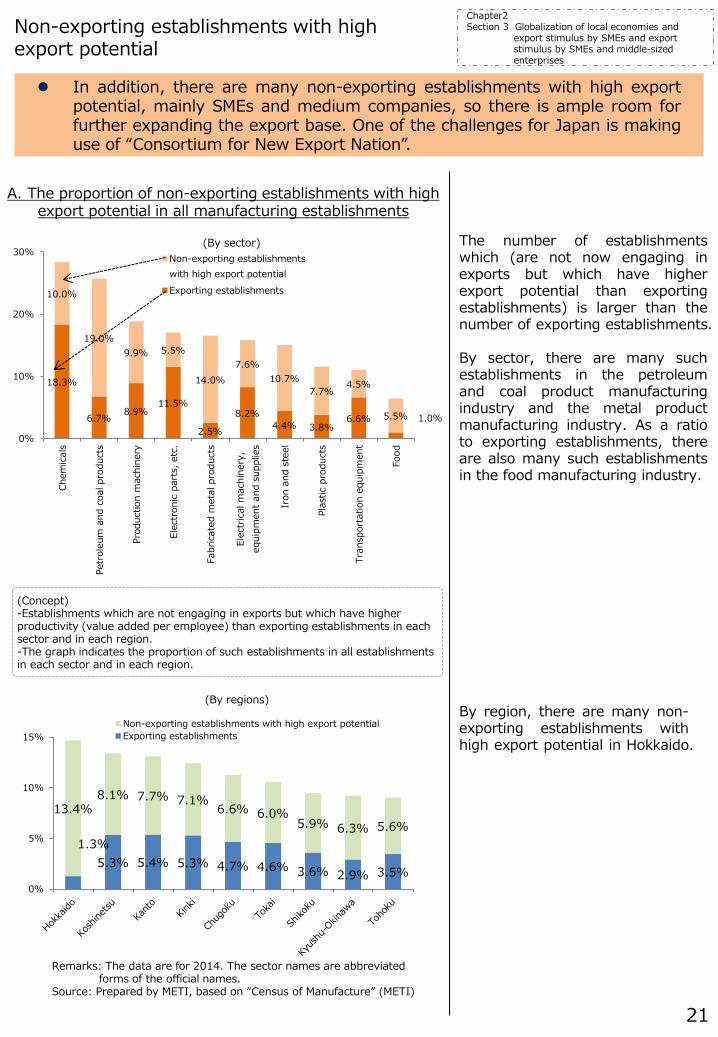
The number of establishments which (are not now engaging in exports but which have higher export potential than exporting establishments) is larger than the number of exporting establishments. By sector, there are many such establishments in the petroleum and coal product manufacturing industry and the metal product manufacturing industry. As a ratio to exporting establishments, there are also many such establishments in the food manufacturing industry.
In addition, there are many non-exporting establishments with high export potential, mainly SMEs and medium companies, so there is ample room for further expanding the export base. One of the challenges for Japan is making use of “Consortium for New Export Nation”.
By region, there are many non-exporting establishments with high export potential in Hokkaido.
A. The proportion of non-exporting establishments with high export potential in all manufacturing establishments
Remarks: The data are for 2014. The sector names are abbreviated forms of the official names.
Source: Prepared by METI, based on “Census of Manufacture” (METI)
Chapter2 Section 3 Globalization of local economies and
export stimulus by SMEs and export stimulus by SMEs and middle-sized enterprises
(Concept) -Establishments which are not engaging in exports but which have higher productivity (value added per employee) than exporting establishments in each sector and in each region. -The graph indicates the proportion of such establishments in all establishments in each sector and in each region.
(By sector)
(By regions)
130 115 131 96 72
103 120 115 116 120
86 91 77 130 121
18 0
100
200
300
400
Cost
of e
stab
lishi
nglo
cal s
ales
and
afte
rse
rvic
e ba
ses
Cost
of m
arke
ting
activ
ities
, inc
ludi
nglo
cal s
ales
prom
otio
n
Cost
of g
athe
ring
info
rmat
ion
on lo
cal
law
s, r
egul
atio
nsan
d bu
sine
ss…
Cost
of e
xpor
ting
prod
ucts
Cost
of a
fter-
serv
ice
for
prod
ucts O
ther
Little of the cost was savedA significant portion of the cost was savedMost of the cost was saved
15.2%
10.9%
19.6%
10.9%
6.5%
0.0%
37.0%
0.0% 10.0% 20.0% 30.0% 40.0%
Others
Products and services are not intended for export
The commission is too high
Unable to agree on terms such as production volume and price
The time until sales of products will become longer
Unable to trust trading companies or wholesalers
Unable to find suitable trading companies or wholesalers
22
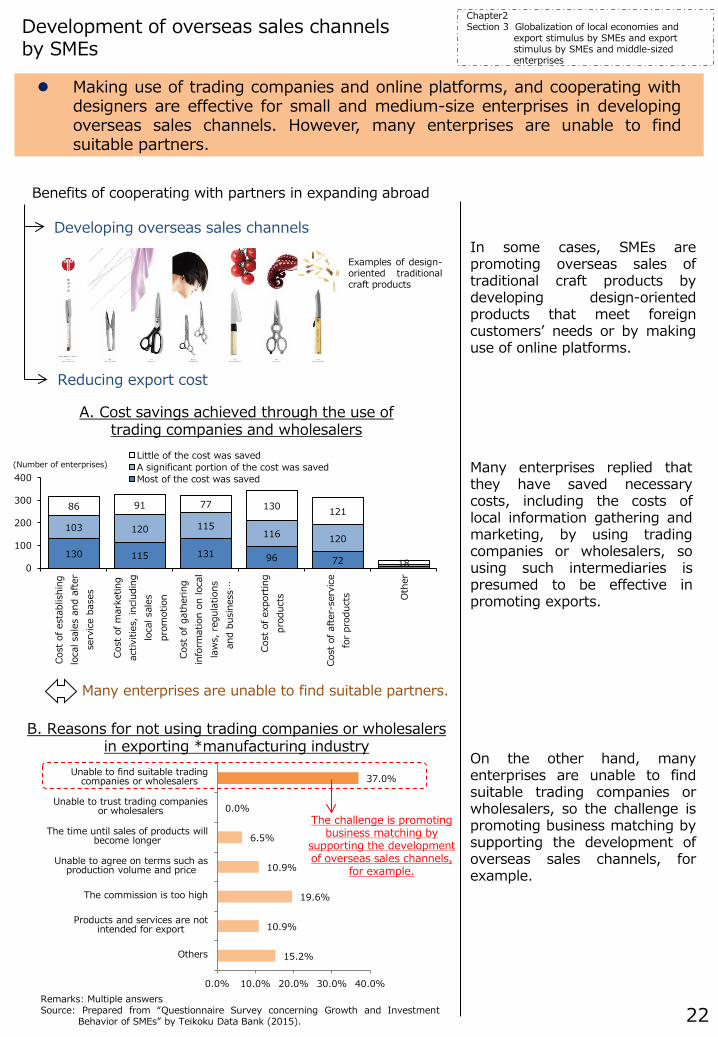
Development of overseas sales channels by SMEs
In some cases, SMEs are promoting overseas sales of traditional craft products by developing design-oriented products that meet foreign customers’ needs or by making use of online platforms.
Making use of trading companies and online platforms, and cooperating with designers are effective for small and medium-size enterprises in developing overseas sales channels. However, many enterprises are unable to find suitable partners.
On the other hand, many enterprises are unable to find suitable trading companies or wholesalers, so the challenge is promoting business matching by supporting the development of overseas sales channels, for example.
A. Cost savings achieved through the use of trading companies and wholesalers
Remarks: Multiple answers Source: Prepared from “Questionnaire Survey concerning Growth and Investment
Behavior of SMEs” by Teikoku Data Bank (2015).
Developing overseas sales channels
Benefits of cooperating with partners in expanding abroad
Reducing export cost
B. Reasons for not using trading companies or wholesalers in exporting *manufacturing industry
Many enterprises are unable to find suitable partners.
The challenge is promoting business matching by
supporting the development of overseas sales channels,
for example.
Many enterprises replied that they have saved necessary costs, including the costs of local information gathering and marketing, by using trading companies or wholesalers, so using such intermediaries is presumed to be effective in promoting exports.
Chapter2 Section 3 Globalization of local economies and
export stimulus by SMEs and export stimulus by SMEs and middle-sized enterprises
Examples of design-oriented traditional craft products
(Number of enterprises)
0
1
2
3
4
5
2007 2014
23
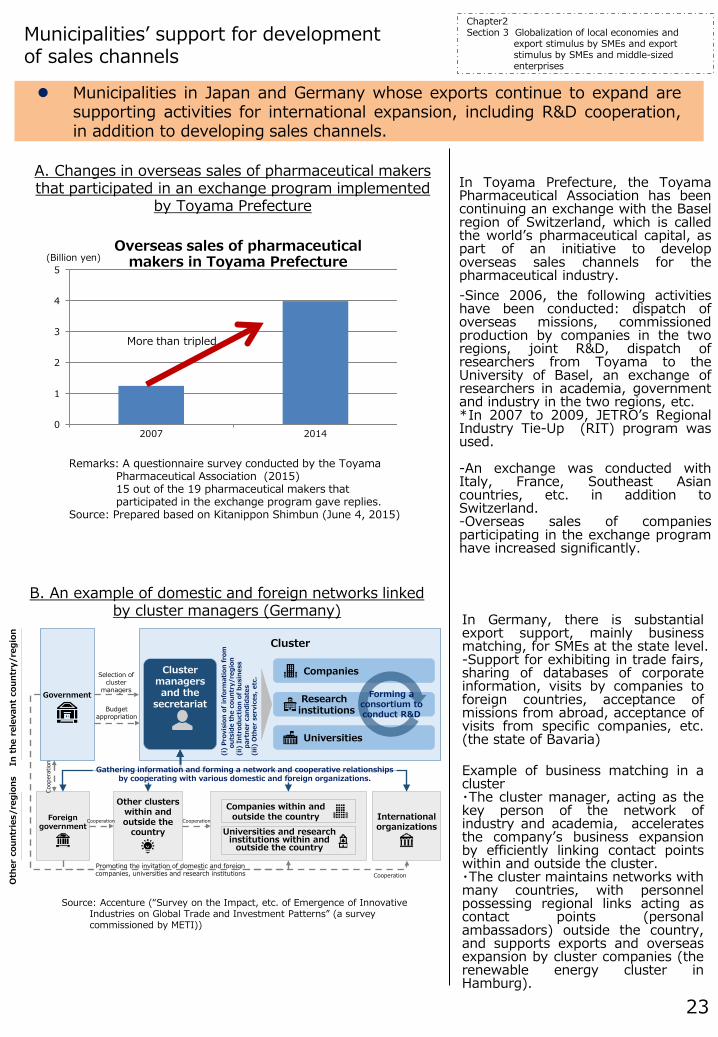
Municipalities’ support for development of sales channels
In Toyama Prefecture, the Toyama Pharmaceutical Association has been continuing an exchange with the Basel region of Switzerland, which is called the world’s pharmaceutical capital, as part of an initiative to develop overseas sales channels for the pharmaceutical industry.
Municipalities in Japan and Germany whose exports continue to expand are supporting activities for international expansion, including R&D cooperation, in addition to developing sales channels.
In Germany, there is substantial export support, mainly business matching, for SMEs at the state level. -Support for exhibiting in trade fairs, sharing of databases of corporate information, visits by companies to foreign countries, acceptance of missions from abroad, acceptance of visits from specific companies, etc. (the state of Bavaria)
-Since 2006, the following activities have been conducted: dispatch of overseas missions, commissioned production by companies in the two regions, joint R&D, dispatch of researchers from Toyama to the University of Basel, an exchange of researchers in academia, government and industry in the two regions, etc. *In 2007 to 2009, JETRO’s Regional Industry Tie-Up (RIT) program was used. -An exchange was conducted with Italy, France, Southeast Asian countries, etc. in addition to Switzerland. -Overseas sales of companies participating in the exchange program have increased significantly.
A. Changes in overseas sales of pharmaceutical makers that participated in an exchange program implemented
by Toyama Prefecture
Example of business matching in a cluster ・The cluster manager, acting as the key person of the network of industry and academia, accelerates the company’s business expansion by efficiently linking contact points within and outside the cluster. ・The cluster maintains networks with many countries, with personnel possessing regional links acting as contact points (personal ambassadors) outside the country, and supports exports and overseas expansion by cluster companies (the renewable energy cluster in Hamburg).
B. An example of domestic and foreign networks linked by cluster managers (Germany)
Chapter2 Section 3 Globalization of local economies and
export stimulus by SMEs and export stimulus by SMEs and middle-sized enterprises
Remarks: A questionnaire survey conducted by the Toyama Pharmaceutical Association (2015) 15 out of the 19 pharmaceutical makers that participated in the exchange program gave replies.
Source: Prepared based on Kitanippon Shimbun (June 4, 2015)
(Billion yen)
More than tripled
Source: Accenture (“Survey on the Impact, etc. of Emergence of Innovative Industries on Global Trade and Investment Patterns” (a survey commissioned by METI))
Overseas sales of pharmaceutical makers in Toyama Prefecture
Government
Cluster
Companies
Researchinstitutions
Universities
Cluster managers and the
secretariat
Foreign government
s
Companies within and outside the country
Universities and research institutions within and
outside the country
Other clusters within and outside the
countryInternational organizations
Coop
erat
ion
Selection of cluster
managers
Budget appropriation
Forming a consortium to conduct R&D
(i)
Prov
isio
n of
info
rmat
ion
from
ou
tsid
e th
e co
untr
y/re
gion
(ii)
Int
rodu
ctio
n of
bus
ines
s pa
rtne
r ca
ndid
ates
(iii)
Oth
er s
ervi
ces,
etc
.
Gathering information and forming a network and cooperative relationships by cooperating with various domestic and foreign organizations.
Promoting the invitation of domestic and foreign companies, universities and research institutions
In t
he r
elev
ant
coun
try/
regi
on
Cooperation Cooperation
Cooperation
Oth
er c
ount
ries
/reg
ions
24
Challenge of exploring the new frontier of emerging countries
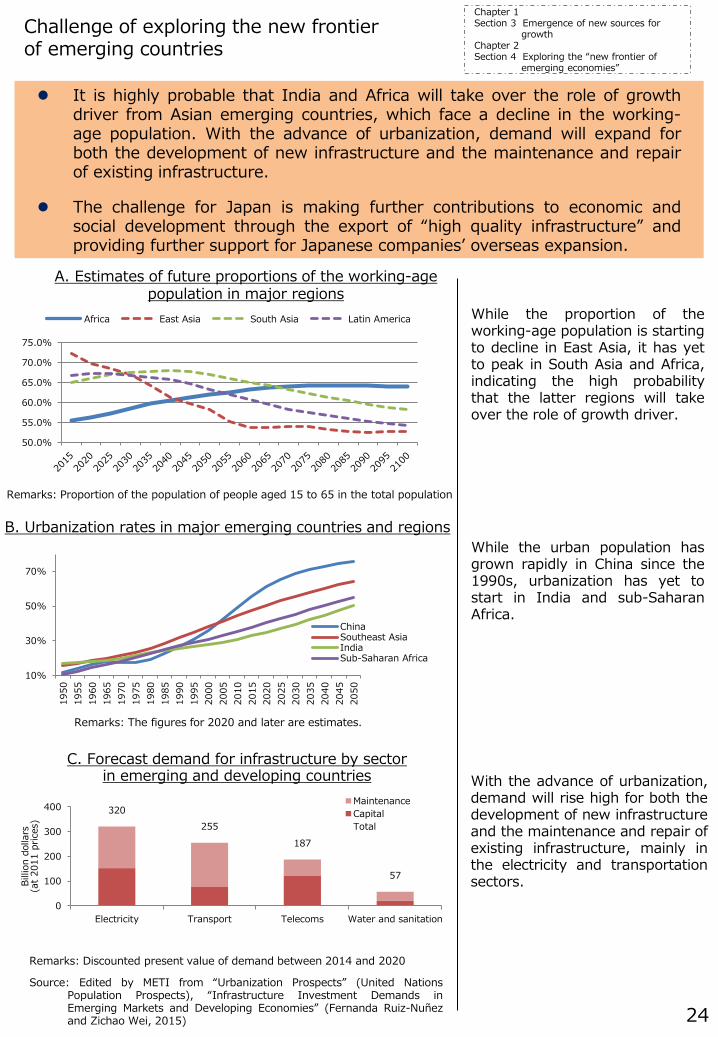
It is highly probable that India and Africa will take over the role of growth driver from Asian emerging countries, which face a decline in the working-age population. With the advance of urbanization, demand will expand for both the development of new infrastructure and the maintenance and repair of existing infrastructure.
The challenge for Japan is making further contributions to economic and social development through the export of “high quality infrastructure” and providing further support for Japanese companies’ overseas expansion.
Remarks: The figures for 2020 and later are estimates.
Source: Edited by METI from “Urbanization Prospects” (United Nations Population Prospects), “Infrastructure Investment Demands in Emerging Markets and Developing Economies” (Fernanda Ruiz-Nuñez and Zichao Wei, 2015)
Remarks: Discounted present value of demand between 2014 and 2020
A. Estimates of future proportions of the working-age population in major regions
Remarks: Proportion of the population of people aged 15 to 65 in the total population
While the proportion of the working-age population is starting to decline in East Asia, it has yet to peak in South Asia and Africa, indicating the high probability that the latter regions will take over the role of growth driver.
While the urban population has grown rapidly in China since the 1990s, urbanization has yet to start in India and sub-Saharan Africa.
With the advance of urbanization, demand will rise high for both the development of new infrastructure and the maintenance and repair of existing infrastructure, mainly in the electricity and transportation sectors.
Chapter 1 Section 3 Emergence of new sources for
growth Chapter 2 Section 4 Exploring the “new frontier of
emerging economies”
50.0%
55.0%
60.0%
65.0%
70.0%
75.0%
Africa East Asia South Asia Latin America
B. Urbanization rates in major emerging countries and regions
10%
30%
50%
70%
1950
1955
1960
1965
1970
1975
1980
1985
1990
1995
2000
2005
2010
2015
2020
2025
2030
2035
2040
2045
2050
ChinaSoutheast AsiaIndiaSub-Saharan Africa
C. Forecast demand for infrastructure by sector in emerging and developing countries
320 255
187
57
0
100
200
300
400
Electricity Transport Telecoms Water and sanitation
Billi
on d
olla
rs
(at 2
011
pric
es)
MaintenanceCapitalTotal
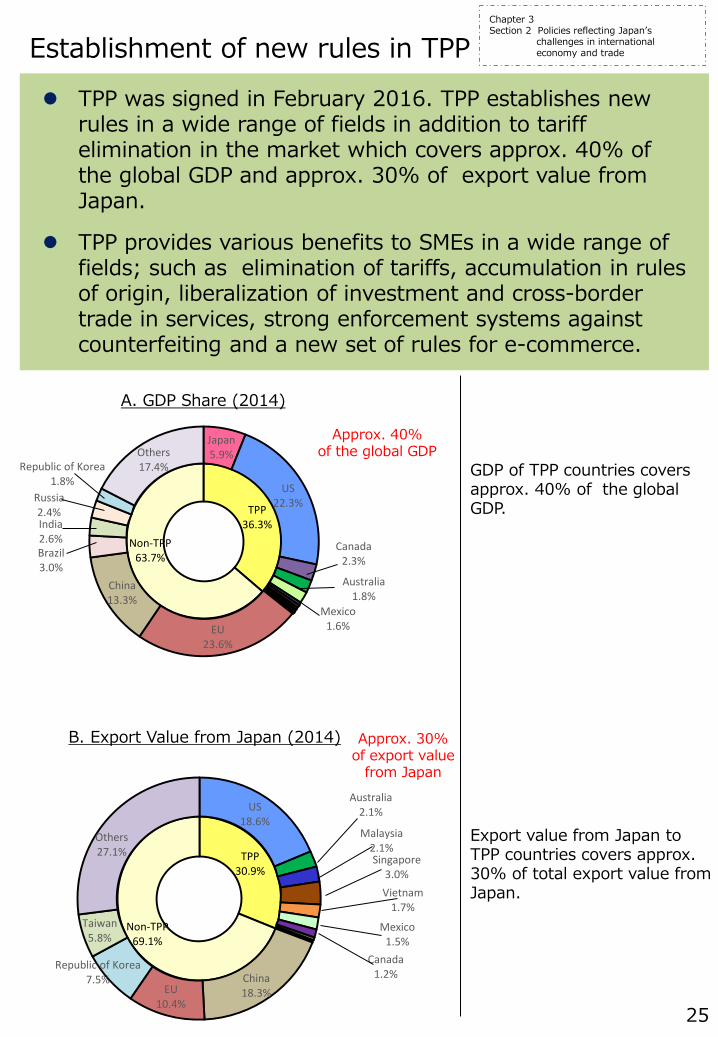
TPP 36.3%
Non-TPP 63.7%
Japan 5.9%
US 22.3%
Canada 2.3%
Australia 1.8%
Mexico 1.6% EU
23.6%
China 13.3%
Brazil 3.0%
India 2.6%
Russia 2.4%
Republic of Korea 1.8%
Others 17.4%
TPP 30.9%
Non-TPP 69.1%
US 18.6%
Australia 2.1%
Malaysia 2.1% Singapore
3.0% Vietnam
1.7%
Mexico 1.5%
Canada 1.2% China
18.3% EU 10.4%
Republic of Korea 7.5%
Taiwan 5.8%
Others 27.1%
25
Establishment of new rules in TPP TPP was signed in February 2016. TPP establishes new
rules in a wide range of fields in addition to tariff elimination in the market which covers approx. 40% of the global GDP and approx. 30% of export value from Japan.
TPP provides various benefits to SMEs in a wide range of fields; such as elimination of tariffs, accumulation in rules of origin, liberalization of investment and cross-border trade in services, strong enforcement systems against counterfeiting and a new set of rules for e-commerce.
Approx. 30% of export value
from Japan
B. Export Value from Japan (2014)
GDP of TPP countries covers approx. 40% of the global GDP.
Export value from Japan to TPP countries covers approx. 30% of total export value from Japan.
Approx. 40% of the global GDP
A. GDP Share (2014)
Chapter 3 Section 2 Policies reflecting Japan’s
challenges in international economy and trade
26
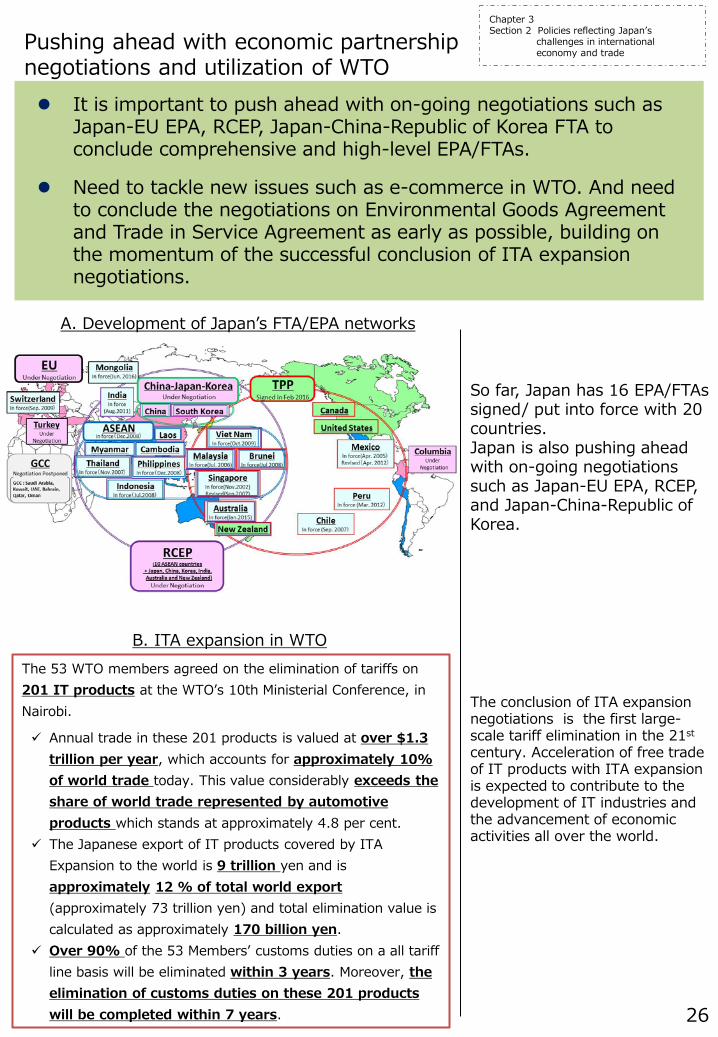
Pushing ahead with economic partnership negotiations and utilization of WTO It is important to push ahead with on-going negotiations such as
Japan-EU EPA, RCEP, Japan-China-Republic of Korea FTA to conclude comprehensive and high-level EPA/FTAs.
Need to tackle new issues such as e-commerce in WTO. And need to conclude the negotiations on Environmental Goods Agreement and Trade in Service Agreement as early as possible, building on the momentum of the successful conclusion of ITA expansion negotiations.
B. ITA expansion in WTO The 53 WTO members agreed on the elimination of tariffs on 201 IT products at the WTO’s 10th Ministerial Conference, in Nairobi.
Annual trade in these 201 products is valued at over $1.3 trillion per year, which accounts for approximately 10% of world trade today. This value considerably exceeds the share of world trade represented by automotive products which stands at approximately 4.8 per cent.
The Japanese export of IT products covered by ITA Expansion to the world is 9 trillion yen and is approximately 12 % of total world export (approximately 73 trillion yen) and total elimination value is calculated as approximately 170 billion yen.
Over 90% of the 53 Members’ customs duties on a all tariff line basis will be eliminated within 3 years. Moreover, the elimination of customs duties on these 201 products will be completed within 7 years.
The conclusion of ITA expansion negotiations is the first large-scale tariff elimination in the 21st century. Acceleration of free trade of IT products with ITA expansion is expected to contribute to the development of IT industries and the advancement of economic activities all over the world.
A. Development of Japan’s FTA/EPA networks
So far, Japan has 16 EPA/FTAs signed/ put into force with 20 countries. Japan is also pushing ahead with on-going negotiations such as Japan-EU EPA, RCEP, and Japan-China-Republic of Korea.
Chapter 3 Section 2 Policies reflecting Japan’s
challenges in international economy and trade
27
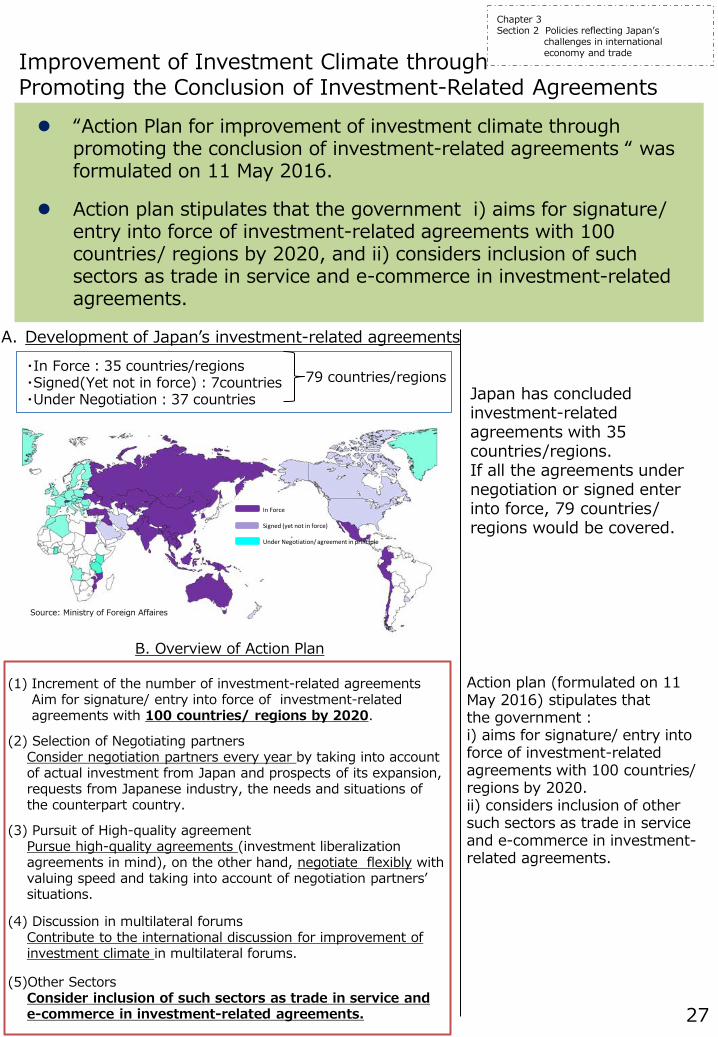
Improvement of Investment Climate through Promoting the Conclusion of Investment-Related Agreements “Action Plan for improvement of investment climate through
promoting the conclusion of investment-related agreements “ was formulated on 11 May 2016.
Action plan stipulates that the government i) aims for signature/ entry into force of investment-related agreements with 100 countries/ regions by 2020, and ii) considers inclusion of such sectors as trade in service and e-commerce in investment-related agreements.
A. Development of Japan’s investment-related agreements
B. Overview of Action Plan
(1) Increment of the number of investment-related agreements Aim for signature/ entry into force of investment-related agreements with 100 countries/ regions by 2020.
(2) Selection of Negotiating partners Consider negotiation partners every year by taking into account of actual investment from Japan and prospects of its expansion, requests from Japanese industry, the needs and situations of the counterpart country.
(3) Pursuit of High-quality agreement Pursue high-quality agreements (investment liberalization agreements in mind), on the other hand, negotiate flexibly with valuing speed and taking into account of negotiation partners’ situations.
(4) Discussion in multilateral forums
Contribute to the international discussion for improvement of investment climate in multilateral forums.
(5)Other Sectors
Consider inclusion of such sectors as trade in service and e-commerce in investment-related agreements.
・In Force:35 countries/regions ・Signed(Yet not in force):7countries ・Under Negotiation:37 countries
79 countries/regions Japan has concluded investment-related agreements with 35 countries/regions. If all the agreements under negotiation or signed enter into force, 79 countries/ regions would be covered.
Action plan (formulated on 11 May 2016) stipulates that the government : i) aims for signature/ entry into force of investment-related agreements with 100 countries/ regions by 2020. ii) considers inclusion of other such sectors as trade in service and e-commerce in investment-related agreements.
Source: Ministry of Foreign Affaires
In Force
Signed (yet not in force)
Under Negotiation/ agreement in principle
Chapter 3 Section 2 Policies reflecting Japan’s
challenges in international economy and trade


![White Paper on International Economy and Trade 2013 [Outline] · 2018. 11. 21. · White Paper on International Economy and Trade 2013 [Outline] A non-statutory white paper published](https://img.pdfslide.us/doc/110x75/5fef8dc0a777dd6e871dc26a/white-paper-on-international-economy-and-trade-2013-outline-2018-11-21-white.jpg)


![White Paper on International Economy and Trade …White Paper on International Economy and Trade 2019 [Outline] July 2019 Trade Policy Bureau Ministry of Economy, Trade and Industry1](https://img.pdfslide.us/doc/110x75/5e9cc27f2dba9e66db7ea99a/white-paper-on-international-economy-and-trade-white-paper-on-international-economy.jpg)