Embed Size (px)
Citation preview
White Paper
Misaligned Stakeholders and Health System UnderperformanceIndustry Agenda Council on the Future of the Health Sector
December 2016

World Economic Forum® © 2016 – All rights reserved.No part of this publication may be reproduced orTransmitted in any form or by any means, including Photocopying and recording, or by any information Storage and retrieval system.
REF 041016
3Industry Agenda Council on the Future of the Health Sector
Contents Abstract
3 Abstract
5 1. Introduction
5 Methodology
5 Principle Findings
6 2. Objectives
7 3. Problem of Misalignments
7 3.1 Taxonomy of Misalignments
8 3.2 Cross-Cutting Examples from Cancer, Diabetes and Mental Health
11 4. Potential Magnitude of the Problem
11 Figure 1
11 Figure 2
12 5. Correcting Misalignments
12 Are Some Systems Better “Aligned” Than Others?
12 Achieving Alignment Case Studies
15 6. Lessons on Achieving Alignments
16 7. Conclusions and Recommendations
16 Acknowledgements
17 Endnotes and Citations
19 Appendix: Estimation Methodology
This document summarizes the findings of the World Economic Forum’s Industry Agenda Council on the Future of the Health Sector’s two-year inquiry into underperformance of health systems. The council found that misalignments (i.e., situations involving conflicting incentives, behaviour, structures, or policies) among key stakeholders are likely to lead to significant waste, whether measured in terms of health for money or money for health. This paper defines three types of misalignments (those due to divergent objectives, power asymmetries and cooperation failures), offers concrete examples of each type and includes several cross-cutting examples from three particularly burdensome disease areas: cancer, diabetes and mental health. The council also examined situations in which stakeholders acted to correct misalignments and reduce waste. This paper details several case studies of achieving greater alignment and enumerates a set of lessons for stakeholders. It concludes by making recommendations for future research in this domain.

4 Misaligned Stakeholders and Health System Underperformance
5Industry Agenda Council on the Future of the Health Sector
1. Introduction
Global health is a story of the good, the bad and the ugly.1
The good. There have been extraordinary gains in longevity and health. Between 1990 and 2015, the global infant mortality rate fell by 42% and the child mortality rate by 53%. Over the past 60 years global life expectancy has increased by more than 20 years – with people living well into their eighties in many wealthy, industrialized countries.
The bad. Millions of people continue to suffer and die from health conditions that can be easily and inexpensively prevented or treated with existing knowledge and tools. In 2014, nearly 6 million children died before celebrating their fifth birthday (the majority from prematurity and vaccine-preventable infectious diseases) and an estimated 642 million people will be living with diabetes by the year 2040, representing an increase of more than 50% from 415 million today.
The ugly. Gross disparities are made apparent by juxtaposing our most impressive global health achievements with our most dismal failures. At the international level, there are drastic differences in life expectancy between high- and low-income countries, ranging from Japan at 83 years to Sierra Leone at 45. Massive disparities also occur at the national level – within the same health system. In the United States, the maternal mortality rate for black women is almost three times higher than for white women, although the prevalence of the most common birth complications is roughly similar. A recent review of health indicators (including child mortality, life expectancy and obesity) among indigenous populations in over 20 countries found almost universally poor outcomes relative to corresponding non-indigenous populations. In Australia, Canada, Cameroon and Kenya, the life expectancies of indigenous populations were at least 10 years lower than in the general population and over 20 years in Cameroon.2
The world’s health deficits are especially disconcerting given indications of wasted resources within health systems in both rich and poor countries. In 2013, the United States spent nearly 50% more on healthcare as a percentage of GDP than the next highest OECD spender, France, without superior health outcomes, such as life expectancy.3 That same year, Paraguay achieved similar health outcomes in terms of life expectancy and child mortality as El Salvador – despite spending 34% more per person on healthcare and having similar per capita income.4
The world aspires to erase its glaring health deficits, as underscored by the 2015 Millennium Development Goals and the 2030 Sustainable Development Goals. The main focus has been, and continues to be, on increasing the scale and efficiency of resources devoted to 1. medical interventions (e.g., the provision of drugs, vaccines and primary healthcare); 2. non-medical health interventions (e.g., the expansion and strengthening of health delivery
systems, the widening and deepening of human resources for health, and the more widespread provision of safe water and sanitation); and 3. non-health interventions that can have a powerful impact on health outcomes (e.g., governance, education, housing and the social conditions that influence daily life). Globally, many laudable initiatives are under way to extend potential longevity and enhance overall well-being, with technological, social and institutional innovation featuring prominently in the effort.
Methodology
Against this backdrop, in March 2015 the World Economic Forum Industry Agenda Council on the Future of the Health Sector decided to conduct in-depth research to gain further insights into health deficits and disparities throughout the world and to identify ways to better use available resources to improve health outcomes and reduce waste. Research methods included desk research, extensive phone and in-person interviews, and face-to-face and virtual meetings.
Our working hypothesis is that global health underperformance is significantly driven by misalignments among health sector stakeholders. This focus on misalignments is underdeveloped in the literature, but it resonated with our council members and nearly every professional interviewed. In all, 60 interviews were conducted across 16 countries, covering healthcare providers, payers, pharmaceutical companies, patient groups, employers and governmental and intergovernmental organizations.
Principal findings
The misalignments perspective takes a step back and looks across the field of players to see how their delivery of healthcare is affected by the way they interact with each other, the barriers in their paths and the size of the field. Reaching beyond the realities of each stakeholder community and looking at these disconnects with an open mind and creativity has shown us that these are issues of paramount importance to almost every stakeholder community, and there are compelling examples of alignment from which we can draw lessons to apply to a wide range of issues within the health sector.
The council finds that, fortunately, where misalignments can be identified, they can potentially be corrected. Better-aligned systems may yield either of two positive results: 1. maximizing health outcomes and healthcare delivery for a given amount of spending; or 2. minimizing spending while maintaining the same level of health. More specifically, we estimate that if used more effectively, current patterns of national health spending could potentially raise global life expectancy by over four years. Alternatively, current patterns of life expectancy could potentially be achieved with as little as one-third the current level of health spending.5,6 Whether
6 Misaligned Stakeholders and Health System Underperformance
viewed in terms of money for health, or health for money, these analyses are suggestive of considerable waste and inefficiency.7
We begin with the objectives of our research, before detailing our use of the term “misalignment” and outlining our taxonomy of the three most salient categories (divergent objectives, power asymmetries and cooperation failures). We provide examples of each category, touching on a wide range of geographical, developmental and ecological contexts. We also examine several in-depth examples of misalignment in cancer, diabetes and mental health. Then we turn to our findings from case studies on alignment in the health sector and suggest steps that stakeholders could take to achieve better alignment in certain contexts. We conclude with ideas for future research and a brief summary of the Forum’s Value in Healthcare project, which seeks to improve outcomes and payment models in healthcare delivery while ensuring access to care and financial sustainability.
The council set out to: 1. better understand misalignment among stakeholders (such as patients, regulators, pharmaceutical and device manufacturers, providers, insurers, academia, policy-makers and investors); 2. articulate a vision of more fully aligned health systems and the ways in which they will improve health outcomes; 3. design a plan for how to achieve it; and 4. estimate the potential health and economic gains associated with better alignment.
After consultation with the leaders of other relevant councils within the Forum, the council selected three specific disease areas within which to focus its attention so that practical recommendations could be generated within the resource and time constraints of the project. These disease areas – cancer, diabetes and mental health – were chosen because of their significant and growing contribution to death and disability globally, and because council members had a high degree of expertise and professional experience in these fields.
The focus of this exercise was global, and it sought to address the following questions for each of the three diseases:
– How do misalignments among stakeholders lead to increased incidence of disease or poor quality of care?
– What real-world examples demonstrate misalignment and its effects?
– What are real-world examples in which stakeholders have reasonably aligned incentives or structures – and how does this manifest itself in terms of health outcomes?
– What would it take for incentives, structures and priorities for each disease area to be more systematically aligned at local, national and global levels?
While our project is global in terms of relevance and scale, it is rooted in analyses at the national level. The aim is to identify instances in which systemic flaws lead to sub-optimal outcomes. It is worth noting that the council did not consider cases of fraud or corruption for this study, though these represent a subject ripe for future research. While fraud and corruption constitute a significant class of misalignment in many countries, adequately addressing the complexity of the problem and its solutions would require a special focus beyond the scope of this white paper. For a thorough exploration of the conditions that lead to corruption and its effects, please see the work of the Forum’s Partnering Against Corruption Initiative.8
2. Objectives
7Industry Agenda Council on the Future of the Health Sector
The council conceptualizes misalignments as situations in which the incentives, structures, or policies that shape the behaviour and interactions of health sector stakeholders result in wasted resources or suboptimal health outcomes. Misalignments can often be corrected and aligned, but that requires a clear understanding of the nature of the misalignment and the reasons for it. In this vein, our ultimate goal is to understand the steps that may be taken to achieve better aligned health systems.
A key premise of our analysis is that the vast majority of health sector stakeholders desire better health, even if their actions may be driven in part, or even dominated by, alternative motivations. For example, governments may want their populations to be healthier to have more productive and cohesive societies. At the same time, individual actors within governments may make decisions based on self-interest, as in seeking re-election. In this case, misalignments may occur when governmental structures unnecessarily place political advancement at odds with the institution of sensible health policies.
Similarly, while stakeholders who sell therapeutic services (e.g., medical care) or curative products (e.g., pharmaceuticals) operate to improve health, they are businesses that must weigh profit maximization and shareholder interests against optimizing health outcomes. This internal conflict in motivations is not a misalignment in itself. Businesses exist to sell goods and services for financial gain. In the case of for-profit businesses, the situation becomes a misalignment when incentives, or other forms of conflict, artificially divorce profit maximization from health optimization.
3.1. Taxonomy of Misalignments
What are the most common misalignments? The council’s research shows that three categories of misalignments stand out: those due to divergent objectives; power asymmetries; and cooperation failures. But, as in any complex system, many examples do not fit neatly into one category and may cross over to other types. Further, we do not consider these categories to be an exhaustive list but rather a synthesis of the most compelling ones that emerge from our research.
Divergent objectives. This category covers divides between the long- and short-term interests of stakeholders, myopic targets or payment mechanisms (such as fee-for-service), or inadequate data and tools for decision-making.
Example 1: Inadequate payment mechanisms result in inexpedient care.
Lack of reimbursement often deters clinicians from billing for over-the-phone or electronic consultation. As a result, most patients cannot contact their physician for a rapid, remote
consultation even though this may be the most efficient way to receive timely medical advice. Patient health may deteriorate while they wait to see their provider in person, which can result in costlier treatments and worse health outcomes. In these circumstances, restrictive payment mechanisms provide a disincentive for clinicians to act in the best interests of their patients and ultimately lead to excessive healthcare costs borne by public and private payers. This misalignment affects care across many health systems and is particularly problematic in the US.
Example 2: Excessive and inappropriate use of antibiotics fuels drug resistance.
Prioritizing immediate comfort over long-term consequences has driven a number of undesirable phenomena when it comes to the overuse of antibiotics. These include: the large-scale use of antibiotics in commercial farming to promote growth and control infections; the improper prescription of antibiotics for infections that will not respond to them;9 the rampant misuse of over-the-counter antibiotics in many countries; and the lack of adherence to antibiotic regimens, even when properly prescribed. As a result, antimicrobial resistance is increasing globally, creating a transnational threat. Estimates show that drug resistant “superbugs” are likely to kill an additional 10 million people per year by 2050 – accounting for more deaths globally than all cancers combined.10 The perceived immediate benefits of antibiotics to individuals are being given preference over the social appropriateness of their application, causing everyone to face the stark long-term consequences of overuse.
Power asymmetries. This category covers imbalances of power (economic, legal, informational, or political) that arise among stakeholders and create waste – possibly because one stakeholder is able to impose their will in a way that severely restricts the ability of disadvantaged stakeholders to impact decision-making.
Example 1: The outsized power of the tobacco industry impedes some governments from implementing tobacco-control interventions.11
The main goal of most private companies is to make a profit and the tobacco industry claims no immunity to this ambition. While the tobacco industry’s methods for generating revenue clearly have negative consequences for public health, this fact alone does not constitute a misalignment. Misalignment arises when the tobacco industry uses its economic power to threaten or instigate legal battles that governments do not have the finances to fight, preventing policy-makers from successfully implementing tobacco-control laws, launching public health education campaigns, or utilizing other policy tools such as taxation. Without being able to employ legally and publicly sanctioned tools that are typically used to protect public health, governments are left to bear the full costs of tobacco consumption in the form of increasing medical costs and slowed economic growth due to premature death and disability. The council acknowledges that tobacco consumption is driven by a complex array of forces, including addiction, cultural attitudes towards tobacco, and the diversity of economic and legal factors at play within
3. Problem of Misalignments
8 Misaligned Stakeholders and Health System Underperformance
unique national contexts. Nevertheless, power imbalances between the tobacco industry and some governments significantly contribute to the problem by preventing officials from spending resources in a manner that would be most effective for promoting health and thereby creating waste.
Example 2: US regulations on price negotiations for Medicare Part D cause higher drug prices for federal reimbursements.
Those who enrol in Medicare (a social health insurance programme administered by the US government) can purchase prescription drug plans (PDPs) from private insurance companies and pharmacy benefit managers in Medicare Part D. Federal law currently prohibits the government from negotiating prices with drug manufacturers on behalf of Medicare, with the intent of encouraging the private companies that administer PDPs to negotiate directly for lower prices.12 However, evidence suggests that these private companies fail to secure prices as low as those paid by federal programmes that can negotiate (such as the Veteran’s Health Administration and Medicaid). Recent estimates show that the government could save $15.2 billion-$16 billion annually if it obtained the same drug prices for Medicare as obtained by other federal health programmes.13
The legal regulations that restrict the government from negotiating on behalf of PDPs create an artificial power imbalance between the government and pharmaceutical companies. As a result, the government pays higher prices for drugs under Medicare Part D than through other federal health plans, thereby wasting taxpayer resources for the health outcomes achieved. It is worth noting that changes to this legislation have been included in the fiscal year 2017 budget from the Office of the US President and submitted to Congress for revision and voting.
Cooperation failures. This category covers barriers (such as cultural, operational and regulatory) that keep stakeholders from collaborating in their mutual best interests. These failures generally reflect disconnected budgets, lack of leadership, or barriers to data-sharing.
Example 1: Poor interoperability of electronic medical records systems leads to inefficient care and negative health outcomes.
In many countries, electronic medical records (EMR) systems have poor interoperability. Primary care providers, laboratories, specialists’ offices and hospitals may maintain separate EMRs for a single patient, without passing any information between them. This lack of sharing and connectivity contributes to redundant testing, medical errors and disjointed care, all of which can result in poorer health outcomes for patients and higher costs across the system. Experts contend that the main obstacles to correcting this misalignment include the complexity of sharing information among hundreds of EMRs and the lack of incentives for manufacturers to collaborate on connecting their products. Vendors are actually incentivized not to share information by default so that they can charge data exchange fees when they do choose to connect to other EMR systems.
While the stakeholders would stand to benefit as a whole from greater EMR interoperability, no single party will necessarily net a positive return if required to individually fund a project to increase compatibility. Unless cooperation among stakeholders can be marshalled by implementing a mechanism through which costs are shared in proportion to the benefits enjoyed, this issue is likely to remain unresolved.
Example 2: Poor collaboration among stakeholders leads to suboptimal uptake of technical innovations in diabetes care.
Cooperation failures prevent providers, insurers and consumers from capitalizing on innovations that can improve patient health and quality of life. With diabetes, new technologies such as wearable monitors, tele-health interfaces and predictive analytics to tailor treatments to each patient are all being underused. Medtech and software developers find it difficult to get their products implemented across health systems because doctors do not see it as their job to select and “prescribe” these kinds of innovations. Moreover, providers operate in fragmented systems and are most frequently compensated to provide drugs and treatments but not preventive technologies. Moreover, difficulties in sharing health data at every level of the system prevent effective and meaningful use of the information these devices might be able to provide. As a result of these barriers, technologies that hold tremendous potential for achieving health gains remain largely unused. Each stakeholder seems to be focused on immediate and incremental gains – unwilling to pull together to achieve a much bigger transformation. As with EMR interoperability, a lack of cooperation keeps stakeholders from making a collective investment in an innovation that would also yield collective benefits.
3.2. Cross-Cutting Examples from Cancer, Diabetes and Mental Health
Besides identifying independent examples of misalignment that clearly illustrate the three categories outlined in the taxonomy, the council closely examined interconnected instances of misalignment from three disease areas: cancer, diabetes and mental health. Across all geographies and income levels, these three disease areas are responsible for a significant portion of the global burden of death and disability.
This section examines misalignments through a wider lens than in the previous section. Rather than looking at examples in isolation, we explore how specific misalignments (e.g., fee-for-service models) arise in different areas of the global health sector.
Divergent objectives. Across all three disease areas, the council observed that payment models for physicians and providers typically reward the volume rather than the value of care provided. The majority of the world’s spending on healthcare is directed through care-based payment models such as fee-for-service. This means financial incentives encourage hospitals and clinicians to engage patients with as many tests, prescriptions, appointments and procedures as possible. Introducing new innovations that get diagnosis, treatment and care right the first time, or that reduce the amount of treatment needed, can result in less income for the provider under such systems.
9Industry Agenda Council on the Future of the Health Sector
The United Kingdom provides a good illustration of how the focus on volume over value affects diabetic patients. Across medical jurisdictions, there is much variability in outcomes that are indicators of the quality of care, such as limb amputation and hospital readmissions. These discrepancies indicate that some providers are achieving higher-quality care than others. However, in a fee-for-service model, the providers with greater frequency of readmission and amputation are rewarded with greater income. This not only incentivizes failure but also presents providers with a disincentive for investing in innovations that could keep patients healthier.
At their worst, volume-based payment models can undermine trust in the healthcare system completely. An extreme example can be seen in the recent trend of attacks on healthcare workers in China, where tensions between patients and providers have erupted into violence.14 Patients who are frequently pushed into poverty due to the high costs of medical care have lashed out at providers who are mostly paid on the basis of revenue; many physician contracts even include income-generation targets for the hospital. China provides an example of how fee-for-service payment schemes can incentivize unnecessary and lower-quality healthcare at the expense of patient health.
Misaligned objectives can also come in less explicit forms, such as disproportionate spending on treatment over prevention and other solutions likely to produce a more lasting impact. This imbalance reveals disconnects between the short- and long-term interests of stakeholders. In the case of mental health, the WHO estimates that nearly 70% of funding globally goes to stand-alone mental health institutions, despite a long-standing consensus that most investment should go into rehabilitative care in the community, not “warehousing” in bedded facilities.15 The preference for funding highly visible facilities reveals a desire on the part of policy-makers to demonstrate their commitment to mental health programmes without taking on the challenge of long-term, multistakeholder, community-based interventions, which may impact both the treatment and prevention of mental health conditions.
Similarly, while 52% of cervical cancer mortality could be prevented through effective HPV screening and vaccination,16 uptake has been slow, notably in low- and middle-income countries where 85% of cervical cancer deaths occur. Gavi, the Vaccine Alliance, has worked closely with governments to demonstrate the positive business case for investing now in a programme that will only reap its full health and economic benefits decades into the future. In the interim, countries that choose not to provide the vaccine (and invest in prevention) will be forced to spend precious resources on cervical cancer treatment and absorb the negative social and economic impacts of an unnecessarily high cancer burden.
In developed countries, recent trends show the treatment-prevention divide getting worse. Across the OECD from 2009 to 2014, spending on prevention was the only area of healthcare apart from pharmaceuticals that saw cuts.17 This suggests that as health systems around the world face financial pressures, decision-makers invest in interventions
with relatively short-term returns at the expense of those with long-term benefits, which may even be larger in magnitude.
For decades, intergovernmental bodies and health ministries have called for reprioritizing prevention over treatment, but misalignments have deterred such investments. Performance targets and voter priorities still focus on what appears urgent and can be easily measured (e.g., waiting times and medical errors) rather than what is more beneficial in the long term and harder to measure (e.g. curbing chronic disease trends and improving access to pre-natal care).
Power asymmetries. Across the three disease areas, experts often touched on power imbalances at the heart of particular examples of misalignment.
Many pointed out funding disparities among particular conditions as evidence that healthcare resource allocation is skewed by power imbalances among particular groups. Funding for mental health services provides a compelling example. Globally, mental health services receive around 2% of healthcare spending, despite accounting for about 13% of the burden of disease, according to the WHO.18 While disparities in health investment may occur for a variety of reasons, health experts interviewed suggested that the primary driver of low funding for mental health is stigma – or rather the lack of power held by patients and professionals in the mental health sector compared to more empowered and vocal groups focused on physical health. Less than half of low-income countries have any form of mental health civil society organization.19
It is hard to definitively demonstrate that any particular funding allocation across diseases is “right”. This is exacerbated by a lack of tools to rationally assess potential to benefit from healthcare spending and allocate resources to optimize effectiveness. Advocates of particular causes and political expediency exert great influence on decision-makers, which may cause inefficiencies and missed opportunities for greater health gain from existing health investments.
In several markets, interviewees reported perceptions of either producers or purchasers wielding outsized power, creating persistent under- or over-consumption of particular products, or unnecessary loss of money or human health. Even though tobacco products are a leading cause of death and disability worldwide, the number of smokers in low- and middle- income countries has been rising dramatically – more than offsetting the fall in smoking rates in high-income nations. Yet despite the WHO’s recommending tobacco taxes as “the most effective policy to reduce tobacco use”, many countries do not levy them and only 10% of the world’s population lives in a country with a tobacco tax rate that sufficiently compensates for its true and full costs.20 Government inaction can be partly explained by tobacco companies’ disproportionate power, in terms of financial, marketing and legal resources, relative to some governments’ ability to push through evidence-based anti-smoking strategies. The persistence of this power imbalance contributes to the spread of cancer-causing lifestyles across low- and middle-income countries, potentiating high levels of preventable disease (along with their resulting economic burden on society).
10 Misaligned Stakeholders and Health System Underperformance
Even when stakeholders are theoretically on the same side, power asymmetries can lead to misaligned investment and objectives. In low-income countries, donor agencies exercise considerable sway over health-system development, with global funders providing around 25% of overall health spending.21 Many interviewees noted that health aid flows often reflect donor priorities rather than those of the recipient, and that donors “neither set nor fund priorities in a rational way”.22
This misalignment between donor and recipient priorities can have a profound impact on the health services available to hundreds of millions of people.
One example is donors’ preference for supporting vertical programmes that target specific diseases rather than those that strengthen the broader health system.23 This approach can cause redundancy, inefficiency and neglect of certain health areas. In the case of non-communicable diseases (NCDs), programmes are woefully underfunded in relation to their contribution to the global health burden. In 2009, NCDs accounted for 45% of the burden of disease but only 1% of donor funding for health.24 Programmes targeting NCDs require a commitment to long-term investment and difficult-to-measure results, neither of which is attractive to donor communities.
Cooperation failures. Across all three disease areas, the council found misalignments that are not the result of any fundamental economic or political failure but a more basic lack of cooperation. The constraining influence of organizational boundaries can narrow leaders’ focus and lead them to miss opportunities for partnership that would create shared savings or improved health. Thinking in a more collaborative “systems-oriented” way can occasionally be impeded by regulation, but more often than not these misalignments result from stakeholders’ failure to see beyond the boundaries of their own sectoral, institutional, or professional silos.
Diabetes experts raised the example of the fragmented and duplicative care that is often delivered to diabetic patients around the world. Several interviewees commented on a misalignment between modern patterns of disease and the traditional structure of specialties in which doctors are trained and care is delivered. In Scotland, a study of nearly 2 million patients found that 47% of people with diabetes had three or more additional long-term conditions and only 14% suffered from diabetes alone.25 Multiple morbidity patients (such as those living with diabetes and hypertension) are increasingly common and particularly expensive to treat, yet most countries continue to treat each condition separately. This leads to not only wasteful duplication of tests and possible overmedication but also patient confusion over burdensome recommendations – which likely reflect each doctor’s individual specialty rather than a patient’s holistic health and well-being.
Health experts noted that medical records and information systems are frequently not connected, such as between hospitals and primary care providers. In the US, the separation of physical and mental health records is required by the 1996 Health Insurance Portability and Accountability Act.26 The segregated record-keeping created by this regulation means that only mental health professionals have access to a patient’s mental health records – increasing the risk of fragmented, suboptimal treatment decisions and even medication errors. While patient privacy should be of paramount importance in managing access to patient records, this must be weighed against the benefits of making it easy for clinicians to cooperate and share information. Only mental health is singled out for this exceptional closed status in the US, and no other country that we could find has such a regulation.
These experts also pointed out the missed opportunities for shared savings through multisectoral solutions. The costs of mental illness fall broadly and deeply across societies in the form of significantly higher rates of unemployment, incarceration, hospitalization and lower productivity than countries with a lower prevalence of mental illness.27 Australia has calculated the societal cost of mental illness at about 12% of GDP annually.28 Psychosocial interventions involving other elements of the health system (e.g., general practice physicians, paramedics and geriatricians) and non-health community professionals (e.g., employers, educators and police officers) can be highly effective at identifying and preventing mental illness and providing a broader base of social support to help people before they reach a point of crisis.29
But multisectoral collaborations of this kind are rare. Often the gains that follow from an investment in one intervention may not directly benefit the budget of the organization making the investment. For example, the education sector might need to spend money that is saved by the criminal justice system, or primary care might need to spend money saved by the emergency department or services for the homeless. Thus, budget segregation can prevent rational programmes that would increase overall social welfare.
11Industry Agenda Council on the Future of the Health Sector
Waste may be understood either in terms of suboptimal health outcomes for a given allocation of resources or in terms of excessive spending for a given set of health outcomes. The council assessed the potential contribution of misalignments to waste by conducting a thought experiment based on two questions:
(1) If the world eliminated all inefficiencies, how much could a more effective use of economic resources improve global health? Our analysis reveals that:
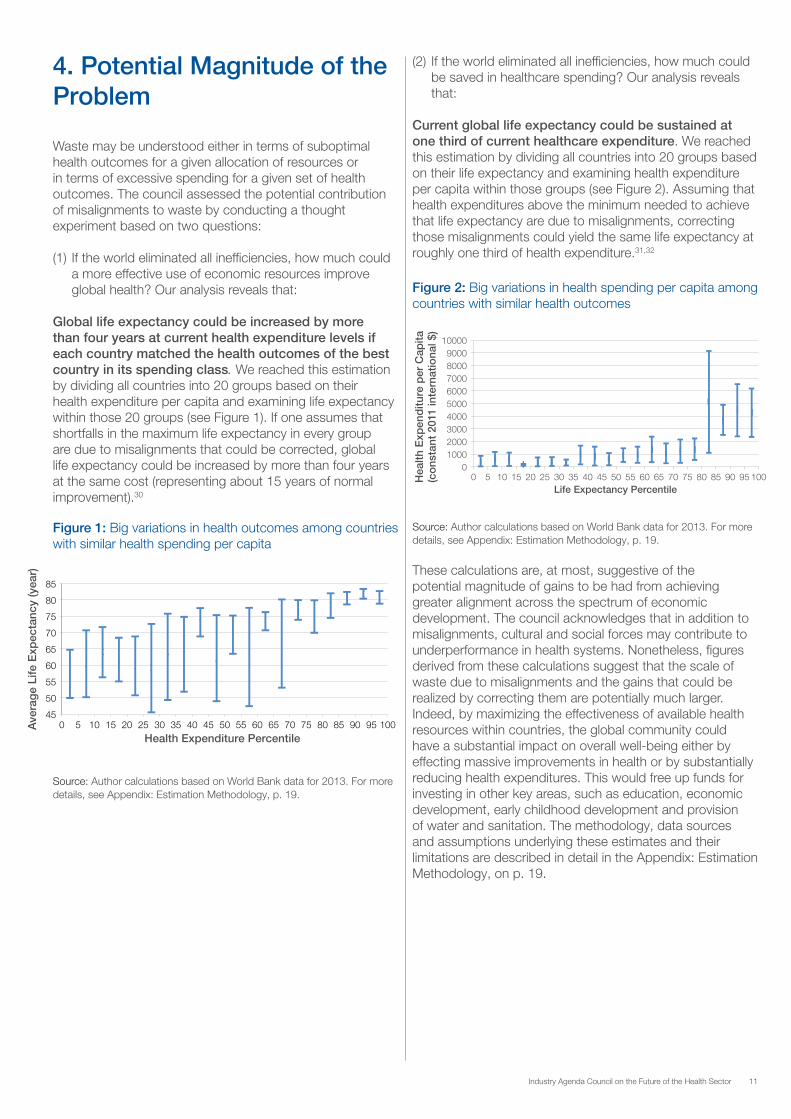
Global life expectancy could be increased by more than four years at current health expenditure levels if each country matched the health outcomes of the best country in its spending class. We reached this estimation by dividing all countries into 20 groups based on their health expenditure per capita and examining life expectancy within those 20 groups (see Figure 1). If one assumes that shortfalls in the maximum life expectancy in every group are due to misalignments that could be corrected, global life expectancy could be increased by more than four years at the same cost (representing about 15 years of normal improvement).30
4. Potential Magnitude of the Problem
Figure 1: Big variations in health outcomes among countries with similar health spending per capita
45
50
55
60
65
70
75
80
85
0 5 10 15 20 25 30 35 40 45 50 55 60 65 70 75 80 85 90 95 100 Ave
rag
e Li
fe E
xpec
tanc
y (y
ear)
Health Expenditure Percentile
0 1000 2000 3000 4000 5000 6000 7000 8000 9000
10000
0 5 10 15 20 25 30 35 40 45 50 55 60 65 70 75 80 85 90 95 100 Hea
lth E
xpen
ditu
re p
er C
apita
(c
ons
tant
201
1 in
tern
atio
nal $
)
Life Expectancy Percentile
Source: Author calculations based on World Bank data for 2013. For more details, see Appendix: Estimation Methodology, p. 19.
(2) If the world eliminated all inefficiencies, how much could be saved in healthcare spending? Our analysis reveals that:
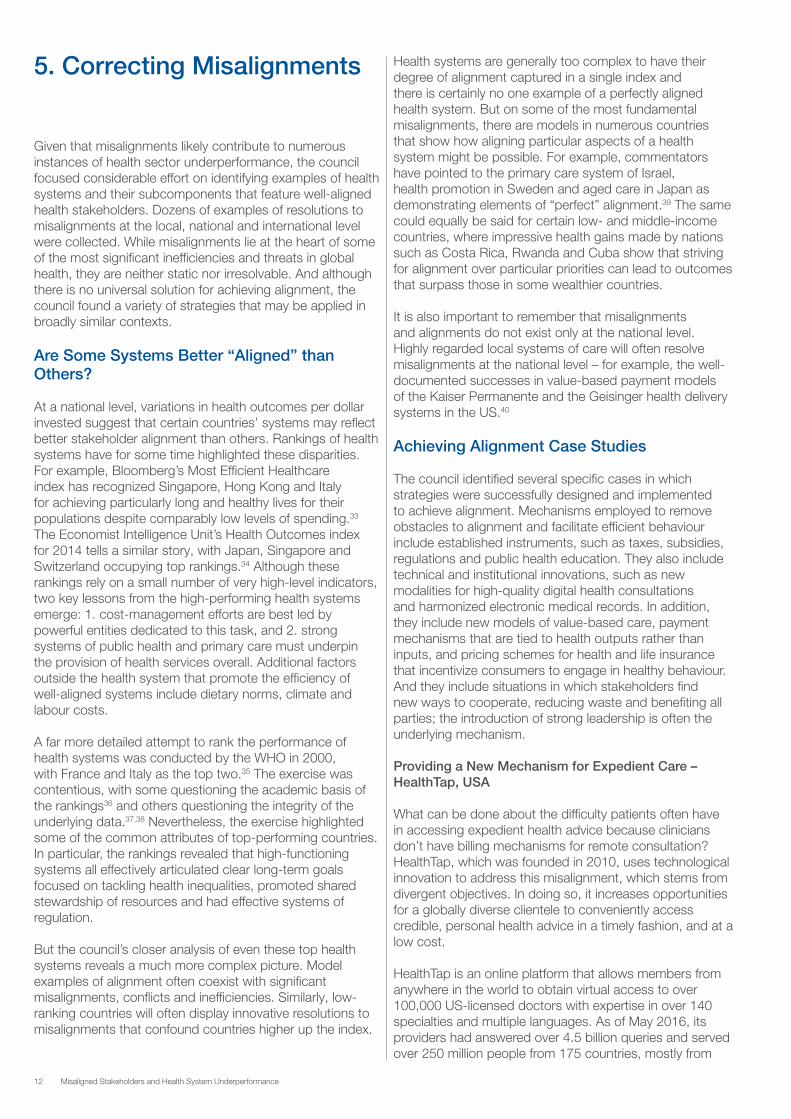
Current global life expectancy could be sustained at one third of current healthcare expenditure. We reached this estimation by dividing all countries into 20 groups based on their life expectancy and examining health expenditure per capita within those groups (see Figure 2). Assuming that health expenditures above the minimum needed to achieve that life expectancy are due to misalignments, correcting those misalignments could yield the same life expectancy at roughly one third of health expenditure.31,32
Source: Author calculations based on World Bank data for 2013. For more details, see Appendix: Estimation Methodology, p. 19.
Figure 2: Big variations in health spending per capita among countries with similar health outcomes
These calculations are, at most, suggestive of the potential magnitude of gains to be had from achieving greater alignment across the spectrum of economic development. The council acknowledges that in addition to misalignments, cultural and social forces may contribute to underperformance in health systems. Nonetheless, figures derived from these calculations suggest that the scale of waste due to misalignments and the gains that could be realized by correcting them are potentially much larger. Indeed, by maximizing the effectiveness of available health resources within countries, the global community could have a substantial impact on overall well-being either by effecting massive improvements in health or by substantially reducing health expenditures. This would free up funds for investing in other key areas, such as education, economic development, early childhood development and provision of water and sanitation. The methodology, data sources and assumptions underlying these estimates and their limitations are described in detail in the Appendix: Estimation Methodology, on p. 19.
12 Misaligned Stakeholders and Health System Underperformance
Given that misalignments likely contribute to numerous instances of health sector underperformance, the council focused considerable effort on identifying examples of health systems and their subcomponents that feature well-aligned health stakeholders. Dozens of examples of resolutions to misalignments at the local, national and international level were collected. While misalignments lie at the heart of some of the most significant inefficiencies and threats in global health, they are neither static nor irresolvable. And although there is no universal solution for achieving alignment, the council found a variety of strategies that may be applied in broadly similar contexts.
Are Some Systems Better “Aligned” than Others?
At a national level, variations in health outcomes per dollar invested suggest that certain countries’ systems may reflect better stakeholder alignment than others. Rankings of health systems have for some time highlighted these disparities. For example, Bloomberg’s Most Efficient Healthcare index has recognized Singapore, Hong Kong and Italy for achieving particularly long and healthy lives for their populations despite comparably low levels of spending.33 The Economist Intelligence Unit’s Health Outcomes index for 2014 tells a similar story, with Japan, Singapore and Switzerland occupying top rankings.34 Although these rankings rely on a small number of very high-level indicators, two key lessons from the high-performing health systems emerge: 1. cost-management efforts are best led by powerful entities dedicated to this task, and 2. strong systems of public health and primary care must underpin the provision of health services overall. Additional factors outside the health system that promote the efficiency of well-aligned systems include dietary norms, climate and labour costs.
A far more detailed attempt to rank the performance of health systems was conducted by the WHO in 2000, with France and Italy as the top two.35 The exercise was contentious, with some questioning the academic basis of the rankings36 and others questioning the integrity of the underlying data.37,38 Nevertheless, the exercise highlighted some of the common attributes of top-performing countries. In particular, the rankings revealed that high-functioning systems all effectively articulated clear long-term goals focused on tackling health inequalities, promoted shared stewardship of resources and had effective systems of regulation.
But the council’s closer analysis of even these top health systems reveals a much more complex picture. Model examples of alignment often coexist with significant misalignments, conflicts and inefficiencies. Similarly, low-ranking countries will often display innovative resolutions to misalignments that confound countries higher up the index.
5. Correcting Misalignments Health systems are generally too complex to have their degree of alignment captured in a single index and there is certainly no one example of a perfectly aligned health system. But on some of the most fundamental misalignments, there are models in numerous countries that show how aligning particular aspects of a health system might be possible. For example, commentators have pointed to the primary care system of Israel, health promotion in Sweden and aged care in Japan as demonstrating elements of “perfect” alignment.39 The same could equally be said for certain low- and middle-income countries, where impressive health gains made by nations such as Costa Rica, Rwanda and Cuba show that striving for alignment over particular priorities can lead to outcomes that surpass those in some wealthier countries.
It is also important to remember that misalignments and alignments do not exist only at the national level. Highly regarded local systems of care will often resolve misalignments at the national level – for example, the well-documented successes in value-based payment models of the Kaiser Permanente and the Geisinger health delivery systems in the US.40
Achieving Alignment Case Studies
The council identified several specific cases in which strategies were successfully designed and implemented to achieve alignment. Mechanisms employed to remove obstacles to alignment and facilitate efficient behaviour include established instruments, such as taxes, subsidies, regulations and public health education. They also include technical and institutional innovations, such as new modalities for high-quality digital health consultations and harmonized electronic medical records. In addition, they include new models of value-based care, payment mechanisms that are tied to health outputs rather than inputs, and pricing schemes for health and life insurance that incentivize consumers to engage in healthy behaviour. And they include situations in which stakeholders find new ways to cooperate, reducing waste and benefiting all parties; the introduction of strong leadership is often the underlying mechanism.
Providing a New Mechanism for Expedient Care – HealthTap, USA
What can be done about the difficulty patients often have in accessing expedient health advice because clinicians don’t have billing mechanisms for remote consultation? HealthTap, which was founded in 2010, uses technological innovation to address this misalignment, which stems from divergent objectives. In doing so, it increases opportunities for a globally diverse clientele to conveniently access credible, personal health advice in a timely fashion, and at a low cost.
HealthTap is an online platform that allows members from anywhere in the world to obtain virtual access to over 100,000 US-licensed doctors with expertise in over 140 specialties and multiple languages. As of May 2016, its providers had answered over 4.5 billion queries and served over 250 million people from 175 countries, mostly from
13Industry Agenda Council on the Future of the Health Sector
the US. The most basic subscription is free of charge and allows members to post anonymous questions – with a 150-character limit – to the HealthTap medical community. Brief informational answers are provided by at least one doctor, typically within 24 hours, with provision for peer review. Members can also access health tips, medical news, mobile app recommendations, checklists and millions of other answers posted by HealthTap providers. Paid subscribers have instantaneous access to real-time consultations for minor conditions with a medical provider of their choice via video, voice or text-based chat.
By facilitating remote consultation, HealthTap makes it more likely for patients to obtain the care they need in an expedient fashion. This has the potential to prevent troublesome illnesses and injuries from progressing unnecessarily, which can lead to inflated healthcare costs and suboptimal health outcomes.
Encouraging Insurers to Cover a New Heart Drug by Minimizing Risk through Pay-for-Performance – Novartis, Cigna, Aetna
A recent pricing accord between a drug manufacturer and two insurance companies shows how a misalignment due to divergent objectives can be corrected by ensuring that risks and rewards are shared more equitably by stakeholders. In February 2016, the Swiss pharmaceutical company Novartis AG reached an agreement with US insurers Cigna Corp. and Aetna Inc. that specifies performance-based pricing for its new heart drug Entresto. This drug has shown promising results in clinical trials, outperforming alternative drugs for heart failure. Significantly, it has also been linked to reduced hospitalization rates.41 Thus, besides being a boon for patient health, it could reduce long-term costs for both patients and insurers. However, a high price point could slow Entresto’s uptake. Priced at $12.50 a day (or $4,560 a year) under traditional models, it stands to cost significantly more than the drugs it is positioned to replace (such as captopril, lisinopril, enalapril and losartan).
The pay-for-performance structure might allay insurers’ concerns about Entresto’s cost. David Epstein, the Division Head and Chief Executive Officer of Novartis Pharmaceuticals, has indicated that payment will be founded on a “fairly modest” base rebate price, which is then adjusted depending on whether the drug’s administration results in sufficiently reduced patient hospitalization rates.42 Essentially, the closer Entresto gets – in the real world – to achieving the same results seen in clinical trials, the greater the payout will be for Novartis. Although insurers will have to pay more if the drug is more effective, they stand to benefit overall from reduced hospitalization costs. It is worth noting that the potential complexity of tracking health outcomes may pose a challenge when implementing this type of contract. Nevertheless, the pay-for-performance model has the potential to align manufacturer and insurer incentives, encouraging investment in solutions with great potential to improve patient outcomes and reduce long-term costs.
Sharing the Savings from Prevention – Discovery Vitality, South Africa
Under traditional life insurance models, premiums are determined based on the policyholder’s demographics, medical condition and lifestyle choices at the time the policy contract is signed. Once established, the premium does not change, regardless of whether the policyholder’s risk of death increases or diminishes. While it is naturally in an individual’s self-interest to take better care of himself or herself, many people do not fully avail themselves of preventive care and optimal health behaviour. Although external motivation could further encourage adoption of these practices, most life insurance policies do not offer incentives to get policyholders to improve their health, even though these improvements benefit both parties. All of the insurance-related financial benefits of decreased risk accrue to the insurer; none is returned to the policyholder.
The South African company Discovery addresses this cooperation failure by packaging life insurance, health insurance and other health-service benefits for its customers through its Vitality programme. This allows Discovery to return some of the financial returns of better health to its policyholders. By meeting healthy living goals, members of its Vitality plan receive rewards such as reduced insurance premiums, discounted gym membership and wearables, cash back on healthy food purchases, or vouchers for travel, shopping and entertainment.
Sharing the savings of healthy behaviour with policyholders incentivizes healthy behaviour at an individual level, which decreases the need for healthcare. The effects can be wide-ranging: a research study of 300,000 people across five years showed that the cost of healthcare for people who were engaged with Vitality was reduced compared to that for non-engaged clients.43 Moreover, the likelihood of being admitted to hospital and the length of average stay in hospital were also reduced in patients who were engaged with Vitality. Additionally, Vitality plans offered as part of employee benefit packages have substantially reduced healthcare costs. Discovery has designed a life and health insurance contract that uses incentives to create health-related financial benefits for the company and its policyholders.
14 Misaligned Stakeholders and Health System Underperformance
Empowering Caregivers – Noora Health, India
At the regional level, the innovative programming from Noora Health in India serves as an example of correcting a cooperation failure in developing country health systems. This non-profit recognized that, by working separately, patients, providers and families were forgoing an opportunity to achieve better health outcomes. To remedy this situation, Noora Health designed a programme to better harness the time and energy of caregivers attending to loved ones in hospital. When a patient is admitted, Noora’s caregiver undergoes interactive group training, followed by hands-on training, certification and supervision while working with the patient. The aim is to give basic but vital training on post-surgical recovery, physical therapy, prevention of infections and recognition of early warning signs of further health problems.
Over 45,000 caregivers have now been trained, with the programme rolled out across more than 25 hospitals (both private and public) and looking to expand across India and beyond. The programme has led to lower rates of preventable complications and unplanned readmissions, lower lengths of stay, improved quality of care and greater patient satisfaction. By fostering cooperation between hospital staff and family carers, Noora Health helps patients achieve better outcomes without requiring significant additional resources.
Enabling Targeted Patient Care and Generating Evidence for Alternative Pricing: COTA, United States
A hospital-level example of correcting cooperation failures – in this case through technical innovation – comes from the Clinical Outcome Tracking Analysis (COTA) programme at the John Theurer Cancer Center in New Jersey. COTA uses data from patients’ electronic medical records to assign each patient an evolving identification number that reflects the specifics of their cancer (type, stage, hormone receptors, etc.), courses of treatment (dose-intensity delivered for each treatment, toxicity, quality of life and overall costs for each episode of care), comorbidities and progression of the disease.
By creating a common system for making apples-to-apples comparisons across patients and treatments, COTA enables providers to generate more reliable real-world outcome benchmarks, empowers oncologists with actionable insights and feedback, enables alternative payment models (bundles) and empowers patients to make better decisions about their care. It thereby helps to improve patient outcomes while reducing costs and provides a robust tool for research (on topics such as navigating clinical trials and accelerating drug discovery and approval processes). And because COTA operates at the hospital level, its costs and benefits can be easily shared. The challenge is to encourage implementation of similar technology in situations in which multiple stakeholders will have to share costs, but will also share much greater benefits over the long term.
Bridging the Global Pain Gap – American Cancer Society’s “Treat the Pain”
Despite opioid pain medications being both affordable and included on the WHO’s Essential Medicines List, cooperation failures restrict access to them in many low- and middle-income countries. Globally, about 7 million cancer or HIV sufferers die annually in moderate or severe pain – with 3.6 million having no access to palliative-care opioids, such as morphine. In countries such as Nigeria, 99% of the 162,000 people that die in pain each year will not receive opioids.44 Notwithstanding the current epidemic of opioid addictions in some high-income countries, the inability of suffering patients to access proper treatment represents a significant failure of health systems in many places around the world.
The American Cancer Society’s programme, “Treat the Pain”, tackles the problem by applying a framework – known by the acronym MORPHINE – to identify and address the needs of key stakeholders. The framework, which has eight stages, starts with 1. influencing the Mindset of policy-makers; 2. Organizing to identify the barriers to access; 3. updating Regulations; and 4. fixing Procurement issues (which often results in establishing local manufacturing facilities). It then 5. offers Health-worker education (many health workers have not been previously trained in pain relief; 6. Initiates the programme in pilot hospitals; 7. Nationalizes the effort; and 8. works to Empower local stakeholders to maintain progress. The whole model is built on mobilizing partners at every level from the police to the Ministry of Health, including health workers and patients. The MORPHINE framework achieves alignment by sensibly and productively engaging all necessary stakeholders in a way that addresses their individual and collective interests.
This alignment case study provides an excellent example of how overcoming cooperation failure can lead to substantial gains in health outcomes (in the form of enhanced quality of life for patients and lessened stress and anxiety for caregivers) without requiring a significant addition of resources. Although administering opioids to suffering patients requires a small net input of money without necessarily prolonging life, the council contends that the MORPHINE framework nevertheless offers enhanced value to patients and health systems.
15Industry Agenda Council on the Future of the Health Sector
Our analysis of the foregoing examples reveals a number of generalizable lessons about how systems can move successfully from misalignment to alignment.
First, alignment does not occur by happenstance. Rather, it is almost exclusively the result of leadership and a commitment to improving quality, affordability, equity and efficiency of care. Most of the alignment examples rely on one stakeholder taking a strong system leadership role; however, there was no discernible pattern with regard to which stakeholder. This suggests that one should not saddle any particular group (such as the government) with the lead responsibility for solving misalignments – progress is as likely to be driven by a payer, provider, supplier or community group. The key is to create a case and space for system-thinking to flourish and to challenge institutional intransigence and short-term self-interest (or at least show how alignment would better meet that self-interest).
Second, stakeholders should work together to highlight and overcome the misalignment. Best practices show that stakeholders should: 1. quantify and highlight a particular area of inefficiency and the value to be unlocked from a different way of working together; 2. agree on a vision for how healthcare could be improved; 3. determine how the benefits of that improvement will be shared; 4. create new – or alter existing – targets and incentives to promote that alignment; and 5. introduce and standardize new care processes across the system.
Depending on the formality of the new targets and incentives, stakeholders may also implement a mechanism to measure and track the impact of change. As in most public and private domains, keys to success in overcoming misalignments include a willingness to approach problem-solving in a cooperative manner – coupled with hefty doses of accountability and transparency and sensitivity to potential unintended consequences.
Third, occasionally, misalignments are overcome by a much more disruptive and unpredictable change. Often a new entrant or technology is introduced that, rather than solving the underlying misalignment, sidesteps it by creating a totally new business or care model – as exemplified by HealthTap, which can be seen as a “disruptive alignment”.
6. Lessons on Achieving Alignments
Fourth, particular alignment approaches tend to pair with different types of misalignment. – In addressing divergent objectives, it is critical to
identify the value being lost to the system (either in health or resources) – which creates the case for finding a new approach that would be better for all or most stakeholders and redesigning incentives to promote that. Possible instruments include shifting business models from the sale of pills and procedures to the sale of health outcomes and, in some cases, the dissolution of unnecessary organizational boundaries through mergers (as with the creation of Accountable Care Organizations).
– In correcting power asymmetries, it is generally not the disempowered group that drives alignment forward but another, more powerful stakeholder. This could be the overly dominant player who comes to recognize the value lost through disempowerment (which is reversed when providers better engage their patients), or a separate organization that acts on behalf of the less powerful party (such as a government or regulator). Common instruments include new taxes or subsidies, or empowering weaker groups with money, information or advice.
– In resolving cooperation failures, a key step is to create a situation in which the benefits of alignment are shared across everyone who needs to act. Mechanisms to do this include direct instruments (such as shared savings schemes and joint ventures) and indirect means of fostering collaboration (such as forums, industry associations and data-sharing agreements). Some cooperation alignments are also spurred by greater media attention to a particular societal problem.
These principles can be used to guide the achievement of better alignment. Though misalignments are common, pervasive and deeply rooted, motivated and engaged stakeholders can do much to correct them and deliver healthcare that improves both health outcomes and financial bottom lines.
16 Misaligned Stakeholders and Health System Underperformance
7. Conclusions and Recommendations
Acknowledgements
At the outset of this project, the council aimed to better understand misalignments, articulate a vision of a more aligned system, design a plan for achieving alignment and estimate the potential health and economic dividends that alignment may offer. By outlining a typology of misalignments based on real-world examples, calculating the possible magnitude of the problem, recounting scenarios in which alignment has been achieved and illustrating key lessons to be drawn from these examples of alignment, our white paper offers a framework for future research into misalignments and their consequences.
The next phase of research and dialogue should focus on developing methods for applying the lessons that we have learned so far – ideally including direct multistakeholder involvement. One goal is to undertake a mock or real-life alignment exercise with representatives from key stakeholder groups, which could be done as part of the Forum’s work in healthcare. Another goal is to create a toolkit, including diagnostic software that would enable researchers and stakeholders to catalogue and classify misalignments. Such a toolkit would offer proven approaches for alignment, drawn from the relevant scientific literature.
As for recommendations for future research on the nature of misalignments, the council suggests: 1. investigating how misalignments impact health equity; 2. identifying examples of system-level alignments in health systems in which universal healthcare is absent; and 3. determining what barriers currently restrict the use of data to assess and correct misalignments.
This white paper also helps to lay the foundation for a new project launched by the Forum and its partners called, Value in Healthcare. Recognizing the inefficiencies and drawbacks of volume-based compensation models (such as fee-for-service), the Global Health and Healthcare team under the recommendation of the Health and Healthcare Governor’s Community is embarking on a multi-year impact initiative of how to accelerate the adoption and implementation of strategies that deliver the best possible value to the patient at a sustainable cost. The project will focus on three objectives: – To increase understanding of what value-based care truly
means and the implications for each stakeholder in the healthcare ecosystem
– To identify concrete areas for extracting value for stakeholders, either by reducing costs or improving health outcomes
– To accelerate shifting the model for healthcare delivery from volume fee-for-service to outcome-based approaches that maximize the value for patients
By advancing knowledge on how to achieve a double bottom line of better patient outcomes and cost-efficiency, this project hopes to catalyse new approaches to healthcare delivery.
The Industry Agenda Council on the Future of the Health Sector would like to acknowledge and express its gratitude to KPMG, and especially Mark Britnell and Jonty Roland, for their collaborative, diligent and creative work. Special thanks also go to Jessica Sullivan and Daniel Cadarette (both at the Harvard T.H. Chan School of Public Health) for their significant and thoughtful contributions to the drafting of this white paper. The council is also grateful to Laura Wallace for her valuable comments and skilful editing of the document. The writing team for this white paper consisted of David Bloom, Daniel Cadarette, Jonty Roland, and Jessica Sullivan.
Key Contributors and Supporters
Council members: David Agus, Peter Bach, Raymond Baxter (vice-chair), David E. Bloom (chair), Mark Britnell, Vijay Chandru, Francis Collins, Victor Dzau, Geoff Ginsburg, Adrian Gore, Andre Goy, Bernard Hoet, Stefan Kapferer (vice-chair), Suresh Kumar, Petra Laux, Javier Lozano, Bobby Prasad, Peer Schatz, Alfred Sommer, Alan Tennenberg, Mary Lou Valdez, Andrey Zarur, and former council members John Glaser, Margaret Hamburg and Pascale Witz
KPMG research team: Jonty Roland (team lead), Chris Hardesty, Randall Baran-Chong, Dhara Desai, Tommy Hana, Chris Leiter and Aman Kumar
Harvard research team: Jessica Sullivan and Daniel Cadarette
World Economic Forum: Arnaud Bernaert, Vanessa Candeias, Olivier Oullier, Roderick Weller, and former Forum team members Shubhra Saxena Kabra, Daniel Akinmade Emejulu and Susanne Weissbaecker
Interviewees: Thank you to the 60 interviewees for sharing your time and insights.
Others: Farah Al Besher, Aneesh Chopra, Nicolaus Henke, Linda Fried, Hu Bo, Sangita Reddy, Edith Schippers, Derek Yach, Ruilin Zhao, Ron Gutman, and participants in the events in San Francisco, Dalian and Luxembourg
17Industry Agenda Council on the Future of the Health Sector
Endnotes and Citations
1. Bloom, D.E. “The Shape of Global Health”. Finance and Development. 2014, http://www.imf.org/external/pubs/ft/fandd/2014/12/bloom.htm
2. Anderson, I. et al. “Indigenous and tribal peoples’ health (The Lancet-Lowitja Institute Global Collaboration): a population study”. The Lancet. 2016, http://www.sciencedirect.com/science/article/pii/S0140673616003457
3. Squires, D. and Anderson, C. “U.S. Health Care from a Global Perspective: Spending, Use of Services, Prices, and Health in 13 Countries”. The Commonwealth Fund. 2015, http://www.commonwealthfund.org/publications/ issue-briefs/2015/oct/us-health-care-from-a-global-perspective
4. The World Bank. “World Development Indicators”. 2015, http://data.worldbank.org/data-catalog/world-development-indicators
5. All references to health spending in this white paper are based on the following definition of “health expenditure” from the World Bank: “Total health expenditure is the sum of public and private health expenditures as a ratio of total population. It covers the provision of health services (preventive and curative), family planning activities, nutrition activities, and emergency aid designated for health but does not include provision of water and sanitation.”
6. The World Bank. “Health Expenditure, Total (% of GDP)”. 2016, http://data.worldbank.org/indicator/SH.XPD.TOTL.ZS
7. For details, see Potential Magnitude of the Problem, p. 11 and the Appendix: Estimation Methodology p.19 (www.weforum.org).
8. For details, see Potential Magnitude of the Problem, p. 11, and Appendix: Estimation Methodology, p. 19
9. For example, recent estimates indicate that one third of all antibiotics prescribed in the United States are unnecessary: www.washingtonpost.com/news/to-your-health/wp/2016/05/03/1-in-3-antibiotics-prescribed-in-u-s-are-unnecessary-major-study-finds
10. Walsh, F. “Superbugs to kill ‘more than cancer’ by 2050”. BBC. 2014, http://www.bbc.com/news/health-30416844
11. For this example, the council chose to focus on countries with strong privately controlled tobacco industries. Countries with state-controlled tobacco industries face a different set of challenges due to internal conflicts of interest. Namely, it can be difficult for the ministry of health to negotiate the implementation of anti-tobacco policies when tobacco production serves as a major source of revenue for the ministry of agriculture and other government bodies.
12. Shih, C., Schwartz, J., and Coukell, A. “How Would Government Negotiation of Medicare Part D Drug Prices Work?” Health Affairs. 2016, http://healthaffairs.org/blog/2016/02/01/how-would-government-negotiation-of-medicare-part-d-drug-prices-work/
13. Gagnon, M. and Wolfe, S. “Mirror, Mirror on the Wall: Medicare Part D pays needlessly high brand-name drug prices compared with other OECD countries and with U.S. government programs.” Carleton University. 2015, http://carleton.ca/sppa/wp-content/uploads/Mirror-Mirror-Medicare-Part-D-Released.pdf
14. Rauhala, E. “Why China’s Doctors Are Getting Beat Up”. TIME. 2014, http://time.com/15185/chinas-doctors-overworked-underpaid-attacked/
15. World Health Organization. “Mental Health Action Plan 2013-2020”. 2013.
16. Ihttp://www.who.int/mediacentre/factsheets/fs380/en/17. OECD. “Growth rates of health spending for selected
functions per capita”. 2015.18. World Health Organization. “Mental Health Action Plan
2013-2020”. 2013.19. World Health Organization. “Mental Health Action Plan
2013-2020”. 2013.2013)20. World Health Organization. WHO Report on the
Global Tobacco Epidemic, 2015: Raising taxes on tobacco. 2015, http://apps.who.int/iris/bitstream/10665/178574/1/9789240694606_eng.pdf
21. Moon, S. and Omole, O. Development Assistance for Health: Critiques and Proposals for Change, London: Chatham House. 2013, https://www.chathamhouse.org/sites/files/chathamhouse/public/Research/Global%20Health/0413_devtassistancehealth.pdf
22. Sridhar, D. and Woods, N. “Are there simple conclusions on how to channel health funding?” The Lancet. 2010, http://www.thelancet.com/journals/lancet/article/PIIS0140-6736(10)60486-2/fulltext
23. Sridhar, D. and Tamashiro, T. “Vertical Funds in the Health Sector Lessons for Education from the Global Fund and GAVI”. UNESCO. 2009, http://unesdoc.unesco.org/images/0018/001865/186565e.pdf
24. Murray, C., Hanlon, M., and Leach-Kemon, K. Financing Global Health 2011: Continued Growth as MDG Deadline Approaches. Institute for health Metrics and Evaluation, University of Washington. 2011, http://www.healthdata.org/policy-report/financing-global-health-2011-continued-growth-mdg-deadline-approaches
25. Barnett, K. et al. Supplementary appendix for “Epidemiology of multimorbidity and implications for healthcare, research, and medical education: a cross-sectional study”. The Lancet. 2012, http://www.thelancet.com/cms/attachment/2009245825/2032056168/mmc1.pdf
26. U.S. Department of Health and Human Services. “Summary of the HIPAA Privacy Rule”. http://www.hhs.gov/hipaa/for-professionals/privacy/laws-regulations/
27. NHS Confederation, Key facts and trends in mental health, (NHS Confederation, 2011)
28. Lancy, A. and Gruen, N. “Constructing the Herald/Age – Lateral Economics Index of Australia’s Wellbeing”. The Australian Economic Review. 2013, http://onlinelibrary.wiley.com/doi/10.1111/j.1467-8462.2013.12000.x/abstract
29. World Health Organization, Mental Health Action Plan 2013-2020, (WHO, 2013)
18 Misaligned Stakeholders and Health System Underperformance
30. If the analysis is conducted using the second-highest life expectancy from each segment (to moderate the effect of outliers), the results suggest a more than three-year increase in global life expectancy.
31. If the analysis is conducted using the second-lowest level of health expenditure from each segment, the results suggest that global health expenditure could be reduced to roughly one half of its current level.
32. Alternatively, if the US is removed from this analysis, the results suggest that health expenditure for all other countries in the sample could be reduced to roughly one half of its current level (for those countries).
33. Bloomberg. “Most Efficient Health Care 2014: Countries”. 2014, http://www.bloomberg.com/visual-data/best-and-worst//most-efficient-health-care-2014-countries
34. The Economist Intelligence Unit. “Health outcomes and cost: a 166-country comparison”. 2014, http://www.eiu.com/Handlers/WhitepaperHandler.ashx?fi=Healthcare-outcomes-index-2014.pdf&mode=wp&campaignid=Healthoutcome2014
35. World Health Organization. The World Health Report 2000 – Health Systems: Improving Performance. 2000, http://www.who.int/whr/2000/en/
36. Jamison, D. and Sandbu, M. “WHO Ranking of Health System Performance”. Science. 2001, http://science.sciencemag.org.ezp-prod1.hul.harvard.edu/content/293/5535/1595.full
37. Musgrove, P. “Judging Health Systems: Reflections on WHO’s Methods.” The Lancet. 2003, http://www.sciencedirect.com/science/article/pii/S0140673603134083
38. Brundtland, G., Frenk, J., and Murray, C. “WHO assessment of health systems performance.” The Lancet. 2003, http://www.sciencedirect.com.ezp-prod1.hul.harvard.edu/science/article/pii/S0140673603137026
39. Britnell, M. In Search of the Perfect Health System. Palgrave Macmillan. October 2015, https://he.palgrave.com/page/detail/?sf1=barcode&st1=9781137496614
40. Shortell, S. et al. “Accountable care organisations in the United States and England: Testing, evaluating and learning what works”. The Kings’ Fund. 2014, http://www.kingsfund.org.uk/sites/files/kf/field/field_publication_file/accountable-care-organisations-united-states-england-shortell-mar14.pdf
41. Pollack, A. “F.D.A. Approves Heart Drug Entresto Said to Cut Death Risk by 20%”. The New York Times. 2015, http://www.nytimes.com/2015/07/08/business/international/fda-approves-heart-drug-entresto-after-promising-trial-results.html
42. Comstock, J. “Novartis signs Aetna, Cigna for pay-or-performance drug deal, but no remote monitoring yet”. Mobi Health News. 2016, http://mobihealthnews.com/content/novartis-signs-aetna-cigna-pay-performance-drug-deal-no-remote-monitoring-yet
43. Patel, D. et al. “Participation in fitness-related activities of an incentive-based health promotion program and hospital costs: a retrospective longitudinal study”. Am J Health Promot. 2011, http://www.ncbi.nlm.nih.gov/pubmed/21534837
44. Hughes-Hallett T. et al. “Dying Healed: Transforming End-of-Life Care through Innovation”. World Innovation Summit for Health. 2014, http://www.wish-qatar.org/app/media/386
19Industry Agenda Council on the Future of the Health Sector
Magnitude of the Problem Calculations
Framework
The Industry Agenda Council on the Future of the Health Sector developed its estimates of the global impact of existing health-spending inefficiencies by addressing two separate questions:
Question 1If the world eliminated all inefficiencies, how much could a more effective use of economic resources improve global health?
Question 2If the world eliminated all inefficiencies, how much could be saved in healthcare spending?
Data
For the purpose of its calculations, the council used the following indicators from the World Bank’s World Development Indicators data set (all data for 2013): – Life expectancy at birth, total (years) – abbreviated as LE;
used as a measure of health – GNI per capita, PPP (current international $) –
abbreviated as GNI; used as a measure of income/available economic resources
– Health expenditure per capita, PPP (constant 2011 international $) – abbreviated as HE; used as a measure of healthcare spending
– Population, total – abbreviated as POP; used to calculated weighted averages
Methodology
Before performing any calculations, the council eliminated any countries and territories that were missing data points for any of the indicators used. In total, 42 countries were eliminated, leaving us with a sample of 173 countries on which to base our calculations.
The relevant sample averages for LE, GNI and HE were comparable to the global averages for the year: – Sample LE = 70.89; global LE = 70.91 – Sample GNI = $14,405; global GNI = $14,373 – Sample HE = $1,232; global HE = $1,223
See below for a list of the 42 countries and territories eliminated from consideration.
Appendix: Estimation Methodology
Question 1To address the first question, the council looked at LE and HE and took the following steps:
1. Sorted the countries in the sample data set according to HE from lowest to highest.
2. Segmented the countries into 20 groups based on their HE, using equal percentile ranges for the segmentation. Each segment contained roughly 5% of the countries in the sample.
3. Found the country with the maximum LE in each segment.
4. Set all of the countries’ LEs to the segment maximum. In other words, the council assumed that each country within a given segment could achieve the highest LE measured in any country from that same segment.
5. Recalculated the weighted LE for the sample, using each country’s POP and the assumed values for LE.
The council also performed this set of calculations using GNI instead of HE. However, we ultimately decided that since HE reflects the sum of resources specifically allocated for health, the calculations using GNI would be less informative for the purposes of this white paper.
Question 2To address the second question, the council again looked at LE and HE and took the following steps:
1. Sorted the countries in the sample data set according to LE from lowest to highest.
2. Segmented the countries into 20 groups based on their LE, using equal percentile ranges for the segmentation. Each segment contained roughly 5% of the countries in the sample.
3. Found the country with the minimum HE in each segment.
4. Set all of the countries’ HEs to the segment minimum. In other words, the council assumed that each country within a given segment could maintain its LE while reducing its HE to the segment minimum.
5. Recalculated the weighted HE for the sample, using each country’s POP and the assumed values for HE.
Results
Question 1Calculations using segment maximums for LE yielded a weighted average of 76.80 years, representing an improvement of 5.91 years over the actual sample average. By comparison, average global life expectancy increased by approximately 5.82 years over a 26-year span from 1987 to 2013. Eliminating all inefficiencies in the allocation of economic resources for health would theoretically allow the world to achieve two-and-a-half decades’ worth of gains in LE.
Question 2Calculations using segment minimums for HE yielded a weighted average of $431 per capita, representing a savings of $801 per capita from the real sample average. Eliminating inefficiencies would theoretically allow the world to reduce healthcare spending to roughly 35% of current levels while achieving the same health outcomes.
20 Misaligned Stakeholders and Health System Underperformance
The implications of these results are further discussed in the main text of this document.
CaveatsThere are several assumptions and limitations that must be kept in mind when reviewing these calculations. First, the council assumed that it would be impractical to imagine a massive global redistribution of resources. These calculations are intended to capture the amount of wasted health given current wealth distribution. Second, these calculations assume that suboptimal health outcomes for a given level of spending are driven solely by misalignments. In real-world settings, many complex factors – including wealth distribution – combine to positively and negatively affect population-level health outcomes. Finally, life expectancy is an imperfect measure of total health. Factors such as physical disability and mental disorders can greatly affect the quality of life. In many real-world scenarios, eliminating misalignments could help reduce disease burden without necessarily affecting average lifespan. End-of-life treatments and palliative care may also appear as waste in these calculations because they tend to cost a great amount of money relative to their impact on life expectancy. However, the council does not wish to diminish the value that many cultures place on caring for the elderly and the ailing.
Additional Notes
Countries and territories eliminated from calculations (missing data points in parentheses):
American Samoa (LE, GNI, HE); Andorra (LE, GNI); Argentina (GNI); Aruba (GNI, HE); Barbados (GNI); Bermuda (HE); Brunei Darussalam (GNI); Cayman Islands (LE, GNI, HE); Channel Islands (GNI, HE); Cuba (GNI); Curaçao (LE, GNI, HE); Djibouti (GNI); Dominica (LE); Faroe Islands (GNI, HE); French Polynesia (GNI, HE); Greenland (LE, GNI, HE); Guam (GNI, HE); Hong Kong SAR, China (HE); Isle of Man (LE, GNI, HE); Korea, Dem. Rep. (GNI, HE); Kosovo (HE); Liechtenstein (GNI, HE); Macao SAR, China (HE); Marshall Islands (LE); Monaco (LE, GNI); Myanmar (GNI); New Caledonia (GNI, HE); Northern Mariana Islands (LE, GNI, HE); Palau (LE); Puerto Rico (HE); San Marino (LE, GNI); St. Maarten (Dutch Part) (LE, GNI, HE); Somalia (GNI, HE); St Kitts and Nevis (LE); St Martin (French Part) (GNI, HE); West Bank and Gaza (HE); Zimbabwe (HE)
World Economic Forum91–93 route de la CapiteCH-1223 Cologny/GenevaSwitzerland
Tel.: +41 (0) 22 869 1212Fax: +41 (0) 22 786 2744
The World Economic Forum, committed to improving the state of the world, is the International Organization for Public-Private Cooperation. The Forum engages the foremost political, business and other leaders of society to shape global, regional and industry agendas.