Embed Size (px)
Citation preview

— WHITE PAPER
How a high performance HMI can lead to greater awareness, faster response and better decisions
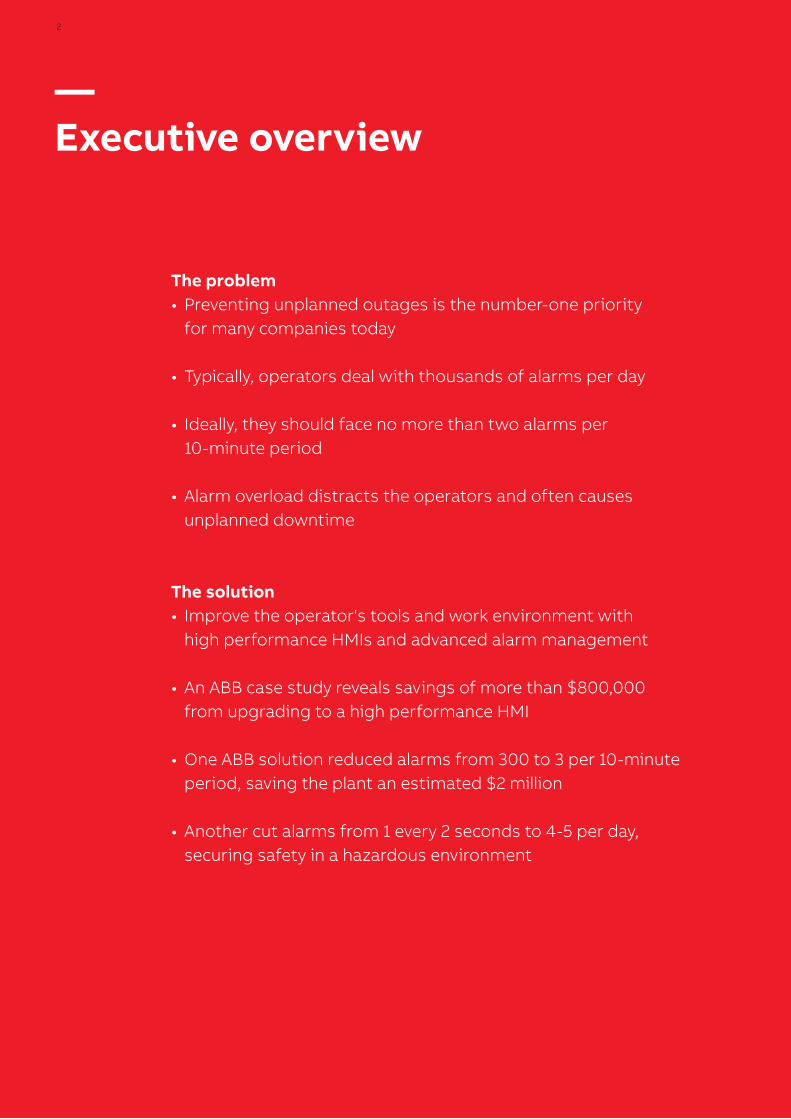
— Executive overview
The problem• Preventing unplanned outages is the number-one priority for many companies today
• Typically, operators deal with thousands of alarms per day
• Ideally, they should face no more than two alarms per 10-minute period
• Alarm overload distracts the operators and often causes unplanned downtime
The solution• Improve the operator's tools and work environment with high performance HMIs and advanced alarm management
• An ABB case study reveals savings of more than $800,000 from upgrading to a high performance HMI
• One ABB solution reduced alarms from 300 to 3 per 10-minute period, saving the plant an estimated $2 million
• Another cut alarms from 1 every 2 seconds to 4-5 per day, securing safety in a hazardous environment
2

—The cause and cost of an unplanned outage
“Unplanned downtime is the number-one issue for many industrial organizations today,” says industry analysts ARC Advisory in a 2016 paper.
The effects of an unplanned outage can be devastating. They can damage equipment, injure personnel, harm the environment, incur penalties and blemish the company’s reputation - in addition to losing revenues and impacting profitability.
Whatever the cause, alarms signal abnormal situations which could result in an unscheduled trip. And abnormal situations are brought to the attention of the operator by alarms.
—How many alarms can an operator handle?
Research shows that the maximum number of alarms that the human brain can deal with is just seven, give or take two, in any 10-minute period.
Ideally, according to the ISA SP 18.2 standard, the maximum number of alarms an operator should face is no more than two in a 10-minute period. In reality, most operators are subjected to a constant stream of alarms. In power generation alone, operators typically deal with 2,000 alarms per day and 350 in a 10-minute peak alarm period.
Clearly, operators cannot do their job effectively when critical alarms are mixed with hundreds or even thousands of non-critical or nuisance alarms. It is therefore unsurprising that they become ambivalent to the constant flow of flashing lights, tending to ignore ‘nuisance’ alarms and run the plant on instinct.
So, how did the control room end up with alarm overload and what can the industry do to solve the problem?
3
—How a high performance HMI can lead to greater awareness, faster response and better decisions

4 H OW A H I G H PE R FO R M A N CE H M I C A N LE A D TO G R E ATE R AWA R E N E S S , FA S TE R R E S P O N S E A N D B E T TE R D ECI S I O N S
—Why we are where we are
a) AlarmsIn control rooms of old, the number of alarms was limited by the amount of space on the control room panel board and the cost of wiring equipment from the production area to the board.
Annunciators, indicators and switches (to acknowledge and clear a resolved alarm) had to be essential to justify a place on the panel. If a new alarm was needed, an existing alarm would usually have to make way.
This began to change with digital signals and the distributed control system (DCS) in the 1980s. Panel boards were replaced by monitors and servers, and signals were transmitted from plant equipment to computer processors, where the signals were turned into actionable information.
The DCS was a gamechanger. Its impact on efficiency, productivity and safety was huge. Alarms became easy and inexpensive to deploy. Soon, each part of the process was equipped with an alarm, which would often trigger as soon as a minor deviation from a setpoint occurred. Alarms were overloading the control room and terms such as flooding, nuisance, chattering, fleeting and stale were coined to describe them and their effect on the operators.
—Figure 1: A DCS control room in the 1980s

W H ITE PA PERH OW A H I G H PE R FO R M A N CE H M I C A N LE A D TO G R E ATE R AWA R E N E S S , FA S TE R R E S P O N S E A N D B E T TE R D ECI S I O N S
5
b) The HMIThe first human machine interfaces (HMIs) of the 1980s were created on a blank slate. There were no templates to guide engineers, so they opted for the familiar. They based their HMI designs on piping and instrumentation diagrams (P&ID), which show how the instrumentation is connected to the plant equipment to control the production process.
Each instrument and item of equipment was numbered, and colors were used to depict process flows, status and alarms, often against a black background. The screenshot of the wet gas system in Figure 2, which dates from the 1990s, is one such HMI graphic. At first glance it is difficult to know if the system is functioning well or if there is a problem or potential upset. Multiply this screenshot by a hundred or so, each of which the operator has to memorize, and the control room becomes a very demanding and stressful workplace.
The problem is compounded by the fact that a significant percentage of the world’s installed base of automation systems is 20 years old or more. Not only are they becoming increasingly difficult and costly to maintain, their HMIs were not designed with operator effectiveness in mind.
—Figure 2: Screenshot of a P&ID-based HMI of the 1990s

6 H OW A H I G H PE R FO R M A N CE H M I C A N LE A D TO G R E ATE R AWA R E N E S S , FA S TE R R E S P O N S E A N D B E T TE R D ECI S I O N S
—High performance HMIs
The difference between traditional and modern HMIs is largely due to superior high performance grayscale graphics, which contain additional context, use color carefully and provide effective alarm handling and analysis.
Together, these improvements maximize the operator’s situational awareness and process surveillance. This enables control room personnel to respond in a timely and correct manner to developing situations before an alarm is activated, thus avoiding equipment failure or an outage.
Research shows that the new generation of HMIs has a huge impact on operator performance:
• they improve the operator’s ability to detect abnormal situations before an alarm occurs by a factor of five;
• the operator success rate in handling abnormal situations is almost 100 percent; and,
• the time it takes to correctly handle the situation is almost half that of operators working with traditional HMIs. (See Figure 3.)
High Performance HMI Proven results!
With traditional HMI
With high performance HMI
Results
Detecting abnormal situations before alarms occur
10% of the time 48% of the time 5 x improvement
Success rate handling abornal situations
70% 96% 37% improvement
Time to complete abnormal situation tasks
18.1 minutes 10.6 minutes 41% improvement
*Source: High Performance HMI Handbook
—Figure 3: Improvements in operator effectiveness
So, let’s look closer at the two elements that make such a huge improvement in operator effectiveness.

W H ITE PA PERH OW A H I G H PE R FO R M A N CE H M I C A N LE A D TO G R E ATE R AWA R E N E S S , FA S TE R R E S P O N S E A N D B E T TE R D ECI S I O N S
7
a) High performance graphics At first glance traditional HMIs are attractive, well designed and more prudent with color than the first-generation HMI in Figure 2. But when compared with high performance graphics their shortcomings are evident: alarm colors and process colors tend to be the same, unnecessary information distracts the operator from essentials, high and low alarm limits are not shown, and embedded trends are not displayed.
The most obvious difference between modern and traditional HMIs is the use of high resolution grayscale graphics. Compared to the color-intensive, over-informative designs of the recent past, high performance graphics are minimalistic in their use of color and information. Their objective is to be effective, not attractive, and to draw the attention of the operator only to those situations that require attention. Too much use of color, shapes and motion reduces the operator’s focus by spreading it over too many objects.
This sparing use of color and detail is evident in Figure 4. On the left is a typical traditional graphic still widely used today. Although it is attractive to look at, and is a great improvement on the P&ID mimicry and black background of the 1990s, it is still too ‘busy’. There are too many shapes, too much motion and, most importantly, the same colors - red, green and yellow - are used for process as well as alarms.
In the grayscale graphic on the right, however, it is immediately apparent that there is an alarm in the high pressure drum level. There is no other colorful or animated information in the graphic to distract the operator’s attention or prevent a rapid response.
—Figure 4: Colorful and confusing vs. gray and intuitive

8 H OW A H I G H PE R FO R M A N CE H M I C A N LE A D TO G R E ATE R AWA R E N E S S , FA S TE R R E S P O N S E A N D B E T TE R D ECI S I O N S
Besides grayscale graphics and the consistent and careful use of color, shapes and motion, high performance graphics typically include the following features to maximize the attention and effectiveness of the operator:
• Alarm priority colors are used for alarms only• Consistency in graphic layout to ensure operator situational awareness• Tab-based navigation for one-click access to primary displays• Embedded trends, which display historical data in a graphic to efficiently draw the attention of the
operator to abnormalities and deviations• The normal operating range and high / low alarm limits are shown for each item of equipment using
an intuitive bar graph (see Figure 5)• Bubble-up alarming allows the alarm with the highest priority to ‘bubble up’ above lower priority
alarms associated with the same device• Integrated help displays in the form of pop-ups• Extendable faceplates put all the information the operator needs in one place• Level 1 surveillance of the entire plant or unit in one graphic to facilitate rapid visualization of the
entire process, as well as KPIs• Level 2 visualization of specific parts of the process, providing alarms, information and controls for
each area and easy navigation to level 3 graphics (P&ID style displays)• Alarm macros for condition-based alarming, if each alarm condition needs to be managed
individually
"We don't want grayscale. We're happy with what we've got." Operators who have been using the same control system and HMI for years or decades are sometimes reluctant to move from the colorful graphics they are familiar with to the dull gray of high performance HMI.
Once the operators have experienced the improvement that grayscale graphics make to their performance in the control room, their resistance fades. But for those who struggle to accept grayscale graphics, a phased approach can be employed to help ease them through the transition.
For instance, process colors can be used - even the red, green and yellow reserved for alarms - but in a muted, darker shade to distinguish them from alarms. Shapes can also be used to distinguish different levels of alarm priority - a square for priority 1, a triangle for 2, a diamond for 3, and so on.
Such a phased approach gradually accustoms operators to their new high performance environment.
—Figure 5: Normal operating range and alarm limits in an intuitive bar graph
HP bar graph HP bar graph states

W H ITE PA PERH OW A H I G H PE R FO R M A N CE H M I C A N LE A D TO G R E ATE R AWA R E N E S S , FA S TE R R E S P O N S E A N D B E T TE R D ECI S I O N S
9
b) Alarm management
As stated earlier, operators are five times more likely to detect abnormal situations before an alarm occurs with the new generation of high performance HMIs than with conventional graphics. Once an alarm is triggered, operators solve the problem in about half the time than with traditional interfaces.
High-performance HMIs not only make abnormal situations immediately visible on the screen, they also significantly reduce the number of alarms that compete for the operator’s attention.
But advanced alarm handling and analysis is only effective in concert with an alarm management philosophy and with continuous analysis and rationalization of the alarm system.
All power generation facilities should have a plant-wide and plant-specific alarm philosophy document that describes how alarms should work in the facility. The document should follow standards and guidelines like ISA SP 18.2, IEC 62682 and EEMUA 191. And it should define the KPIs of the alarm system.
These KPIs are used to compare the plant’s alarm system performance against the benchmarks of the ISA SP 18.2 standard or EEMUA 191 guidelines. For instance, the long-term average alarm rate for a plant in steady operation should be less than one alarm every 10 minutes; and the number of alarms during the first 10 minutes after a major plant upset should be below 10.
Continuous measurement of the alarm KPIs is crucial for maintenance and optimization of the system. If the plant and company have implemented the Six Sigma program, the alarm management system should follow the continuous Define – Measure – Analyze – Improve – Control cycle of the Six Sigma program.
KPI measurement enables the ‘noise’ that disturbs the alarm management system to be identified and targeted for suppression, shelving or removal - the so-called bad actor, chattering, nuisance, concurrent and inconsequential alarms that perform little or no function, but which have a debilitating effect on operator effectiveness.
The combination of an advanced alarm management system, integrated with the plant’s high performance HMI, meets the four principles of effective alarm management:
• Each alarm should alert, inform and guide;• Alarms should be presented at a rate that operators can deal with;• Detectable problems should be alarmed as early as possible; and• Cost/benefit of alarm engineering should be reasonable.

10 H OW A H I G H PE R FO R M A N CE H M I C A N LE A D TO G R E ATE R AWA R E N E S S , FA S TE R R E S P O N S E A N D B E T TE R D ECI S I O N S
ABB has identified high performance HMIs as one of the four pillars of operator effectiveness, which together enable control room personnel to do their job efficiently and make correct, informed and timely decisions. Link: Operator effectiveness white paper.
If operators are given the best possible tools and working environment, they will remain focused throughout their shift and better able to avoid process upsets, equipment failure and production downtime. The four pillars are:
a single automation system that integrates all plant operations and turns raw data into actionable information in context;
an ergonomically designed control room to enhance operator performance and reduce stress and fatigue;
continuous investment in raising operator expertise and decision-making through training and process simulation; and
High performance HMIs that provide clear, intuitive process graphics, user context navigation and simplified alarm management.
—The four pillars of operator effectiveness

W H ITE PA PERH OW A H I G H PE R FO R M A N CE H M I C A N LE A D TO G R E ATE R AWA R E N E S S , FA S TE R R E S P O N S E A N D B E T TE R D ECI S I O N S
11
Alarm rationalization saves $2 millionAn energy company improved control room operations and corrected its poor alarm management at a gas plant in North Africa. Missed alarms, among other operational and ergonomic issues, were singled out as a major contributor to compressor trips that resulted in downtime and lost production.
Installing an effective alarm management system reduced the number of alarms from more than 300 per 10-minute period to just three, well below the EEMUA guideline of 7 +/- 2. This helped reduce the compressor trips from 27 to 7 over a one-year period, saving an estimated $2 million.
High performance HMIs save $800,000 annuallyA recent study of operators at a petrochemical plant in North America measured and compared their situational awareness in a conventional distributed control system environment against one in a high-performance HMI environment using grayscale graphics and integrated alarm management. The figures in table 1 speak for themselves. They translate into estimated cost savings of $800,000 per year:
From 1 alarm every 2 seconds to 5-10 per weekTo achieve the best results, alarm management has to be a plant-wide strategy or program involving people from multiple disciplines, such as operations, maintenance, I&C engineering and management.
Several US power plants using this team approach and ABB’s alarm analysis tools were able to target a small number of alarms (5-10) each week and address them as a team. Over time this eliminated bad actors and brought alarm rates in line with those recommended by the standards. This improved operations because each alarm was actionable and operators reacted with urgency when faced with an alarm.
All three use cases are ABB solutions on behalf of customers. High performance HMIs and advanced alarm management are part of the ABB Ability™ Symphony® Plus total plant automation platform for the power generation, water and process industries. ABB is the world’s leading supplier of distributed control systems, both overall and in industries likes oil and gas, pulp and paper, mining and metals, and power generation.
—Use cases
TaskWith traditional HMI
With high performance HMI
Results
Detecting abnormal situations before alarms occur
10% of the time 48% of the time 5 x increase
Success rate handling abornal situations
70% 96% 26% over base case
Time to complete abnormal situation tasks
18.1 minutes 10.6 minutes 41% reduction
—Figure 6: Comparison of operator effectiveness in a conventional DCS environment against one using high- performance HMIs

—Contact us
Tom MaczuzakBusiness DevelopmentABB Power Generation & Water
Bob KanelDirector of TechnologyABB Power Generation & Water
—abb.com/symphonyplusabb.com/powergenerationabb.com/water
—Note:We reserve the right to make technical changes to the products or modify the contents of this document without prior notice. With regard to purchase orders, the agreed particulars shall prevail. ABB does not assume any responsibility for any errors or incomplete information in this document.
We reserve all rights to this document and the items and images it contains. The reproduction, disclosure to third parties or the use of the content of this document – including parts thereof – are prohibited without ABB’s prior written permission.
Copyright© 2018 ABB All rights reserved
ABB Ability is a trademark of ABB.Symphony and Symphony Plus are registered or pending trademarks of ABB.All rights to other trademarks reside with their respective owners. 8
VZ
Z0
00
576
T0
00
0 P
ow
er G
ener
atio
n a
nd
Wat
er 0
218