Embed Size (px)
Citation preview

1 | P a g e
Draft White Paper
The Cost and Effectiveness for Health, Safety, and Security
of Fire Alarm Systems and Fire Sprinkler Systems
in 3 to 6 Unit Residential Buildings
Issued by the
State Board of Building Regulations and Standards
The Board of Building Regulations and Standard seeks your feedback on this white paper.
Please forward comments via the author: [email protected]
617 862 5215
February 11, 2014

2 | P a g e
The Cost and Effectiveness for Health, Safety, and Security
of Fire Alarm Systems and Fire Sprinkler Systems
in 3 to 6 Unit Residential Buildings
Table of Contents Abstract ............................................................................................................................................3
Section 1: Introduction .....................................................................................................................3
Section 2: Background .....................................................................................................................4
Section 3: Home value vs. Income ..................................................................................................6
Section 3a: USA Data ................................................................................................................. 6
Section 3b: MA Data .................................................................................................................. 6
Section 3c: Affordability............................................................................................................. 8
Section 4: Fire Protection System Operation and Costs for Residential Buildings .........................9
Section 4a: Sprinkler System Operation ..................................................................................... 9
Section 4a(1): Costs for One- and Two-Family Dwellings .................................................. 10
Section 4a(2): Costs for Multi-Unit Residential Buildings................................................... 10
Section 4b: Smoke Detection/Fire Alarm System Operation ................................................... 11
Section 4b(1): Costs for One- and Two-Family Dwellings .................................................. 11
Section 4b(1): Costs for Multi-Unit Residential Buildings .................................................. 11
Section 5: Mortality in the USA ....................................................................................................11
Section 5a: Mortality Causes .................................................................................................... 12
Section 5b: Accidents (Unintentional injuries) ......................................................................... 12
Section 5c: Mortality Rates and Policymaker Action ............................................................... 14
Section 5d: Mortality due to Building Occupancy ................................................................... 14
Section 6: Fire Safety in Residential Buildings .............................................................................15
Section 6a: USA Data ............................................................................................................... 15
Section 6b: MA Data ................................................................................................................ 18
Section 6b(1): Analysis of data from the One- and Two-Family Sprinkler Report. ............. 18
Section 6b(2): MFIRS and Multi-Unit Residential Buildings .............................................. 19
Section 7: Property Loss due to Fires in MA (reserved) ...............................................................19
Section 8: Conclusions and Recommendations .............................................................................19
Conclusion 1: ............................................................................................................................ 20
Conclusion 2: ............................................................................................................................ 20
Conclusion 3: ............................................................................................................................ 20
Conclusion 4: ............................................................................................................................ 20
Recommendation 1: .................................................................................................................. 20
Recommendation 2: .................................................................................................................. 20
Recommendation 3: .................................................................................................................. 20
Notes to Section 1 ................................................................................................................. 21
Notes to Section 2 ................................................................................................................. 21
Notes to Section 3 ................................................................................................................. 22
Notes to Section 4 ................................................................................................................. 24
Notes to Section 5 ................................................................................................................. 25
Notes to Section 6 ................................................................................................................. 25
Notes to Section 7 (reserved) ................................................................................................ 27
Notes to Section 8 ................................................................................................................. 27

3 | P a g e
Abstract This study was the outcome of recent actions taken by the Board of Building Regulation and Standards (BBRS). In November 2013, the BBRS directed its Department of Public Safety (DPS) Staff to determine if fire protection, specifically sprinkler requirements, were being installed in existing multi-unit residential building renovations at the same ‘rate’ since 2010 compared to 2009 and earlier. The results of the study, which were reviewed in December 2013, showed that sprinkler installations were installed at a high rate since 2010, which was the inception of the current edition of the building code. However, the study revealed additional issues including inconsistent code requirements and enforcement, variation in cost of construction, and a wide disparity in construction activity across the seven municipalities that contributed to the study. Consequently, in January 2014, the BBRS directed DPS to address these issues in a White Paper (paper). Key findings from this paper include:
1. trends in home values versus income which show that home prices are more quickly outpacing the ability (income) of typical wage earners to purchase them;
2. cost of fire protection systems. For 3 unit residential buildings the cost of a sprinkler system is $6,000 per unit and a fire alarm system is $1300 per unit. Both systems and a monitoring system at additional cost are currently required by the building code;
3. mortality associated with unintentional fatalities during transport and non transport human activity in the USA in 2010. In the non transport group, accidental exposure to smoke, fire and flames account for 2% of the total while motor vehicle accidents, falls, and accidental poisoning and exposure to noxious substances lead with 29%, 27%, and 22% respectively. In addition, mortality due to building occupancy is assessed;
4. leading causes of fire in 2009-2011 residential fire fatalities and causes of known fires in multi-unit residential buildings. Fatalities are the result of Other Unintentional, Careless (16%), smoking (15%), electrical (11.2%), and intentional (9.4%) and the cause of most known fires in multi-unit residential buildings is cooking (70%);
and provides: 5. a recommendation for Department of Public Safety (DPS) staff to conduct state-wide
training on Chapter 34 (Existing Buildings) to regulators and the regulated community to enhance consistency in the application and enforcement of this chapter of the MA state building code.
6. a recommendation for DPS staff to create a code change proposal for R-2 Residential buildings of 3 to 6 units which incorporate the conclusions of this paper along with conclusions for a similar paper on the Energy Conservation requirements of the building code.
Section 1: Introduction The Massachusetts Board of Building Regulations and Standards (BBRS) is a Massachusetts Board of eleven members M.G.L. c. 143, §93 , nine of whom are appointed by the Governor. The BBRS is also authorized by M.G.L. c. 143 §94 (h) to formulate and periodically update the state building code, which has been in effect since 1975. Additionally, the BBRS has a statutory duty pursuant to M.G.L. c. 143, §94 (c) “[to] make a continuing study of the operation of the state building code, and other laws relating to the construction of buildings to ascertain their

4 | P a g e
effect upon the cost of building construction and the effectiveness of their provisions for health, safety, energy conservation and security.” 1 No Massachusetts board with oversight of construction including the plumbing code, the electrical code, the sheet metal code, or the fire code, has the same duty. The price of homes in MA and the USA is a function of many market variables including the health of the national, state, and local economies, which influence supply of and demand on the housing stock. However, irrespective of other variables one thing is certain; the type and quality of building construction for new or existing residential units can be directly tied to the purchase price of a home. For example, two new homes, constructed by the same builder on identical and adjacent parcels of land; one built to the 4th edition of the code and the other built to the 8th edition of the code will not be priced equally, because more code regulation almost invariably leads to higher construction costs. Although the public has an opportunity via M.G.L. c. 30A, §20 to provide comment to the BBRS, the citizens of the Commonwealth are not really ‘at the table’ with the BBRS. Instead, building officials, fire officials, builders, code consultants, and others associated with the building industry are the usual participants; each advocating for a special interest. Without actual widespread public comment the BBRS should protect the interests of the consumer and maintain an independent and reasonable approach when reviewing and promulgating building code requirements. The purpose of this paper is to assist the BBRS in meeting its statutory obligation to continually review the cost of construction and to assure that for all building code requirements there is commensurate life safety benefit. Onerous and costly code requirements too often have a negative ripple effect, for example; the owner will meet the requirement and increase unit rent or sale price to offset the construction costs; the owner will take units out of service2 which further exacerbates an already tight housing market; or the owner will do cosmetic touch up and avoid high cost items that the code may require. Thus, if the life safety benefit does not justify the cost then it is the responsibility of the BBRS to explore alternatives such as reducing or eliminating the requirement.
Section 2: Background This section contains a timeline1 of various editions of the Massachusetts State Building Code (780 CMR or the ‘code’) and a general description of the scope of requirements and on what national or local standard(s) it was based on.
1st and 2nd Editions 1/1/1975. 3rd Edition 6/1/1979. 4th Edition 9/1/1980. 5th Edition 3/1/1991. 6th Edition 2/28/1997 (Commercial) and 1998 (One- and Two-Family) 7th Edition 9/1/2008 (Commercial) and 1/1/2008 (Residential) 8th Edition 8/6/2010 (Commercial) and 2/4/2011 (Residential)
The early editions of the code were influenced by the Boston Building Code, while later editions were based on commercial codes issued by Building Officials and Code Administrators International, Inc. (BOCA), and the one and two family codes issued by The Council of

5 | P a g e
American Building Officials (CABO). The 7th and 8th editions were based on the International Code Council (ICC). The ICC codes are in use to some extent by many states.
The 1st through 6th Editions were unique MA documents that utilized the BOCA Code requirements for commercial buildings and the CABO Code for one- and two-family dwellings. Both the BOCA and CABO codes were modified to incorporate unique MA requirements.
The 7th Edition utilized the ICC’s International Building Code 2003 and the International Residential Code 2003 and incorporated a significant quantity of unique MA requirements into these documents.
The 8th Edition utilized the ICC’s International Building Code 2009 and the International Residential Code 2009, but placed the unique MA requirements in a separate document. In this manner it was much easier to see the sheer number of additional requirements that building owners and developers in the Commonwealth need to deal with. All of the New England states use some version of the ICC codes, and none has as many requirements as MA. Two points of this edition change should be highlighted: 1) the BBRS directed its technical advisory committees to make the 8th edition ‘with equivalent life safety’ to the 7th edition, in essence meaning that a building constructed to either edition would have similar code requirements; and 2) the technical advisory committees were not explicitly directed to consider the cost of construction in this effort. However, in 2011 the BBRS directed its advisory committees to review unique MA requirements which add to cost of construction relative to the requirement as found in the International Building Code 2009 (IBC). As a result of this effort2 many MA requirements were removed from the code. Over the past several decades the code has undergone regulatory expansion3 including, but not limited to:
• Energy conservation due to national initiatives on climate change and energy dependence on foreign supplies of oil, etc. For residential buildings this has resulted in requirements for air tight buildings and the need to hire experts to verify building performance via blower door and duct leakage testing. Recently mandatory mechanical ventilation is required. In addition the Commonwealth was the first state in the nation to develop and utilize a Stretch Energy Code (Appendix 115AA) which in turn heavily influenced the development of the International Energy Conservation Code 2012 to the point where blower door testing is now a standard requirement in many states across the nation.
• Building design and construction since 1992 when Hurricane Andrew devastated parts of Florida. Consequently, the Home Insurance Industry became heavily involved in the national code-writing process, and since 1992 the residential code has been impacted by requirements for ‘hurricane fastening of framing’ and ‘wind-borne debris’ of doors and windows.
• Fire protection has always been an area where the Commonwealth has invoked more requirements4 than any other New England state. In addition, the 6th Edition of the code was likely the most stringent new construction commercial state building code in the nation as it significantly “upped the ante” and required fire sprinklers in most new commercial buildings. This was a move away from a traditional construction method which allowed an architect or engineer to separate different ‘uses’ in the same building with fire rated walls and ceilings. The code required many residential and commercial buildings to be sprinklered in 1997; ahead of any national code at that time. As the
6 | P a g e
national codes evolved since then it is apparent that sprinkler advocates have had significant influence; the ICC codes also now require sprinklers for most uses (educational, mercantile, residential, etc.). However, key differences between the Commonwealth requirements and ICC codes and even neighboring New England states exist. As just one example a building constructed for a ‘business’ use in the Commonwealth requires sprinklers via M.G.L c. 148 §26G when its area is just 7500 sq ft as opposed to 12,000 sq ft elsewhere in New England and in most other states across the nation.
In summary, the BBRS has reviewed the costs of construction as the code and laws evolved from 1975 to present. The purpose of this paper is to ensure that the BBRS continues to comply with its statutory obligation to review the cost of construction in response to the concerns raised with respect to fire protection of new and existing R-2 residential buildings. The background herein provides historical context that will be considered in the conclusions and recommendations that follow in Section 8.
Section 3: Home value vs. Income This section examines national and local data1 on home value and income, not including data on rental housing and income. Because the construction costs of residential buildings can be directly tied to ‘price,’ it is important to provide background on home affordability with regard to purchase and ownership. In the USA individuals and families, have in general been afforded a choice to either buy or rent a home. The data and trends shown in the next sections indicate that fewer people in the USA including MA residents are capable of purchasing a home, which is why the BBRS should maintain a focus on the cost of construction and, when necessary, amend the code if appropriate.
Section 3a: USA Data
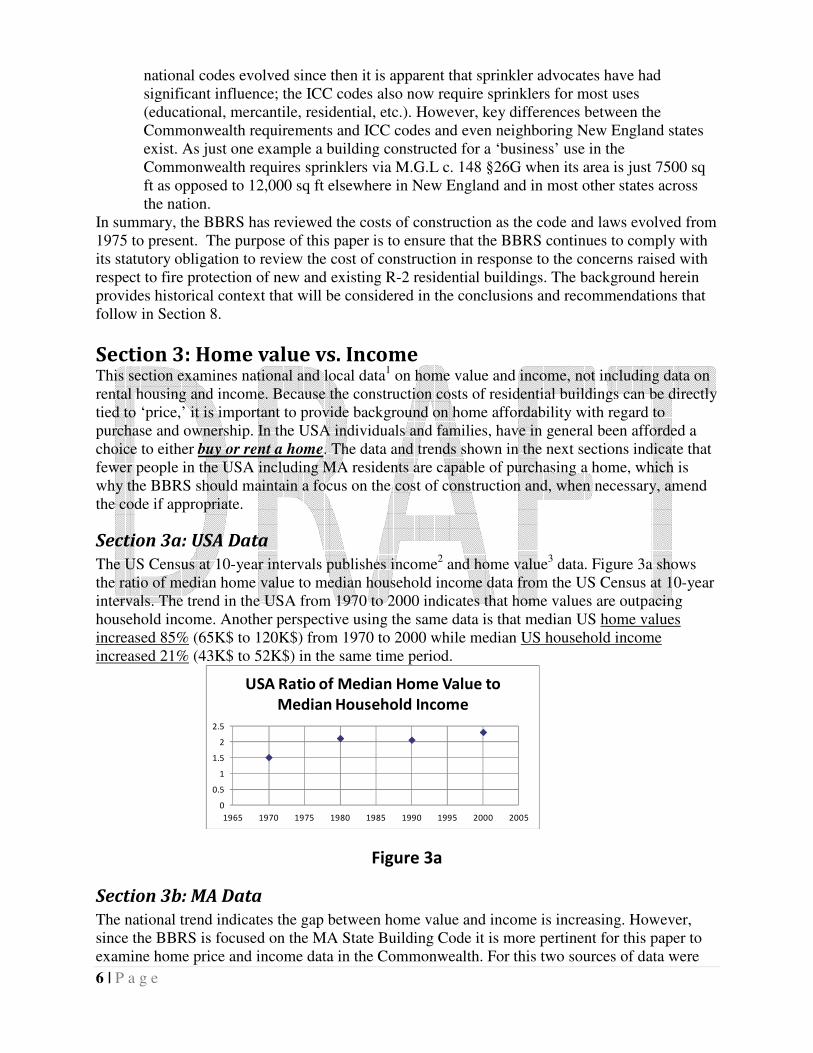
The US Census at 10-year intervals publishes income2 and home value3 data. Figure 3a shows the ratio of median home value to median household income data from the US Census at 10-year intervals. The trend in the USA from 1970 to 2000 indicates that home values are outpacing household income. Another perspective using the same data is that median US home values increased 85% (65K$ to 120K$) from 1970 to 2000 while median US household income increased 21% (43K$ to 52K$) in the same time period.
Figure 3a
Section 3b: MA Data
The national trend indicates the gap between home value and income is increasing. However, since the BBRS is focused on the MA State Building Code it is more pertinent for this paper to examine home price and income data in the Commonwealth. For this two sources of data were
0
0.5
1
1.5
2
2.5
1965 1970 1975 1980 1985 1990 1995 2000 2005
USA Ratio of Median Home Value to
Median Household Income

7 | P a g e
studied; median sale price of residential units and median household income in MA. The sale price data are from the Greater Boston Association of REALTORS4 (GBAR) and the income data are from American Community Survey5 by the US Census Bureau. Figure 3b(1) shows median sale price of single-family homes and condominiums in MA from 2005 to 2012 and Figure 3b(2) shows median household income for 2005 to 2012. The ratio of sale price to household income is shown in the Figure 3b(3). Although the trend of the ratio is relatively flat through the years 2005 to 2012, it should be noted that the value of the price to income ratio is nearly double the USA ratio. In other words, in the year 2000 the US median home value is about double the household income, while in the year 2012 the MA median home price is more than four times the household income.
Figure 3b(1)
Figure 3b(2)
0
50000
100000
150000
200000
250000
300000
350000
400000
2004 2005 2006 2007 2008 2009 2010 2011 2012 2013
MA Median Single Family Home Sale
Price (YTD December)
0
50000
100000
150000
200000
250000
300000
350000
400000
2004 2005 2006 2007 2008 2009 2010 2011 2012 2013
MA Median Condominium Sale Price
(YTD December)
$63,000
$64,000
$65,000
$66,000
$67,000
$68,000
$69,000
$70,000
$71,000
2004 2005 2006 2007 2008 2009 2010 2011 2012 2013
MA Median Household Income

8 | P a g e
Figure 3b(3)
Section 3c: Affordability
The trends and comparisons of income and home value data appear to reveal an erosion of the ability of a household to purchase a home. Another perspective can be found by examining the method by which lenders qualify potential buyers for a home mortgage loan. There are various tools6 available to do this. However, assumptions should be made to simplify but not skew the results. For this analysis various down payment values are used; no preexisting debt is assumed; property tax of 1% of the purchase price is used; insurance of .5% is used; and a 30-year mortgage at 4.64% APR is assumed. Figure 3c(1) shows the gross income required to qualify for a mortgage loan for a home at a particular price. For example, a household with an income equal to the 2012 MA median value of $58,000 and a down payment of $20,000 can qualify for a mortgage for a home priced at $240,000, which is $40,000 below the median condominium price in MA in 2012. This example may not even represent a realistic case because households may have existing debt or not hold a down payment of $20,000 or $40,000. And this example uses median household income7; the situation becomes worse for individual wage earners.
140
190
240
290
340
30 50 70 90 110
Ho
me
Pri
ce i
n K
$
Gross Income in K$
Home Price vs. Required Gross Income
Home Price with $10,000
down
Home Price with $20,000
down
Home Price with $40,000
down
Figure 3c(1)
9 | P a g e
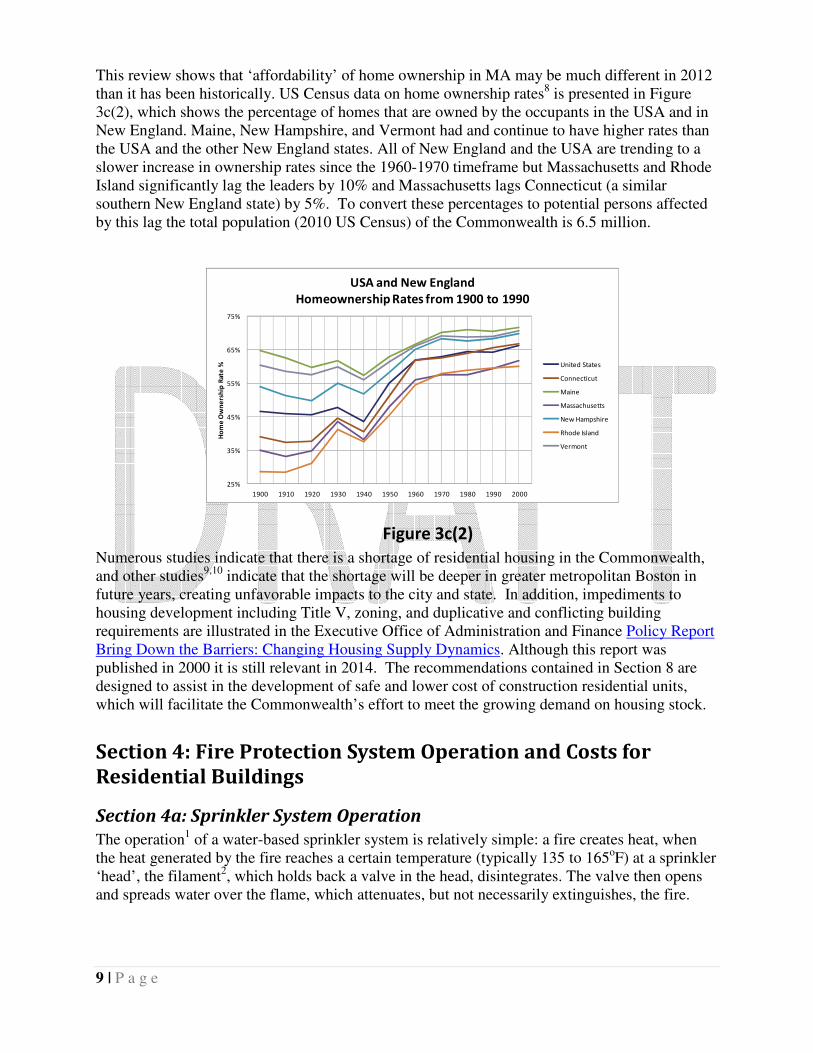
This review shows that ‘affordability’ of home ownership in MA may be much different in 2012 than it has been historically. US Census data on home ownership rates8 is presented in Figure 3c(2), which shows the percentage of homes that are owned by the occupants in the USA and in New England. Maine, New Hampshire, and Vermont had and continue to have higher rates than the USA and the other New England states. All of New England and the USA are trending to a slower increase in ownership rates since the 1960-1970 timeframe but Massachusetts and Rhode Island significantly lag the leaders by 10% and Massachusetts lags Connecticut (a similar southern New England state) by 5%. To convert these percentages to potential persons affected by this lag the total population (2010 US Census) of the Commonwealth is 6.5 million.
25%
35%
45%
55%
65%
75%
1900 1910 1920 1930 1940 1950 1960 1970 1980 1990 2000
Ho
me
Ow
ne
rsh
ip R
ate
%
USA and New England
Homeownership Rates from 1900 to 1990
United States
Connecticut
Maine
Massachusetts
New Hampshire
Rhode Island
Vermont
Figure 3c(2)
Numerous studies indicate that there is a shortage of residential housing in the Commonwealth, and other studies9,10 indicate that the shortage will be deeper in greater metropolitan Boston in future years, creating unfavorable impacts to the city and state. In addition, impediments to housing development including Title V, zoning, and duplicative and conflicting building requirements are illustrated in the Executive Office of Administration and Finance Policy Report Bring Down the Barriers: Changing Housing Supply Dynamics. Although this report was published in 2000 it is still relevant in 2014. The recommendations contained in Section 8 are designed to assist in the development of safe and lower cost of construction residential units, which will facilitate the Commonwealth’s effort to meet the growing demand on housing stock.
Section 4: Fire Protection System Operation and Costs for
Residential Buildings
Section 4a: Sprinkler System Operation
The operation1 of a water-based sprinkler system is relatively simple: a fire creates heat, when the heat generated by the fire reaches a certain temperature (typically 135 to 165oF) at a sprinkler ‘head’, the filament2, which holds back a valve in the head, disintegrates. The valve then opens and spreads water over the flame, which attenuates, but not necessarily extinguishes, the fire.

10 | P a g e
There are three basic designs for sprinkler systems. The code specifies which design must be used and when. The design requirements are found in three different National Fire Protection Association (NFPA) standards;
1. NFPA 13D ‘Installation of Sprinkler Systems in One- and Two-family Dwellings and Manufactured Homes’
2. NFPA 13R ‘Installation of Sprinkler Systems in Residential Occupancies Up to and Including Four Stories in Height’
3. NFPA 13 ‘Installation of Sprinkler Systems’ The NFPA 13D and 13R systems are allowed only in residential buildings, and a 13D system is typically used in one- and two- family dwellings. A NFPA 13 system is required in many commercial buildings and larger residential buildings. The NFPA 13 system is designed to be both a life safety and property protection system. The NFPA 13D and 13R designs are life safety systems only.
Section 4a(1): Costs for One- and Two-Family Dwellings
Although the focus of this paper is on multi-unit residential buildings, the costs for the installation of sprinkler systems in one- and two-family dwellings included herein is done to illustrate that there are multiple items and issues involved in the cost of this type of fire protection system. These costs are taken from pages 7 and 83 of the 2009 Report of the One and Two Family Residential Sprinkler Committee (OTFRSC). This report was developed by a diverse committee of fire officials, building officials, fire sprinkler professionals, a BBRS member, BBRS Staff, and others, and was approved by the BBRS at its October 12, 2010 meeting4. Because of the limited amount of data available for sprinkler systems in one- and two-family dwellings there is a wide range in the installation costs found in the report. With a limited data set it is not reasonable to determine a statistical average of these costs. From the report the ‘price’ that the consumer would pay for a NFPA 13D sprinkler system in a home with 2,200 sq ft of living space and an unfinished basement, is in the range of $4950 to $13,266. Also, the low end value is considered a best case scenario because maintenance costs are not considered, and the installation price could be driven higher by:
• Municipal water purveyors that may require a separate water line be run to the home
• Inability of homeowners to shut down and drain systems in vacation homes without fire department oversight per M.G.L. c. 148, §27A
• The competing tradepersons like plumbers and sprinkler fitters involved with the installation of these systems and the preclusion of homeowners from installing them unlike other states, like NH and RI for example.
Section 4a(2): Costs for Multi-Unit Residential Buildings
The cost of a sprinkler system per dwelling unit in a multi-unit residential building may be lower than the cost of the ‘single’ unit of a one-family dwelling. For a three unit building the sprinkler cost per unit is about $5,000 for piping and heads with an additional cost of $4,000 to $12,000 for the water supply system in the building. The low end is for a water reservoir and pump in the basement of the building for a NFPA 13D system while the high end is for a new line from the municipal water supply in the street.

11 | P a g e
Three actual examples are listed here: a 6-unit existing building in Western MA was retrofitted with a NFPA 13R system at a cost of $29,000 with an additional $10,000 for an enlarged municipal water supply line. And the cost for 13R systems in a city north of Boston were; $35,000 for a 7-unit project and $25,000 for a 3-unit project.
Section 4b: Smoke Detection/Fire Alarm System Operation
Fire alarm and smoke detection systems operate in conjunction with the operation of a sprinkler system in multi-unit residential buildings. Currently the code (Sections 903 and 907) requires both systems in addition to a system which monitors the status of both. Here are examples of three operational modes:
1. If a smoke detector in a unit is activated it will activate alarms within the unit to notify its occupants. It will not activate alarms elsewhere in the building to notify occupants in other units. This is the burnt toast scenario.
2. If there is fire in a unit and a sprinkler head flows water then all alarms in the building are activated.
3. If any common area, hall, or stairway smoke detector is activated or a sprinkler head flows water then all alarms in the building are activated.
Within a couple minutes of alarm activation in modes 2 and 3 the monitoring system directly or indirectly notifies the fire department and a fire apparatus is dispatched to the scene. If only a fire alarm/smoke detection system is installed in a building (no sprinkler system) then heat detectors should be placed in each of the units. The heat detector activates on temperature and if it does then all alarms in the building are activated, which is similar to mode 2. described above. If only a fire alarm/smoke detection system is installed then it must be monitored as well. Monitoring services are provided by a third party entity or local fire departments and provides two key benefits to the occupants of the building; 1. Notification to the fire department of potential smoke or fire at the building (without this system communication must be by someone at the scene via 911 or other means) 2. Ensures that the system is operational (has power for example) and that all detectors are in place. Often the building owner(s) will incorporate this monitoring requirement with burglar detection.
Section 4b(1): Costs for One- and Two-Family Dwellings
An estimated cost is $3,000 but it must be noted that this is based on limited information. To retain competitive advantage system providers tend to keep cost values close to the vest. It is expected that a sampling of actual costs from across the Commonwealth can be included here as this paper is disseminated.
Section 4b(1): Costs for Multi-Unit Residential Buildings
An estimated cost is $1,300 per unit however the same comments from section 4b(1) are dittoed here.
Section 5: Mortality in the USA To understand the risk associated with day-to-day living the United States it is useful to look to the national bank of data on mortality. The Center of Disease Control (CDC) is the custodian of the mortality data, the periodical National Vital Statistics Report groups the data into categories based on internationally recognized causes of death1.

12 | P a g e
Section 5a: Mortality Causes
It is apparent from a cursory review of historical CDC data that the leading causes of death do not change much from year to year. For example heart disease and cancer have been the number 1 and 2 causes of death for many years. This paper will review the 2,468,435 deaths in the USA from the National Vital Statistics Reports, Volume 61, Number 4, dated May 8, 2013 and titled ‘Deaths: Final Data for 2010’ hereinafter known as ‘the report’. These reports are issued periodically by the Division of Vital Statistics (DVS). Figure 5a(1) show the fifteen leading causes of these 2+ million deaths. The report further breaks down these data by gender, age, and race but contained in this figure are the overall groupings.
Figure 5a(1)
Section 5b: Accidents (Unintentional injuries)
The 5th leading cause, Accidents (unintentional injuries), accounts for 120,859 deaths nationwide in 2010 which is 5% of the total. The report divides the total into two sub categories shown in Figure 5b(1); transport which is 31% (37, 961 deaths) and non transport 69% (82,898 deaths); and further again into additional sub categories as shown in Figure 5b(2).
2,468,435
597,689 24%
574,743 23%
138,080 6%
129,476 5%
120,859 5%
83,494 3%
69,071 3%
50,476 2%
50,097 2%
38,364 2%
34,812 1%
31,903 1%
26,634 1%
22,032 1%
17,011 1%
483,694 20%
2,468,435 100%
12 Chronic liver disease and cirrhosis
13 Essential hypertension and hypertensive renal disease
14 Parkinson’s disease
15 Pneumonitis due to solids and liquids
All other causes
The CDC's Causes of Death in the USA in 2010
6 Alzheimer’s disease
7 Diabetes mellitus
8 Nephritis, nephrotic syndrome and nephrosis
9 Influenza and pneumonia
10 Intentional self-harm (suicide)
11 Septicemia
All Causes
1 Diseases of heart
2 Malignant neoplasms
3 Chronic lower respiratory diseases
4 Cerebrovascular diseases
5 Accidents (unintentional injuries)

13 | P a g e
Figure 5b(1)
Figure 5b(2)
The causes as a percentage of the total are listed below: 29% = Motor vehicle accidents 27% = Accidental poisoning and exposure to noxious substances 22% = Falls 14% = Other and unspecified nontransport accidents and their sequelae 3% = Accidental drowning and submersion 2% = Accidental exposure to smoke, fire and flames 1% = Water, air and space, and other and unspecified transport 1% = Other land transport accidents 1% = Accidental discharge of firearms
120,859
37,961
82,898
0
20,000
40,000
60,000
80,000
100,000
120,000
140,000
All Accidents
(unintentional injuries)
Transport accidents Nontransport accidents
Accidental Death in the USA in 2010
35,332
33,041
26,009
16,678
3,782 2,782
1,600 1,029 606
0
5,000
10,000
15,000
20,000
25,000
30,000
35,000
40,000
Motor vehicle
accidents
Accidental
poisoning
and exposure
to noxious
substances
Falls Other and
unspecified
nontransport
accidents and
their
sequelae
Accidental
drowning and
submersion
Accidental
exposure to
smoke, fire
and flames
Water, air
and space,
and other
and
unspecified
transport
Other land
transport
accidents
Accidental
discharge of
firearms
Accidental Death by Cause in the USA in 2010

14 | P a g e
Section 5c: Mortality Rates and Policymaker Action
For the purpose of this paper it is important to assess mortality risk and whether action is being taken to reduce it. If state or federal governments are not actively taking steps to lower a particular mortality rate then it will essentially remain constant. An example of this concept is motor vehicle accidents, which accounts for the largest number of deaths (35,332) in the Accidents (unintentional injuries) category. Motor vehicles have an inherent risk in their primary purpose; to move people and product quickly. Vehicle speed is an inherent risk which will always be present and when a collision occurs, even at a moderate speed, the occupants of the vehicles are at risk of sustaining injuries or fatalities. Over many decades vehicle features like energy-absorbing frames, lap belts, chest belts, frontal air bags and side air bags have been incorporated into the motor vehicle supply chain. In addition, despite the typical resistance to behavioral change, policy measures like mandatory seat belt use are common. These safety improvements have evolved as a result of active governmental involvement and fatalities rates have dropped2 significantly as a result of them. However, in other matters of motor vehicle safety the governmental role is less clear. Every time an individual operates a motor vehicle he or she is more at risk of being in a fatal accident because there are other drivers operating while under the influence of alcohol (OUI). Review of CDC data http://www.cdc.gov/injury/pdfs/cost-MV-a.pdf indicates that about one third of the 30,000+ yearly motor vehicle fatalities are caused by alcohol-impaired operators. Accordingly a single feature on all new motor vehicles could significantly reduce the cause of these accidents; a blood alcohol content (BAC) ignition interlock. The technology is available and is used in some states3 for individuals convicted of driving with a blood alcohol concentration (BAC) level over the legal limit. However, it is not a requirement in all new motor vehicles for many reasons including cost and restrictions on personal freedoms, since all operators would have their BAC measured. Therefore it is not surprising to see that in the absence of firm governmental resolve on this issue the mortality rate of motor vehicle deaths caused by OUI has not significantly changed.4 Although the topics covered in this section have no direct relationship to building safety there is relevance. First, if a particular cause of mortality cannot be eliminated then steps must be taken to lessen the effect of the cause. Safety features are present in motor vehicles because the very essence of motor vehicle use (speed) cannot be eliminated. Second, action by policymakers can be limited even when a known cause (for example alcohol impaired motor vehicle operation) can be eliminated. The conclusions and recommendations in Section 8 will use this approach as it pertains to building safety.
Section 5d: Mortality due to Building Occupancy
The previous sections contain many causes of mortality. This focus of this paper is on building safety and therefore a data set for a cause of mortality due to ‘building occupancy’ will be created. The CDC has no recognized cause of death of an individual due to occupancy of a building. However data can be pulled together that addresses this issue. For example, the interior environment of residential buildings in some areas of the country may contain radon gas, and since this gas is a known carcinogen for certain exposure concentrations and durations, deaths caused by it will fall into a recognized international classification of diseases; namely lung cancer. The Environmental Protection Agency (EPA) estimates the annual number of deaths due to radon exposure in homes to be 21,000. Of the total deaths by falls (26,009) about ¼ or 6,500

15 | P a g e
occur in homes. Deaths by accidental exposure to smoke, fire and flame total 2,782 annually, and severe weather fatalities are about 300. Shown in Figure 5d(1) are the predominant causes of death related to occupancy excluding homicide, suicide, accidental poisoning, and others.
Figure 5d(1)
Although these are national (USA) data and are approximations, general comparisons can be made to the Commonwealth. For example in the USA deaths by radon exposure exceed those by falls by a factor of about 3 to 1. High concentrations of radon gas is a known presence in certain counties in the Commonwealth, and falls are no more or less likely in the USA versus the Commonwealth, so in general it may be assumed that the same ratio (3 to 1) applies in MA. Using the same logic, in the Commonwealth falls exceed smoke or flame by 2 to 1. These comparisons may aid the BBRS on where to immediately direct its primary building safety effort, secondary effort, and so on. The conclusions and recommendations in Section 8 will use this approach as it pertains to building safety.
Section 6: Fire Safety in Residential Buildings
Section 6a: USA Data
There are numerous and extensive studies on fire safety in residential buildings. The National Fire Protection Association (NFPA) via its staff of analysts publishes reports on fires in buildings across the USA. The Massachusetts Department of Fire Services (DFS), with the use of data from the Massachusetts Fire Incident Reporting System (MFIRS) issues annual fire reports. NFPA1 and DFS reports have been reviewed extensively, and general conclusions may be drawn which closely parallel conclusions reached by analysts in various federal government entities. To that end, data from reports issued by the Federal Emergency Management Agency (FEMA) will be examined here. The US Fire Administration arm of FEMA through in its Topical Fire Report Series2, Volume 14, Issue 2, and dated April 2013 Civilian Fire Fatalities in Residential Buildings (2009 – 2011) offers a concise summary on the subject. The report indicates that annually3 from 2009 to 2011, an estimated 2,495 civilian fire fatalities resulted from 1,600 fatal fires in residential buildings,
21,000
6,500
2782
300
0
5,000
10,000
15,000
20,000
25,000
Radon Exposure Falls Exposure to
Smoke or Flame
Severe Weather
USA Annual Mortality
Building Occupancy (Approximations)

16 | P a g e
and there were also an estimated 360,900 residential building fires. Of the total residential structure fires 1 in 225 results in a fatal fire. Fatal fires are those fires where one or more fatalities occur. Two sets of data are germane to the conclusion and recommendations which follow in Section 8. First is Figure 5 from this report which is copied below.
Of the fatal fires which have a known cause “Other unintentional, careless” actions (16%) and “smoking” (15%) were the leading causes or 31 percent of known causes of all residential fatal fires. “Other unintentional, careless” actions include misuse of materials or products, abandoned or discarded materials or products, and heat source too close to combustibles. The next leading cause, “electrical malfunction,” accounted for an additional 11 percent of residential fatal fires. Note that 46% of fatal fires have a cause which is “unknown”. Second is Figure 6:

17 | P a g e
The report’s commentary on civilian activity is copied in part below: “Most civilian fire fatalities occurred when the victim was attempting to escape (36 percent) or sleeping (35 percent). To escape a fire, many civilians make the mistake of fleeing through the area where the fire is located. The area of a fire has tremendous heat, smoke, and a toxic atmosphere that can render a person unconscious. As a result, it is imperative that an escape plan be prepared and practiced. With a well-thought-out plan and multiple escape options, the chances of survival and escaping greatly increase. In addition, it has been proven that people cannot wake up from the smell of fire while sleeping. Therefore, it is also vital that smoke alarms are installed in homes to alert sleeping people to the presence of fire.” The fatality information provided above is not separated into single family dwellings or multi-unit residential buildings. For relevant information on the differences between one- and two-family dwellings and multi-unit residential buildings, fire reports on these are examined. Topical Fire Report Series2, Volume 14, Issue 10, and dated September 2013 One- and Two-family Residential Building Fires (2009-2011) cited these findings:
• An estimated 236,200 one- and two-family residential building fires were reported to United States fire departments each year and caused an estimated 1,980 deaths, 8,525injuries and 5.5 billion dollars in property loss.
• One- and two-family residential building fires accounted for 65 percent of all residential building fires, representing the largest subgroup of residential building fires.
• Cooking was the leading cause of one- and two-family residential building fires reported to the fire service (33 percent). Nearly all one- and two-family residential building cooking fires were small, confined fires (91 percent).
• In 52 percent of nonconfined one- and two-family fires, the fire extended beyond the room of origin. The leading causes of these larger fires were other unintentional, careless actions (17 percent); electrical malfunctions (16 percent); intentional (12 percent); and open flame (11 percent).
• One- and two-family residential building fire incidence was higher in the cooler months, peaking in January at 11 percent.
• Smoke alarms were not present in 23 percent of the larger, nonconfined fires in occupied one- and two-family residential buildings. This is a high percentage when compared to the 3 percent of households nationally lacking smoke alarms.
Topical Fire Report Series2, Volume 14, Issue 11, and dated September 2013 Multifamily Residential Building Fires (2009-2011) cited these findings:
• “An estimated 101,900 multifamily residential building fires were reported to United States fire departments each year and caused an estimated 395 deaths, 4,250 injuries and 1.2 billion dollars in property loss.
• Multifamily residential building fires accounted for 28 percent of all residential building fires.
• Small, confined fires accounted for 70 percent of multifamily residential building fires. • Cooking was the leading cause of multifamily residential building fires; nearly all
multifamily residential building cooking fires were small, confined fires (96 percent). • In 31 percent of nonconfined multifamily residential building fires, the fire extended
beyond the room of origin. The leading causes of these larger fires were exposures (13 percent); electrical malfunctions (13 percent); intentional actions (11 percent); other

18 | P a g e
unintentional, careless actions (11 percent); and open flames (10 percent). In contrast, 51 percent of all other nonconfined residential building (excluding multifamily building) fires extended beyond the room of origin.
• Cooking areas and kitchens (34 percent) were the primary areas of origin for nonconfined multifamily residential building fires.
• Multifamily residential building fire incidence was slightly higher in the cooler months, peaking in January.”
Also copied below is a table from this report on Fire by Type of Incident which breaks down in more detail the confined fires.
The report also points out the reasons4 why the differences between one and two family dwellings and multifamily residential buildings exist. Data from both of these reports indicate that multi-unit residential building fires in 2009-2011 are 28% (101,900 of 360,900) of the total fires in residential building but 16% (395 of 2495) of the total fatalities. The property loss comparison is also unbalanced in that multi-unit residential building fires account for 17% ($1.2B of $7B) of the total annual property loss for residential fires in the period 2009-2011. Also it appears that multi-unit residential building fires cause a higher percent 33% (4,250 of 12,775) of the total (4,250 + 8,525) injuries.
Section 6b: MA Data
Section 6b(1): Analysis of data from the One- and Two-Family Sprinkler
Report.
The One- and Two-Family Sprinkler Report contains a detailed review5 of fire fatalities in this type of dwelling during the period from 1986 to 2005. This report examined data pulled from the Massachusetts Fire Incident Reporting System (MFIRS) and surveys. The results indicate fire deaths are a function of many variables and among them; the age of the structure. Of the 677 fire deaths in this time period 20 occurred in homes built after 1975, which is when 110V hard wired smoke detectors were required state wide by the building code. And of these 20 deaths four of the victims were intimate with the fire and in 16 cases ‘there is no data on whether or not the smoke detectors were working’. From the report it cannot be concluded that new buildings (post 1975) have a lower fire fatality rate (for example: number of fire deaths per 100,000 dwelling units) than old buildings (pre 1975). The data appear to indicate that buildings constructed post 1975 have improved fire safety performance with respect to reduced fatalities but a detailed analysis should be done to either substantiate or disprove this appearance.

19 | P a g e
Section 6b(2): MFIRS and Multi-Unit Residential Buildings
MFIRS data6 were used to assess the fatalities in the Commonwealth due to exposure to smoke fire and flames in multi-unit residential buildings. Figure 6b(2) shows the cause of the 134 fatalities in the ten-year period 2003 to 2012. This information is provided as a risk assessment tool for use in the development of the recommendations in Section 8 and to put into context this mortality cause with other causes in the accidents (unintentional injuries) category. For example, the City of Boston during the ten-year period 2002 to 2011 averaged 62.17 homicides per year while exposure to smoke fire and flames in its multi-unit residential buildings was 22 of the 134 total or 2.2 per year for the ten-year period 2003 to 2012.
Figure 6b(2)
In summary, USA and MA fire data and reports reviewed as part of this paper indicate that the ignition and heat sources of residential structure fires exist in many forms; some more prevalent than others. They also indicate that a building with a well designed, highly reliable, fire protection system will perform with reduced residential building fire fatalities and injuries. The conclusions and recommendations in Section 8 will address these findings.
Section 7: Property Loss due to Fires in MA (reserved)
Section 8: Conclusions and Recommendations The conclusions reached herein are based on a review of data from federal government sources including FEMA, US Census Bureau, and the CDC. If local conditions in the Commonwealth were required to reach conclusions then local data were used; this includes for example the topic of Home Value versus Income in Section 3. Although national trends in home value and income are useful it is more relevant to have trends focused on New England and specifically the Commonwealth. In addition it is highly relevant to have a local forecast of housing supply and demand so that actions by the BBRS use local forecasts instead of national trends. Analysis of fire data from MFIRS shows similar conclusions to analysis of fire data from NFIRS. In addition the analyses of NFIRS data by FEMA were used simply because the reports are shorter and more concise than reports issued by other entities. In addition, NFIRS or MFIRS fire data are limited in scope so when more information is garnered for each fire incident and analyzed, as was done by the One- and Two-Family Fire Sprinkler Committee, other conclusions result.
37
28
21
12 11 107 8
05
10152025303540
Cause of Fire Fatalities in Multi-Unit
Residential Buildings 2003 to 2012
20 | P a g e
If using local or national data as described above has produced a conclusion which is not well substantiated then appropriate statistical evidence is requested by the BBRS to either refute or reinforce the conclusion because a more accurate paper will be the result.
Conclusion 1:
There is a pressing need for more housing in the Commonwealth, especially more densely placed affordable housing in its various urban regions. The BBRS has a role in addressing this issue because it regulates building requirements for both new and existing buildings. If building requirements are many or unclear then the price of a new or existing building will be higher than if the requirements are fewer and clear.
Conclusion 2:
This conclusion is a corollary to conclusion 1. There is a need for building and fire officials to be trained on the use of the International Existing Building Code 2009 (IEBC) and its MA amendments and the 2014 BBRS Official Interpretation of the Existing Building Code. Section 3c outlines impediments to development and low cost construction including unclear, conflicting, or duplicative construction requirements. The IEBC is interpreted differently1, and therefore enforced differently, across the Commonwealth.
Conclusion 3:
This conclusion parallels conclusion 2 with training to private, municipal, and state building owners, developers, builders, engineers and architects.
Conclusion 4:
This conclusion is a corollary to conclusion 1. There exists a potential to build lower cost multi-unit residential buildings in the Commonwealth with enhanced or equivalent overall building occupancy life safety performance2 relative to those built to current code requirements.
Recommendation 1:
The BBRS should direct its Department of Public Safety (DPS) staff to provide the materials and the training to constituent bodies as described in Conclusions 2 and 3.
Recommendation 2:
The BBRS should direct its DPS staff, with technical expert assistance as required, to create a code proposal for new construction R-2 buildings up to 6 units, which addresses Conclusions 1 and 4 and the issues outlined in this paper. This code proposal should incorporate Recommendation 3.
Recommendation 3:
Because of the recent changes in the Energy Conservation requirements in the code and feedback from the regulated community on cost of these requirements for low rise residential multi-unit buildings the BBRS should direct its DPS staff to author a White Paper on Cost and Effectiveness for Health, Safety, and Security of Energy Conservation Systems in Multi-Unit Residential Buildings and incorporate the conclusions of it into the code proposal in Recommendation 2.

21 | P a g e
Notes to Section 1
1. Additionally the General Objectives of the BBRS pertaining to the cost of construction are found in M.G.L. c. 143, §95 (b) & (c)
2. Discussions with several building departments, including those in Brockton, Northampton, and Holyoke revealed anecdotal evidence of this. For example, some Brockton owners are converting 3 unit buildings to 2 family dwellings while some Northampton owners are doing the same thing or allowing buildings to sit vacant.
Notes to Section 2
1. The dates shown should be considered approximations. For precise dates please check with the Secretary of State .
2. The Model 15 effort was approved at the September 2011 meeting and is copied here in part:
BBRS requests that the Energy Advisory Committee (EAC), the Structural Advisory Committee (SAC), the Geotechnical Advisory Committee (GAC), the Fire Prevention and Fire Protection Advisory Committee (FPFP), and the Chapter 34 Advisory Committee (34AC) to evaluate each current Massachusetts amendment to the model codes against the following questions:
1. Does the amendment reduce or show equivalency to construction costs relative to the 2009 ICC code? (Y or N)
2. Does the amendment address the specific intent of MA General Law? (Y or N)
3. Does the amendment address a unique Massachusetts condition that warrants it? (Y or N)
The initial selection filter is as follows: • If the answer is ‘yes’ to any of these questions the amendment may
remain. If the amendment that remains adds cost then the committee will provide the cost increase analysis.
• If the answer is ‘no’ to all three questions then the amendment may be deleted. However, if the BBRS is presented with valid life safety statistics that justify the increased initial construction costs and/or increased life cycle costs then the amendment shall remain.
• If the amendment deletes an I-Code requirement then the committee shall identify the unique criteria as to why it is deleted.
3. Not included in this list are accessibility requirements which are governed by the Architectural Access Board and enforced by building officials. Since 1996 the Commonwealth has been a national leader via 521 CMR in providing access to its citizens with disabilities.
4. Overarching the code are requirements in Massachusetts General Law for sprinklers in buildings. M.G.L. c.148 §26G has been in effect statewide since January 1, 2010 , and requires sprinklers in new commercial buildings over 7500 sq. ft. as well as existing buildings undergoing significant renovations. It should be noted that this law does not allow the building to be separated with fire rated walls or ceilings. M.G.L. c.148, §26G came on the heels of a tragic fire in Newton where 5 lives were lost. MA State Representative Ruth Balser who has the city of Newton in her district was an instrumental figure in the passage of this legislative act. Her views on sprinklers can be seen at this NFPA Sprinkler Blog.

22 | P a g e
Notes to Section 3
1. This paper reviews and analyzes ‘raw’ data for the various topics addressed; a simpler path could have been to reference reports or papers or conclusions issued by Realtor groups, the National Fire Protection Association, the National Association of Home Builders, or other entities. However, business entities whether for profit and not for profit may have a bias on the subject matter within their scope. Feedback which examines data in an industry accepted manner on any topic in this paper is anticipated and welcome, as it will make this paper a more accurate and valuable document.
2. Many sources can be accessed for these data including the US Census. At this particular site http://www.russellsage.org/research/chartbook/social-inequality one can view income data from multiple perspectives and trends over time, and across gender and race. For this paper median values are used in order to be consistent with the median home price and home value data.
3. US Census data on home values from 1940 to 2000 in adjusted and unadjusted dollars can be found at http://www.census.gov/hhes/www/housing/census/historic/values.html. Ellen Wilson at the US Census Bureau indicated in a phone conversation on January 2, 2014 that the home value data is supplied by the US Census respondents on their census form, in response to what the value of the home would be on the local housing market. When asked: “Do these home values accurately reflect market home price?” Ellen indicated that they do. A comparison (see below) of sale price of homes in MA from 1970 to 2000 with US Census home values corroborates this opinion.
4. John Dulczewski., the executive director of the Greater Boston Association of
REALTORS has supplied Massachusetts home sale data which span the time frame 2005 to 2012 along with discrete data points of average home sale prices dating back to the 1940’s.
5. American Community Survey by the US Census Bureau can be found at http://www.census.gov/acs/www/
6. Home affordability tools are numerous. The one used for this study is found here: http://www.hsh.com/calc-howmuch.html
7. As defined by the US Census Bureau… “the median household income includes the income of the householder and all other individuals 15 years old and over in the household, whether they are related to the householder or not. Because many households consist of only one person, average household income is usually less than average family income. The median divides the income distribution into two equal parts: one-half of the cases falling below the median income and one-half above the median. For households and families, the median income is based on the distribution of the total number of households and families including those with no income. The median income for individuals is based on individuals 15 years old and over with income. Median income
MA Median Home Value MA Average
Year US Census Sale Price
2000 185,700 261,293
1990 162,800 181,225
1980 48,400 59,269
1970 20,600 25,125
MA Median Sale PriceMA Average Sale Price Single Family
Single Family Single Family Factor
Jan-04 323,000 394,876 1.223
MA Median Sale PriceMA Average Sale Price Condo
Condo Condo Factor
Jan-04 245,000 279,175 1.139
using Single Family Factor
MA Median Value to Average Value MA Median Value to Average Value
using Condo Factor
227,023
199,027
211,603
Equivalence Factor to Convert Median to Average
185,509
59,170
25,184
55,151
23,473

23 | P a g e
for households, families, and individuals is computed on the basis of a standard distribution.”
8. Rate of home ownership data were pulled from http://www.census.gov/hhes/www/housing/census/historic/owner.html
9. For example the State House News recently issued this: REPORT: HOUSING BOOM NEEDED TO FUEL STATE’S ECONOMY By Michael Norton STATE HOUSE NEWS SERVICE STATE HOUSE, BOSTON, JAN. 16, 2014…Massachusetts must significantly boost its housing supply to attract the younger workers needed to increase its labor force and help drive economic growth in the next decades, according to a new report. The Metropolitan Area Planning Council report found the metro Boston area will need 435,000 new housing units by 2040 to attract younger workers while also accommodating the state’s growing senior population. The report suggests the new units would mostly be situated in multi-family settings and in urban areas. Under a slow-growth scenario the region’s population would grow 6.6 percent over three decades, with its 65 and older population increasing 82 percent and its working-age population essentially unchanged. Without an influx of younger workers, jobs in the region could grow by less than 1 percent from 2010 to 2040, the report said. The report’s “stronger region” growth scenario envisions a population increase of 12.6 percent, with the population between 25 and 64 years old increasing 7 percent and adding 175,000 new workers to the labor force. The report says 435,000 new housing units would be needed from 2010 to 2040 under the “stronger region” scenario and 305,000 under the slow-growth, “status quo” scenario, which would still represent a 17 percent increase. The demand exists for new housing, including apartments and condominiums, even though a “senior sell-off” may provide most of the single-family homes needed by younger families. “Which scenario is more likely to occur depends on decisions yet to be made,” the report said. “Individual households will make their own choices about where to live, but they will do so in a context influenced by public sector actions and investments. Policies to promote housing construction will facilitate the higher in-migration rates that characterize the Stronger Region scenario. Conversely, continued widespread opposition to new housing will likely result in less.” In the report, the council says it favor the “stronger region” approach for municipalities and says that approach is already the basis behind the state Executive Office of Housing and Economic Development’s multi-family housing production goals. “More than a million of the region’s workers will be retired by the year 2030,” Marc Draisen, the council’s executive director, said in a statement. “To fill those jobs and grow the economy we need to reverse the trends that see so many young workers leaving Metro Boston.” The report, which includes projections by municipality, says the number of school-age children in the region peaked in 2000 and is likely to decline in the coming decades. It warns that without an effort to increase housing production, one of the state’s biggest assets - a skilled and educated workforce - is in jeopardy. END 01/16/2014
The full report is found here: http://www.mapc.org/data-services/available-data/projections
10. A November 2013 report issued Barry Bluestone, Director of the Dukakis Center for Urban & Regional Policy, is another source on this subject. It has a lot of data in chart form but is relatively easy to understand and follow. The report is found here: http://www.gbreb.com/uploadedFiles/GBAR/GBAR_Education_and_Events/BBLUESTONEPRES2014.pdf?n=5679 Particular attention should be paid to pages 30 and 31.

24 | P a g e
Notes to Section 4
1. There are numerous videos provided by sprinkler companies which demonstrate how various components of the system operate. For an example of sprinkler head operation see http://www.youtube.com/watch?v=arKMrY-3RIg .
2. Most sprinkler heads are equipped with a glass cylinder filled with a glycerin-based liquid that expands at the appropriate temperature, breaking the glass and activating the sprinkler head. The sprinkler head is attached to a system of pipes that are hidden behind the walls or ceiling. These pipes wind through the building and to connect with a reliable water source. When the sprinkler head is triggered water under pressure in the piping system is released through the head.
3. From page 8 of the report: At the apparent “low end’ of costs – this information is obtained from an NFPA research paper, “Home Fire Sprinklers Cost Assessment”, issued in September of 2008 – a particular community in MA (North Andover), has been able to incorporate residential sprinkler systems, with CPVC piping for “stand-alone” systems for a cost ranging from $1.10 per sprinklered square foot to $1.36 per sq. ft. of living space as the cost to the builder.
Assumptions: 1. Water purveyor costs are zero. 2. Cost markup (to sell price) is not included
From page 8 of the report: The Home builders note that the above costs are installation costs and do not reflect the cost to the end user or homeowner. Based on an HBAM survey of it members installing NFPA 13D sprinkler systems, the average cost to the homebuyer in MA was $13,574.59 per home or $4.02* per sq. ft.
Assumptions: 1. Water purveyor costs are included 2. Cost markup (sell price) is included
If the low end cost is increased by a 10% mark-up to estimate a sell price, and ignoring costs that may be incurred by water purveyors, the range of cost to the homeowner is $1.50 to $4.02 per sq ft of living space. For a home with 2,200 sq ft of living space and an unfinished basement, the price increase for a 13D sprinkler system is in the range of $4950 to $13,266. Please note that variables outlined in the OTFRC report may further increase the prices shown in the paragraph above. The OTFRC also noted periodic maintenance and tests and associated costs, which may be required in some circumstances.
*The $4.02 is considered an average per sq. ft. cost based on the data in the HBAM Survey which indicated a range of costs from $2.37 to $6.23 per sq. ft. Critics of the HBAM Survey argue that at least some of the costs reported are related to the cost of NFPA 13R systems vs. NFPA 13D systems. In response to these criticisms, HBAM notes that the costs reported in the HBAM Survey represent actual experience of their constituents attempting to satisfy local requirements in specific communities.
4. BBRS meeting minutes can be found here: BBRS Agenda and Meeting Minutes
25 | P a g e
Notes to Section 5
1. Information reported on death certificates, which is completed by funeral directors, attending physicians, medical examiners, and coroners, is presented in descriptive tabulations. The original records are filed in state registration offices. Statistical information is compiled in a national database through the Vital Statistics Cooperative Program of the Centers for Disease Control and Prevention’s National Center for Health Statistics. Causes of death are processed in accordance with the International Classification of Diseases, Tenth Revision
2. See for example paper No. 500 by Donna Glassbrenner of the National Center for Statistics and Analysis at the National Highway Traffic Safety Administration Estimating the Lives Saved by Safety Belts and Air Bags
3. The RMW in MA since October 28, 2005 has a MA DOT Ignition Interlock Devices program as a result of Melanie’s Law.
4. USA fatalities due to OUI dropped significantly between 1990 and 2001 due to campaigns associated with OUI awareness and laws like Zero Tolerance. However since 2001 there is little change. Although the number of deaths associated with OUI has dropped for the time period of 2001 to 2010 the trend of Fatalities Involving Alcohol as a Percentage of Total Fatalities is flat as indicated in Table 1 here: http://www.rita.dot.gov/bts/sites/rita.dot.gov.bts/files/publications/by_the_numbers/drunk_driving/index.html
Notes to Section 6
1. One example is NFPA’s 2013 report on Home Structure Fires by Marty Ahrens which contains this abstract: “NFPA estimates that U.S. fire departments responded to an average of 366,600 home structure fires per year during the five-year-period of 2007-2011. These fires caused an estimated average of 2,570 civilian deaths, 13,210 civilian injuries, and $7.2 billion in direct property damage per year. Almost three-quarters (71%) of the reported home structure fires and 84% of the home fire deaths occurred in one- or two-family homes, including manufactured homes. The remainder occurred in apartments or other multi-family housing. Cooking equipment is the leading cause of home structure fires and non-fatal home fire injuries. Smoking materials are still the leading cause of home fire deaths. Half of all home fire deaths result from incidents reported between 11:00 p.m. and 7:00 a.m. One-quarter (25%) of all home fire deaths were caused by fires that started in the bedroom; another quarter (24%) resulted from fires originating in the living room, family room, or den; and 16% were caused by fires starting in the kitchen. Three out of five home fire deaths resulted from fires in which no smoke alarms were present or in which smoke alarms were present but did not operate. Compared to other age groups, older adults were more likely to be killed by a home fire. These estimates are based on data from the U.S. Fire Administration’s (USFA’s) National Fire Incident Reporting System (NFIRS) and the National Fire Protection Association’s (NFPA’s) annual fire department experience survey.”
2. See http://www.usfa.fema.gov/statistics/reports/residential_structures.shtm for a list of reports. Each report and contains on the opening page this message to the reader: “These topical reports are designed to explore facets of the U.S. fire problem as depicted through data collected in the U.S. Fire Administration’s National Fire Incident Reporting System. Each topical report briefly addresses the nature of the specific fire or fire-related topic, highlights important findings from the data, and may suggest other resources to

26 | P a g e
consider for further information. Also included are recent examples of fire incidents that demonstrate some of the issues addressed in the report or that put the report topic in context.”
3. The 2007 to 2009 report showed similar findings to the 2009 to 2011 report thus only data from the 2009 to 2011 report is presented herein.
4. “As a result of the type of building, the more stringent building and code requirements, and the fact that more people live in the building itself than in the predominant one- and two-family residences, fires in multifamily residential buildings tend to have a different profile than fires in other types of residences. A major difference in the multifamily residential building fire profile is seen in cooking fires. Cooking was the cause of 70 percent of multifamily residential building fires, twice that of other residential buildings. Multifamily residential buildings also tend to have central heating systems that are maintained by professionals instead of homeowners, thus there are fewer heating fires from poor maintenance or misuse than in one- and two-family dwellings. Also, fire problems related to fireplaces, chimneys and fireplace- related equipment tend to occur less often in multifamily heating fires since multifamily residential buildings generally lack these features. Finally, multifamily residential buildings usually have fewer fires caused by electrical problems due to construction materials, building codes and professional maintenance.”
5. The section from this report is copied here: “III-1 Fire History and Statistics in Massachusetts Utilizing information acquired from the Massachusetts Fire Incident Reporting System (MFIRS) and a follow-on “BUILDINGS – FATAL FIRE SURVEY” issued by the One and Two Family Residential Sprinkler Committee (OTFRSC), the following is presented: EXCERPTED FROM A MASSACHUSETTS 1-& 2-FAMILY FATAL FIRES DFS SURVEY OF THE 213 COMMUNITIES REPORTING FATAL FIRE EVENTS IN 1- & 2- FAMILY HOUSING (1986 – 2005): Between 1986 – 2005 there were 561 fatal fires in 1- & 2- family residences in Massachusetts. The following information reflects only the fatal fire events.
- 677 civilian fire deaths - 262 civilian injuries - 440 fire service injuries - $40.3 million in total damages (561 fires – see above)
Between 2001 and 2005 there were 25,097 structure fires (including fatal fires) reported via MFIRS in 1 & 2- Family homes
- 130 civilian deaths - 144 civilian injuries - 1,118 fire service injuries - $339 million in total dollar loss (25,097 fires – see above)
This Survey reveals that 20 fatal fires (for the timeframe 1986 – 2005) occurred in homes built after 1975 (1975 is when the Massachusetts State Building Code came into effect for the first time).
- 20 civilian fire deaths - 6 civilian injuries - 13 fire service injuries
It is noted that relative to information presented above, extracted from the Massachusetts Fire Incidence Reporting System (MFIRS), MFIRS data is considered by some to report conservatively low. OTFRSC FOLLOW-ON SURVEY
The OTFRSC voted to pursue a follow-on Survey to the DFS Survey in an effort to better understand the fire event, the nature of the victims, and if, for example, older electrical systems were problematic or if smoke detectors existed at all or if smoke detectors were functioning, etc., or simply to ascertain if older housing stock played any significant role in reported residential fires. A sample “BUILDINGS – FIRE FATALITIES SURVEY (1-6-09)” Survey Form with its family of questions asked can be found in Appendix C of this Report.

27 | P a g e
Also included in Appendix C1 of this Report, please find a Spreadsheet of detailed Survey answers related to the responses below. 213 cities and towns were queried in this follow-on Survey with 20 communities (some w/multiple fatal fire events) responding. No Survey response was sufficient to ascertain if older electrical systems or older housing construction were trending as problematic. In Summary, of the 40 fatal fires surveyed (refer to Appendix C2):
- 7 homes had no smoke detectors. - 2 homes were reported as having smoke detectors that were not operating. - In 13 homes it was not known or reported if smoke detectors existed or were operating. - Hard wired, interconnected smoke detectors were reported in 3 homes. - Both ionization and photoelectric smoke detector types were identified in homes w/fatal fires. - Of 38 reported fatalities, 14 victims were reported intimate with the fire. - 16 of the fatalities were caused by improper use of smoking materials. - The majority of fire victims were adults ranging in age from 25 to 93 but four children of ages
2, 2.5. 5 and 10 were victims in three of the reported fires with the 10 year old in a fatal fire where smoke detectors were not present and the remaining 3 children in fatal fires where the status of smoke detectors was not reported.
Based on the DFS Survey discussed above there were 20 fire related deaths between 1986 and 2005 in homes built since 1976 with hard wired smoke detectors. Of those 20 deaths, 4 victims were identified as intimate with the fire event (those victims intimate with the fire are often assumed lost) therefore the total number of deaths is viewed as 16. Of those 16 deaths there is no data on whether or not the smoke detectors were working. If we assume 20% of the smoke detectors were not working it brings the deaths down to 13 in a 20 year period for homes with working hard wired smoke detectors. (See attached HBAM analysis in Appendix E).”
6. MS Excel file ‘Residential Fatal Fires 2003 – 2012’ received from DFS on January 31, 2014 at 12:30 p.m. contains nine column headings: Town, County, Address, Date, Incident #, Total Deaths, Occupancy, Cause, and Detector Code. A small number (6) of the fire incidents were in occupancies other than ‘apartments’. For this paper the data were all presented as ‘multi-unit residential buildings’
7. Many sources can be used to find these numbers. For this paper the source was used: http://www.city-data.com/crime/crime-Boston-Massachusetts.html#ixzz2sGup8F00
Notes to Section 7 (reserved)
Notes to Section 8
1. While assembling data for a December 2013 benchmark study of sprinkler installations in seven cities in the Commonwealth it was evident that the sprinkler ‘trigger’, commonly known as substantial alteration, used in the previous edition of the building code was still being used in practice in 3 of the 7 cities. This ‘trigger’ is based on cost while the current edition of the building code using the IEBC typically triggers sprinkler requirement based on the work area involved in the project. The two methods may or may not produce the same end result, but this clearly demonstrates the need for training to produce a single, consistent, state-wide building code.
2. a. Currently there is no radon mitigation requirement for R-2 buildings even though
relatively low cost piping as the conduit for this gas could be installed at time of construction. If high concentrations are found then a relatively low cost fix can be implemented. If all of this is done after construction is complete the costs increase by a factor of 4.

28 | P a g e
b.Although falls has not been a specific safety topic addressed by the BBRS the mortality numbers suggest that areas beyond those typically associated with this risk (movement in stairways, exits, porches, etc.) should be considered.
c. A fire may occur at some point in the life of a residential building, and thus a fire protection system is a necessary life safety system. However, the BBRS may explore effective ways via code regulation which reduce the cause or occurrence of fires and thereby produce enhanced or equivalent fire safety performance of residential buildings relative to buildings constructed to the current code.