Embed Size (px)
Citation preview
WHITE PAPER
Efficient Measurement of Large Light Source Near-Field Color and Luminance Distributions for Optical Design and Simulation
2 I Radiant Zemax, LLC
AbstractThe color and luminance distributions of large light sources are difficult to measure
because of the size of the source and the physical space required for the measurement.
We describe a method for the measurement of large light sources in a limited space
that efficiently overcomes the physical limitations of traditional far-field measurement
techniques. This method uses a calibrated, high dynamic range imaging colorimeter
and a goniometric system to move the light source through an automated measurement
sequence in the imaging colorimeter’s field-of-view. The measurement is performed
from within the near-field of the light source, enabling a compact measurement setup.
This method generates a detailed near-field color and luminance distribution model that
can be directly converted to ray sets for optical design and that can be extrapolated to
far-field distributions for illumination design. The measurements obtained show excellent
correlation to traditional imaging colorimeter and photogoniometer measurement
methods. The near-field goniometer approach that we describe is broadly applicable to
general lighting systems, can be deployed in a compact laboratory space, and provides
full near-field data for optical design and simulation.
IntroductionFor optical design and product qualification, the output color and luminance
distributions of large light sources are needed to qualify and predict the performance
of architectural, automotive, street, security, entertainment and other lighting systems.
However, these distributions are difficult to measure because of both the size of the
source and the large space required for the measurement. For these lighting systems,
measuring in the far field often requires a substantial distance – three meters or more is
common – so that setting up the measurements in a controlled laboratory environment
can be difficult and expensive.
Traditional measurement methods for obtaining illumination distributions are based on
either goniophotometers or imaging colorimeters. In the goniophotometer approach the
source is mounted in a two-axis goniometer and a stationary photometer is placed in
the far field. The source is rotated in two axes, allowing the entire intensity distribution
to be sampled from the point of view of the photometer. The luminous intensity
distribution is described by the point measurements, and this distribution can be used
to determine an illumination distribution. An alternative configuration of this approach
uses a moving mirror goniometer. Photogoniometric measurement can produce very
good color and luminance accuracy, but it has two significant limitations for large light
sources: (1) the luminous intensity distribution is provided only at the measured distance
and (2) to measure from the far field a large space is required.
Efficient Measurement of Large Light Source
Near-Field Color and Luminance Distributions
for Optical Design and Simulation
WHITE PAPER
Rather than measuring from the far
field, a more space efficient method
for measuring the luminance and color
output distribution of a large light source
is to use a two-axis goniometer and a
stationary imaging colorimeter positioned
within the source’s near field.
3 I Radiant Zemax, LLC
To measure an illumination distribution with a stand-alone imaging colorimeter the light
from the source is directed onto a screen placed in the source’s far field. The screen
must be large enough to capture the entire source output (or at least the portion of it
that is of interest) and must be independently calibrated to eliminate screen effects from
the measured distribution. The imaging colorimeter is then used to capture the entire
illumination pattern in one measurement. This measurement method is very fast and
relatively low cost as compared to goniometric methods. For light sources with wide
angle output this can require a very large screen to illuminate for a far-field distribution;
this may not be physically possible. This method only provides the luminous intensity
distribution at the measured distance.
The space problem is solved for measuring large light sources by looking at them
completely differently. Rather than measuring from the far field, a more space-efficient
method for measuring the luminance and color output distribution of a large light source
is to use a two-axis goniometer and a stationary imaging colorimeter positioned within
the source’s near field. This method generates a near-field model of the light source
that can be extrapolated to generate the illumination distribution at any distance from
the light source. This allows measurement in a more compact area than is possible
with either the goniophotometer or the stand-alone imaging colorimeter methods. This
technique is applicable to large light sources such as down lights, lighting tubes, and
automobile headlamps.
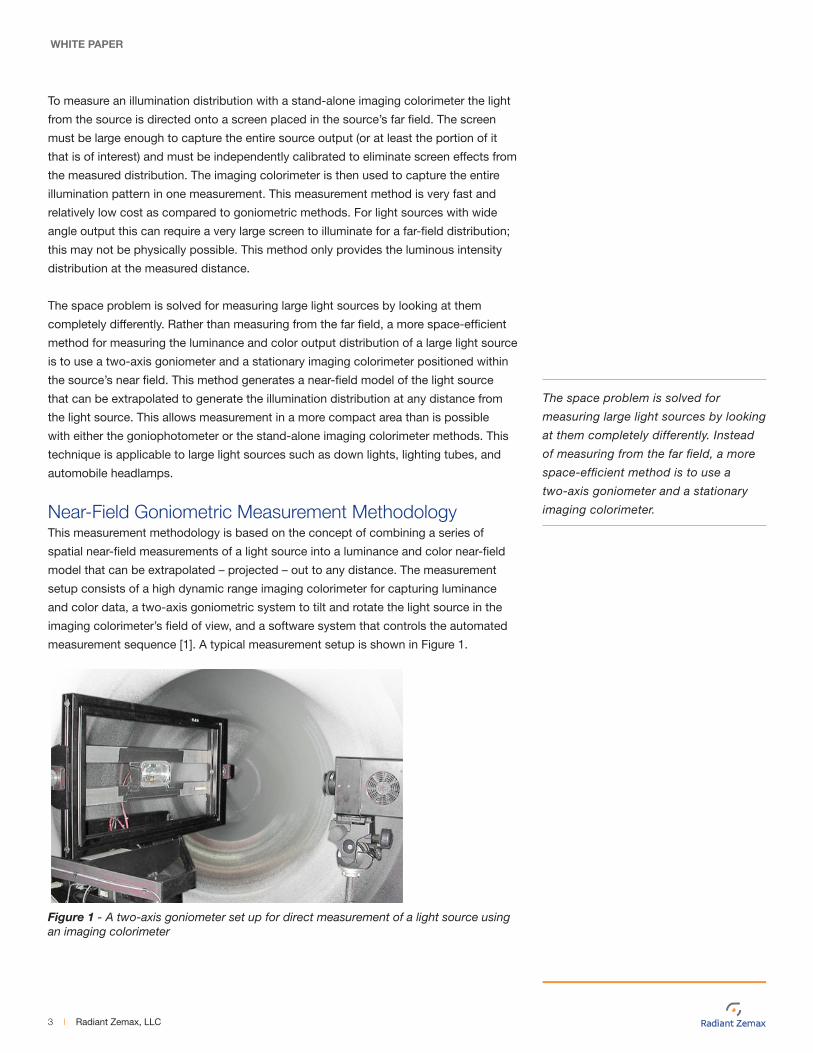
Near-Field Goniometric Measurement MethodologyThis measurement methodology is based on the concept of combining a series of
spatial near-field measurements of a light source into a luminance and color near-field
model that can be extrapolated – projected – out to any distance. The measurement
setup consists of a high dynamic range imaging colorimeter for capturing luminance
and color data, a two-axis goniometric system to tilt and rotate the light source in the
imaging colorimeter’s field of view, and a software system that controls the automated
measurement sequence [1]. A typical measurement setup is shown in Figure 1.
Figure 1 - A two-axis goniometer set up for direct measurement of a light source using an imaging colorimeter
WHITE PAPER
The space problem is solved for
measuring large light sources by looking
at them completely differently. Instead
of measuring from the far field, a more
space-efficient method is to use a
two-axis goniometer and a stationary
imaging colorimeter.
4 I Radiant Zemax, LLC
Two-Axis Goniometer
The two-axis goniometer is designed to support motion through a tilt range of +/- 90°
(from facing straight down to facing straight up) and rotation +/- 90° from left to right
for each tilt angle. The rotational accuracy of the goniometer is 0.25° in each rotational
axis. The particular mechanical design used for the goniometer in the measurements
described here uses a rectangular frame that roughly describes the measurement plane
and provides mechanical attachment points for mounting the light source securely.
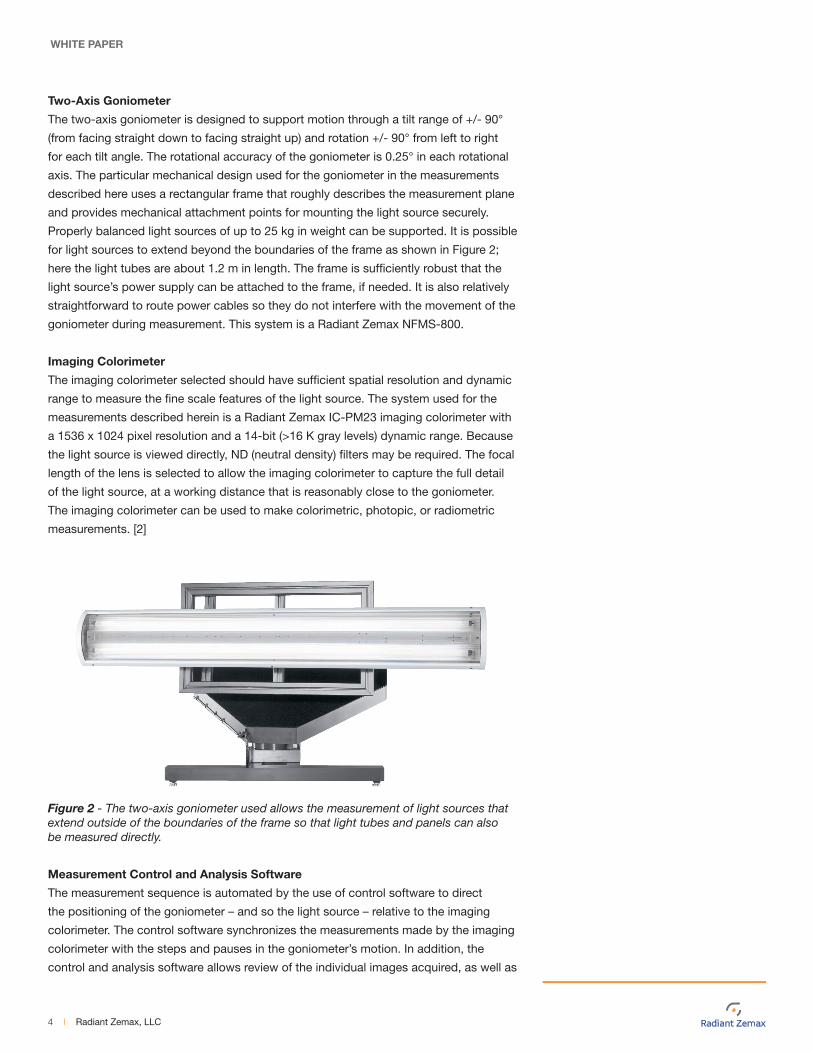
Properly balanced light sources of up to 25 kg in weight can be supported. It is possible
for light sources to extend beyond the boundaries of the frame as shown in Figure 2;
here the light tubes are about 1.2 m in length. The frame is sufficiently robust that the
light source’s power supply can be attached to the frame, if needed. It is also relatively
straightforward to route power cables so they do not interfere with the movement of the
goniometer during measurement. This system is a Radiant Zemax NFMS-800.
Imaging Colorimeter
The imaging colorimeter selected should have sufficient spatial resolution and dynamic
range to measure the fine scale features of the light source. The system used for the
measurements described herein is a Radiant Zemax IC-PM23 imaging colorimeter with
a 1536 x 1024 pixel resolution and a 14-bit (>16 K gray levels) dynamic range. Because
the light source is viewed directly, ND (neutral density) filters may be required. The focal
length of the lens is selected to allow the imaging colorimeter to capture the full detail
of the light source, at a working distance that is reasonably close to the goniometer.
The imaging colorimeter can be used to make colorimetric, photopic, or radiometric
measurements. [2]
Figure 2 - The two-axis goniometer used allows the measurement of light sources that extend outside of the boundaries of the frame so that light tubes and panels can also be measured directly.
Measurement Control and Analysis Software
The measurement sequence is automated by the use of control software to direct
the positioning of the goniometer – and so the light source – relative to the imaging
colorimeter. The control software synchronizes the measurements made by the imaging
colorimeter with the steps and pauses in the goniometer’s motion. In addition, the
control and analysis software allows review of the individual images acquired, as well as
WHITE PAPER
5 I Radiant Zemax, LLC
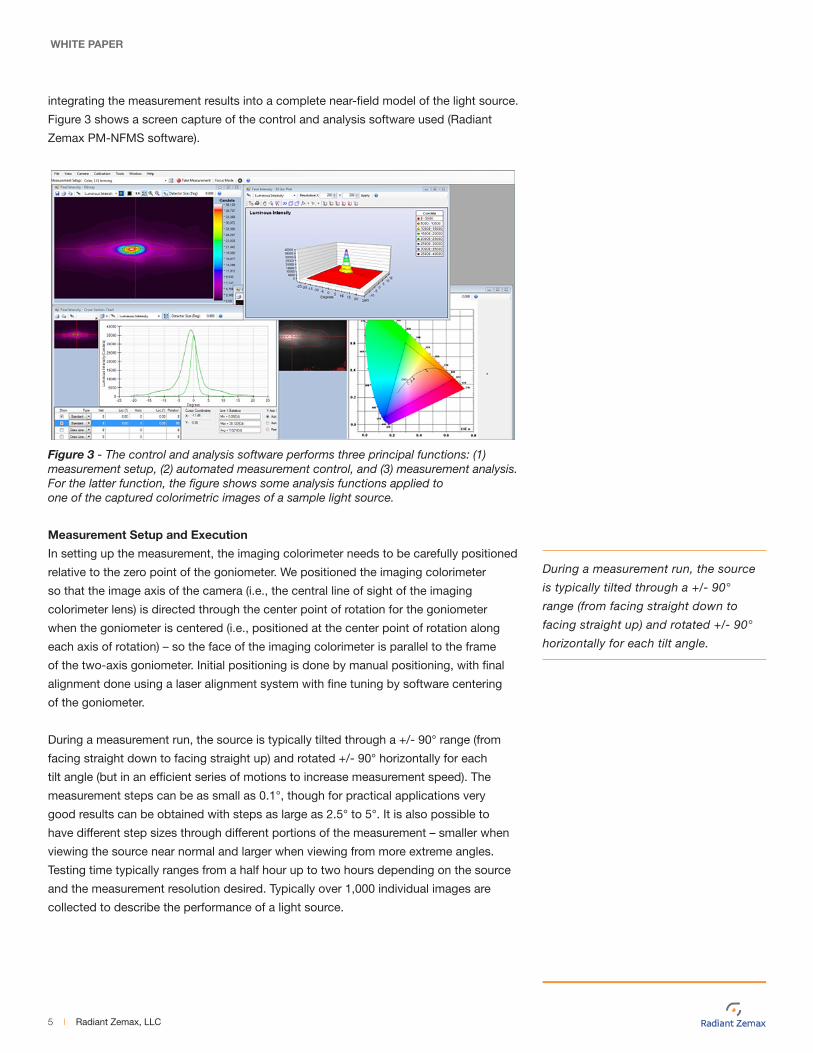
integrating the measurement results into a complete near-field model of the light source.
Figure 3 shows a screen capture of the control and analysis software used (Radiant
Zemax PM-NFMS software).
Figure 3 - The control and analysis software performs three principal functions: (1) measurement setup, (2) automated measurement control, and (3) measurement analysis. For the latter function, the figure shows some analysis functions applied to one of the captured colorimetric images of a sample light source.
Measurement Setup and Execution
In setting up the measurement, the imaging colorimeter needs to be carefully positioned
relative to the zero point of the goniometer. We positioned the imaging colorimeter
so that the image axis of the camera (i.e., the central line of sight of the imaging
colorimeter lens) is directed through the center point of rotation for the goniometer
when the goniometer is centered (i.e., positioned at the center point of rotation along
each axis of rotation) – so the face of the imaging colorimeter is parallel to the frame
of the two-axis goniometer. Initial positioning is done by manual positioning, with final
alignment done using a laser alignment system with fine tuning by software centering
of the goniometer.
During a measurement run, the source is typically tilted through a +/- 90° range (from
facing straight down to facing straight up) and rotated +/- 90° horizontally for each
tilt angle (but in an efficient series of motions to increase measurement speed). The
measurement steps can be as small as 0.1°, though for practical applications very
good results can be obtained with steps as large as 2.5° to 5°. It is also possible to
have different step sizes through different portions of the measurement – smaller when
viewing the source near normal and larger when viewing from more extreme angles.
Testing time typically ranges from a half hour up to two hours depending on the source
and the measurement resolution desired. Typically over 1,000 individual images are
collected to describe the performance of a light source.
WHITE PAPER
During a measurement run, the source
is typically tilted through a +/- 90°
range (from facing straight down to
facing straight up) and rotated +/- 90°
horizontally for each tilt angle.
6 I Radiant Zemax, LLC
Each individual imaging colorimeter measurement captures both a brightness
(luminance) and color profile of the source from a particular angle. The goniometric
system moves the light source through a series of inclination angles relative to the fixed
position of the imaging colorimeter – tilting and rotating the source until a complete set
of measurements are taken. The multiple images capture the spatial distribution of the
light output of the source (which is modeled as an extended, rather than a point, source)
from multiple points of view.
Near-Field Models and Ray Set Generation
Once the complete set of measurements is obtained, the measurements are combined
in software into a complete near-field model of the light source which describes the
luminance and color output of the light source. The data acquired is output light intensity
as function of location on the source (x,y,z) and direction (Ɵ,ϕ): I(x,y,z,Ɵ,ϕ). This intensity
function can also include color coordinates if color measurements are made. The near-
field model can be used to generate ray sets for optical design and to extrapolate far-field
distributions for illumination design and performance characterization.
For optical modeling, the intensity function is used to generate a ray set for import into
optical modeling software. The ray set is generated by randomly selecting the direction
the ray will travel in (Ɵ’,ϕ’) and an origination pixel (x’,y’,z’) on the light source. This
random selection is either done via Monte Carlo methods, or by weighting the direction
and origin based on the measured luminance distribution. This second approach,
known as importance sampling, results in improved modeling accuracy with fewer rays
in the ray set; this also reduces processing time when running optical design software.
To generate the ray, the measured intensity function is “morphed” to extrapolate an
intensity value with that origin and direction, and the origination point of the ray is the
point along that ray where it intersects a user defined optical surface. Usually hundreds
of thousands to tens of millions of rays are generated to form a ray set.
Extrapolation to Far-Field Luminous Intensity Distributions
To generate a far field distribution the same methodology is followed, except that the
intensity distribution is simplified to I(Ɵ,ϕ) by setting (x,y,z) = (0,0,0) for all the measured
data. This has the effect of treating the light source as a point source and so yields the
far-field luminous intensity distribution.
Example of Measurement ResultsThe near-field goniometer measurement method can be applied to a broad range
of large light sources, such as architectural lighting, spot lights, and automobile
headlamps. In each of these cases, the illumination plane of interest can be many
meters from the source, and so requiring a large space to measure using far-field
measurement methods. For example, traditionally the output of an automobile
headlamp is measured at about 100 ft (about 30 m) from the source. This requires a
specialized (and expensive) testing facility. While such a facility may indeed be specified
for certification testing, it is generally too expensive to use for testing intermediate
designs, for evaluating and qualifying sources from different manufacturers, or for
quality tracking. With the near-field measurement method described above the source
can be measured in the space of just a few meters, and so in a normal sized laboratory.
WHITE PAPER
Once the complete set of
measurements is obtained, the
measurements are combined into
a complete near-field model which
describes the angular luminance and
color output.
7 I Radiant Zemax, LLC
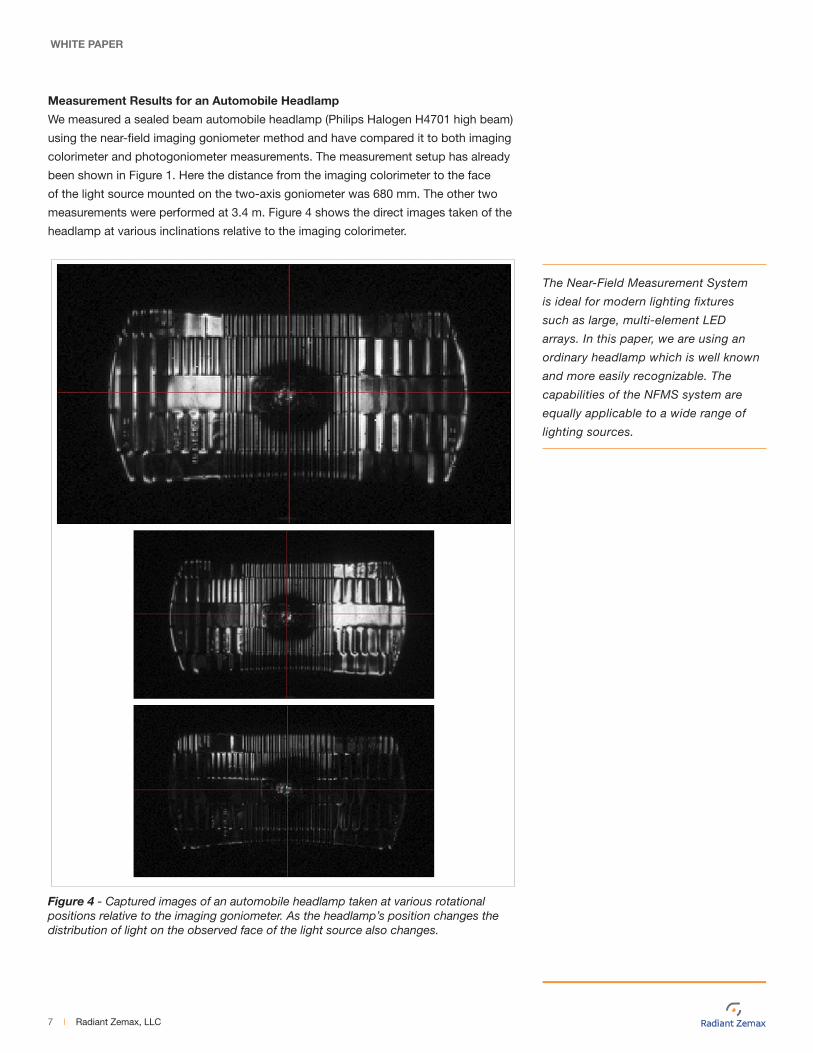
Measurement Results for an Automobile Headlamp
We measured a sealed beam automobile headlamp (Philips Halogen H4701 high beam)
using the near-field imaging goniometer method and have compared it to both imaging
colorimeter and photogoniometer measurements. The measurement setup has already
been shown in Figure 1. Here the distance from the imaging colorimeter to the face
of the light source mounted on the two-axis goniometer was 680 mm. The other two
measurements were performed at 3.4 m. Figure 4 shows the direct images taken of the
headlamp at various inclinations relative to the imaging colorimeter.
Figure 4 - Captured images of an automobile headlamp taken at various rotational positions relative to the imaging goniometer. As the headlamp’s position changes the distribution of light on the observed face of the light source also changes.
WHITE PAPER
The Near-Field Measurement System
is ideal for modern lighting fixtures
such as large, multi-element LED
arrays. In this paper, we are using an
ordinary headlamp which is well known
and more easily recognizable. The
capabilities of the NFMS system are
equally applicable to a wide range of
lighting sources.
8 I Radiant Zemax, LLC
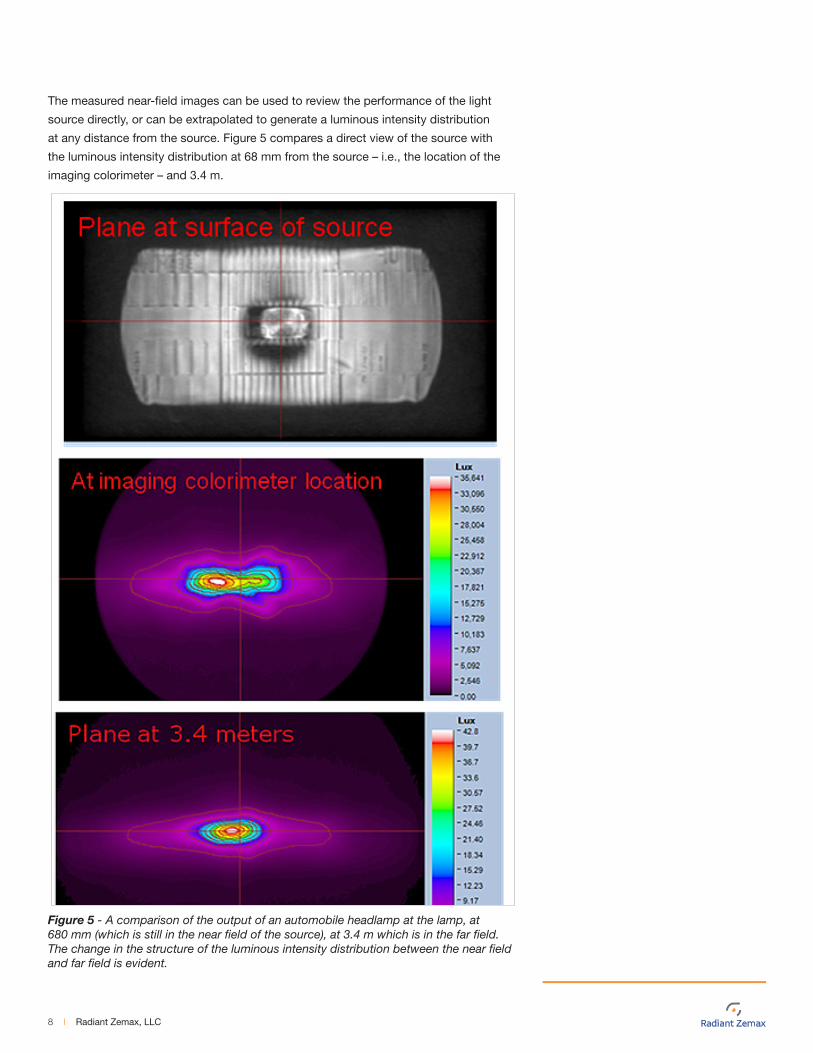
The measured near-field images can be used to review the performance of the light
source directly, or can be extrapolated to generate a luminous intensity distribution
at any distance from the source. Figure 5 compares a direct view of the source with
the luminous intensity distribution at 68 mm from the source – i.e., the location of the
imaging colorimeter – and 3.4 m.
Figure 5 - A comparison of the output of an automobile headlamp at the lamp, at 680 mm (which is still in the near field of the source), at 3.4 m which is in the far field. The change in the structure of the luminous intensity distribution between the near field and far field is evident.
9 I Radiant Zemax, LLC
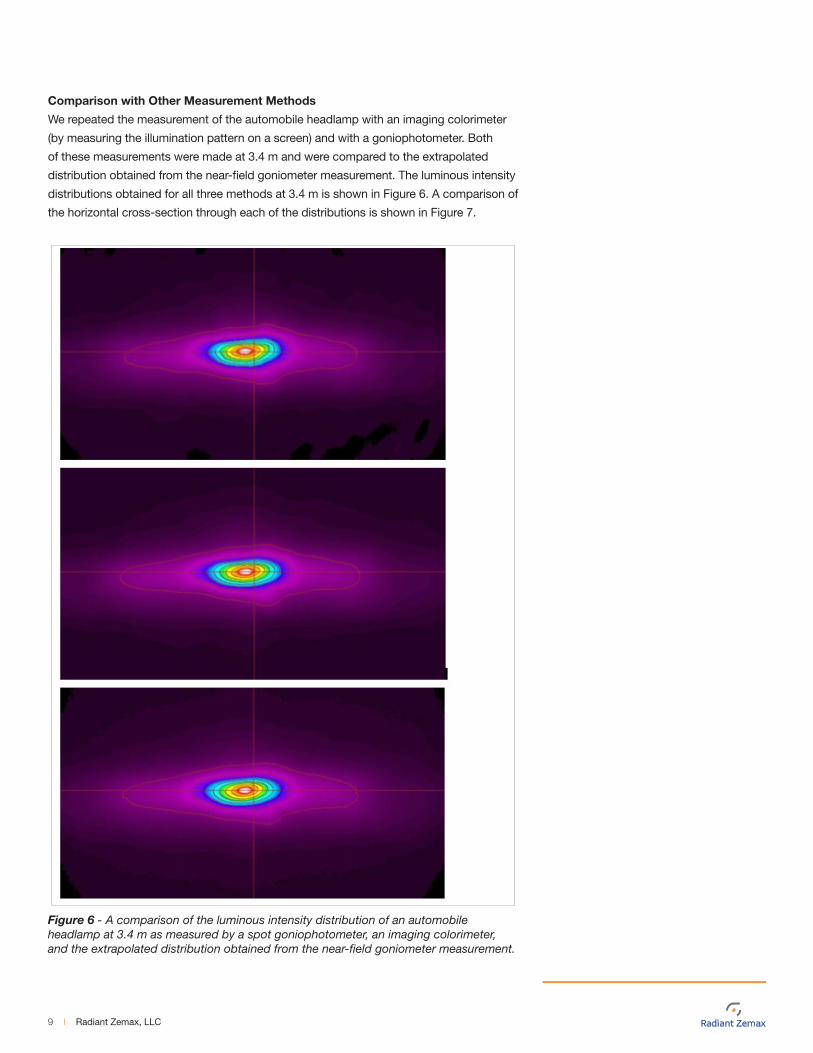
Comparison with Other Measurement Methods
We repeated the measurement of the automobile headlamp with an imaging colorimeter
(by measuring the illumination pattern on a screen) and with a goniophotometer. Both
of these measurements were made at 3.4 m and were compared to the extrapolated
distribution obtained from the near-field goniometer measurement. The luminous intensity
distributions obtained for all three methods at 3.4 m is shown in Figure 6. A comparison of
the horizontal cross-section through each of the distributions is shown in Figure 7.
Figure 6 - A comparison of the luminous intensity distribution of an automobile headlamp at 3.4 m as measured by a spot goniophotometer, an imaging colorimeter, and the extrapolated distribution obtained from the near-field goniometer measurement.
10 I Radiant Zemax, LLC
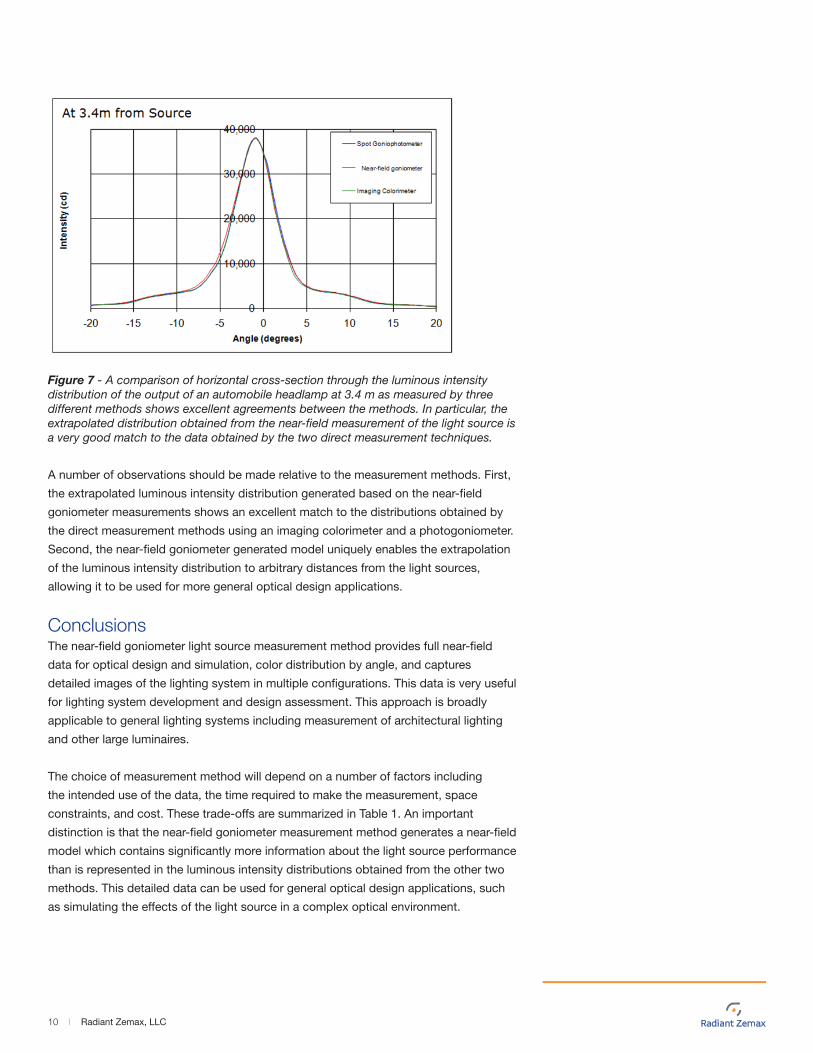
Figure 7 - A comparison of horizontal cross-section through the luminous intensity distribution of the output of an automobile headlamp at 3.4 m as measured by three different methods shows excellent agreements between the methods. In particular, the extrapolated distribution obtained from the near-field measurement of the light source is a very good match to the data obtained by the two direct measurement techniques.
A number of observations should be made relative to the measurement methods. First,
the extrapolated luminous intensity distribution generated based on the near-field
goniometer measurements shows an excellent match to the distributions obtained by
the direct measurement methods using an imaging colorimeter and a photogoniometer.
Second, the near-field goniometer generated model uniquely enables the extrapolation
of the luminous intensity distribution to arbitrary distances from the light sources,
allowing it to be used for more general optical design applications.
ConclusionsThe near-field goniometer light source measurement method provides full near-field
data for optical design and simulation, color distribution by angle, and captures
detailed images of the lighting system in multiple configurations. This data is very useful
for lighting system development and design assessment. This approach is broadly
applicable to general lighting systems including measurement of architectural lighting
and other large luminaires.
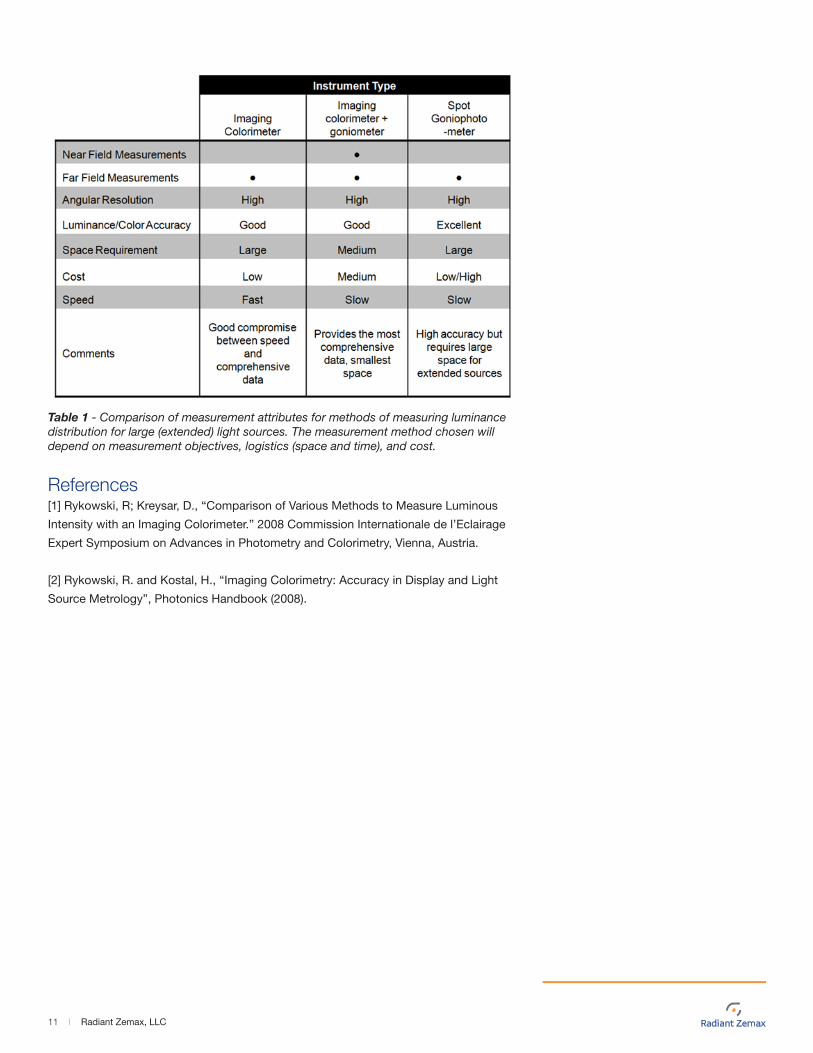
The choice of measurement method will depend on a number of factors including
the intended use of the data, the time required to make the measurement, space
constraints, and cost. These trade-offs are summarized in Table 1. An important
distinction is that the near-field goniometer measurement method generates a near-field
model which contains significantly more information about the light source performance
than is represented in the luminous intensity distributions obtained from the other two
methods. This detailed data can be used for general optical design applications, such
as simulating the effects of the light source in a complex optical environment.
11 I Radiant Zemax, LLC
Table 1 - Comparison of measurement attributes for methods of measuring luminance distribution for large (extended) light sources. The measurement method chosen will depend on measurement objectives, logistics (space and time), and cost.
References[1] Rykowski, R; Kreysar, D., “Comparison of Various Methods to Measure Luminous
Intensity with an Imaging Colorimeter.” 2008 Commission Internationale de l’Eclairage
Expert Symposium on Advances in Photometry and Colorimetry, Vienna, Austria.
[2] Rykowski, R. and Kostal, H., “Imaging Colorimetry: Accuracy in Display and Light
Source Metrology”, Photonics Handbook (2008).
© 2013 Radiant Zemax LLC. Radiant Zemax, ProMetric, TrueTest and Zemax are trademarks of Radiant Zemax LLC. All other marks are the property of their respective owners.770-9002-01 2/13
Contact Us Today
Worldwide
Radiant Zemax, LLC
22908 NE Alder Crest Drive, Suite 100
Redmond, WA 98053 USA
T. +1 425 844-0152
F. +1 425 844-0153
RadiantZemax.com
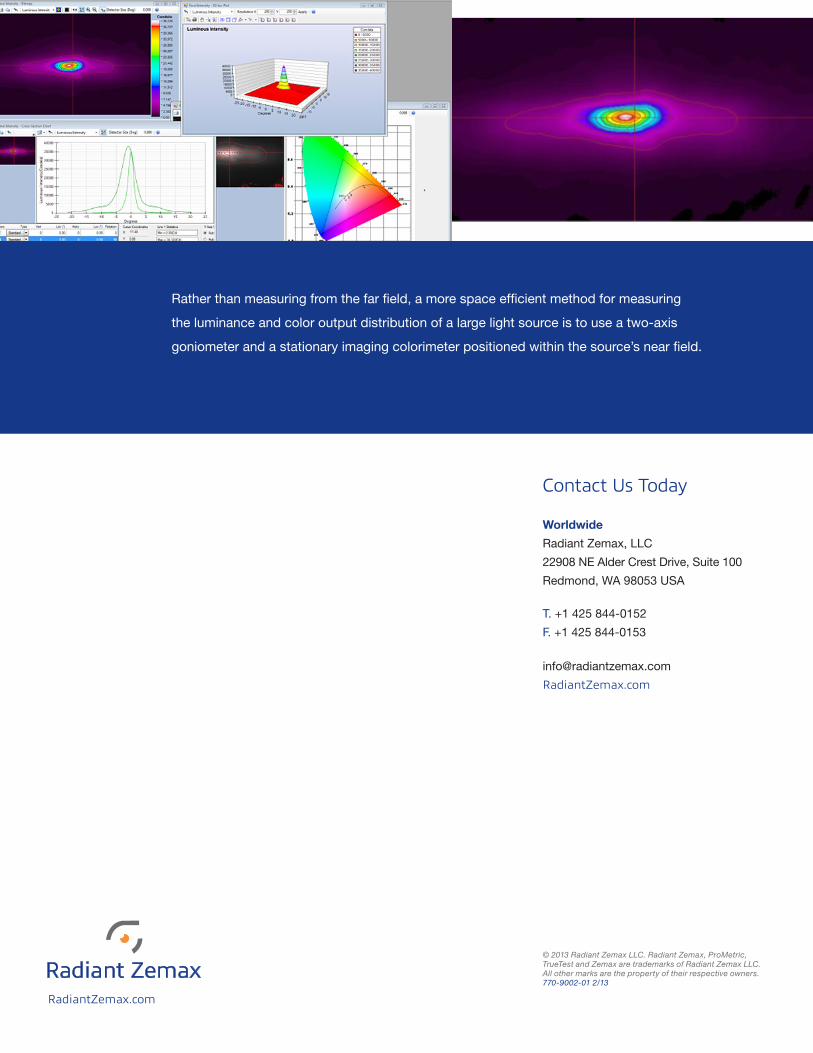
Rather than measuring from the far field, a more space efficient method for measuring
the luminance and color output distribution of a large light source is to use a two-axis
goniometer and a stationary imaging colorimeter positioned within the source’s near field.
RadiantZemax.com


![[Oil & Gas White Paper] Gas Production Measurement System](https://img.pdfslide.us/doc/110x75/557a6ba2d8b42a3b348b4dd3/oil-gas-white-paper-gas-production-measurement-system.jpg)