Embed Size (px)
Citation preview
Intel IT compared the performance of two and four processor-socket servers with Intel® quad-core processors in a virtualized environment. This virtualization benchmarking study examined server performance, Total Cost of Ownership (TCO) and scalability for a variety of deployment scenarios. Our results indicated that memory-intensive and scalability-focused deployment scenarios were best met with a four-socket server based on the Quad-Core Intel® Xeon® processor 7300∆ series.
In memory-intensive deployment scenarios, we estimate that – for the same TCO – a deployment strategy utilizing four-socket servers can support approximately 15 percent more virtual machines than a deployment strategy based on two-socket servers.
For scalability-focused scenarios, the four-socket server offered about twice the scalability of the two-socket server. The Quad-Core Intel Xeon processor 7300 series demonstrated the same compelling value proposition for virtualization in multi-processor (MP) servers that the Quad-Core Intel® Xeon® processor 5300∆ series brought to dual-processor (DP) platforms. Deployment strategies based on the two systems had comparable TCO in performance-focused scenarios, while in situations where server demand was limited by business policy or other factors, the two-socket server based on the Quad-Core Intel Xeon processor 5300 series was more cost-effective.
Sudip Chahal, Intel Corporation April 2008
Comparing Two- and Four-Socket Platforms for Server Virtualization
White PaperIntel® Information Technology
Computer Manufacturing Server Virtualization
�
White Paper Comparing Two- and Four-Socket Platforms for Server Virtualization
ContentsExecutive Summary ...........................................................................................................................................................................................................................................................3
Business Challenge .............................................................................................................................................................................................................................................................3
Server Virtualization Test Configuration ..............................................................................................................................................................................................................4
Server Virtualization Test Results ............................................................................................................................................................................................................................5
TCO Impact Assessment ..................................................................................................................................................................................................................................................6
Major TCO Factors .................................................................................................................................................................................................................................................................................................................................... 6
Three Virtualization Deployment Scenarios.................................................................................................................................................................................................................................................................. 6
TCO Analysis Results ............................................................................................................................................................................................................................................................................................................................ 6
Large Resource Pools ........................................................................................................................................................................................................................................................8
Data Center LAN/SAN Constraint Scenarios.......................................................................................................................................................................................................8
More Predictable Scaling with Workload Spikes ...............................................................................................................................................................................................9
Two and Four Processor-Socket Server Comparison Summary ...........................................................................................................................................................10
Conclusion ............................................................................................................................................................................................................................................................................. 11
3
White Paper Comparing Two- and Four-Socket Platforms for Server Virtualization
Executive SummaryIntel IT compared the performance of two and four processor-
socket servers with Intel® quad-core processors in a virtualized
environment. Our results showed that for memory capacity-
limited scenarios – keeping TCO consistent – a deployment
strategy utilizing four-socket servers can support approxi-
mately 15 percent more virtual machines than a deployment
strategy based on two-socket servers. The four-socket servers
also offered about twice the scalability in terms of VMs hosted
per server.
We ran the vConsolidate V1.0 benchmark* on a four-socket server
based on the Quad-Core Intel® Xeon® processor X7350∆ and a
two-socket server based on the Quad-Core Intel® Xeon® processor
X5365.∆ This virtualization benchmark tests performance by sim-
ulating real-world server workloads in a typical environment. We
compared these server platforms across a variety of deployment
scenarios that emphasized performance, TCO and scalability.
We found that:
• For memory capacity-limited scenarios, a deployment strategy
utilizing the four-socket server supported about 15 percent
more Virtual Machines (VMs) for the same TCO when compared
with a deployment strategy utilizing two-socket servers.
• The four-socket server offered about twice the scalability in
terms of compute performance.
• Deployment strategies based on servers from either of the two
categories resulted in comparable TCO per VM when the focus
is on meeting performance-focused service level agreements
(SLAs) such as response time and application throughput.
• Deployment strategies emphasizing two-socket servers had
the lowest TCO per VM when the server demand is relatively
low, which can occur in a variety of situations – including but
not limited to – the result of business policy requirements,
limitations imposed by the technology infrastructure, limited
demand for compute resources at small sites or other
constraints.
Our analysis shows that both Quad-Core Intel Xeon processor
7300 and 5300 series-based servers are well suited for virtual-
ization, with each providing advantages for different deployment
scenarios. The Quad-Core Intel Xeon processor 7300 series
demonstrated the same compelling value proposition for virtu-
alization in multi-processor (MP) servers that the Xeon 5300
brought to dual-processor (DP) platforms.
Business ChallengeLike many IT organizations, Intel IT supports a diverse set of
requirements with virtualization users pursuing server virtualiza-
tion to reduce costs in areas such as hardware, technical support
and power and cooling.
We comprehended this range of business requirements by
evaluating server virtualization platforms across a number of
deployment scenarios that reflect different decision criteria.
Our assessment includes the following scenarios:
• Scenarios that emphasize performance SLAs such as response
time and application throughput expectations (e.g., a certain num-
ber of transactions completed in a pre-specified time interval).
• Commodity/consolidation scenarios that focus on provisioning
large numbers of virtual machines as cost-effectively as possible
from an overall TCO standpoint.
• Scenarios limited by business policy (e.g., risk management),
technology infrastructure (legacy backup systems) or
other constraints (remote sites) that result in relatively
low server demand.
• Scalability-focused scenarios that comprehend ease of
management, responsiveness in handling unexpected
workload spikes and efficient utilization of scarce LAN
and SAN connectivity resources (ports) in the data center.
These distinct server virtualization deployment scenarios consti-
tute the high-level framework for comparing the newly lauched
quad-core processor-based four-socket server platforms with the
existing quad-core processor-based two-socket server platforms.
We used the benchmark results and TCO analysis to determine
which server platform delivered the right level of performance at
a minimum cost. Our goal is to meet different business require-
ments in the most cost-effective way.
Our analysis shows that both Quad-Core Intel Xeon processor 7300 and 5300 series-based servers are well suited for virtualization, with each providing advantages for different deployment scenarios.
4
White Paper Comparing Two- and Four-Socket Platforms for Server Virtualization
We developed a virtualization proof-of-concept (POC) that
assessed server platforms relative to different user require-
ments. Our objective was to measure relative performance,
power consumption and system processor utilization and apply
this data to different business scenarios. We collected this data
using a POC that met the following requirements:
• Represent good approximations of IT workloads
• Produce objective measurements
• Adequately stress the systems
• Be repeatable
The POC ran the vConsolidate V1.0 benchmark suite which
generated consistent application workloads for the performance
analysis. The vConsolidate benchmark, launched in April 2007,
tests virtualization performance by simulating real server perfor-
mance in a typical environment. The benchmark runs Consolidated
Stack Units (CSUs), each comprising five simultaneously running
virtual machines (including 1 idle VM) as shown in Table 1. CSUs
can be added to increase the system load and CPU utilization, as
appropriate. The performance of all workloads (1 per VM) is
measured individually, and an aggregate number is calculated,
which is called the vCon score. This score represents the overall
performance aggregated across all the VMs running on the host.
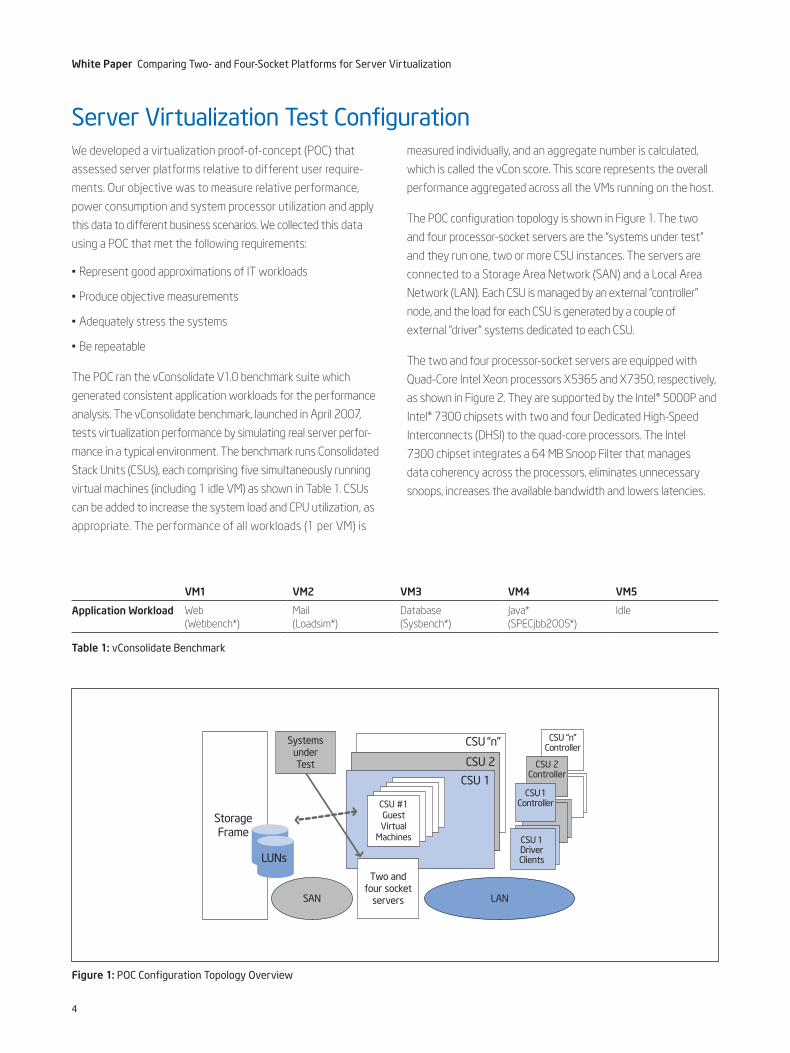
The POC configuration topology is shown in Figure 1. The two
and four processor-socket servers are the “systems under test”
and they run one, two or more CSU instances. The servers are
connected to a Storage Area Network (SAN) and a Local Area
Network (LAN). Each CSU is managed by an external “controller”
node, and the load for each CSU is generated by a couple of
external “driver” systems dedicated to each CSU.
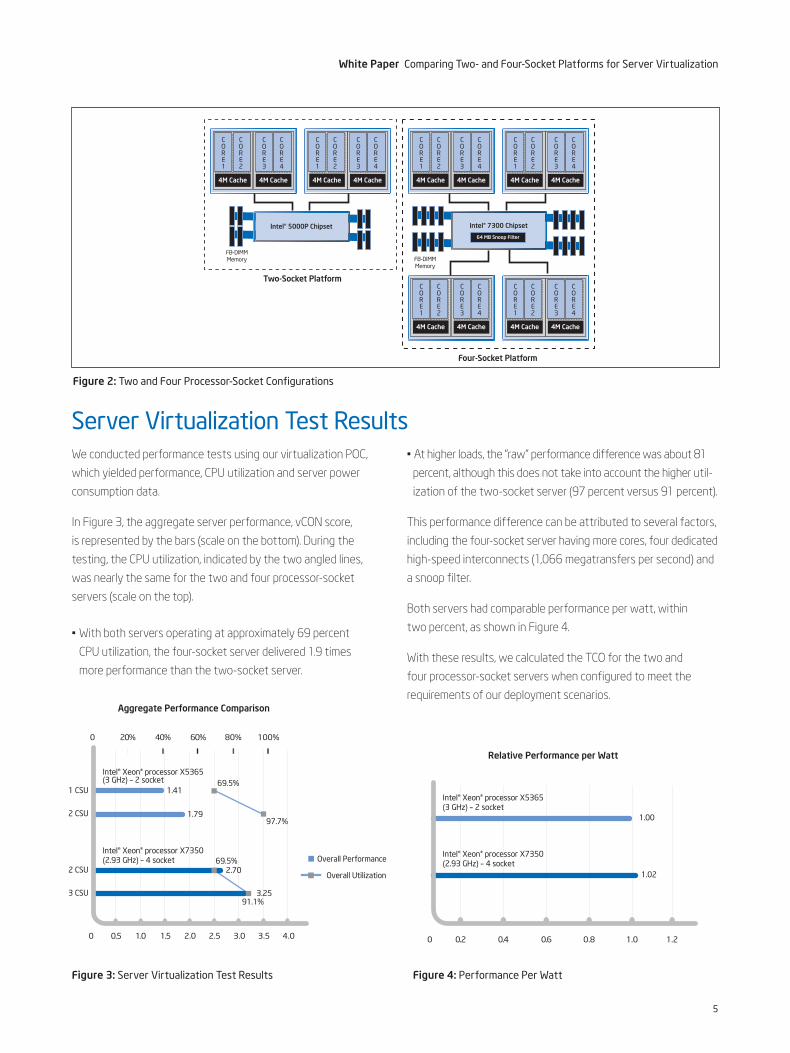
The two and four processor-socket servers are equipped with
Quad-Core Intel Xeon processors X5365 and X7350, respectively,
as shown in Figure 2. They are supported by the Intel® 5000P and
Intel® 7300 chipsets with two and four Dedicated High-Speed
Interconnects (DHSI) to the quad-core processors. The Intel
7300 chipset integrates a 64 MB Snoop Filter that manages
data coherency across the processors, eliminates unnecessary
snoops, increases the available bandwidth and lowers latencies.
Figure 1: POC Configuration Topology Overview
StorageFrame
CSU 1
CSU “n”
CSU 2
SAN LAN
Two andfour socket
servers
CSU 1DriverClients
CSU 1Controller
CSU 2Controller
CSU “n”Controller
LUNs
CSU #1GuestVirtual
Machines
SystemsunderTest
VM1 VM2 VM3 VM4 VM5
Application Workload Web (Webbench*)
Mail (Loadsim*)
Database (Sysbench*)
Java* (SPECjbb2005*)
Idle
Table 1: vConsolidate Benchmark
Server Virtualization Test Configuration
5
White Paper Comparing Two- and Four-Socket Platforms for Server Virtualization
We conducted performance tests using our virtualization POC,
which yielded performance, CPU utilization and server power
consumption data.
In Figure 3, the aggregate server performance, vCON score,
is represented by the bars (scale on the bottom). During the
testing, the CPU utilization, indicated by the two angled lines,
was nearly the same for the two and four processor-socket
servers (scale on the top).
• With both servers operating at approximately 69 percent
CPU utilization, the four-socket server delivered 1.9 times
more performance than the two-socket server.
• At higher loads, the “raw” performance difference was about 81
percent, although this does not take into account the higher util-
ization of the two-socket server (97 percent versus 91 percent).
This performance difference can be attributed to several factors,
including the four-socket server having more cores, four dedicated
high-speed interconnects (1,066 megatransfers per second) and
a snoop filter.
Both servers had comparable performance per watt, within
two percent, as shown in Figure 4.
With these results, we calculated the TCO for the two and
four processor-socket servers when configured to meet the
requirements of our deployment scenarios.
4M Cache 4M Cache 4M Cache 4M Cache
Intel® 5000P Chipset
FB-DIMMMemory
4M Cache 4M Cache 4M Cache 4M Cache
4M Cache 4M Cache 4M Cache 4M Cache
FB-DIMMMemory
Two-Socket Platform
Intel® 7300 Chipset
Four-Socket Platform
64 MB Snoop Filter
CORE1
CORE2
CORE3
CORE4
CORE1
CORE1
CORE2
CORE3
CORE4
CORE2
CORE3
CORE4
CORE2
CORE3
CORE4
CORE1
CORE1
CORE2
CORE3
CORE4
CORE1
CORE2
CORE3
CORE4
Figure 2: Two and Four Processor-Socket Configurations
Aggregate Performance Comparison
0 1.00.5 1.5 2.0
0
2.5 3.0 3.5 4.0
1 CSU69.5%
1.41
1.79
2.70
3.25
69.5%
97.7%
91.1%
2 CSU
2 CSU
3 CSU
40% 60% 80%20% 100%
Overall Performance
Overall Utilization
Intel® Xeon® processor X5365 (3 GHz) – 2 socket
Intel® Xeon® processor X7350 (2.93 GHz) – 4 socket
Figure 3: Server Virtualization Test Results
Relative Performance per Watt
0 0.40.2 0.6 0.8 1.0 1.2
1.00
1.02
Intel® Xeon® processor X5365 (3 GHz) – 2 socket
Intel® Xeon® processor X7350 (2.93 GHz) – 4 socket
Figure 4: Performance Per Watt
Server Virtualization Test Results
6
White Paper Comparing Two- and Four-Socket Platforms for Server Virtualization
We formulated comprehensive TCO models for the two
and four processor-socket servers corresponding to our
deployment scenarios.
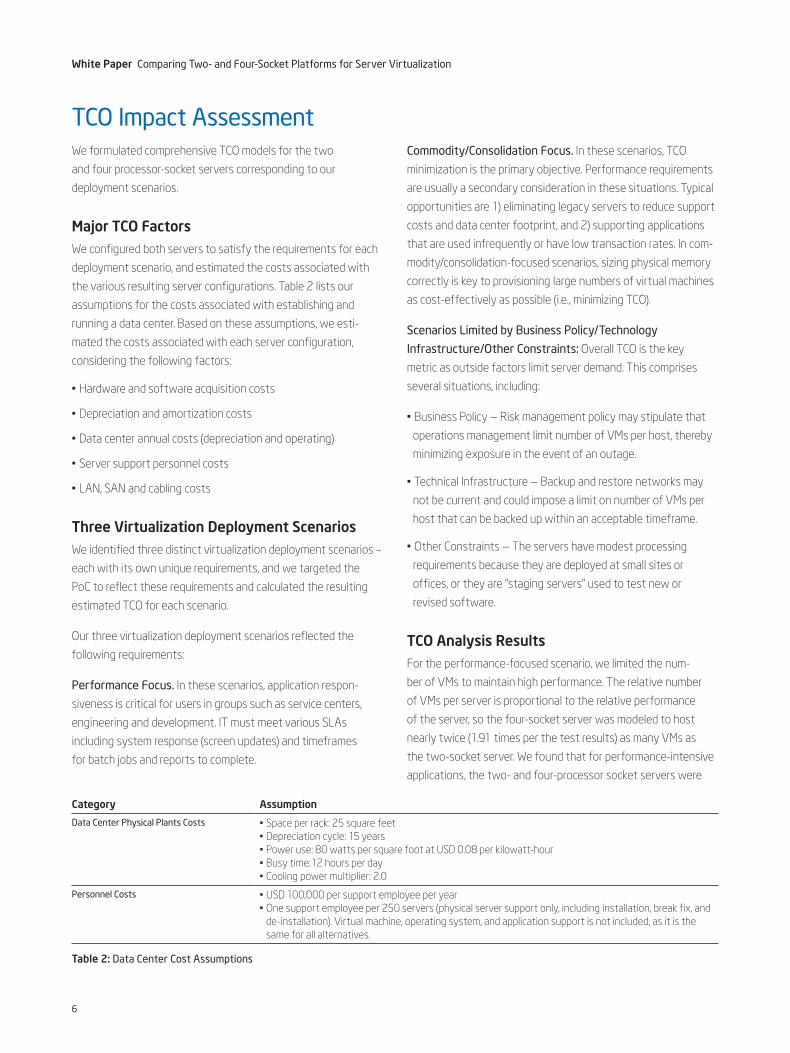
Major TCO FactorsWe configured both servers to satisfy the requirements for each
deployment scenario, and estimated the costs associated with
the various resulting server configurations. Table 2 lists our
assumptions for the costs associated with establishing and
running a data center. Based on these assumptions, we esti-
mated the costs associated with each server configuration,
considering the following factors:
• Hardware and software acquisition costs
• Depreciation and amortization costs
• Data center annual costs (depreciation and operating)
• Server support personnel costs
• LAN, SAN and cabling costs
Three Virtualization Deployment ScenariosWe identified three distinct virtualization deployment scenarios –
each with its own unique requirements, and we targeted the
PoC to reflect these requirements and calculated the resulting
estimated TCO for each scenario.
Our three virtualization deployment scenarios reflected the
following requirements:
Performance Focus. In these scenarios, application respon-
siveness is critical for users in groups such as service centers,
engineering and development. IT must meet various SLAs
including system response (screen updates) and timeframes
for batch jobs and reports to complete.
Commodity/Consolidation Focus. In these scenarios, TCO
minimization is the primary objective. Performance requirements
are usually a secondary consideration in these situations. Typical
opportunities are 1) eliminating legacy servers to reduce support
costs and data center footprint, and 2) supporting applications
that are used infrequently or have low transaction rates. In com-
modity/consolidation-focused scenarios, sizing physical memory
correctly is key to provisioning large numbers of virtual machines
as cost-effectively as possible (i.e., minimizing TCO).
Scenarios Limited by Business Policy/Technology
Infrastructure/Other Constraints: Overall TCO is the key
metric as outside factors limit server demand. This comprises
several situations, including:
• Business Policy — Risk management policy may stipulate that
operations management limit number of VMs per host, thereby
minimizing exposure in the event of an outage.
• Technical Infrastructure — Backup and restore networks may
not be current and could impose a limit on number of VMs per
host that can be backed up within an acceptable timeframe.
• Other Constraints — The servers have modest processing
requirements because they are deployed at small sites or
offices, or they are “staging servers” used to test new or
revised software.
TCO Analysis ResultsFor the performance-focused scenario, we limited the num-
ber of VMs to maintain high performance. The relative number
of VMs per server is proportional to the relative performance
of the server, so the four-socket server was modeled to host
nearly twice (1.91 times per the test results) as many VMs as
the two-socket server. We found that for performance-intensive
applications, the two- and four-processor socket servers were
Category Assumption
Data Center Physical Plants Costs • Space per rack: 25 square feet• Depreciation cycle: 15 years• Power use: 80 watts per square foot at USD 0.08 per kilowatt-hour• Busy time: 12 hours per day• Cooling power multiplier: 2.0
Personnel Costs • USD 100,000 per support employee per year• One support employee per 250 servers (physical server support only, including installation, break fix, and
de-installation). Virtual machine, operating system, and application support is not included, as it is the same for all alternatives.
Table 2: Data Center Cost Assumptions
TCO Impact Assessment
�
White Paper Comparing Two- and Four-Socket Platforms for Server Virtualization
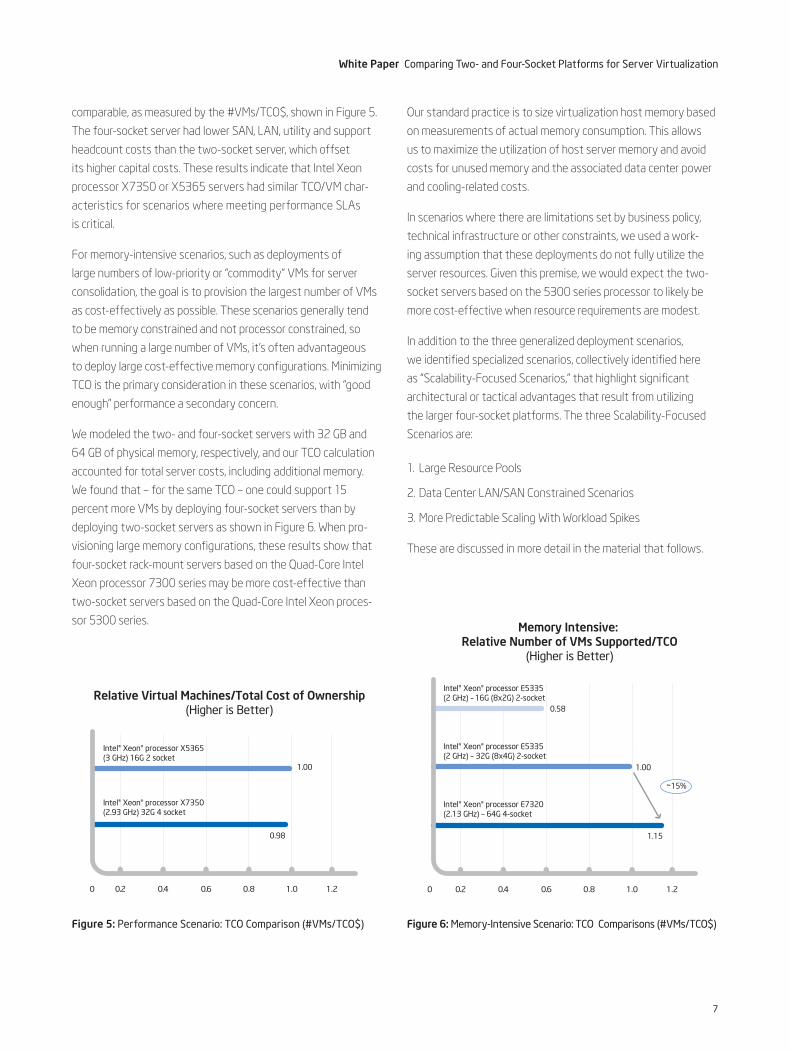
comparable, as measured by the #VMs/TCO$, shown in Figure 5.
The four-socket server had lower SAN, LAN, utility and support
headcount costs than the two-socket server, which offset
its higher capital costs. These results indicate that Intel Xeon
processor X7350 or X5365 servers had similar TCO/VM char-
acteristics for scenarios where meeting performance SLAs
is critical.
For memory-intensive scenarios, such as deployments of
large numbers of low-priority or “commodity” VMs for server
consolidation, the goal is to provision the largest number of VMs
as cost-effectively as possible. These scenarios generally tend
to be memory constrained and not processor constrained, so
when running a large number of VMs, it’s often advantageous
to deploy large cost-effective memory configurations. Minimizing
TCO is the primary consideration in these scenarios, with “good
enough” performance a secondary concern.
We modeled the two- and four-socket servers with 32 GB and
64 GB of physical memory, respectively, and our TCO calculation
accounted for total server costs, including additional memory.
We found that – for the same TCO – one could support 15
percent more VMs by deploying four-socket servers than by
deploying two-socket servers as shown in Figure 6. When pro-
visioning large memory configurations, these results show that
four-socket rack-mount servers based on the Quad-Core Intel
Xeon processor 7300 series may be more cost-effective than
two-socket servers based on the Quad-Core Intel Xeon proces-
sor 5300 series.
Our standard practice is to size virtualization host memory based
on measurements of actual memory consumption. This allows
us to maximize the utilization of host server memory and avoid
costs for unused memory and the associated data center power
and cooling-related costs.
In scenarios where there are limitations set by business policy,
technical infrastructure or other constraints, we used a work-
ing assumption that these deployments do not fully utilize the
server resources. Given this premise, we would expect the two-
socket servers based on the 5300 series processor to likely be
more cost-effective when resource requirements are modest.
In addition to the three generalized deployment scenarios,
we identified specialized scenarios, collectively identified here
as “Scalability-Focused Scenarios,” that highlight significant
architectural or tactical advantages that result from utilizing
the larger four-socket platforms. The three Scalability-Focused
Scenarios are:
1. Large Resource Pools
2. Data Center LAN/SAN Constrained Scenarios
3. More Predictable Scaling With Workload Spikes
These are discussed in more detail in the material that follows.
Memory Intensive: Relative Number of VMs Supported/TCO
(Higher is Better)
0 0.40.2 0.6 0.8 1.0 1.2
1.00
0.58
1.15
~15%
Intel® Xeon® processor E5335 (2 GHz) – 16G (8x2G) 2-socket
Intel® Xeon® processor E5335 (2 GHz) – 32G (8x4G) 2-socket
Intel® Xeon® processor E7320 (2.13 GHz) – 64G 4-socket
Figure 6: Memory-Intensive Scenario: TCO Comparisons (#VMs/TCO$)
Relative Virtual Machines/Total Cost of Ownership(Higher is Better)
0 0.40.2 0.6 0.8 1.0 1.2
1.00
0.98
Intel® Xeon® processor X5365 (3 GHz) 16G 2 socket
Intel® Xeon® processor X7350 (2.93 GHz) 32G 4 socket
Figure 5: Performance Scenario: TCO Comparison (#VMs/TCO$)
White Paper Comparing Two- and Four-Socket Platforms for Server Virtualization
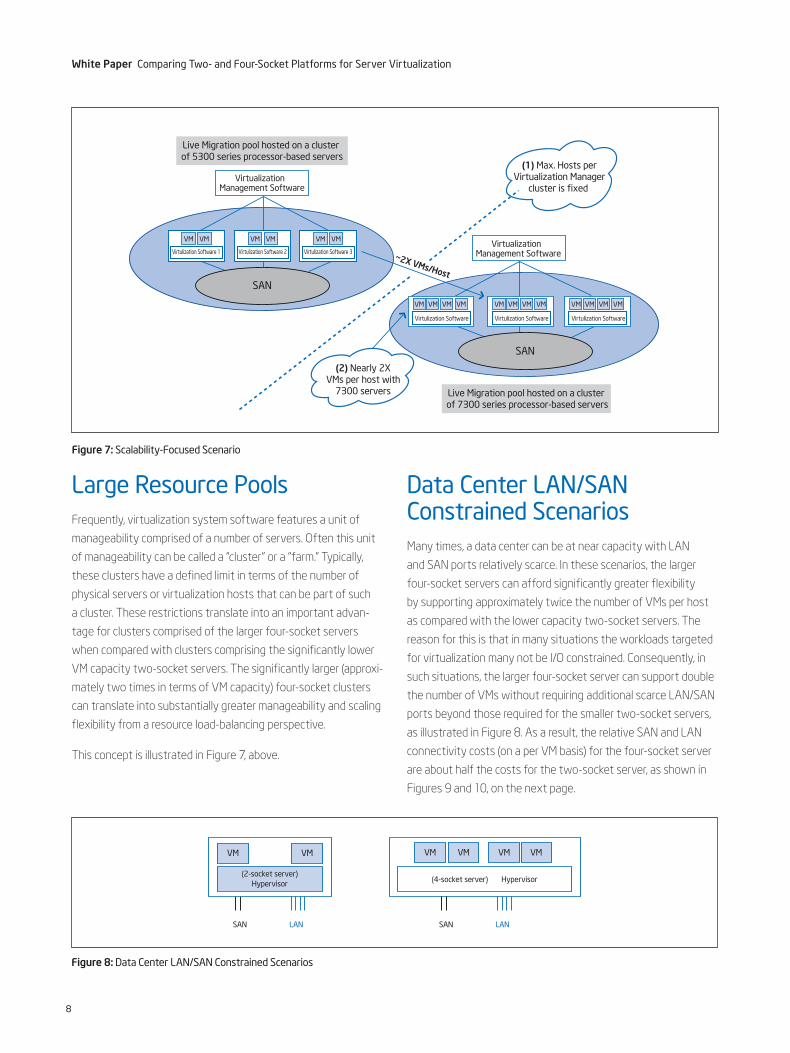
Large Resource PoolsFrequently, virtualization system software features a unit of
manageability comprised of a number of servers. Often this unit
of manageability can be called a “cluster” or a “farm.” Typically,
these clusters have a defined limit in terms of the number of
physical servers or virtualization hosts that can be part of such
a cluster. These restrictions translate into an important advan-
tage for clusters comprised of the larger four-socket servers
when compared with clusters comprising the significantly lower
VM capacity two-socket servers. The significantly larger (approxi-
mately two times in terms of VM capacity) four-socket clusters
can translate into substantially greater manageability and scaling
flexibility from a resource load-balancing perspective.
This concept is illustrated in Figure 7, above.
Data Center LAN/SAN Constrained ScenariosMany times, a data center can be at near capacity with LAN
and SAN ports relatively scarce. In these scenarios, the larger
four-socket servers can afford significantly greater flexibility
by supporting approximately twice the number of VMs per host
as compared with the lower capacity two-socket servers. The
reason for this is that in many situations the workloads targeted
for virtualization many not be I/O constrained. Consequently, in
such situations, the larger four-socket server can support double
the number of VMs without requiring additional scarce LAN/SAN
ports beyond those required for the smaller two-socket servers,
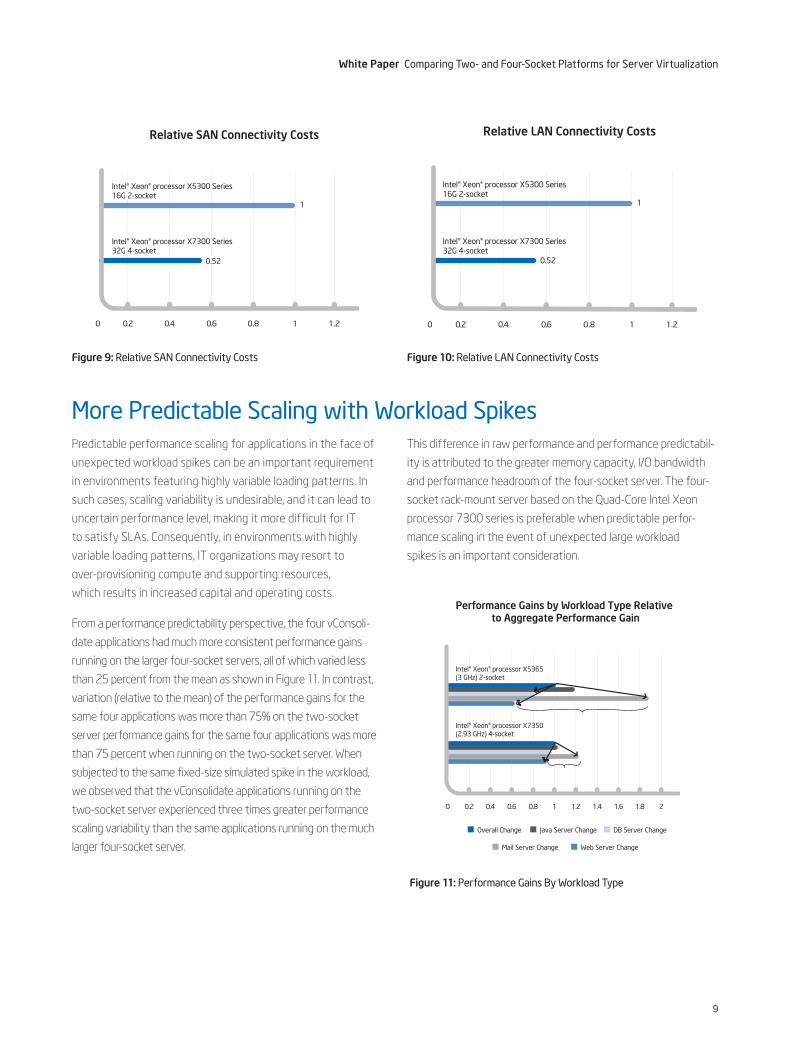
as illustrated in Figure 8. As a result, the relative SAN and LAN
connectivity costs (on a per VM basis) for the four-socket server
are about half the costs for the two-socket server, as shown in
Figures 9 and 10, on the next page.
VM VM
(2-socket server)Hypervisor
VM VM VM VM
(4-socket server) Hypervisor
SAN LAN SAN LAN
Figure 8: Data Center LAN/SAN Constrained Scenarios
8
(2) Nearly 2XVMs per host with
7300 servers
(1) Max. Hosts perVirtualization Manager
cluster is fixed
Live Migration pool hosted on a cluster of 5300 series processor-based servers
Live Migration pool hosted on a cluster of 7300 series processor-based servers
Virtualization Management Software
SAN
VM VM
Virtulization Software 1
SAN
VM VM VM VM
Virtulization Software
VM VM VM VM
Virtulization Software
VM VM VM VM
Virtulization Software
~2X VMs/Host
VM VM
Virtulization Software 2
VM VM
Virtulization Software 3Virtualization
Management Software
Figure 7: Scalability-Focused Scenario
9
White Paper Comparing Two- and Four-Socket Platforms for Server Virtualization
Predictable performance scaling for applications in the face of
unexpected workload spikes can be an important requirement
in environments featuring highly variable loading patterns. In
such cases, scaling variability is undesirable, and it can lead to
uncertain performance level, making it more difficult for IT
to satisfy SLAs. Consequently, in environments with highly
variable loading patterns, IT organizations may resort to
over-provisioning compute and supporting resources,
which results in increased capital and operating costs.
From a performance predictability perspective, the four vConsoli-
date applications had much more consistent performance gains
running on the larger four-socket servers, all of which varied less
than 25 percent from the mean as shown in Figure 11. In contrast,
variation (relative to the mean) of the performance gains for the
same four applications was more than 75% on the two-socket
server performance gains for the same four applications was more
than 75 percent when running on the two-socket server. When
subjected to the same fixed-size simulated spike in the workload,
we observed that the vConsolidate applications running on the
two-socket server experienced three times greater performance
scaling variability than the same applications running on the much
larger four-socket server.
This difference in raw performance and performance predictabil-
ity is attributed to the greater memory capacity, I/O bandwidth
and performance headroom of the four-socket server. The four-
socket rack-mount server based on the Quad-Core Intel Xeon
processor 7300 series is preferable when predictable perfor-
mance scaling in the event of unexpected large workload
spikes is an important consideration.
Relative SAN Connectivity Costs
0 0.40.2 0.6 0.8 1 1.2
1
0.52
Intel® Xeon® processor X5300 Series16G 2-socket
Intel® Xeon® processor X7300 Series32G 4-socket
Figure 9: Relative SAN Connectivity Costs
Relative LAN Connectivity Costs
0 0.40.2 0.6 0.8 1 1.2
1
0.52
Intel® Xeon® processor X5300 Series16G 2-socket
Intel® Xeon® processor X7300 Series32G 4-socket
Figure 10: Relative LAN Connectivity Costs
Performance Gains by Workload Type Relative to Aggregate Performance Gain
0 0.2 0.4 0.6 0.8 1 1.2 1.4 1.6 1.8 2
Intel® Xeon® processor X5365 (3 GHz) 2-socket
Intel® Xeon® processor X7350 (2.93 GHz) 4-socket
Overall Change Java Server Change DB Server Change
Mail Server Change Web Server Change
Figure 11: Performance Gains By Workload Type
More Predictable Scaling with Workload Spikes
10
White Paper Comparing Two- and Four-Socket Platforms for Server Virtualization
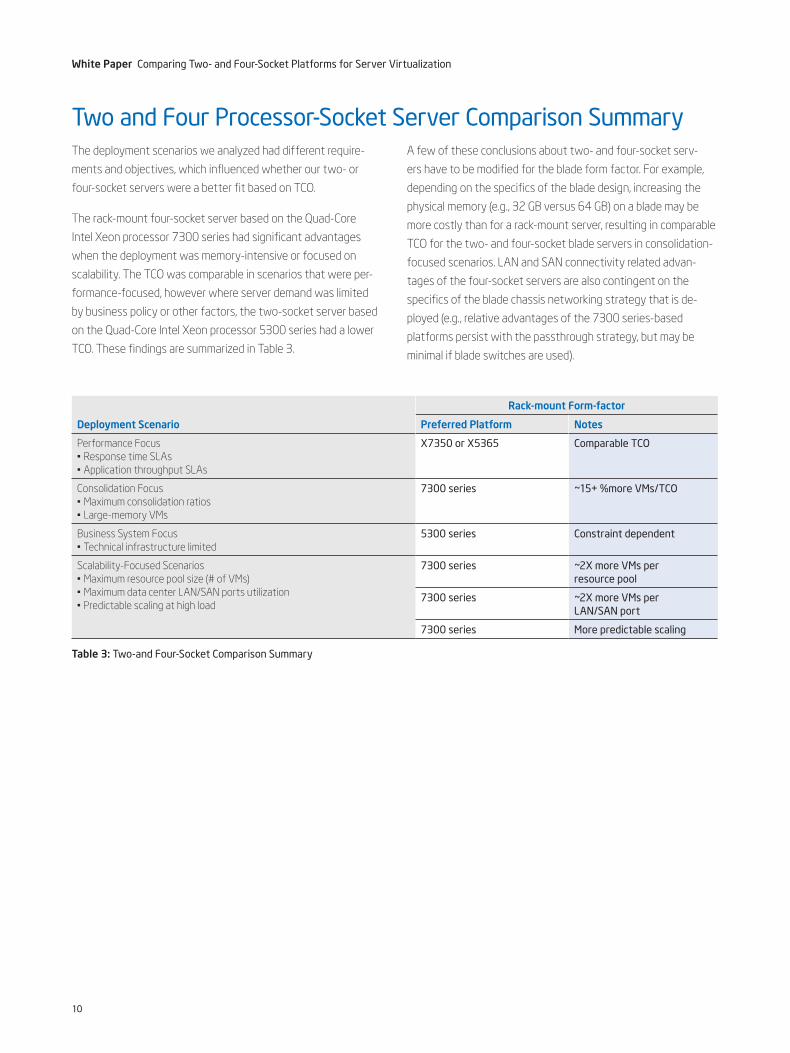
The deployment scenarios we analyzed had different require-
ments and objectives, which influenced whether our two- or
four-socket servers were a better fit based on TCO.
The rack-mount four-socket server based on the Quad-Core
Intel Xeon processor 7300 series had significant advantages
when the deployment was memory-intensive or focused on
scalability. The TCO was comparable in scenarios that were per-
formance-focused, however where server demand was limited
by business policy or other factors, the two-socket server based
on the Quad-Core Intel Xeon processor 5300 series had a lower
TCO. These findings are summarized in Table 3.
A few of these conclusions about two- and four-socket serv-
ers have to be modified for the blade form factor. For example,
depending on the specifics of the blade design, increasing the
physical memory (e.g., 32 GB versus 64 GB) on a blade may be
more costly than for a rack-mount server, resulting in comparable
TCO for the two- and four-socket blade servers in consolidation-
focused scenarios. LAN and SAN connectivity related advan-
tages of the four-socket servers are also contingent on the
specifics of the blade chassis networking strategy that is de-
ployed (e.g., relative advantages of the 7300 series-based
platforms persist with the passthrough strategy, but may be
minimal if blade switches are used).
Deployment Scenario
Rack-mount Form-factor
Preferred Platform Notes
Performance Focus• Response time SLAs• Application throughput SLAs
X�350 or X5365 Comparable TCO
Consolidation Focus• Maximum consolidation ratios• Large-memory VMs
�300 series ~15+ %more VMs/TCO
Business System Focus• Technical infrastructure limited
5300 series Constraint dependent
Scalability-Focused Scenarios• Maximum resource pool size (# of VMs)• Maximum data center LAN/SAN ports utilization• Predictable scaling at high load
�300 series ~�X more VMs per resource pool
�300 series ~�X more VMs per LAN/SAN port
�300 series More predictable scaling
Table 3: Two-and Four-Socket Comparison Summary
Two and Four Processor-Socket Server Comparison Summary
11
White Paper Comparing Two- and Four-Socket Platforms for Server Virtualization
ConclusionUsing the results from running the vConsolidate V1.0 bench
mark suite and TCO analysis, we developed server configuration
recommendations that enable our users to meet their computing
and virtualization needs more cost-effectively. We found the
selection of the most suitable server depends on specific busi-
ness group objectives and priorities, such as performance, TCO
and scaling.
Both Quad-Core Intel Xeon processor 7300 and 5300 series
platforms performed well in a virtualized environment. Our
results indicated that memory-intensive and scalability-focused
deployment scenarios were best met with a four-socket server
based on the Quad-Core Intel Xeon processor 7300 series. This
server supported approximately 15 percent more virtual machines
and offered about twice the scalability of the two-socket server.
The Quad-Core Intel Xeon processor 7300 series demonstrated
the same compelling value proposition for virtualization in multi-
processor (MP) servers that the Quad-Core Intel Xeon processor
5300 series brought to dual-processor (DP) platforms. The two
systems had comparable TCO in performance-focused scenarios,
while in situations where server demand was limited by business
policy or other factors, the two-socket server based on the Quad-
Core Intel Xeon processor 5300 series had a lower TCO.
Our approach – based on a POC and a standard virtualization benchmark suite – helped us identify which server platform delivered the right level of performance at a minimum cost for the various business groups we serve.
Δ Intel processor numbers are not a measure of performance. Processor numbers differentiate features within each processor family, not across different processor families. See www.intel.com/products/processor_number for details.
Performancetestsandratingsaremeasuredusingspecificcomputersystemsand/orcomponentsandreflecttheapproximateperformanceofIntelproductsasmeasuredbythosetests.Anydifferenceinsystemhardwareorsoftwaredesignorconfigurationmayaffectactualperformance.Buyersshouldconsultothersourcesofinformationtoevaluatetheperformanceofsystemsorcomponentstheyareconsideringpurchasing.FormoreinformationonperformancetestsandontheperformanceofIntelproducts,visithttp://www.intel.com/performance/resources/limits.htm or call (U.S.) 1-800-628-8686 or 1-916-356-3104.
Intel® Virtualization Technology requires a computer system with an enabled Intel®processor,BIOS,virtualmachinemonitor(VMM)and,forsomeuses,certainplatformsoftwareenabledforit.Functionality,performanceorotherbenefitswillvarydependingonhardwareandsoftwareconfigurationsandmayrequireaBIOSupdate.Softwareapplicationsmaynotbecompatiblewithalloperatingsystems.Pleasecheckwithyourapplicationvendor.
Thispaperisforinformationalpurposesonly.THISDOCUMENTISPROVIDED“ASIS”WITHNOWARRANTIESWHATSOEVER,INCLUDINGANYWARRANTYOFMERCHANTABILITY,NONINFRINGEMENT,FITNESSFORANYPARTICULARPURPOSE,ORANYWARRANTYOTHERWISEARISINGOUTOFANYPROPOSAL,SPECIFICATIONORSAMPLE. Inteldisclaimsallliability,includingliabilityforinfringementofanyproprietaryrights,relatingtouseofinformationinthisspecification.Nolicense,expressorimplied,byestoppelorotherwise,to any intellectual property rights is granted herein.
Copyright©2008IntelCorporation.Allrightsreserved.Intel,theIntellogo,Intel.Leapahead.andIntel.Leapahead.logo,andXeonaretrademarksofIntelCorporationintheU.S. and other countries.
*Othernamesandbrandsmaybeclaimedasthepropertyofothers.
PrintedinUSA 0408/IA/OCG/XX/PDF PleaseRecycle 319572-001US
Author
Sudip Chahal is a compute and storage architect with Intel Information Technology.
AcronymsTCO Total Cost of Ownership VM Virtual Machine
LAN Local Area Network SAN Storage Area Network
MP multi-processor DP dual-processor
CSU Consolidated Stack Unit LUN Logical Unit Number
USD United States dollars POC Proof of Concept
DHSI Dedicated High-Speed SLA Service Level Interconnects Agreement
SCSI Small Computer System Interface