Embed Size (px)
Citation preview

1 | P a g e
WHITE PAPER
An Account of Health Disparities in Minnesota’s Medicaid Population:
Which Populations Within the Medicaid Program Experience the Greatest Health Disparities and Poorest Health Outcomes?
PHASE I REPORT, PREPARED UNDER THE DIRECTION OF THE HEALTH CARE ADMINISTRATION, MINNESOTA DEPARTMENT OF HUMAN SERVICES (DHS)
AUGUST 1, 2017
RELEASED SUMMER 2018
RELEASED SUMMER 2018 WITH DHS LEGISLATIVE REPORT:
MINNESOTA MEDICAID ENROLLEES WITH SOCIAL DETERMINANTS OF HEALTH: HOW CAN WE REDUCE THEIR HEALTH DISPARITIES?

2 | P a g e
Table of Contents Acknowledgements ....................................................................................................................................... 3
Project Overview ........................................................................................................................................... 4
Analytical Framework ................................................................................................................................... 6
Analytical Results ........................................................................................................................................ 10
Statistical Analyses and Tests of Validity and Reliability ............................................................................ 16
Selection of the Populations ....................................................................................................................... 17
Key Methodological and Project Insights.................................................................................................... 19
Conclusion ................................................................................................................................................... 20
Appendix Section ........................................................................................................................................ 21
Appendix 1. HMA’s Project Summary Report to DHS ............................................................................. 22
Appendix 2. Data ..................................................................................................................................... 23
Appendix 3. List of Files for DHS ............................................................................................................. 28
Appendix 4. Literature Review ................................................................................................................ 31
Appendix 5. Interview Guide .................................................................................................................. 38
Appendix 6. List of Providers Interviewed .............................................................................................. 40
Appendix 7. Univariate Results ............................................................................................................... 42
Appendix 8. Bivariate Results ................................................................................................................. 62
Appendix 9. Regression Results .............................................................................................................. 71

3 | P a g e
Acknowledgements
This project was carried out under the direction of Justine Nelson, PhD of the Minnesota Department of Human Services’ (DHS) Health Care Administration.
The project work was performed by Health Management Associates (HMA), in partnership with the Disability Policy Consortium.
This report reflects a significant analytic undertaking by DHS and its consulting team. The core project team included: the project director, Ellen Breslin, MPP (HMA), and Anissa Lambertino, PhD, (HMA), Dennis Heaphy, MPH, (DPC), and Tony Dreyfus, MCP, (subcontractor to HMA). The team appreciates the assistance of Michelle Janssen (HMA) with this white paper.
The authors of this report also gratefully acknowledge the valuable contribution of the entire team at JEN Associates, Inc., and especially Mr. Daniel Gilden who founded JEN. JEN was hired by HMA to build the data set that HMA used to analyze the data and perform the bivariate and regression analysis shown in this report.
Special thanks to the following: (1) HMA clinical advisors: Dr. Suzanne Mitchell; Dr. Lori Raney; and Dr. Greg Vachon. (2) National experts: David Knutson, former Director of the Center for Delivery, Organization and Markets, the Agency for Healthcare Research and Quality (AHRQ), U.S. Department of Health and Human Services; and, Lisa Iezzoni, MD. MSc, Director, Mongan Institute for Health Policy (MIHP), Massachusetts General Hospital (MGH), Boston, MA. (3) Providers. HMA expanded its research beyond the quantitative data to solicit the perspective of providers on the front line of delivering services to persons covered under the Medicaid program to more fully comprehend the complex relationship between the social determinants of health and healthcare delivery to populations experiencing poor health outcomes and health disparities. (4) Consumers. Consumer interviews were conducted by another project team for DHS for another component of this larger DHS project.
Contact information:
Ellen Breslin, HMA: [email protected]
Anissa Lambertino, HMA: [email protected]
Dennis Heaphy, DPC: [email protected]
Tony Dreyfus: [email protected]
Please contact Ellen Breslin, HMA, to make inquiries about data files.

4 | P a g e
Project Overview
Project Questions
This project was designed around answering two key questions:
• Question 1. Which Medicaid populations have the greatest health disparities? • Question 2. What are the costs to Medicaid of serving these populations?
The Minnesota Legislative Directive
In 2015, the Minnesota Legislature passed Chapter 71, Section 63 of Article 11, entitled the “Health Disparities Payment Enhancement,” which directs the Department of Human Services (DHS) “to develop a methodology to pay a higher payment rate for health care providers and services that takes into consideration the higher cost, complexity, and resources needed to serve patients and populations who experience the greatest health disparities in order to achieve the same health and quality outcomes that are achieved for other patients and populations.”1
In response to this legislation, in 2016, DHS hired Health Management Associates (HMA) to identify Medicaid populations who experience the greatest health disparities and their related costs to the Medicaid program. The Boston office of Health Management Associates (HMA), working in partnership with the Disability Policy Consortium (DPC) and JEN Associates, Inc., all located in Massachusetts, worked together to identify populations with the greatest health disparities at the greatest cost.
The project has concluded.
• HMA has provided DHS with a report to the Minnesota Legislature on the population groups identified with the greatest health disparities and the costs to Medicaid of serving these populations.
• Other project deliverables include the programming code, the dataset, all excel files including statistical analyses and findings, and this white paper report. Appendix 2 includes a summary of the data used; Appendix 3 includes a list of all files provided to DHS including the excel files.
• This White Paper presents the methodology and data sources used to identify the target populations with the greatest health disparities and costs, the data elements and analytical steps taken to identify the populations, and present the results.
Health People 2000: Health Disparities
Bearing in mind that measuring and understanding health disparities is a complex and evolving science. For purposes of clarity and consistency, the definition of health disparities used in this project was taken from Healthy People 2020.
Health disparity is defined as “a particular type of health difference that is closely linked with social, economic, and/or environmental disadvantage. Health disparities adversely affect groups of people who have systematically experienced greater obstacles to health based on their racial or ethnic group; religion; socioeconomic status; gender; age; mental health; cognitive, sensory, or physical disability;
1 https://www.revisor.mn.gov/laws/?year=2015&type=0&doctype=Chapter&id=71#laws.11.63.0

5 | P a g e
sexual orientation or gender identity; geographic location; or other characteristics historically linked to discrimination or exclusion.” (Source: Healthy People 2020.)
Research Effort
HMA in tandem with DPC and JEN Associates Inc. undertook a comprehensive qualitative and quantitative to identify the populations with the greatest disparities.
Qualitative Component
HMA and its team conducted: (1) a literature review; (2) interviews with Minnesota providers serving Medicaid members; (3) interviews with national experts in risk adjustment; and, (4) an internal peer-review process. The literature review was conducted to help inform and shape the framework for measuring health disparities in the Medicaid population. Several interviews were conducted with a diversity of providers in Minnesota to also support the identification of populations and measures of interest to providers in Minnesota. Consumers, or Medicaid enrollees, were not interviewed as part of this effort.
• Method 1. Literature Review. HMA conducted a literature review to identify analytical, statistical or other technical approaches or methods that have been used to identify populations with health disparities and to prioritize the populations. A long list of search terms was developed including social risk factors, multiple regression, and statistical methods. The literature review produced many relevant documents for this report and can be found in Appendix 4.
• Method 2. Provider Interviews. Using a standardized interview guide developed for this project, HMA conducted interviews to gather information from providers about their experiences in meeting and paying for the unmet needs of Medicaid members experiencing health disparities. Provider interviewees were selected by DHS based on consideration of their role in serving Medicaid members, including Medical Assistance/Minnesota Care (MA/MNCare) enrollees with significant social risk factors, and their geographic location. The interview guide can be found in Appendix 5. The list of providers who participated in this survey can be found in Appendix 6.
• Method 3. National Expert Interviews. HMA also conducted phone interviews with two national experts in risk adjustment to gather their insights into how they would conceptualize, measure, identify and prioritize Medicaid population groups with the greatest disparities and the greatest costs. HMA is grateful for the insights of (1) David Knutson, Director of the Center for Delivery, Organization and Markets, the Agency for Healthcare Research and Quality (AHRQ), U.S. Department of Health and Human Services; and, (2) Lisa Iezzoni, MD. MSc, Director, Mongan Institute for Health Policy (MIHP), Massachusetts General Hospital (MGH), Boston, MA.
• Method 4. Internal Peer-Review Process. In addition to these methods of research, HMA also consulted with an experienced team of consultants with deep experience in Medicaid policy, programs and populations, the social determinants of health, health disparities, payment methodologies, risk adjustment, disability policy, and analytical and statistical methods of research and analysis.
Quantitative Component
The quantitative effort consisted of an intensive data analysis. Several sources of data were used to build an analytic data file that could be used to apply methods of analysis, including statistical methods of analysis to determine the importance or predictive power of key variables. Data sources include

6 | P a g e
Medicaid eligibility and enrollment files, Medicaid claims files, child protection data, and data from the Minnesota Department of Corrections and the United States Census Bureau.
The analytic file for this project was developed by JEN Associates in partnership with HMA. The file contains multiple variables to identify populations with the greatest health disparities includes several pieces of information. The file contains the following types of data on Medicaid enrollees including: Medicaid eligibility data and claims data, income data from the state’s needs-tested programs, children protection involvement, and data from the Minnesota Department of Corrections.
Analytical Framework
To determine which Medicaid populations experienced the greatest health disparities, DHS and its consultants developed a framework for measuring health disparities.
Measures of Health Disparities and Costs
• Health Disparity Measures: Several measures were selected to measure health disparities including: (1) direct measures of health and health outcomes including rates of mortality; and, (2) measures of health care access, use and quality such as potentially preventable emergency department visits, potentially preventable hospital admissions, and HEDIS quality measures. Some measures of health outcomes and health care access, use and quality apply only to very young children, some to all children, and other measures apply only to adults.
• Cost Measures: Based on the data available, two measures of costs were selected including: (1) the cost to Medicaid of providing all services to the Medicaid population under the age of 65; and, (2) the cost to Medicaid of providing services to the Medicaid population under the age of 65 for which ACOs are accountable.
The analysis was limited to children and adults age 0-64 who were enrolled at least one month in a Minnesota Medicaid program in 2014, and who were not enrolled in any other health insurance program such as Medicare. Children were only included in the analysis if at least one parent was also enrolled in 2014. Data limitations drove these exclusions.
See Table 1 for a summary of the measures that were developed by the team and were used to examine both health disparities and costs. See Tables 2, 3, and 4 for more detail on health disparity measures. More specifically, see Table 2 for a summary of the measures of morbidity. See Table 3 for a summary of the measures of health care access and use. See Table 4 for a summary of measures of health care quality.

7 | P a g e
Table 1. Measures of Health Disparity and Costs
Measures of Health Disparity and Costs Used by DHS
to Identify Medicaid Population with the Greatest Health Disparities
Area Description # of Measures
HEALTH DISPARITIES Young
Children < 2 yrs.
All Children
0-17
All Adults 18-64
Total Unique Count
Health Direct measures of health status and health outcomes
Mortality Mortality rate (1 measure) 1 1 1 1
Morbidity Prevalence rates for chronic disease and conditions including measures for physical health and behavioral health (15 measures)
3 6 13 15
Disability Disability based on eligibility status (1 measure) 1 1 1 1
Health care Measures of health care access, utilization, and quality
Potentially preventable emergency department visits and potentially preventable hospital admissions
0 0 2 2
HEDIS measures 0 2 3 4
COSTS
Total expenditures for individuals over the calendar year for all services and for only services for which an Accountable Care Organization is responsible (2 measures)
2 2 2 2
TOTAL FOR ALL MEASURES,
INCLUDING HEALTH, HEALTH CARE AND COSTS 7 12 22 25

8 | P a g e
Table 2. Measures of Morbidity
# MeasureYoung
Children < 2 Children Adults 1 Unhealthy infants 12 Type 2 Diabetes 13 Asthma 1 1 14 HIV/Hepatitis c 15 Hypertension 16 Cardiovascular 17 Chronic Obstructive Pulmonary Disease 18 Injury 1 1 19 Lung/Laryngeal Cancer 110 Substance Use Disorder (SUD) 1 111 Attention Deficit Hyperactivity Disorder (ADHD) 112 Post-Traumatic Stress Disorder (PTSD) 1 113 Depression 1 114 Serious Persistent Mental Il lnes (SPMI) 115 Developmental Disabil ity 1 1
Total 3 7 13
Measures of Morbidity

9 | P a g e
Table 3. Measures of Health Care Access and Use
Table 4. Measures of Health Care Quality
# MeasureYoung
Children < 2 Children Adults
1 Potentially preventable emergency department visits
1
2Potentially preventable hospital admissions, using the Prevention Quality Indicator (PQI) due to acute diagnoses
1
Measures of Health Care Access and Use
# MeasureYoung
Children < 2 Children Adults 1 Annual preventive visit 12 Comprehensive diabetes care - A1c test 13 Well-child visits for all children 14 Annual dental visit for kids and adults 1 1
Measures of Health Care Quality

10 | P a g e
Analytical Results
HMA relied upon univariate, bivariate and multiple regression analysis to answer the study questions.
Results: Univariate
The following tables provide an overview of the key results for children and adults.
More detailed results are provided in Appendix 7: Univariate Results.

11 | P a g e
Table 6. Univariate Results for Children. n = 303,140
The study population for children consisted of 303,140 children including children with a range of social risk factors. Over 80% of the population live in poverty, 51% in deep poverty and 4% of children included in the study population are homeless.
Population Group Description Number% of Medicaid Sample/Study
Population Asian, Immigrant 18,904 6.2%Black, Immigrant 34,705 11.4%Hispanic, Immigrant 13,596 4.5%Native American 15,224 5.0%White, Non Immigrant & Immigrant * 118,641 39.1%Other, Immigrant 9,429 3.1%Asian, Non Immigrant 5,935 2.0%African American 48,746 16.1%Hispanic, Non Immigrant 15,651 5.2%White, Non Immigrant (combined above) * - 0.0%Other, Non Immigrant 22,309 7.4%Substance Use Disorder (15-17 year olds only) 2,041 5.6%ADHD 24,830 8.2%PTSD 5,546 1.8%Depression 11,225 3.7%Developmental Disabil ity 2,738 0.9%Disabil ity 10,243 3.4%Below 50% of the Federal Poverty Level (FPL) 155,131 51.2%50-100% FPL 92,265 30.4%> 100% FPL 41,456 13.7%Missing Income 14,288 4.7%Family Homeless 12,866 4.2%Child Protection Involvement 32,648 10.8%Parental - Chemical Dependency 38,323 12.6%Parental - Mental Il lness 18,557 6.1%Parental - Disabil ity Condition 11,498 3.8%Parental - Marital Status - Not Married 117,159 38.6%Child in Household with 4+ children 76,377 25.2%Parental Language: English 251,468 83.0%Parental Language: Other 51,672 17.0%Parent Immigrant 82,519 27.2%Likely parental incarceration 6,580 2.2%
Race/Immigration Status
Medical and Disability Risk Factors
Income categories
Social Risk Factors
12 | P a g e
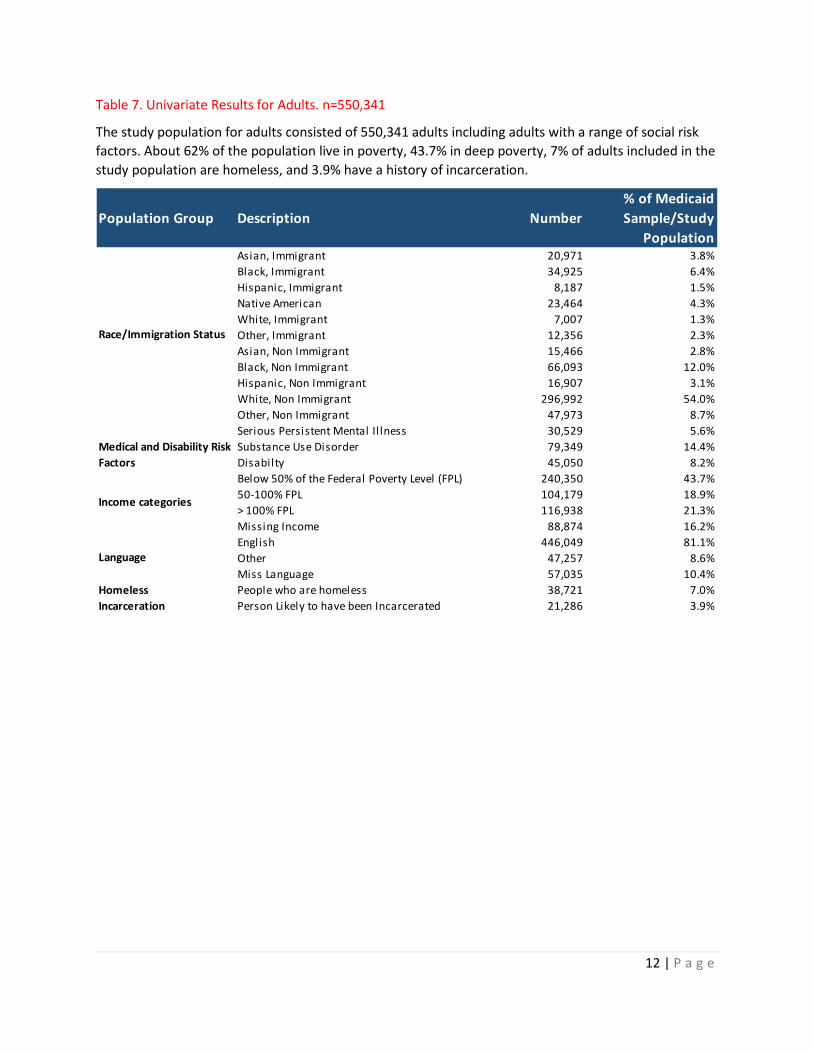
Table 7. Univariate Results for Adults. n=550,341
The study population for adults consisted of 550,341 adults including adults with a range of social risk factors. About 62% of the population live in poverty, 43.7% in deep poverty, 7% of adults included in the study population are homeless, and 3.9% have a history of incarceration.
Population Group Description Number% of Medicaid Sample/Study
Population Asian, Immigrant 20,971 3.8%Black, Immigrant 34,925 6.4%Hispanic, Immigrant 8,187 1.5%Native American 23,464 4.3%White, Immigrant 7,007 1.3%Other, Immigrant 12,356 2.3%Asian, Non Immigrant 15,466 2.8%Black, Non Immigrant 66,093 12.0%Hispanic, Non Immigrant 16,907 3.1%White, Non Immigrant 296,992 54.0%Other, Non Immigrant 47,973 8.7%Serious Persistent Mental Il lness 30,529 5.6%Substance Use Disorder 79,349 14.4%Disabilty 45,050 8.2%Below 50% of the Federal Poverty Level (FPL) 240,350 43.7%50-100% FPL 104,179 18.9%> 100% FPL 116,938 21.3%Missing Income 88,874 16.2%English 446,049 81.1%Other 47,257 8.6%Miss Language 57,035 10.4%
Homeless People who are homeless 38,721 7.0%Incarceration Person Likely to have been Incarcerated 21,286 3.9%
Medical and Disability Risk Factors
Income categories
Language
Race/Immigration Status

13 | P a g e
Results: Bivariate, or Cross Tabulations
Prior to performing the statistical analyses, HMA prepared a plan to create several cross-tabulations of the data to examine measures of health disparities and costs in the Medicaid population for several populations groups. A comprehensive set of results are provided in Appendix 8: Bivariate Results. The same results are presented side by side in the tab called ‘Bivariate Results_Adults’ in the Social Risk spreadsheet.
See Table 8 below for an overview of the nine adult groups for which bivariate or cross-tabulations were created.
Table 8. Cross-Tabulations Created for Nine Adult Groups
Bivariate Plan or Cross-Tabulation Plan for Adults Group Description
1 Adults by male and female 2 Adults with and without serious and persistent mental illness (SPMI) 3 Adults with and without substance use disorder (SUD) 4 Adults by income relative to the Federal Poverty Level (<50% FPL, 50-100% FPL, > 100% FPL) 5 Adults by primary language (English or Other) 6 Adults who are homeless and adults who are not homeless 7 Adults by race and ethnicity and immigration 8 Adults with and without a history of prison incarceration 9 Adults with and without a disability
See Table 9 for an overview of health disparities and costs for both children and adults, based on the cross-tabulations created from the data for CYs 2013 and 2014.

14 | P a g e
Table 9. Overview of Health Disparities and Costs for Very Young Children, Children, and Adults
Very young children (< 2)
All Children < 18 (1)
Adults 18-64 (2)
All (1) + (2)
POPULATION (Sum of All Children + Adults) 36,294 303,140 550,341 853,481
HEALTH DISPARITY MEASURESDirect Measures of Health Status and Outcomes
1 Mortality Rate 0.4% 0.1% 0.78%2 Morbidity Rates
Unhealthy babies 12.2%Type 2 Diabetes 7.0%Asthma Rate 5.2% 11.7% 9.4%HIV/HEPc 1.6%Hypertension 5.1%Cardiovascular 1.4%Chronic Obstructive Pulmonary Disorder (COPD) 8.5%Injury/Violence 3.7% 4.8% 5.6%Lung/Laryngeal Cancer 0.2%Substance Use Disorder 5.6% 14.4%Attention Deficit Hyperactivity Disorder (ADHD) 8.2%Post-Traumatic Stress Disorder (PTSD) 1.8% 5.9%Depression 3.7% 19.2%Serious Persistent Mental Illness 5.6%Developmental Disability 0.9% 1.4%
3 Disability Status 0.4% 3.4% 8.2%
Measures of Health Care Access, Utilization and Quality 1 Potentially-preventable ED visits 1/ 10.5%2 Potentially preventable hospital admissions 2/ 0.60%3 HEDIS measures
Annual preventive visit 33.2%Comprehensive diabetes care - A1c test 92.0%Well-child visits for all children 62.8%Annual dental visit for kids and adults 64.3% 48.4%
COSTS (2014)1 Total expenditures 3/ 5/ 5/ 7,104.19$ 2 ACO Total 4/ 5/ 5/ 4,961.17$
Source: Heal th Management Associates , based upon analys is of Medica id data from the Minnesota Department of Human Services
for Ca lendar Years 2013 and 2014.
Notes :
1 Potentia l ly preventable emergency department vis i ts .
2 Potentia l ly preventable hospi ta l admiss ions , us ing the Prevention Qual i ty Indicator (PQI) due to acute diagnos is .
3 Average cost based on tota l Medica id cla ims pa id for CY 2014.
4 Average cost based on tota l Medica id cla ims pa id for CY 2014 for which the Accountable Care Organization (ACO) i s respons ible.
5 Average costs based on Medica id cla ims were not ca lculated for chi ldren; only log transformed costs are ava i lable in this report.
The Minnesota Medicaid Program Population - All Persons under 65 years of age Analysis of CY 2013 and 2014 data

15 | P a g e
Results: Regression
HMA prepared a plan for performing multiple regression analysis to examine the power of the independent variables to predict the dependent variables or measures of health disparities and costs for Medicaid adults and Medicaid children. A complete list of independent variables, as well as dependent variables, is provided in Appendix 2.
See Table 10 for an overview of the plan for conducting regression analysis. The basic and full regression models are outlined in detail in the excel files provided to DHS. The results of the regression models can be viewed on tab ‘Adult_Health Disparities’ and ‘Kids_Health Disparities’ and ‘Young Children_Health Disparities’ of the spreadsheet.
Table 10. Overview of the Regression Plan
Regression Plan
1 Population stratification Separate regressions were run for children and adults, using the independent and dependent variables provided in Appendix 2.
2 Regression models
Two types of regression models were developed, which involved a selection of independent and dependent variables: the basic model and the full model. The basic model includes a minimum number of independent variables for children and for adults. The full model includes all variables included in the basic model plus all other independent variables.
Basic model The basic model included only age, gender, and race/immigration status. These regressions were run for each measure of health disparity and cost and for children and adults separately.
Full model
The full model included all base model variables including age, gender, and race/immigration status and all other independent variables – including all medical and social risk factors – listed in Appendix 2. These regressions were run for each measure of health disparity and cost and for children and adults separately.

16 | P a g e
Statistical Analyses and Tests of Validity and Reliability
Several statistical analyses – including univariate, bivariate, and regression – were conducted to examine health disparities and costs in the Medicaid population. To support the validity and reliability of these analyses, several tests were conducted. See Table 11 for a summary of these tests.
Table 11. Overview of the Statistical Analyses and Tests of Validity and Reliability
# Type Description
1 Covariate -imputation
Purpose: Covariate imputation was used to replace missing data.
• Covariate imputation was performed for the 1.1% of Medicaid participants that were missing census data on the characteristics of people living in their census tract.
• For this variable, we imputed median values obtained from each covariate, as recorded as follows: census_edperc_im median= 47.6, census_nonusperc_im median=3.3, census_nonengperc_im median=10.6, census_hisplperc_im median=3.9, and census_nonwhiteperc_im median=17.6.
2 Statistical analyses
Purpose: Statistical analyses were performed to analyze the data. Univariate, bivariate, and regression analyses were conducted.
• Statistical analyses were performed with Stata/IC® 14.2 (StataCorp LP, College Station, Texas).
• Natural log transformations of cost variables were used to approximate a normal distribution, with geometric means presented for descriptive purposes. Differences in measures of health status and outcomes, health care access, utilization and quality, and costs for selected demographics and social and medical risk factors were examined.
• Crosstab percentages were used for dichotomous variables. • Multiple linear regression or multiple logistic regression modeling was used to
predict outcomes, as appropriate. Results were considered significant at p<0.05.
3 Model diagnostics
Purpose: to determine if multicollinearity occurred between two or more independent variables in the models.
• We evaluated the variance inflation factor (VIF) using the command estat vif in multiple linear regression models. We excluded variables with a VIF of 10 or greater from all final models.
• For adults, these variables were excluded: adults: census_nonengperc_im, VIF=12.6.
• For children, these variables were excluded: census_nonengperc_im, VIF=13.3, and parent_immig, VIF=10.9.
• For very young children, these variables were excluded: census_nonengperc_im, VIF=13.4, and parent_immig, VIF=13.4).
4 Overall model fit
Purpose: Tests of the overall fit of the model was conducted.
• The table in Appendix 9 provides the R-squared results for the cost regression models for adults, children, and very young children.
5 Validity and reliability
Purpose: Validity and reliability tests were conducted.

17 | P a g e
# Type Description
• The present investigation has several limitations. We adjusted all models for age, gender, and geographical location with and without additional adjustment for length of eligibility where appropriate, but there may be other important potential confounders for which we have not controlled.
• In general, predictive models tend to be more reliable when some physiological (or other theoretical) rationale can be applied. For example, because the time to delivery differs between multiples and singles, multiple births were accounted for in infant subgroup models and may have created a distorted picture of the relationship.
• Finally, the findings might be due to chance, as multiple comparisons were made in the statistical analysis. We did not adjust for multiple comparisons. That said, the purpose of these exploratory analyses was to inform and guide future research that could be subject to further rigorous testing.
• Despite the limitations, our investigation has several strengths, including a large sample of the MN Medicaid population and multiple risk factors and potential confounders measured. Our investigation adds to literature and increases the confidence that associations we have reported are not the product of chance due to some similar trends and consistency with previous investigations. To our knowledge, only one other investigation, which has been documented and shared publicly, has evaluated the association of SDOH on cost in Medicaid beneficiaries.
Selection of the Populations
The consultant’s project summary report to the Minnesota Department of Human Services presents a summary of the populations identified with the worst health outcomes by age group for very young children, all children (including the very young), and for all adults. The extensive list of dependent and independent variables made identifying specific populations with the worst health disparities challenging. Some of the social risk factors, however, predicted a much larger number of poor health outcomes than others. For this project, these populations were chosen as the target populations that Minnesota will focus on in the next stage of this project.
See Table 12 for a summary of the populations that were selected. The excel files provided to DHS include the regression results for each of these populations.

18 | P a g e
Table 12. Populations Identified with the Greatest Health Disparities
# Target Population
Very Young Children
1 Very young children and child protection involvement
2 Very young children and deep poverty
3 Very young children and parents with a Substance Use Disorder and/or serious and persistent mental illness
4 Very young children and a Native American heritage or being a non-immigrant African American Children
1 Children and child protection involvement
2 Children and deep poverty
3 Children and parents with a Substance Use Disorder and/or serious and persistent mental illness
4 Children and homelessness
5 Children and parental prison incarceration
6 Children and a Native American or Hispanic heritage
Adults
1 Adults living in deep poverty
2 Adults with Substance Use Disorder
3 Adults with Serious and Persistent Mental Illness
4 Adults experiencing homelessness
5 Adult who were previously incarcerated
6 Adults who are Native American

19 | P a g e
Key Methodological and Project Insights
Nearly all analytical projects require some measure of compromise. The project budget for this project was very tight in relationship to the scope of work, which included a literature review, interviews with consumers, the development of a framework, the development of a dataset, the specification of independent and dependent variables, the preparation of an analytical plan, the analysis itself, the interpretation of the results, and production of a legislative report and white paper. Future analyses might expand upon this foundational work. Additionally, there were several other key insights gathered over the course of this year-long project.
A summary of these key methodological and project insights is presented in Table 13.
Table 13. Key Methodological and Project Insights
# Issue Key Insights 1 Define children
differently Remove infants from the analysis of children to improve the statistical analyses and interpretation of the results.
2 Examine geography
Examine the importance of geography on health disparities and costs. Examine the difference between rural and urban members to better understand the influence of geography on outcome measures.
3 Conduct bivariate analyses
Conduct bivariate analyses of very young children and children to develop a baseline understanding of the actual health disparities for these two population groups. This was done for adults but not for these two groups of children, due to budget constraints.
4 Interview consumers
Interview consumers to inform the methodology used to analyze health disparities. Very helpful interviews were conducted with providers to inform the analyses.
5 Develop single measures of morbidity
Develop a single measure of morbidity. Several measures of morbidity were examined, and we found differences across population groups in health disparities. This will allow Minnesota DHS to target interventions to address certain problems identified, but it was difficult to know the overall risk for a particular population. A single measure of morbidity would provide a way for Minnesota to summarize which population groups demonstrated a heavier burden from a relative resource perspective.
6 Perform the regressions methodologically
Perform the regression analyses by evaluating one key SDOH variable at a time. The regression analysis was performed by including all variables in the model at the same time. This was preferred by DHS due to budget constraints.
• There are generally two goals of mathematical modeling. One is to obtain a “valid” estimate of an independent-dependent variable relationship and the other is to obtain a “good” predictive model (our method).
• To obtain a valid measure of effect, the roles of variables – such as confounders and effect modifiers – must be given special attention.
• Some of the associations with homelessness were generally not statistically significant. In addition, there was evidence of effect modification (not shown), with substance use disorder. Perhaps this reflected variation in participant selection. In future studies, it may be important to include potential effect modifiers when evaluating associations of SDOH with health, quality, and cost outcomes.
• When the goal is the prediction, it may be more appropriate to use computer algorithms, such as backward elimination or all possible regressions which are built into computer packages for different models.

20 | P a g e
# Issue Key Insights • A more interactive process might also have been preferred, in which we
would have run some initial regressions, discussed results and then settled on additional regressions, perhaps cycling a few times. Instead of running “all possible” regressions, a process of several steps of regression, discussion, and new regressions might have got us to a good result of a model with an intermediate number of variables that also has good face validity for others.
8 Examine persons with disabilities
Conduct a more detailed examination of persons with disabilities. The findings demonstrate that persons with disabilities have the worst health outcomes including the highest rates of mortality.
9 Review results with stakeholders
Present the results to stakeholders to see if they would expand the measures that we examined.
Conclusion
HMA, and its partners from the Disability Policy Consortium and JEN Associates, have appreciated the opportunity to work with DHS to examine health disparities and costs for the Medicaid population.
We hope that this work is helpful to DHS to improve health outcomes for all Medicaid populations in Minnesota.
Finally, we believe that this work is groundbreaking in the Medicaid arena and will help to inform and shape how other states examine health disparities.

21 | P a g e
Appendix Section

22 | P a g e
Appendix 1. HMA’s Project Summary Report to DHS
HMA prepared a project summary report for DHS to include in its report to the Minnesota State Legislature.
HMA’s project summary report includes an identification of the populations with the worst health outcomes for the Medicaid population.
See link to the first related report prepared by DHS: https://www.leg.state.mn.us/lrl/mndocs/mandates
Summer 2018 Update:
DHS will post another report to the Legislature with links to HMA’s summary report and this White Paper.
23 | P a g e
Appendix 2. Data
A large analytic file was created and analyzed for this project with data on the Medicaid population under the age of 65 whose only health insurance was Medicaid.
The data files included many variables to describe the Medicaid population and to measure their health disparities and costs.
Please contact Ellen Breslin at HMA to make inquiries about these files.

24 | P a g e
Line # Variable Type Variable
Demographic/Risk Factors
1 Independent ageall1 Age
2 Independent ageall1 Age
3 Independent ageall1 Age
4 Independent ageall1 Age
5 Independent ageall1 Age
6 Independent ageall1 Age
7 Independent gen Gender
8 Independent gen Gender
9 Independent raceimmstatusd1 Race, Immigrant
10 Independent raceimmstatusd2 Race, Immigrant
11 Independent raceimmstatusd3 Race, Immigrant
12 Independent raceimmstatusd4 Race, Immigrant
13 Independent raceimmstatusd5 Race, Immigrant
14 Independent raceimmstatusd6 Race, Immigrant
15 Independent raceimmstatusd7 Race, Immigrant
16 Independent raceimmstatusd8 Race, Immigrant
17 Independent raceimmstatusd9 Race, Immigrant
18 Independent raceimmstatusd10 Race, Immigrant
19 Independent raceimmstatusd11 Race, Immigrant
20 Independent eliglen Eligibility
21 Independent eliglen Eligibility
22 Independent eliglen2 Eligibility
23 Independent eliglen2 Eligibility
24 Independent eliglen2 Eligibility
25 Independent eliglen2 Eligibility
26 Independent geor1d1 Geography
27 Independent geor1d2 Geography
28 Independent geor1d3 Geography
29 Independent geor1d4 Geography
30 Independent geor1d5 Geography
31 Independent geor1d6 no missing data
32 Independent ihs Provider

25 | P a g e
33 Independent fqhc Provider
34 Independent rhs Provider
35 Independent adg1 Diagnostic Group
36 Independent adg2 Diagnostic Group
37 Independent adg3 Diagnostic Group
38 Independent adg4 Diagnostic Group
39 Independent adg5 Diagnostic Group
40 Independent adg6 Diagnostic Group
41 Independent adg7 Diagnostic Group
42 Independent adg8 Diagnostic Group
43 Independent adg9 Diagnostic Group
44 Independent adg10 Diagnostic Group
45 Independent adg11 Diagnostic Group
46 Independent adg12 Diagnostic Group
47 Independent adg13 Diagnostic Group
48 Independent adg14 Diagnostic Group
49 Independent adg16 Diagnostic Group
50 Independent adg17 Diagnostic Group
51 Independent adg18 Diagnostic Group
52 Independent adg20 Diagnostic Group
53 Independent adg21 Diagnostic Group
54 Independent adg22 Diagnostic Group
55 Independent adg23 Diagnostic Group
56 Independent adg24 Diagnostic Group
57 Independent adg25 Diagnostic Group
58 Independent adg26 Diagnostic Group
59 Independent adg27 Diagnostic Group
60 Independent adg28 Diagnostic Group
61 Independent adg29 Diagnostic Group
62 Independent adg30 Diagnostic Group
63 Independent adg31 Diagnostic Group
64 Independent adg32 Diagnostic Group
65 Independent adg33 Diagnostic Group
66 Independent adg34 Diagnostic Group

26 | P a g e
67 Independent part_mental_ill2 Serious and Persistent Mental Illness
68 Independent sud_num Substance Use Disorder
69 Independent mndiagdd Developmental Disability
70 Independent ds Disability
71 Independent famincome3d1 Income
72 Independent famincome3d2 Income
73 Independent famincome3d3 Income
74 Independent famincome3d4 Income
75 Independent census_povperc Poverty Level of the Census Tract (% of people who live in the census tract < FPL)
76 Independent census_edperc_im Percent of census tract residents who have a high school diploma/GED or less
77 Independent census_nonusperc_im Percentage of residents of census tract who are not US citizens
78 Independent census_nonengperc_im Percentage of residents of census tract who speak a language other than English
79 Independent census_hisplperc_im Percentage of residents of census tract who are Hispanic/Latino
80 Independent census_nonwhiteperc_im Percentage of residents of census tract who are anything other than "White alone"
81 Independent homeless Family Homelessness
82 Independent eduleveldI1 No high school diploma
83 Independent eduleveldI2 High school
84 Independent eduleveldI3 >High school & <College
85 Independent eduleveldI4 College, College+
86 Independent eduleveldI5 Missing
87 Independent langd1 English
88 Independent langd2 Other
89 Independent langd3 Missing
90 Independent probmatch_doc Likely to have been incarcerated, per DOC
91 Independent CP1 Child protection involvement (CPI)
92 Independent parent_chem_dep Parental chemical dependency
93 Independent parent_ment_ill2 Parental mental illness
94 Independent parent_disabled Parental disability/medical condition

27 | P a g e
95 Independent parent_married Parent married
96 Independent fourkidsII Child lives in household with four or more children
97 Independent parent_other_lang Parent speaks a language other than English
98 Independent parent_other_lang Parent speaks a language other than English
99 Independent parent_immig Parent Immigrated
100 Independent probmatch_doc_par Likely Parental Incareration
101 Independent multiple Multiple Birth
102 Dependent mort Health Outcome: Mortality
103 Dependent nurserylevelII Health Outcome: Morbidity
104 Dependent injury Health Outcome: Morbidity
105 Dependent type2 Health Outcome: Morbidity
106 Dependent asthma Health Outcome: Morbidity
107 Dependent hivhepc Health Outcome: Morbidity
108 Dependent hypert Health Outcome: Morbidity
109 Dependent cardio Health Outcome: Morbidity
110 Dependent copd Health Outcome: Morbidity
111 Dependent lunglar Health Outcome: Morbidity
112 Dependent sud Health Outcome: Morbidity
113 Dependent adhd Health Outcome: Morbidity
114 Dependent PTSD Health Outcome: Morbidity
115 Dependent Depress Health Outcome: Morbidity
116 Dependent SMI Health Outcome: Morbidity
117 Dependent HCuseEDII Health care access/use/quality
118 Dependent HCUsePPA
Health care access/use/quality
119 Dependent Placeholder: ALOS Health care access/use/quality
120 Dependent HWellA Health care access/use/quality
121 Dependent HDiab Health care access/use/quality
122 Dependent HWellC Health care access/use/quality
123 Dependent ADV Health care access/use/quality
124 Dependent LnTotal_Cost Health care cost (e to the x), avg. cost
125 Dependent LNIncluded_total_cost Health care cost (e to the x), avg. cost

28 | P a g e
Appendix 3. List of Files for DHS
HMA prepared several large excel files containing the work and findings of this project.
The files contents are on the following tables.
In addition, HMA transmitted the programming code and the dataset to DHS that were used to examine health disparities and costs for the Medicaid population.
Please contact Ellen Breslin at HMA to make inquiries about these excel files.

29 | P a g e
File Name MN DHS_Plan_July 10 2017
1 Regression Plan2 Medicaid Study Sample Population 3 Medicaid Pop_Short 4 Medicaid Pop_Leg Rpt5 All6 Children Population (formatted for print) 7 Adult Population (formatted for print) 8 All Measures (formatted for print) 9 MN x-waik for 5 regions
File Name MN DHS_Logs & Regressions July 10 2017
Tab Description1 Statistics and definitions 2 Log for young children under 2 (including newborns) 3 Infant regressions with 4 race/immigration categories for all health disparity measures4 Infant regressions with 4 race/immigration categories for cost measures 5 Log for children6 Children regressions with 4 race/immigration categories for all health disparity measures7 Children regressions with 4 race/immigration categories for cost measures 8 Log for adults 9 Adult regressions with summary p values10 Adult regressions with all race/immigration categories for measures11 Adult regressions with all race/immigration categories for costs12 Adult regressions with 4 race/immigration categories for all health disparity measures

30 | P a g e
File Name MN DHS_Final Project Results_July 10 2017
Tab Description1 Data Sources2 Independent variables3 Dependent variables 4 Race & Immigration variables 5 Univariate Results6 Bivariarate Results_Adults7 White Paper Bivariates8 Adult bivariate template9 Regression Results 10 Adult Summary Card (formatted for print)11 Child Summary Card (formatted for print)12 R-squared results (formatted for print)13 Cost Results (formatted for print)14 Deep Poverty tables (formatted for print) 15 Data on the Federal Poverty Limit (FPL) in 2013 and 2014 (formatted for print)

31 | P a g e
Appendix 4. Literature Review
HMA conducted a literature review to inform and shape the development of the analytical framework and analytical plan.

32 | P a g e
Methods Applying AHRQ Quality Indicators to Healthcare Cost and Utilization Project (HCUP) Data for the 2014 National Healthcare Quality and Disparities Report (QDR)
Source Coffey R, Barrett M, Houchens R, Moy E, Andrews R, Moles E, Coenen N. Methods Applying AHRQ Quality Indicators to Healthcare Cost and Utilization Project (HCUP) Data for the 2014 National Healthcare Quality and Disparities Report (QDR). 2015. HCUP Methods Series Report # 2015-02 ONLINE. April 13, 2015. U.S. Agency for Healthcare Research and Quality. http://www.hcup-us.ahrq.gov/reports/methods/methods.jsp.
Summary & Key Points
• Provides an in-depth analysis of the Agency for Healthcare Research and Quality (AHRQ) Quality Indicators (QIs) used in the National Healthcare Quality and Disparities report
• Examines inpatient administrative data to determine costs associates with Quality Indicators
• Includes four categories of Quality Indicators: Prevention QIs, Pediatric QIs, Inpatient QIs, and Patient Safety Indicators
• Provides charts of different quality indicators in each category with QI codes, age range of patient population, and prevalence in a specific population
Commissioned Paper: Healthcare Disparities Measurement
Source Weissman, J.S., Betancourt, J.R., Green, A.R., Meyer, G.S., Tan-McGrory, A, Nudel, J.D., Zeidman, J.A., & Carrillo, J.E. (2011). Commissioned Paper: Healthcare Disparities Measurement. Retrieved from https://www2.massgeneral.org/disparitiessolutions/z_files/Disparities%20Commissioned%20Paper.pdf
Summary & Key Points
• Identifies six different groups of disparities-sensitive measures: (1) practitioner performance measure; (2) consumer surveys that measure the patient experience; (3) hospital, ambulatory care center, home health nursing home performance measures; (4) measures of ambulatory care-sensitive conditions and management; (5) measures associated with cultural competency; and (6) patient-centered measures
• Disparities-sensitive measures are defined in the article as measures “that serve to detect not only differences in quality across institutions or in relation to certain benchmarks, but also differences in quality among populations or social groupings (race/ethnicity/language, etc.)
• Mentions importance of both absolute and relative disparity calculation. Utilizes formula for relative measures of disparity:
• Relative Disparities = (rate of interest-reference point rate) X 100, reference point rate • Recommends excluding socioeconomic status (SES) from disparities risk adjustment
calculations due other disparities effect’ on SES, e.g. race/ethnicity may already be influencing the SES of a person.

33 | P a g e
Health Disparities and Cultural Competency Consensus Standards: Disparities-Sensitive Measure Assessment
Source National Quality Forum. (2012). Health Disparities and Cultural Competency Consensus Standards: Disparities-Sensitive Measure Assessment. Retrieved from http://www.qualityforum.org/projects/Healthcare_Disparities_and_Cultural_Competency.aspx
Summary & Key Points
• To identify disparities-sensitive measures, the National Quality Forum (NQF) highlighted first-tier identification protocol consisting of the prevalence of certain conditions and diseases, the disparities quality gap between different segments of the population, and the impact and severity of the condition.
• The second-tier criteria included communication-sensitive services, care with a high degree of discretion, and social-determinant dependent measures.
• Six categories were used for disparities: (1) practitioner performance measure; (2) consumer surveys that measure the patient experience; (3) hospital, ambulatory care center, home health nursing home performance measures; (4) measures of ambulatory care-sensitive conditions and management; (5) measures associated with cultural competency; and (6) patient-centered measures.
• NQF assigned a score to each disparity based on the Quality Gap Percentage and a quartile system
Using the Peters-Belson Method to Measure Health Care Disparities from Complex Survey Data
Source Graubard BI, Rao SR, Gastwirth JL. Using the Peters-Belson method to measure health care disparities from complex survey data. Stat Med. 2005; 24:2659–2668.10.1002/sim.2135 [PubMed: 16118808]
Summary & Key Points
• Provides a logistic regression model previously used in both wage and race/sex discrimination studies to look at health disparities
• Uses PB Method to evaluate disparities based on cancer screenings in men and women based on race and ethnicity
• Integrates socio-demographic data from larger-scale studies and surveys to evaluate disparities between different groups
Health Disparities: Measuring Health Care Use and Access for Racial/Ethnic Populations
Source Bonito, A.J., Eicheldinger, C.R., & Lenfestey, N.F. (2005). Health Disparities: Measuring Health Care Use and Access for Racial/Ethnic Populations. Retrieved from https://www.cms.gov/Research-Statistics-Data-and-Systems/Statistics-Trends-and-Reports/Reports/downloads/bonito_part2.pdf
Summary & Key Points
• Analyzes Medicare Data for healthcare utilization, preventive services and screenings, disease prevalence, and mortality rates among different ethnic and racial groups compared to the white population
• Identifies barriers to reducing disparities among ethnic and racial groups • Examines 2 million Medicare beneficiaries’ claim data to demonstrate disparity patterns
and provides in-depth summary of where differences exist among population groups

34 | P a g e
Data and Measurement Issues in the Analysis of Health Disparities
Source Bilheimer, L. T., & Klein, R. J. (2010). Data and Measurement Issues in the Analysis of Health Disparities. Health Services Research, 45(5.2), 1489–1507. http://doi.org/10.1111/j.1475-6773.2010.01143.x
Summary & Key Points
• Reveals the limitations and challenges of health disparities research, including sample size of data, variables used to define disparities, self-reported data, and cross-cultural measurement.
• Miscalculations and missing data also significantly limit health disparity research • Offers conclusions based on study of past health disparity research and strategies for
analyzing health disparities and inequities between populations 2014 National Healthcare Quality and Disparities Report (QDR)
Source Agency for Healthcare Research and Quality.
http://www.ahrq.gov/research/findings/nhqrdr/nhqdr14/index.html
Summary & Key Points
• The QDR provides a comprehensive overview of the quality of health care received by the general U.S. population and disparities in care experienced by different racial, ethnic, and socioeconomic groups.
• The report is based on more than 250 measures of quality and disparities covering a broad array of health care services and settings.
CDC Health Disparities and Inequalities Report – United States, 2013
Source Centers for Disease Control and Prevention (CDC) report, Health Disparities and Inequalities, November 22, 2013, supplement vol. 62. no.3
http://www.cdc.gov/mmwr/pdf/other/su6203.pdf
Summary & Key Points
• “The purpose of this supplement is to raise awareness of differences among groups regarding selected health outcomes and health determinants and to prompt actions to reduce disparities.”
A Nation Free of Disparities in Health and Health Care
Source The National Partnership for Action to End Health Disparities’ 2011 National stakeholder strategy for achieving health equity, and the related HHS Action Plan to Reduce Racial and Ethnic Health Disparities; A Nation Free of Disparities in Health and Health Care.
http://minorityhealth.hhs.gov/npa/files/plans/hhs/hhs_plan_complete.pdf
Summary & Key Points
• First-ever HHS Disparities Action Plan and the NPA Stakeholder Strategy can be used together to coordinate action that will effectively address racial and ethnic health disparities across the country.
• HHS Disparities Action Plan builds on national health disparities’ goals and objectives recently unveiled in Healthy People 2020, and leverages key provisions of the Affordable Care Act and other cutting-edge HHS initiatives.

35 | P a g e
Closing the Gap in A Generation
Source The World Health Organization 2008 report, Closing the gap in a generation: Health equity through action on the social determinants of health.
http://www.thelancet.com/journals/lancet/article/PIIS0140-6736(08)61690-6/abstract
Summary & Key Points
• The Commission on Social Determinants of Health, created to marshal the evidence on what can be done to promote health equity and to foster a global movement to achieve it, is a global collaboration of policy makers, researchers, and civil society, led by commissioners with a unique blend of political, academic, and advocacy experience.
• The focus of attention is on countries at all levels of income and development. • The commission launched its final report on August 28, 2008. • This paper summarizes the key findings and recommendations; the full list is in the final
report. Confronting Racial and Ethnic Disparities in Health Care
Source The Institute of Medicine’s 2002 report, Unequal Treatment: Confronting Racial and Ethnic Disparities in Health Care; http://www.nap.edu/read/12875/chapter/1
Summary & Key Points
• The report finds that: “Racial and ethnic minorities tend to receive a lower quality of health care than non-minorities,” even when access-related factors such as income and health insurance is controlled.
Advancing Health Equity in Minnesota
Source Minnesota Department of Health, Advancing Health Equity in Minnesota, 2014
http://www.health.state.mn.us/divs/chs/healthequity/ahe_leg_report_020414.pdf
Summary & Key Points
The key report findings:
• These inequities affect many populations in Minnesota: • African American and American Indian babies die in the first year of life at twice the rate of
white babies. • While infant mortality rates for all groups have declined, the disparity in rates has existed
for over 20 years. • American Indian, Hispanic/Latino, and African American youth have the highest rates of
obesity. • Intimate partner violence affects 11 to 24 percent of high school seniors, with the highest
rates among American Indian, African American and Hispanic/Latino students. • African American and Hispanic/Latino women in Minnesota are more likely to be diagnosed
with later-stage breast cancer. • Gay, lesbian and bisexual university students are more likely than their heterosexual peers
to have struggles with their mental health. • Persons with serious and persistent mental illness die, on average, 25 years earlier than the
general public. • These health disparities persist and are neither random nor unpredictable. The groups that
experience the greatest disparities in health outcomes also have experienced the greatest inequities in the social and economic conditions that are such strong predictors of health:

36 | P a g e
Unequal Distribution of Health in Twin Cities
Source The unequal distribution of health in the Twin Cities, Blue Cross and Blue Shield of Minnesota Foundation, October 2010. https://www.bcbsmnfoundation.org/system/asset/resource/pdf_file/57/F9790_web.pdf
Summary & Key Points
• People of color fare worse in our region than do whites based on a variety of health measures, including birth weights, obesity, diabetes, and morality.
Accounting for Social Risk Factors in Medicare Payment
Source Accounting for Social Risk Factors in Medicare Payment
Copyright 2016 by the National Academy of Sciences.
http://www.nap.edu/catalog/21858/accounting-for-social-risk-factors-in-medicare-payment-identifying-social
Summary & Key Points
• Recent health care payment reforms aim to improve the alignment of Medicare payment strategies with goals to improve the quality of care provided, patient experiences with health care, and health outcomes, while also controlling costs. These efforts move Medicare away from the volume-based payment of traditional fee-for-service models and toward value-based purchasing, in which cost control is an explicit goal in addition to clinical and quality goals. Specific payment strategies include pay-for-performance and other quality incentive programs that tie financial rewards and sanctions to the quality and efficiency of care provided and accountable care organizations in which health care providers are held accountable for both the quality and cost of the care they deliver.
NonTraditional Variables in Healthcare Risk Adjustment
Source Nontraditional Variables in Healthcare Risk Adjustment, Prepared for the Society of Actuaries, 2013.
https://www.soa.org/Research/Research-Projects/health/research-2013-nontrad-var-health-risk.aspx
Summary & Key Points
• The results of this research demonstrate that it is important to adjust the traditional risk adjustment model in order to recognize nontraditional variables.
• The report develops a new measure (Loss Ratio Advantage or LRA) to help quantify the potential of a nontraditional variable to affect a risk adjustment program. With the help of this measure, the report compares the importance of over thirty Nontraditional Variables in Risk Adjustment.
Counties Addressing Health Disparities and Health Inequity
Los Angeles County (CA):
http://publichealth.lacounty.gov/epi/docs/sociald_final_web.pdf
King County (WA):
http://www.kingcounty.gov/elected/executive/equity-social-justice.aspx
Alameda County (CA):
http://www.acphd.org/building-blocks.aspx

37 | P a g e
States Addressing Health Disparities and Health Inequity
Massachusetts:
http://www.mass.gov/eohhs/gov/commissions-and-initiatives/healthcare-reform/masshealth-innovations/1115-waiver-proposal-information.html
Connecticut:
http://www.ct.gov/dph/lib/dph/ohca/utilizationreport/utilizationreport2013.pdf
Virginia:
http://www.vdh.virginia.gov/OMHHE/2012report.htm
New Hampshire:
http://www.dhhs.nh.gov/omh/documents/disparities.pdf
Michigan:
http://www.michigan.gov/documents/mdch/All_Plan_Health_Equity_Year_3_report_FINAL_488569_7.pdf

38 | P a g e
Appendix 5. Interview Guide
HMA in partnership with DPC developed a guide to use to interview Minnesota providers about the key health disparities noted in the Medicaid population.

39 | P a g e
Table 5.1. Interview Guide
1. What are the three, primary unmet medical needs of the people whom you serve that lead to health disparities?
2. What are the three, primary unmet nonmedical needs of the people you serve that lead to health disparities?
3. Are there subpopulations of patients that seem to have a large degree of unmet needs?
4. What steps do you take to mitigate these unmet needs to reduce health disparities?
5. Are there subpopulations of patients that seem to be most costly for your organization to serve, given their need for non-reimbursed services?
6. How do you budget for these expenses and how are they paid for?
7. If you had funding to provide services to reduce the level of unmet needs among the people whom you serve in three areas, what would those costs be?
8. Of the populations that you serve, which, according to the data you collect experience the greatest unmet needs and disparities?
9. What best practices have you developed to address unmet needs and reduce disparities in health outcomes that have not required more monetary resources?
10. DHS is looking for patient-level data on how much health care providers spend on unreimbursed patient care. Does your organization have patient-level cost data or a proxy for cost data that DHS might be able to use?

40 | P a g e
Appendix 6. List of Providers Interviewed
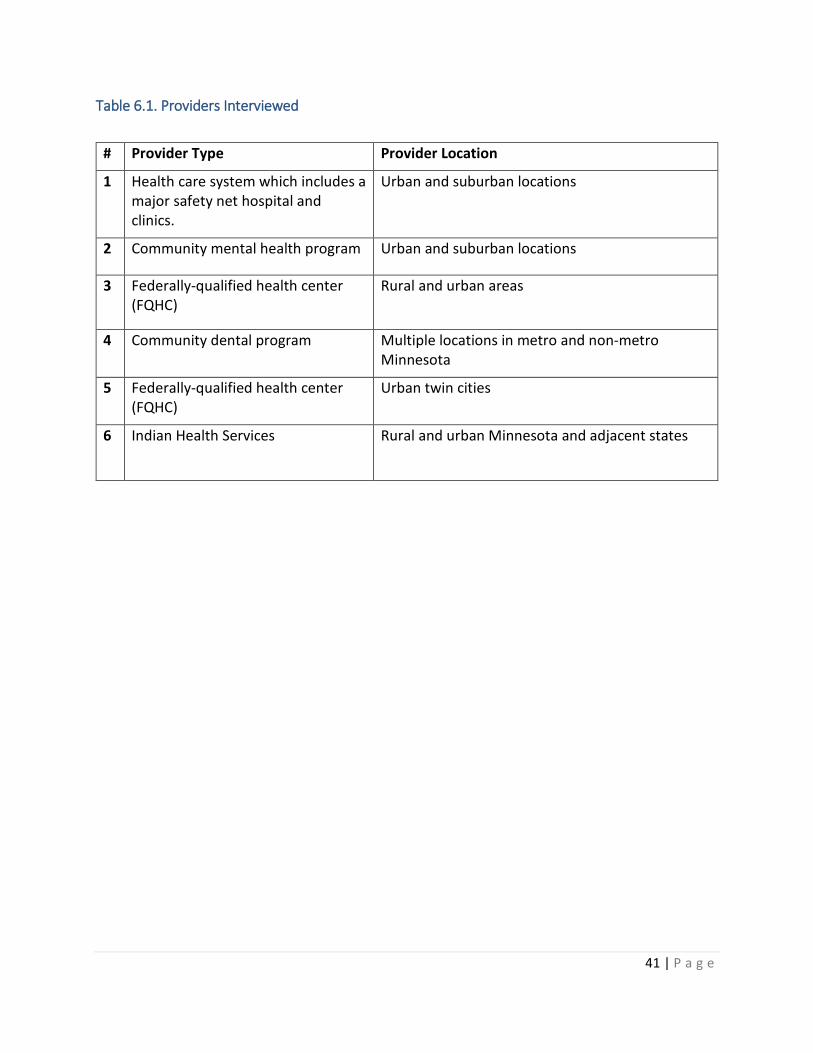
HMA and DPC interviewed Minnesota providers to inform our identification of the populations and the costs to providers.
41 | P a g e
Table 6.1. Providers Interviewed
# Provider Type Provider Location
1 Health care system which includes a major safety net hospital and clinics.
Urban and suburban locations
2 Community mental health program Urban and suburban locations
3 Federally-qualified health center (FQHC)
Rural and urban areas
4 Community dental program Multiple locations in metro and non-metro Minnesota
5 Federally-qualified health center (FQHC)
Urban twin cities
6 Indian Health Services Rural and urban Minnesota and adjacent states

42 | P a g e
Appendix 7. Univariate Results
43 | P a g e
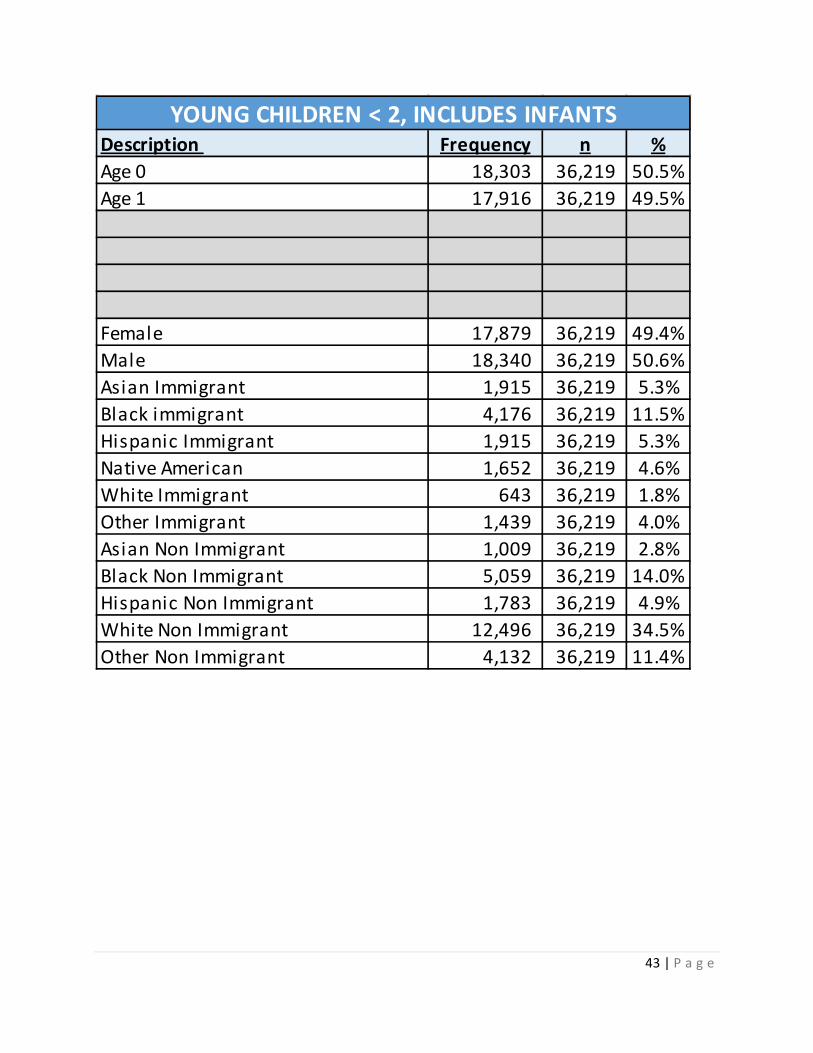
Description Frequency n %Age 0 18,303 36,219 50.5%Age 1 17,916 36,219 49.5%
Female 17,879 36,219 49.4%Male 18,340 36,219 50.6%Asian Immigrant 1,915 36,219 5.3%Black immigrant 4,176 36,219 11.5%Hispanic Immigrant 1,915 36,219 5.3%Native American 1,652 36,219 4.6%White Immigrant 643 36,219 1.8%Other Immigrant 1,439 36,219 4.0%Asian Non Immigrant 1,009 36,219 2.8%Black Non Immigrant 5,059 36,219 14.0%Hispanic Non Immigrant 1,783 36,219 4.9%White Non Immigrant 12,496 36,219 34.5%Other Non Immigrant 4,132 36,219 11.4%
YOUNG CHILDREN < 2, INCLUDES INFANTS
44 | P a g e
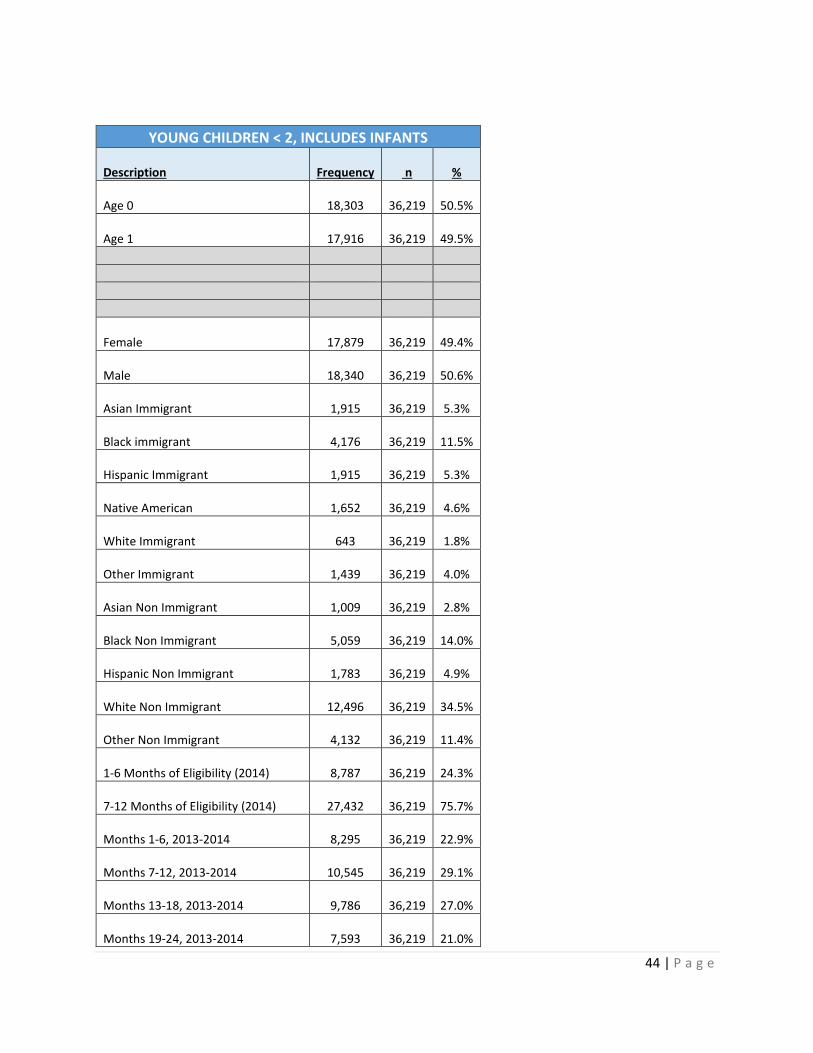
YOUNG CHILDREN < 2, INCLUDES INFANTS
Description
Frequency n %
Age 0
18,303
36,219 50.5%
Age 1
17,916
36,219 49.5%
Female
17,879
36,219 49.4%
Male
18,340
36,219 50.6%
Asian Immigrant
1,915
36,219 5.3%
Black immigrant
4,176
36,219 11.5%
Hispanic Immigrant
1,915
36,219 5.3%
Native American
1,652
36,219 4.6%
White Immigrant
643
36,219 1.8%
Other Immigrant
1,439
36,219 4.0%
Asian Non Immigrant
1,009
36,219 2.8%
Black Non Immigrant
5,059
36,219 14.0%
Hispanic Non Immigrant
1,783
36,219 4.9%
White Non Immigrant
12,496
36,219 34.5%
Other Non Immigrant
4,132
36,219 11.4%
1-6 Months of Eligibility (2014)
8,787
36,219 24.3%
7-12 Months of Eligibility (2014)
27,432
36,219 75.7%
Months 1-6, 2013-2014
8,295
36,219 22.9%
Months 7-12, 2013-2014
10,545
36,219 29.1%
Months 13-18, 2013-2014
9,786
36,219 27.0%
Months 19-24, 2013-2014
7,593
36,219 21.0%

45 | P a g e
East Metro
6,013
36,219 16.6%
West Metro
8,802
36,219 24.3%
North
8,331
36,219 23.0%
South
7,620
36,219 21.0%
Metro
5,453
36,219 15.1%
Indian Health Services
776
36,219 2.1%
FQHC
2,420
36,219 6.7%
Regional Health System
1,834
36,219 5.1%
ADG 1 See Log
36,219 52.4%
ADG 2 See Log
36,219 0.0%
ADG 3 See Log
36,219 0.0%
ADG 4 See Log
36,219 0.0%
ADG 5 See Log
36,219 0.0%
ADG 6 See Log
36,219 0.0%
ADG 7 See Log
36,219 0.0%
ADG 8 See Log
36,219 0.0%
ADG 9 See Log
36,219 0.0%
ADG 10 See Log
36,219 0.0%
ADG 11 See Log
36,219 0.0%
ADG 12 See Log
36,219 0.0%
ADG 13 See Log
36,219 0.0%
ADG 14 See Log
36,219 0.0%
ADG 16 See Log
36,219 0.0%
ADG 17 See Log
36,219 0.0%
ADG 18 See Log
36,219 0.0%

46 | P a g e
ADG 20 See Log
36,219 0.0%
ADG 21 See Log
36,219 0.0%
ADG 22 See Log
36,219 0.0%
ADG 23 See Log
36,219 0.0%
ADG 24 See Log
36,219 0.0%
ADG 25 See Log
36,219 0.0%
ADG 26 See Log
36,219 0.0%
ADG 27 See Log
36,219 0.0%
ADG 28 See Log
36,219 0.0%
ADG 29 See Log
36,219 0.0%
ADG 30 See Log
36,219 0.0%
ADG 31 See Log
36,219 0.0%
ADG 32 See Log
36,219 0.0%
ADG 33 See Log
36,219 0.0%
ADG 34 See Log
36,219 0.0% n.a. n.a. n.a. n.a.
< 50% FPL
23,040
36,219 63.6%
50-100% FPL
9,816
36,219 27.1%
> 100% FPL
2,430
36,219 6.7%
Missing
933
36,219 2.6%
See Log
See Log
See Log

47 | P a g e
See Log
See Log
See Log
Family Homelessness
2,217
36,219 6.1% n.a. n.a. n.a. n.a. n.a. n.a. n.a. n.a.
n.a.
Child Protection Involvement
3,285
36,219 9.1%
Parental Chem Dependency
4,951
36,219 13.7%
Parent Mental Illness
1,720
36,219 4.7%
Parent disability/medical condition
1,436
36,219 4.0%
Parents Married
12,340
36,219 34.1%
Child in Household with 4+ children
6,097
36,219 16.8%
Parent, Language English
29,948
36,219 82.7%
Parent, Language Other
6,271
36,219 17.3%
Parent Immigrated
10,100
36,219 27.9%
Likely Parental Incareration
865
36,219 2.4%
Multiple Birth
819
36,219 2.3%
Mortality
139
36,219 0.4%
Unhealthy babies
4,131
36,219 11.4%
Injury
1,329
36,219 3.7% n.a.

48 | P a g e
Asthma
1,893
36,219 5.2% n.a. n.a. n.a. n.a. n.a. n.a. n.a. n.a. n.a. n.a.
n.a.
n.a. n.a. n.a. n.a. n.a. n.a.
Total Costs, based on all services $
2,668.52
Total Costs, based on ACO services $
2,510.68 Note: Total costs are log transformed.

49 | P a g e
Description Frequency n %Age 0-3 81,292 303,140 26.8%Age 4-5 38,394 303,140 12.7%Age 6-8 56,795 303,140 18.7%Age 9-12 62,216 303,140 20.5%Age 13-17 64,443 303,140 21.3%
Female 148,125 303,140 48.9%Male 155,015 303,140 51.1%Asian Immigrant 18,904 303,140 6.2%Black Immigrant 34,705 303,140 11.4%Hispanic Immigrant 13,596 303,140 4.5%Native American 15,224 303,140 5.0%White Immigrant & Non Immigrant (combined) 118,641 303,140 39.1%Other Immigrant 9,429 303,140 3.1%Asian Non Immigrant 5,935 303,140 2.0%Black Non Immigrant 48,746 303,140 16.1%Hispanic Non Immigrant 15,651 303,140 5.2%
Other Non Immigrant 22,309 303,140 7.4%
CHILDREN < 18

50 | P a g e
CHILDREN < 18
Description
Frequency n %
Age 0-3
81,292
303,140 26.8%
Age 4-5
38,394
303,140 12.7%
Age 6-8
56,795
303,140 18.7%
Age 9-12
62,216
303,140 20.5%
Age 13-17
64,443
303,140 21.3%
Female
148,125
303,140 48.9%
Male
155,015
303,140 51.1%
Asian Immigrant
18,904
303,140 6.2%
Black Immigrant
34,705
303,140 11.4%
Hispanic Immigrant
13,596
303,140 4.5%
Native American
15,224
303,140 5.0%
White Immigrant & Non Immigrant (combined)
118,641
303,140 39.1%
Other Immigrant
9,429
303,140 3.1%
Asian Non Immigrant
5,935
303,140 2.0%
Black Non Immigrant
48,746
303,140 16.1%
Hispanic Non Immigrant
15,651
303,140 5.2%
Other Non Immigrant
22,309
303,140 7.4%
1-6 Months of Eligibility (2014)
30,176
303,140 10.0%
7-12 Months of Eligibility (2014)
272,964
303,140 90.0%
Months 1-6, 2013-2014
20,161
303,140 6.7%
Months 7-12, 2013-2014
31,909
303,140 10.5%
Months 13-18, 2013-2014
44,708
303,140 14.7%
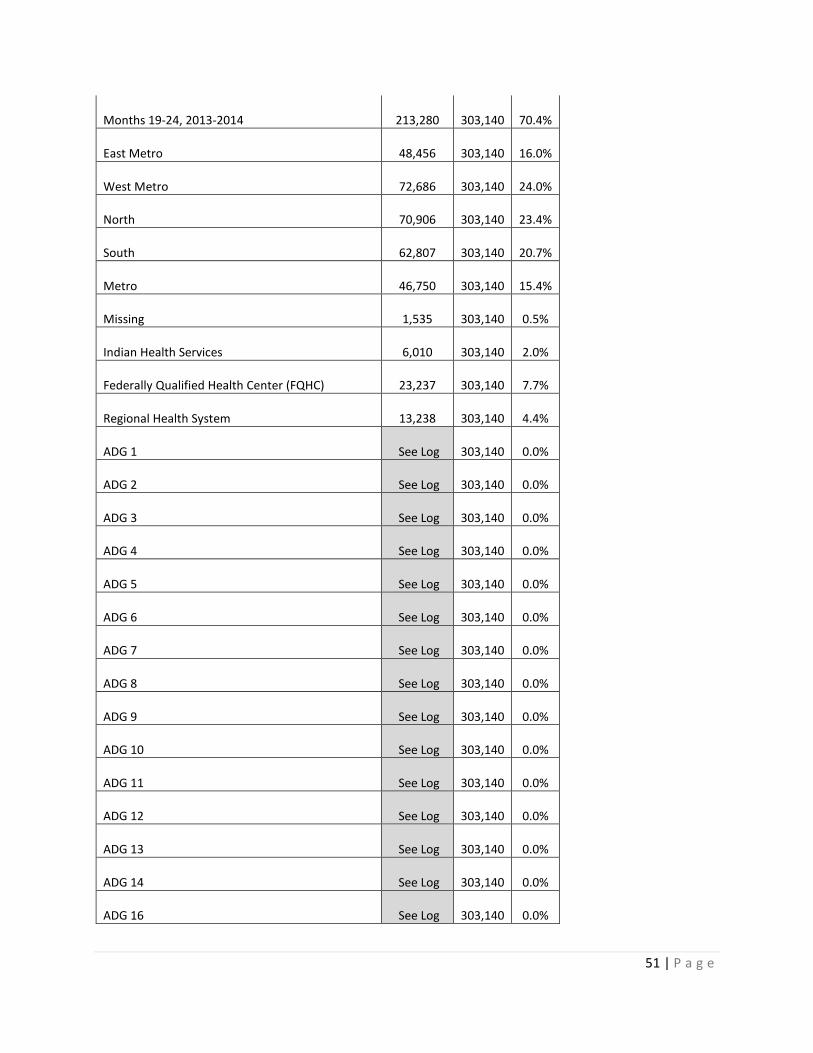
51 | P a g e
Months 19-24, 2013-2014
213,280
303,140 70.4%
East Metro
48,456
303,140 16.0%
West Metro
72,686
303,140 24.0%
North
70,906
303,140 23.4%
South
62,807
303,140 20.7%
Metro
46,750
303,140 15.4%
Missing
1,535
303,140 0.5%
Indian Health Services
6,010
303,140 2.0%
Federally Qualified Health Center (FQHC)
23,237
303,140 7.7%
Regional Health System
13,238
303,140 4.4%
ADG 1 See Log
303,140 0.0%
ADG 2 See Log
303,140 0.0%
ADG 3 See Log
303,140 0.0%
ADG 4 See Log
303,140 0.0%
ADG 5 See Log
303,140 0.0%
ADG 6 See Log
303,140 0.0%
ADG 7 See Log
303,140 0.0%
ADG 8 See Log
303,140 0.0%
ADG 9 See Log
303,140 0.0%
ADG 10 See Log
303,140 0.0%
ADG 11 See Log
303,140 0.0%
ADG 12 See Log
303,140 0.0%
ADG 13 See Log
303,140 0.0%
ADG 14 See Log
303,140 0.0%
ADG 16 See Log
303,140 0.0%

52 | P a g e
ADG 17 See Log
303,140 0.0%
ADG 18 See Log
303,140 0.0%
ADG 20 See Log
303,140 0.0%
ADG 21 See Log
303,140 0.0%
ADG 22 See Log
303,140 0.0%
ADG 23 See Log
303,140 0.0%
ADG 24 See Log
303,140 0.0%
ADG 25 See Log
303,140 0.0%
ADG 26 See Log
303,140 0.0%
ADG 27 See Log
303,140 0.0%
ADG 28 See Log
303,140 0.0%
ADG 29 See Log
303,140 0.0%
ADG 30 See Log
303,140 0.0%
ADG 31 See Log
303,140 0.0%
ADG 32 See Log
303,140 0.0%
ADG 33 See Log
303,140 0.0%
ADG 34 See Log
303,140 0.0% n.a. n.a.
Developmental Disability
2,738
303,140 0.9%
Disabilty
10,243
303,140 3.4%
< 50% FPL
155,131
303,140 51.2%
50-100% FPL
92,265
303,140 30.4%
> 100% FPL
41,456
303,140 13.7%
Missing
14,288
303,140 4.7%
See Log

53 | P a g e
See Log
See Log
See Log
See Log
See Log
Family Homelessness
12,866
303,140 4.2% n.a. n.a. n.a. n.a. n.a. n.a. n.a. n.a.
n.a.
Child Protection Involvement
32,648
303,140 10.8%
Parental Chem Dependency
38,323
303,140 12.6%
Parent Mental Illness
18,557
303,140 6.1%
Parent disability/medical condition
11,498
303,140 3.8%
Parents Married
117,159
303,140 38.6%
Child in Household with 4+ children
76,377
303,140 25.2%
Parent, Language English
251,468
303,140 83.0%
Parent, Language Other
51,672
303,140 17.0%
Parent Immigrated
82,519
303,140 27.2%
Likely Parental Incareration
6,580
303,140 2.2% n.a.
Mortality
344
303,140 0.1% n.a.

54 | P a g e
Injury
14,601
303,140 4.8% n.a.
Asthma
35,368
303,140 11.7% n.a. n.a. n.a. n.a. n.a.
SUD
2,041
36,657 5.6%
ADHD
24,830
303,140 8.2%
PTSD
5,546
303,140 1.8%
Depression
11,225
303,140 3.7% n.a.
n.a.
n.a. n.a. n.a. Well-child visits for all children
82,253
131,057 62.8% Annual dental visit
114,183
177,685 64.3%
Total Costs, based on all services $
1,157
Total Costs, based on ACO services $
826.6 Note: Total costs are log transformed.

55 | P a g e
Description Frequency n %Age 18-21 62,922 550,341 11.43%Age 22-24 45,895 550,341 8.34%Age 25-34 164,357 550,341 29.86%Age 35-44 105,982 550,341 19.26%Age 45-54 93,227 550,341 16.94%Age 55-64 77,958 550,341 14.17%Female 305,611 550,341 55.53%Male 244,730 550,341 44.47%Asian Immigrant 20,971 550,341 3.81%Black immigrant 34,925 550,341 6.35%Hispanic Immigrant 8,187 550,341 1.49%Native American 23,464 550,341 4.26%White Immigrant 7,007 550,341 1.27%Other Immigrant 12,356 550,341 2.25%Asian Non Immigrant 15,466 550,341 2.81%Black Non Immigrant 66,093 550,341 12.01%Hispanic Non Immigrant 16,907 550,341 3.07%White Non Immigrant 296,992 550,341 53.97%Other Non Immigrant 47,973 550,341 8.72%
ADULTS 18-64 (INCLUDES 64)

56 | P a g e
ADULTS 18-64 (INCLUDES 64) Description Frequency n %
Age 18-21
62,922
550,341 11.43%
Age 22-24
45,895
550,341 8.34%
Age 25-34
164,357
550,341 29.86%
Age 35-44
105,982
550,341 19.26%
Age 45-54
93,227
550,341 16.94%
Age 55-64
77,958
550,341 14.17%
Female
305,611
550,341 55.53%
Male
244,730
550,341 44.47%
Asian Immigrant
20,971
550,341 3.81%
Black immigrant
34,925
550,341 6.35%
Hispanic Immigrant
8,187
550,341 1.49%
Native American
23,464
550,341 4.26%
White Immigrant
7,007
550,341 1.27%
Other Immigrant
12,356
550,341 2.25%
Asian Non Immigrant
15,466
550,341 2.81%
Black Non Immigrant
66,093
550,341 12.01%
Hispanic Non Immigrant
16,907
550,341 3.07%
White Non Immigrant
296,992
550,341 53.97%
Other Non Immigrant
47,973
550,341 8.72%
1-6 Months of Eligibility (2014)
96,556
550,341 17.54%
7-12 Months of Eligibility (2014)
453,785
550,341 82.46%
Months 1-6, 2013-2014
66,448
550,341 12.07%
Months 7-12, 2013-2014
130,547
550,341 23.72%

57 | P a g e
Months 13-18, 2013-2014
76,189
550,341 13.84%
Months 19-24, 2013-2014
277,157
550,341 50.36%
East Metro
77,455
550,341 14.07%
West Metro
137,609
550,341 25.00%
North
127,874
550,341 23.24%
South
113,562
550,341 20.63%
Metro
85,917
550,341 15.61%
Missing
7,924
550,341 1.44%
Indian Health Services
8,484
550,341 1.54%
Federally Qualified Health Center (FQHC)
47,185
550,341 8.57%
Regional Health System
22,282
550,341 4.05%
ADG 1
114,726
550,341 20.85%
ADG 2
147,909
550,341 26.88%
ADG 3
41,291
550,341 7.50%
ADG 4
38,245
550,341 6.95%
ADG 5
31,795
550,341 5.78%
ADG 6
20,282
550,341 3.69%
ADG 7
117,918
550,341 21.43%
ADG 8
100,668
550,341 18.29%
ADG 9
12,832
550,341 2.33%
ADG 10
165,571
550,341 30.09%
ADG 11
57,878
550,341 10.52%
ADG 12
23,002
550,341 4.18%
ADG 13
10,106
550,341 1.84%
ADG 14
132,788
550,341 24.13%
58 | P a g e
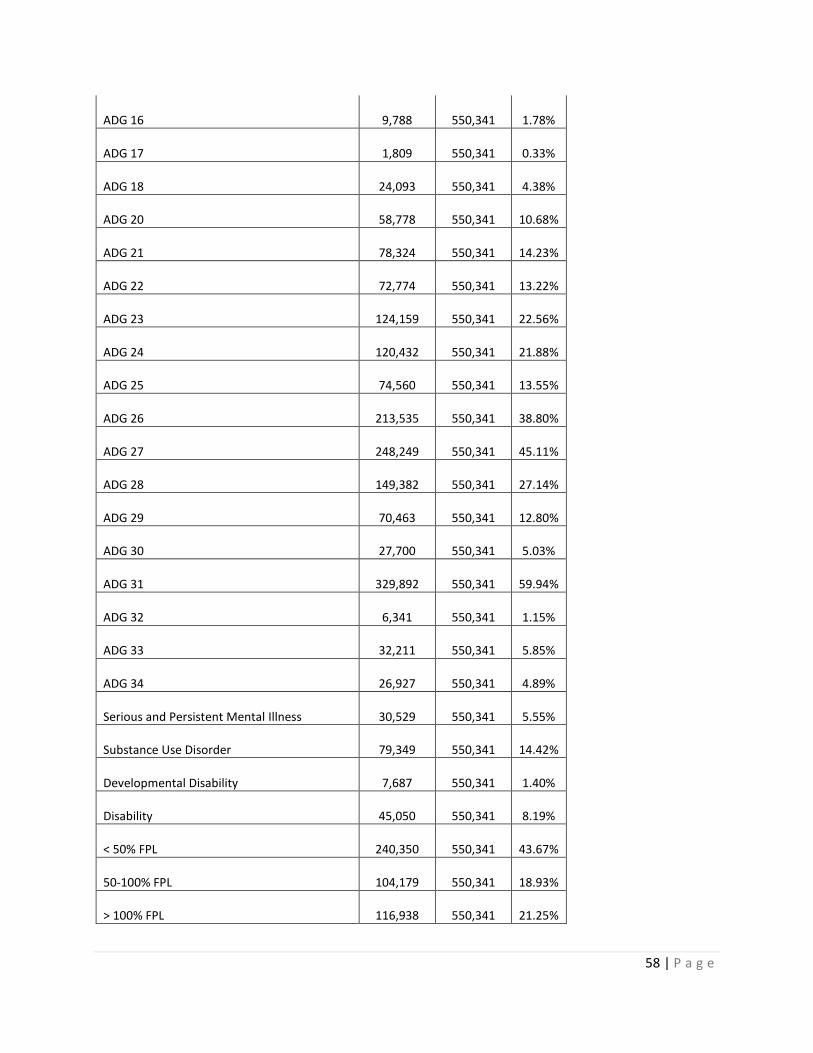
ADG 16
9,788
550,341 1.78%
ADG 17
1,809
550,341 0.33%
ADG 18
24,093
550,341 4.38%
ADG 20
58,778
550,341 10.68%
ADG 21
78,324
550,341 14.23%
ADG 22
72,774
550,341 13.22%
ADG 23
124,159
550,341 22.56%
ADG 24
120,432
550,341 21.88%
ADG 25
74,560
550,341 13.55%
ADG 26
213,535
550,341 38.80%
ADG 27
248,249
550,341 45.11%
ADG 28
149,382
550,341 27.14%
ADG 29
70,463
550,341 12.80%
ADG 30
27,700
550,341 5.03%
ADG 31
329,892
550,341 59.94%
ADG 32
6,341
550,341 1.15%
ADG 33
32,211
550,341 5.85%
ADG 34
26,927
550,341 4.89%
Serious and Persistent Mental Illness
30,529
550,341 5.55%
Substance Use Disorder
79,349
550,341 14.42%
Developmental Disability
7,687
550,341 1.40%
Disability
45,050
550,341 8.19%
< 50% FPL
240,350
550,341 43.67%
50-100% FPL
104,179
550,341 18.93%
> 100% FPL
116,938
550,341 21.25%

59 | P a g e
Missing
88,874
550,341 16.15%
See Log
550,341 0.00%
See Log
550,341 0.00%
See Log
550,341 0.00%
See Log
550,341 0.00%
See Log
550,341 0.00%
See Log
550,341 0.00%
Homelessness
38,721
550,341 7.04% No high school diploma
101,509
550,341 18.44% High school
256,084
550,341 46.53% >High school & <College
58,099
550,341 10.56% College, College+
6,716
550,341 1.22% Missing
127,933
550,341 23.25% English
446,049
550,341 81.05% Other
47,257
550,341 8.59% Missing
57,035
550,341 10.36% Likely to have been incarcerated, per DOC
21,286
550,341 3.87%
n.a.
550,341 0.00%
n.a.
550,341 0.00%
n.a.
550,341 0.00%
n.a.
550,341 0.00%
n.a.
550,341 0.00%
n.a.
550,341 0.00%
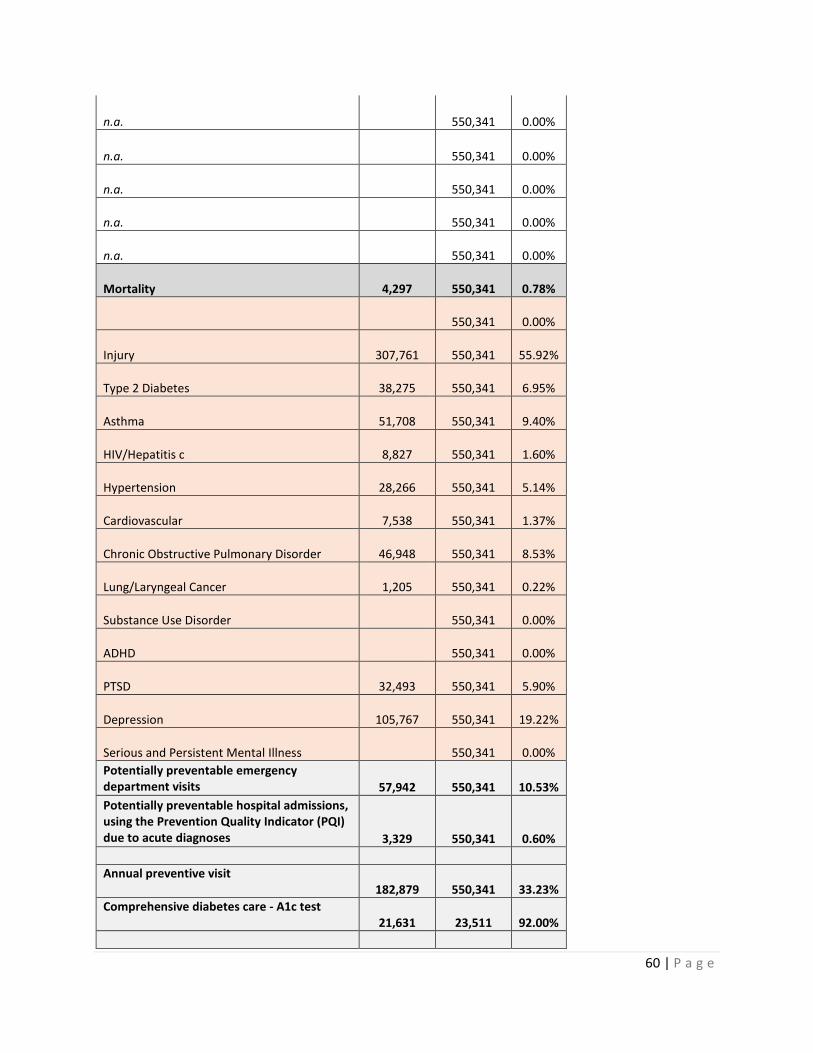
60 | P a g e
n.a.
550,341 0.00%
n.a.
550,341 0.00%
n.a.
550,341 0.00%
n.a.
550,341 0.00%
n.a.
550,341 0.00%
Mortality
4,297
550,341 0.78%
550,341 0.00%
Injury
307,761
550,341 55.92%
Type 2 Diabetes
38,275
550,341 6.95%
Asthma
51,708
550,341 9.40%
HIV/Hepatitis c
8,827
550,341 1.60%
Hypertension
28,266
550,341 5.14%
Cardiovascular
7,538
550,341 1.37%
Chronic Obstructive Pulmonary Disorder
46,948
550,341 8.53%
Lung/Laryngeal Cancer
1,205
550,341 0.22%
Substance Use Disorder
550,341 0.00%
ADHD
550,341 0.00%
PTSD
32,493
550,341 5.90%
Depression
105,767
550,341 19.22%
Serious and Persistent Mental Illness
550,341 0.00% Potentially preventable emergency department visits
57,942
550,341 10.53%
Potentially preventable hospital admissions, using the Prevention Quality Indicator (PQI) due to acute diagnoses
3,329
550,341 0.60%
Annual preventive visit
182,879
550,341 33.23% Comprehensive diabetes care - A1c test
21,631
23,511 92.00%

61 | P a g e
Annual dental visit 133,209
275,045 48.43%
Total Costs, based on all services $
2,105.62
Total Costs, based on ACO services $
1,686.82 Note: Total costs are log transformed.

62 | P a g e
Appendix 8. Bivariate Results
Note: Adult costs shown on the following tables are not log transformed; they are based on actual Medicaid costs.
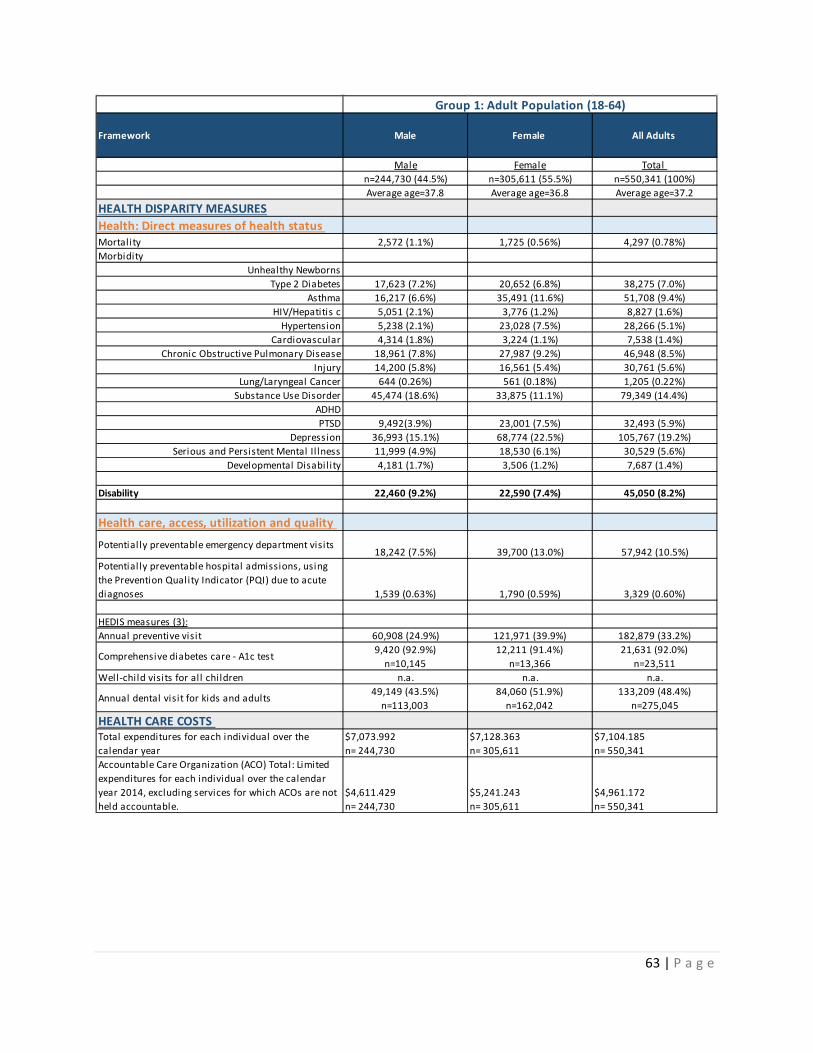
63 | P a g e
Framework Male Female All Adults
Male Female Total n=244,730 (44.5%) n=305,611 (55.5%) n=550,341 (100%)Average age=37.8 Average age=36.8 Average age=37.2
HEALTH DISPARITY MEASURESHealth: Direct measures of health status Mortality 2,572 (1.1%) 1,725 (0.56%) 4,297 (0.78%)Morbidity
Unhealthy NewbornsType 2 Diabetes 17,623 (7.2%) 20,652 (6.8%) 38,275 (7.0%)
Asthma 16,217 (6.6%) 35,491 (11.6%) 51,708 (9.4%)HIV/Hepatitis c 5,051 (2.1%) 3,776 (1.2%) 8,827 (1.6%)
Hypertension 5,238 (2.1%) 23,028 (7.5%) 28,266 (5.1%)Cardiovascular 4,314 (1.8%) 3,224 (1.1%) 7,538 (1.4%)
Chronic Obstructive Pulmonary Disease 18,961 (7.8%) 27,987 (9.2%) 46,948 (8.5%)Injury 14,200 (5.8%) 16,561 (5.4%) 30,761 (5.6%)
Lung/Laryngeal Cancer 644 (0.26%) 561 (0.18%) 1,205 (0.22%)Substance Use Disorder 45,474 (18.6%) 33,875 (11.1%) 79,349 (14.4%)
ADHDPTSD 9,492(3.9%) 23,001 (7.5%) 32,493 (5.9%)
Depression 36,993 (15.1%) 68,774 (22.5%) 105,767 (19.2%)Serious and Persistent Mental Il lness 11,999 (4.9%) 18,530 (6.1%) 30,529 (5.6%)
Developmental Disabil ity 4,181 (1.7%) 3,506 (1.2%) 7,687 (1.4%)
Disability 22,460 (9.2%) 22,590 (7.4%) 45,050 (8.2%)
Health care, access, utilization and quality
Potentially preventable emergency department visits18,242 (7.5%) 39,700 (13.0%) 57,942 (10.5%)
Potentially preventable hospital admissions, using the Prevention Quality Indicator (PQI) due to acute diagnoses 1,539 (0.63%) 1,790 (0.59%) 3,329 (0.60%)
HEDIS measures (3):Annual preventive visit 60,908 (24.9%) 121,971 (39.9%) 182,879 (33.2%)
Comprehensive diabetes care - A1c test 9,420 (92.9%)n=10,145
12,211 (91.4%)n=13,366
21,631 (92.0%)n=23,511
Well-child visits for all children n.a. n.a. n.a.
Annual dental visit for kids and adults 49,149 (43.5%)n=113,003
84,060 (51.9%)n=162,042
133,209 (48.4%)n=275,045
HEALTH CARE COSTS Total expenditures for each individual over the calendar year
$7,073.992n= 244,730
$7,128.363n= 305,611
$7,104.185n= 550,341
Accountable Care Organization (ACO) Total: Limited expenditures for each individual over the calendar year 2014, excluding services for which ACOs are not held accountable.
$4,611.429n= 244,730
$5,241.243n= 305,611
$4,961.172n= 550,341
Group 1: Adult Population (18-64)

64 | P a g e
RESULTS FOR ADULTS ONLY (18 TO 64 YEARS OF AGE INCLUDING 64)
Framework Variables
Serious Persistent Mental Illness
Non-Serious Persistent Mental
Illness TOTAL
F=6.1% M=4.9% F=93.9% M=95.1%n=30,529 (5.6%) n=519,812 (94.5%) n=550,341 (100%)
Average age=39.0 Average age=37.1 Average age=37.2HEALTH DISPARITY MEASURES
Mortality Mort 522 (1.7%) 3,775 (0.73%) 4,297 (0.78%)Morbidity
Unhealthy Newborns nurserylevelIIType 2 Diabetes type2_denom, type2_num 4,311 (14.1%) 33,964 (6.5%) 38,275 (7.0%)
Asthma asthma_denom, asthma_num 6,888 (22.6%) 44,820 (8.6%) 51,708 (9.4%)HIV/Hepatitis c HIVHEPc_denom,
HIVHEPc_num 1,568 (5.1%) 7,259 (1.4%) 8,827 (1.6%)Hypertension Hypert_denom, Hypert_num 3,107 (10.2%) 25,159 (4.8%) 28,266 (5.1%)
Cardiovascular Cardio_denom, Cardio_num 797 (2.6%) 6,741 (1.3%) 7,538 (1.4%)Chronic Obstructive Pulmonary Disease COPD_denom, COPD_num 6,020 (19.7%) 40,928 (7.9%) 46,948 (8.5%)
Injury Injury_denom, Injury_num 7,350 (24.1%) 23,411 (4.5%) 30,761 (5.6%)Lung/Laryngeal Cancer Lunglar_denom, Lunglar_num 98 (0.32%) 1,107 (0.21%) 1,205 (0.22%)
Substance Use Disorder SUD_denom, SUD_num 15,385 (50.4%) 63,964 (12.3%) 79,349 (14.4%)ADHD ADHD_denom, ADHD_numPTSD PTSD_denom, PTSD_num 12,124 (39.7%) 20,369 (3.9%) 32,493 (5.9%)
Depression Depress_denom, Depress_num
Serious and Persistent Mental Il lness part_mental_il l2Developmental Disabil ity MNDiagDD 1,164 (3.8%) 6,523 (1.3%) 7,687 (1.4%)
Disability DS 10,279 (33.7%) 34,771 (6.7%) 45,050 (8.2%)
Health care, access, utilization and quality Potentially preventable emergency department visits
HCUseEDII6,571 (21.5%) 51,371 (9.9%) 57,942 (10.5%)
Potentially preventable hospital admissions, using the Prevention Quality Indicator (PQI) due to acute diagnoses
HCUsePPA
444 (1.4%) 2,885 (0.56%) 3,329 (0.60%)
HEDIS measures (3):Annual preventive visit HWellA_denom, HWellA_num 15,079 (49.4%) 167,800 (32.3%) 182,879 (33.2%)
Comprehensive diabetes care - A1c test Hdiab_denom, Hdiab_num 2,796 (91.6%)n=3,054
18,835 (92.1%)n=20,457
21,631 (92.0%)n=23,511
Well-child visits for all children HWellC_denom, HWellC_num
Annual dental visit for kids and adults ADV_denom, ADV_num 12,244 (57.2%)n=21,394
120,965 (47.7%)253,651
133,209 (48.4%)n=275,045
HEALTH CARE COSTS Total expenditures for each individual over the calendar year
AVERAGE Total_Cost (missing values were imputed as $0)
$ 26,815.61n= 30,529
$ 5,946.516n= 519812
$ 7,104.185n= 550341
Accountable Care Organization (ACO) Total: Limited expenditures for each individual over the calendar year 2014, excluding services for which ACOs are not held accountable.
AVERAGE Included_total_cost (missing values were imputed as $0) $ 16,558.03
n= 30,529$ 4,280.079n= 519,812
$ 4,961.172n= 550,341
Group 2: Serious Persistent Mental Illness (SPMI)
Health: Direct measures of health status and outcomes

65 | P a g e
RESULTS FOR ADULTS ONLY (18 TO 64 YEARS OF AGE INCLUDING 64)
Framework Variables
Substance Use Disorder
Non-Substance Use Disorder
TOTAL
F=11.1% M=18.6% F=88.9% M=81.4%n=79,349 (14.4%) n=470,992(85.6%) n=550,341 (100%)Average age=37.8 Average age=37.1 Average age=37.2
HEALTH DISPARITY MEASURES
Mortality Mort 1,945 (2.5%) 2,352 (0.50%) 4,297 (0.78%)Morbidity
Unhealthy Newborns nurserylevelIIType 2 Diabetes type2_denom, type2_num 7,384 (9.3%) 30,891 (6.6%) 38,275 (7.0%)
Asthma asthma_denom, asthma_num 13,127 (16.5%) 38,581 (8.2%) 51,708 (9.4%)HIV/Hepatitis c HIVHEPc_denom,
HIVHEPc_num5,091 (6.4%) 3,736 (0.79%)
8,827 (1.6%)Hypertension Hypert_denom, Hypert_num 7,068 (8.9%) 21,198 (4.5%) 28,266 (5.1%)
Cardiovascular Cardio_denom, Cardio_num 2,594 (3.3%) 4,944 (1.1%) 7,538 (1.4%)Chronic Obstructive Pulmonary Disease COPD_denom, COPD_num 14,439 (18.2%) 32,509 (6.9%) 46,948 (8.5%)
Injury Injury_denom, Injury_num 13,731 (17.3%) 17,030 (3.6%) 30,761 (5.6%)Lung/Laryngeal Cancer Lunglar_denom, Lunglar_num 418 (0.53%) 787 (0.17%) 1,205 (0.22%)
Substance Use Disorder SUD_denom, SUD_numADHD ADHD_denom, ADHD_numPTSD PTSD_denom, PTSD_num 14,315 (18.0%) 18,178 (3.9%) 32,493 (5.9%)
Depression Depress_denom, Depress_num 39,451 (49.7%) 66,316 (14.1%) 105, 767 (19.2%)
Serious and Persistent Mental Il lness part_mental_il l2 15,385 (19.4%) 15,144 (3.2%) 30,529 (5.6%)Developmental Disabil ity MNDiagDD 967 (1.2%) 6,720 (1.4%) 7,687 (1.4%)
Disability DS 12,703 (16.0%) 32,347 (6.9%) 45,050 (8.2%)
Health care, access, utilization and quality Potentially preventable emergency department visits
HCUseEDII16,537 (20.8%) 41,405 (8.8%) 57,942 (10.5%)
Potentially preventable hospital admissions, using the Prevention Quality Indicator (PQI) due to acute diagnoses
HCUsePPA
1,447 (1.8%) 1,882 (0.40%) 3,329 (0.60%)
HEDIS measures (3):Annual preventive visit HWellA_denom, HWellA_num 32,528 (41.0%) 150,351 (31.9%) 182,879 (33.2%)
Comprehensive diabetes care - A1c test Hdiab_denom, Hdiab_num 4,064 (89.0%)n=4,566
17,567 (92.7%)n=18,945
21,631 (92.0%)n=23,511
Well-child visits for all children HWellC_denom, HWellC_num
Annual dental visit for kids and adults ADV_denom, ADV_num 20,776 (49.4%)n=42,035
112,433 (48.3%)n=233,010
133,209 (48.4%)n=275,045
HEALTH CARE COSTS Total expenditures for each individual over the calendar year
AVERAGE Total_Cost (missing values were imputed as $0)
$ 17,760.96n= 79,349
$ 5,308.816n= 470,992
$ 7,104.185n= 550,341
Accountable Care Organization (ACO) Total: Limited expenditures for each individual over the calendar year 2014, excluding services for which ACOs are not held accountable.
AVERAGE Included_total_cost (missing values were imputed as $0) $ 12,797.63
n= 79,349$ 3,640.948n=470,992
$ 4,961.172n= 550,341
Group 3. Substance Use Disorder (SUD)
Health: Direct measures of health status and outcomes

66 | P a g e
RESULTS FOR ADULTS ONLY (18 TO 64 YEARS OF AGE INCLUDING 64)
Framework Variables
Income Below 50% of the Federal
Poverty Level (FPL) 50-100% FPL > 100% FPL Missing TOTAL
F=42.5% M=45.2% F=21.1% M=16.2% F=22.0% M=20.3% F=14.5% M=18.3%n=240,350 (43.7%) n=104,179 (18.9%) n=116,938 (21.3%) n=88,874 (16.2%) n=550,341 (100%)Average age=37.3 Average age=35.7 Average age=38.1 Average age=37.8 Average age=37.2
HEALTH DISPARITY MEASURES
Mortality Mort 3,117 (1.3%) 419 (0.40%) 321 (0.27%) 440 (0.50%) 4,297 (0.78%)Morbidity
Unhealthy Newborns nurserylevelIIType 2 Diabetes type2_denom, type2_num 20,954 (8.7%) 6,457 (6.2%) 6,396 (5.5%) 4,468 (5.0%) 38,275 (7.0%)
Asthma asthma_denom, asthma_num 28,018 (11.7%) 10,897 (10.5%) 8,154 (7.0%) 4,639 (5.2%) 51,708 (9.4%)HIV/Hepatitis c HIVHEPc_denom,
HIVHEPc_num 6,164 (2.6%) 942 (0.90%) 719 (0.61%) 1,002 (1.1%) 8,827 (1.6%)Hypertension Hypert_denom, Hypert_num 14,625 (6.1%) 7,237 (7.0%) 4,089 (3.5%) 2,315 (2.6%) 28,266 (5.1%)
Cardiovascular Cardio_denom, Cardio_num 4,715 (2.0%) 1,048 (1.0%) 953 (0.81%) 822 (0.92%) 7,538 (1.4%)Chronic Obstructive Pulmonary Disease COPD_denom, COPD_num 26,907 (11.2%) 8,480 (8.1%) 7,232 (6.2%) 4,329 (4.9%) 46,948 (8.5%)
Injury Injury_denom, Injury_num 17,275 (7.2%) 5,885 (5.7%) 3,969 (3.4%) 3,632 (4.1%) 30,761 (5.6%)Lung/Laryngeal Cancer Lunglar_denom, Lunglar_num 756 (0.31%) 150 (0.14%) 150 (0.13%) 149 (0.17%) 1,205 (0.22%)
Substance Use Disorder SUD_denom, SUD_num 48,790 (20.3%) 11,260 (10.8%) 7,343 (6.3%) 11,956 (13.5%) 79,349 (14.4%)ADHD ADHD_denom, ADHD_numPTSD PTSD_denom, PTSD_num 20,173 (8.4%) 6,744 (6.5%) 3,140 (2.7%) 2,436 (2.7%) 32,493 (5.9%)
Depression Depress_denom, Depress_num 60,491 (25.2%) 20,093 (19.3%) 14,974 (12.8%) 10,209 (11.5%) 105,767 (19.2%)
Serious and Persistent Mental Il lness part_mental_il l2 20,162 (8.4%) 5,421 (5.2%) 2,671 (2.3%) 2,275 (2.6%) 30,529 (5.6%)Developmental Disabil ity MNDiagDD 6,348 (2.6%) 892 (0.86%) 191 (0.16%) 256 (0.29%) 7,687 (1.4%)
Disability DS 37,838 (15.7%) 5,597 (5.4%) 1,311 (1.1%) 304 (0.34%) 45,050 (8.2%)
Health care, access, utilization and quality Potentially preventable emergency department visits
HCUseEDII32,415 (13.5%) 13,793 (13.2%) 7,175 (6.1%) 4,559 (5.1%) 57,942 (10.5%)
Potentially preventable hospital admissions, using the Prevention Quality Indicator (PQI) due to acute diagnoses
HCUsePPA
2,017 (0.84%) 545 (0.52%) 382 (0.33%) 385 (0.43%) 3,329 (0.60%)
HEDIS measures (3):Annual preventive visit HWellA_denom, HWellA_num 83,524 (34.8%) 36,553 (35.1%) 37,255 (31.9%) 25,547 (28.8%) 182,879 (33.2%)
Comprehensive diabetes care - A1c test Hdiab_denom, Hdiab_num 12,834 (91.4%)n=14,044
3,736 (90.9%)n=4,109
3,633 (94.2%)n=3,857
1,428 (95.1%)n=1,501
21,631 (92.0%)n=23,511
Well-child visits for all children HWellC_denom, HWellC_num
Annual dental visit for kids and adults ADV_denom, ADV_num 67,094 (48.3%)n=138,976
29,297 (50.9%)n=57,557
28,799 (49.2%)n=58,492
8,019 (40.1%)n=20,020
133,209 (48.4%)n=275,045
HEALTH CARE COSTS Total expenditures for each individual over the calendar year
AVERAGE Total_Cost (missing values were imputed as $0)
$ 10,446.51n= 240,350
$ 5,716.457n= 104,179
$ 3,694.322n= 116,938
$ 4,178.541n= 88,874
$ 7,104.185n= 550,341
Accountable Care Organization (ACO) Total: Limited expenditures for each individual over the calendar year 2014, excluding services for which ACOs are not held accountable.
AVERAGE Included_total_cost (missing values were imputed as $0) $ 6,590.056
n= 240,350$ 4,452.126n= 104,179
$ 3,226.294n= 116,938
$ 3,435.449n= 88,874
$ 4,961.172n= 550,341
Group 4: Income Relative to Federal Poverty Level (FPL)
Health: Direct measures of health status and outcomes

67 | P a g e
RESULTS FOR ADULTS ONLY (18 TO 64 YEARS OF AGE INCLUDING 64)
Framework Variables
Primary language: English
Primary language: Other
Primary language: Missing
TOTAL
F=82.0% M=79.9% F=9.5% M=7.5% F=8.5% M=12.7%n=446,049 (81.1%) n=47,257 (8.6%) n=57,035 (10.4%) n=550,341 (100%)Average age=37.4 Average age=37.9 Average age=35.1 Average age=37.2
HEALTH DISPARITY MEASURES
Mortality Mort 3,973 (0.89%) 205 (0.43%) 119 (0.21%) 4,297 (0.78%)Morbidity
Unhealthy Newborns nurserylevelIIType 2 Diabetes type2_denom, type2_num 31,252 (7.0%) 4,785 (10.1%) 2,238 (3.9%) 38,275 (7.0%)
Asthma asthma_denom, asthma_num 46,589 (10.4%) 2,208 (4.7%) 2,911 (5.1%) 51,708 (9.4%)HIV/Hepatitis c HIVHEPc_denom,
HIVHEPc_num8,124 (1.8%) 515 (1.1%) 188 (0.33%) 8,827 (1.6%)
Hypertension Hypert_denom, Hypert_num 23,924 (5.4%) 3,199 (6.8%) 1,143 (2.0%) 28,266 (5.1%)Cardiovascular Cardio_denom, Cardio_num 6,782 (1.5%) 477 (1.0%) 279 (0.49%) 7,538 (1.4%)
Chronic Obstructive Pulmonary Disease COPD_denom, COPD_num 42,087 (9.4%) 2,499 (5.3%) 2,362 (4.1%) 46,948 (8.5%)Injury Injury_denom, Injury_num 27,963 (6.3%) 1,053 (2.2%) 1,745 (3.1%) 30,761 (5.6%)
Lung/Laryngeal Cancer Lunglar_denom, Lunglar_num 1,077 (0.24%) 73 (0.15%) 55 (0.10%) 1,205 (0.22%)Substance Use Disorder SUD_denom, SUD_num 75,617 (17.0%) 1,108 (2.3%) 2,624 (4.6%) 79,349 (14.4%)
ADHD ADHD_denom, ADHD_numPTSD PTSD_denom, PTSD_num 28,196 (6.3%) 3,440 (7.3%) 857 (1.5%) 32,493 (5.9%)
Depression Depress_denom, Depress_num 96,580 (21.7%) 4,651 (9.8%) 4,536 (8.0%) 105,767 (19.2%)
Serious and Persistent Mental Il lness part_mental_il l2 27,798 (6.2%) 2,058 (4.4%) 673 (1.2%) 30,529 (5.6%)Developmental Disabil ity MNDiagDD 6,828 (1.5%) 694 (1.5%) 165 (0.29%) 7,687 (1.4%)
Disability DS 38,915 (8.7%) 5,639 (11.9%) 496 (0.87%) 45,050 (8.2%)
Health care, access, utilization and quality Potentially preventable emergency department visits
HCUseEDII52,005 (11.7%) 3,460 (7.3%) 2,477 (4.3%) 57,942 (10.5%)
Potentially preventable hospital admissions, using the Prevention Quality Indicator (PQI) due to acute diagnoses
HCUsePPA
3,039 (0.68%) 181 (0.38%) 109 (0.19%) 3,329 (0.60%)
HEDIS measures (3):Annual preventive visit HWellA_denom, HWellA_num 152,689 (34.2%) 15,021 (31.8%) 15,169 (26.6%) 182,879 (33.2%)
Comprehensive diabetes care - A1c test Hdiab_denom, Hdiab_num 17,697 (91.5%)n=19,333
2,787 (94.3%)n=2,956
1,147 (93.9%)n=1,222
21,631 (92.0%)n=23,511
Well-child visits for all children HWellC_denom, HWellC_num
Annual dental visit for kids and adults ADV_denom, ADV_num 107, 095 (47.9%)n=223,593
13,096 (51.5%)n=25,442
13,018 (50.1%)n=26,010
133,209 (48.4%)n=275,045
HEALTH CARE COSTS Total expenditures for each individual over the calendar year
AVERAGE Total_Cost (missing values were imputed as $0)
$ 7,706.925n= 446,049
$ 6,743.569n= 47,257
$ 2,689.182n= 57,035
$ 7,104.185n= 550,341
Accountable Care Organization (ACO) Total: Limited expenditures for each individual over the calendar year 2014, excluding services for which ACOs are not held accountable.
AVERAGE Included_total_cost (missing values were imputed as $0) $ 5,397.018
n= 446,049$ 4,086,.072n= 47,257
$ 2,277.659n= 57,035
$ 4,961.172n= 550,341
Group 5: Primary Language
Health: Direct measures of health status and outcomes

68 | P a g e
RESULTS FOR ADULTS ONLY (18 TO 64 YEARS OF AGE INCLUDING 64)
Framework Variables Black/Non Immigrant Hispanic/Non Immigrant White/Non Immigrant TOTAL
F=11.1% M=13.2% F=3.1% M=3.0% F=54.2% M=53.7%n=66,093 (12.0%) n=16,907 (3.1%) n=296,992 (54.0%) n=550,341 (100%)Average age=35.0 Average age=31.2 Average age=38.7 Average age=37.2
HEALTH DISPARITY MEASURES
Mortality Mort 529 (0.80%) 87 (0.51%) 2,827 (0.95%) 4,297 (0.78%)Morbidity
Unhealthy Newborns nurserylevelIIType 2 Diabetes type2_denom, type2_num 5,472 (8.3%) 1,285 (7.6%) 18,370 (6.2%) 38,275 (7.0%)
Asthma asthma_denom, asthma_num 10,886 (16.5%) 1,686 (10.0%) 28,378 (9.6%) 51,708 (9.4%)HIV/Hepatitis c HIVHEPc_denom,
HIVHEPc_num1,766 (2.7%) 281 (1.7%) 4,405 (1.5%) 8,827 (1.6%)
Hypertension Hypert_denom, Hypert_num 6,346 (9.6%) 939 (5.6%) 11,681 (3.9%) 28,266 (5.1%)Cardiovascular Cardio_denom, Cardio_num 1,296 (2.0%) 110 (0.65%) 4,350 (1.5%) 7,538 (1.4%)
Chronic Obstructive Pulmonary Disease COPD_denom, COPD_num 5,549 (8.4%) 1,136 (6.7%) 30,198 (10.2%) 46,948 (8.5%)Injury Injury_denom, Injury_num 4,629 (7.0%) 1,110 (6.6%) 17,866 (6.0%) 30,761 (5.6%)
Lung/Laryngeal Cancer Lunglar_denom, Lunglar_num 133 (0.20%) 12 (0.07%) 806 (0.27%) 1,205 (0.22%)Substance Use Disorder SUD_denom, SUD_num 13,279 (20.1%) 2,388 (14.1%) 46,436 (15.6%) 79,349 (14.4%)
ADHD ADHD_denom, ADHD_numPTSD PTSD_denom, PTSD_num 5,713 (8.6%) 1,025 (6.1%) 16,680 (5.6%) 32,493 (5.9%)
Depression Depress_denom, Depress_num
13,602 (20.6%) 3,251 (19.2%) 66,527 (22.4%) 105,767 (19.2%)
Serious and Persistent Mental Il lness part_mental_il l2 4,684 (7.1%) 807 (4.8%) 18,373 (6.2%) 30,529 (5.6%)Developmental Disabil ity MNDiagDD 1,304 (2.0%) 245 (1.5%) 4,667 (1.6%) 7,687 (1.4%)
Disability DS 9,793 (14.8%) 1,117 (6.6%) 23,924 (8.1%) 45,050 (8.2%)
Health care, access, utilization and quality Potentially preventable emergency department visits
HCUseEDII12,726 (19.3%) 2,138 (12.7%) 27,691 (9.3%) 57,942 (10.5%)
Potentially preventable hospital admissions, using the Prevention Quality Indicator (PQI) due to acute diagnoses
HCUsePPA
671 (1.0%) 84 (0.50%) 1,773 (0.60%) 3,329 (0.60%)
HEDIS measures (3):Annual preventive visit HWellA_denom, HWellA_num 23,748 (35.9%) 5,308 (31.4%) 100,396 (33.8%) 182,879 (33.2%)
Comprehensive diabetes care - A1c test Hdiab_denom, Hdiab_num 3,031 (90.8%)n=3,337
678 (90.2%)n=752
11,012 (92.5%)n=11,904
21,631 (92.0%)n=23,511
Well-child visits for all children HWellC_denom, HWellC_num
Annual dental visit for kids and adults ADV_denom, ADV_num 15,070 (45.5%)n=33,103
3,595 (46.8%)n=7,675
75,521 (48.6%)n=155,312
133,209 (48.4%)n=275,045
HEALTH CARE COSTS Total expenditures for each individual over the calendar year
AVERAGE Total_Cost (missing values were imputed as $0)
$ 8,210.67n= 66,093
$ 6,158.817n= 16,907
$ 7,596.508n= 296,992
$ 7,104.185n= 550,341
Accountable Care Organization (ACO) Total: Limited expenditures for each individual over the calendar year 2014, excluding services for which ACOs are not held accountable.
AVERAGE Included_total_cost (missing values were imputed as $0) $ 5,484.764
n= 66,093$ 4,465.043n= 16,907
$ 5,323.021n= 296,992
$ 4,961.172n= 550,341
Health: Direct measures of health status and outcomes
Group 7: Race and Ethnicity

69 | P a g e
RESULTS FOR ADULTS ONLY (18 TO 64 YEARS OF AGE INCLUDING 64)
Framework Variables
People who are homeless: Yes
People who are homeless: No
TOTAL
F=5.1% M=9.4% F=94.9% M=90.6%n=38,721 (7.0%) n=511,620 (93.0%) n=550,341 (100%)
Average age=35.6 Average age=37.4 Average age=37.2HEALTH DISPARITY MEASURES
Mortality Mort 464 (1.2%) 3,833 (0.75%) 4,297 (0.78%)Morbidity
Unhealthy Newborns nurserylevelIIType 2 Diabetes type2_denom, type2_num 2,687 (6.9%) 35,588 (7.0%) 38,275 (7.0%)
Asthma asthma_denom, asthma_num 5,648 (14.6%) 46,060 (9.0%) 51,708 (9.4%)HIV/Hepatitis c HIVHEPc_denom,
HIVHEPc_num 1,655 (4.3%) 7,172 (1.4%) 8,827 (1.6%)Hypertension Hypert_denom, Hypert_num 2,993 (7.7%) 25,273 (4.9%) 28,266 (5.1%)
Cardiovascular Cardio_denom, Cardio_num 625 (1.6%) 6,913 (1.4%) 7,538 (1.4%)Chronic Obstructive Pulmonary Disease COPD_denom, COPD_num 4,444 (11.5%) 42,504 (8.3%) 46,948 (8.5%)
Injury Injury_denom, Injury_num 5,015 (13.0%) 25,746 (5.0%) 30,761 (5.6%)Lung/Laryngeal Cancer Lunglar_denom, Lunglar_num 91 (0.24%) 1,114 (0.22%) 1,205 (0.22%)
Substance Use Disorder SUD_denom, SUD_num 14,665 (37.9%) 64,684 (12.6%) 79,349 (14.4%)ADHD ADHD_denom, ADHD_numPTSD PTSD_denom, PTSD_num 5,028 (13.0%) 27,465 (5.4%) 32,493 (5.9%)
Depression Depress_denom, Depress_num 12,467 (32.2%) 93,300 (18.2%) 105,767 (19.2%)
Serious and Persistent Mental Il lness part_mental_il l2 4,681 (12.1%) 12,848 (5.1%) 30,529 (5.6%)Developmental Disabil ity MNDiagDD 368 (0.95%) 7,319 (1.4%) 7,687 (1.4%)
Disability DS 4,195 (10.8%) 40,855 (8.0%) 45,050 (8.2%)
Health care, access, utilization and quality Potentially preventable emergency department visits
HCUseEDII8,701 (22.5%) 49,241 (9.6%) 57,942 (10.5%)
Potentially preventable hospital admissions, using the Prevention Quality Indicator (PQI) due to acute diagnoses
HCUsePPA
411 (1.1%) 2,918 (0.57%) 3,329 (0.60%)
HEDIS measures (3):Annual preventive visit HWellA_denom, HWellA_num 13,501 (34.9%) 169,378 (33.1%) 182,879 (33.2%)
Comprehensive diabetes care - A1c test Hdiab_denom, Hdiab_num 1,145 (87.8%)n=1,304
20,486 (92.3%)n=22,207
21,631 (92.0%)n=23,511
Well-child visits for all children HWellC_denom, HWellC_num
Annual dental visit for kids and adults ADV_denom, ADV_num 6,529 (41.9%)n=15,577
126,680 (48.8%)n=259,468
133,209 (48.4%)n=275,045
HEALTH CARE COSTS Total expenditures for each individual over the calendar year
AVERAGE Total_Cost (missing values were imputed as $0)
$ 9,832.988n= 38,721
$ 6,897.661n= 511,620
$ 7,104.185n= 550,341
Accountable Care Organization (ACO) Total: Limited expenditures for each individual over the calendar year 2014, excluding services for which ACOs are not held accountable.
AVERAGE Included_total_cost (missing values were imputed as $0) $ 7,305.163
n= 38,721$ 4,783.772n= 511,620
$ 4,961.172n= 550,341
Group 6: Homeless
Health: Direct measures of health status and outcomes
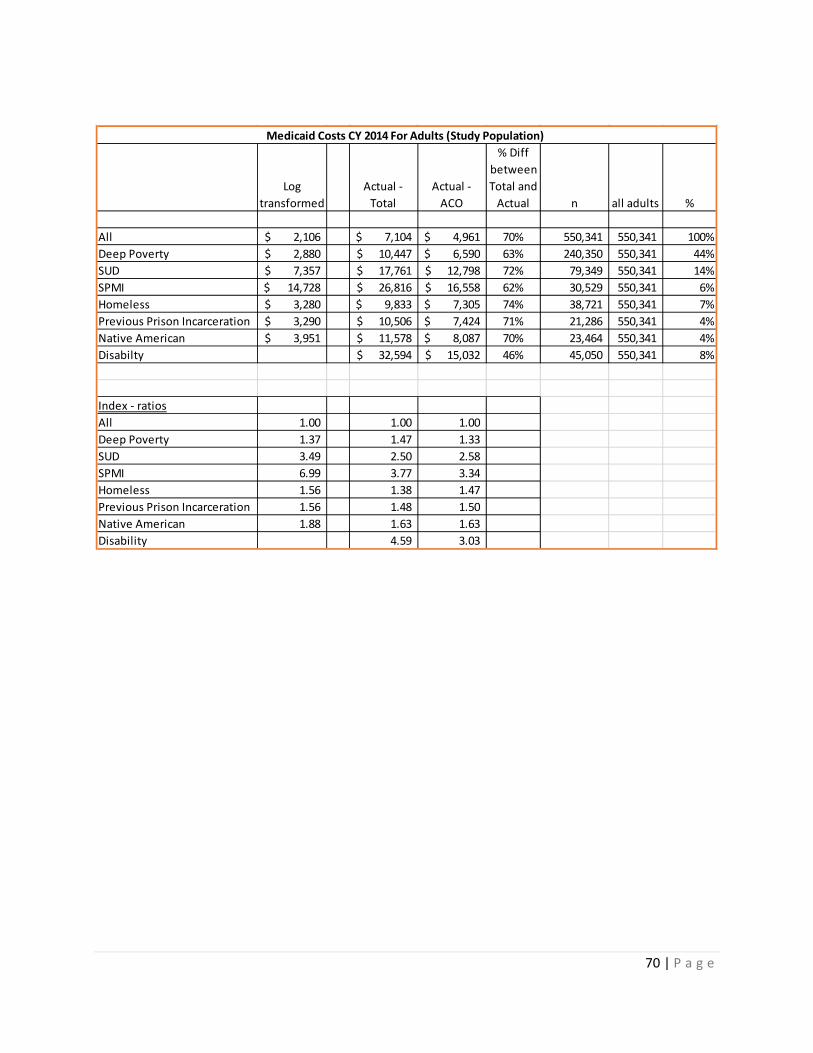
70 | P a g e
Log transformed
Actual - Total
Actual - ACO
% Diff between Total and
Actual n all adults %
All 2,106$ 7,104$ 4,961$ 70% 550,341 550,341 100%Deep Poverty 2,880$ 10,447$ 6,590$ 63% 240,350 550,341 44%SUD 7,357$ 17,761$ 12,798$ 72% 79,349 550,341 14%SPMI 14,728$ 26,816$ 16,558$ 62% 30,529 550,341 6%Homeless 3,280$ 9,833$ 7,305$ 74% 38,721 550,341 7%Previous Prison Incarceration 3,290$ 10,506$ 7,424$ 71% 21,286 550,341 4%Native American 3,951$ 11,578$ 8,087$ 70% 23,464 550,341 4%Disabilty 32,594$ 15,032$ 46% 45,050 550,341 8%
Index - ratiosAll 1.00 1.00 1.00 Deep Poverty 1.37 1.47 1.33 SUD 3.49 2.50 2.58 SPMI 6.99 3.77 3.34 Homeless 1.56 1.38 1.47 Previous Prison Incarceration 1.56 1.48 1.50 Native American 1.88 1.63 1.63 Disability 4.59 3.03
Medicaid Costs CY 2014 For Adults (Study Population)

71 | P a g e
Appendix 9. Regression Results
HMA conducted several regressions to examine health disparities and costs in the Medicaid population.
In this appendix, the following is provided:
• An example set of results is provided, which shows the results for the basic and full models for adults, where the independent variables for adults are regressed against the mortality rate for adults.
• The cost regression results are also provided for adults. • The R-squared results for the cost regressions are also provided for adults.
The full regression results were provided to DHS and can be found in the following spreadsheets:
• Adults_Health Disparities • Children_Health Disparites • Young Children_Health Disparities
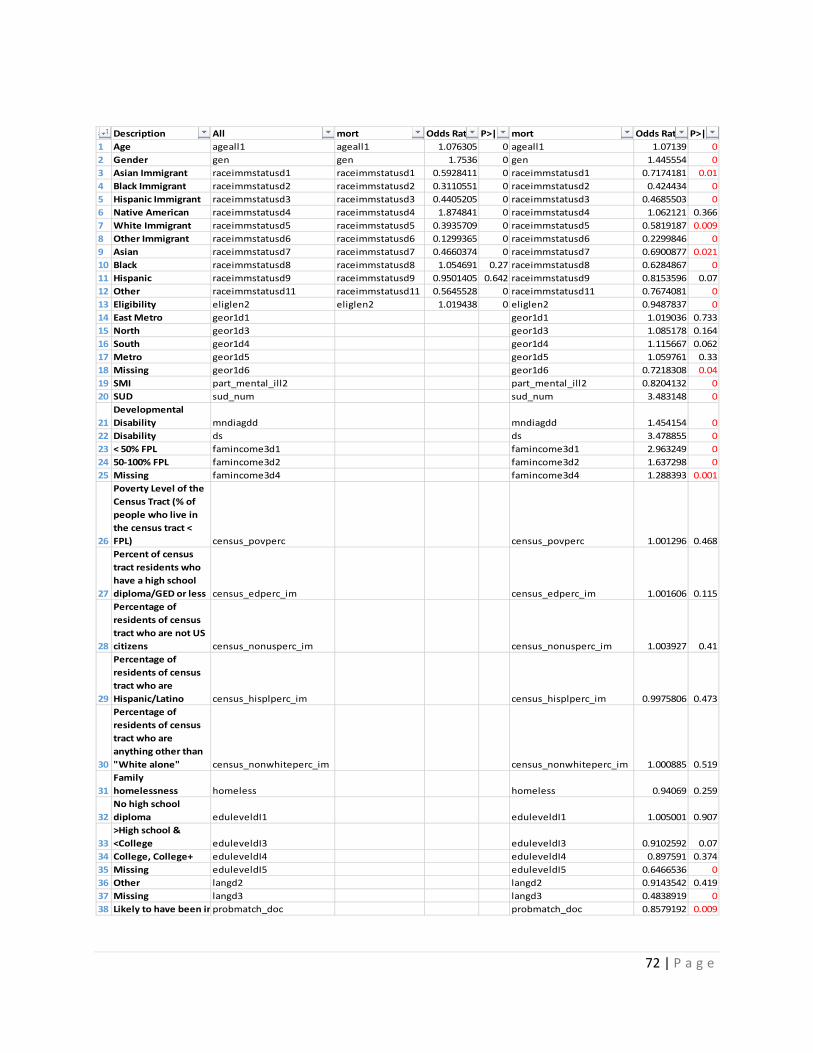
72 | P a g e
# Description All mort Odds Ratio P>|z| mort Odds Ratio P>|z|1 Age ageall1 ageall1 1.076305 0 ageall1 1.07139 02 Gender gen gen 1.7536 0 gen 1.445554 03 Asian Immigrant raceimmstatusd1 raceimmstatusd1 0.5928411 0 raceimmstatusd1 0.7174181 0.014 Black Immigrant raceimmstatusd2 raceimmstatusd2 0.3110551 0 raceimmstatusd2 0.424434 05 Hispanic Immigrant raceimmstatusd3 raceimmstatusd3 0.4405205 0 raceimmstatusd3 0.4685503 06 Native American raceimmstatusd4 raceimmstatusd4 1.874841 0 raceimmstatusd4 1.062121 0.3667 White Immigrant raceimmstatusd5 raceimmstatusd5 0.3935709 0 raceimmstatusd5 0.5819187 0.0098 Other Immigrant raceimmstatusd6 raceimmstatusd6 0.1299365 0 raceimmstatusd6 0.2299846 09 Asian raceimmstatusd7 raceimmstatusd7 0.4660374 0 raceimmstatusd7 0.6900877 0.02110 Black raceimmstatusd8 raceimmstatusd8 1.054691 0.27 raceimmstatusd8 0.6284867 011 Hispanic raceimmstatusd9 raceimmstatusd9 0.9501405 0.642 raceimmstatusd9 0.8153596 0.0712 Other raceimmstatusd11 raceimmstatusd11 0.5645528 0 raceimmstatusd11 0.7674081 013 Eligibility eliglen2 eliglen2 1.019438 0 eliglen2 0.9487837 014 East Metro geor1d1 geor1d1 1.019036 0.73315 North geor1d3 geor1d3 1.085178 0.16416 South geor1d4 geor1d4 1.115667 0.06217 Metro geor1d5 geor1d5 1.059761 0.3318 Missing geor1d6 geor1d6 0.7218308 0.0419 SMI part_mental_ill2 part_mental_ill2 0.8204132 020 SUD sud_num sud_num 3.483148 0
21Developmental Disability mndiagdd mndiagdd 1.454154 0
22 Disability ds ds 3.478855 023 < 50% FPL famincome3d1 famincome3d1 2.963249 024 50-100% FPL famincome3d2 famincome3d2 1.637298 025 Missing famincome3d4 famincome3d4 1.288393 0.001
26
Poverty Level of the Census Tract (% of people who live in the census tract < FPL) census_povperc census_povperc 1.001296 0.468
27
Percent of census tract residents who have a high school diploma/GED or less census_edperc_im census_edperc_im 1.001606 0.115
28
Percentage of residents of census tract who are not US citizens census_nonusperc_im census_nonusperc_im 1.003927 0.41
29
Percentage of residents of census tract who are Hispanic/Latino census_hisplperc_im census_hisplperc_im 0.9975806 0.473
30
Percentage of residents of census tract who are anything other than "White alone" census_nonwhiteperc_im census_nonwhiteperc_im 1.000885 0.519
31Family homelessness homeless homeless 0.94069 0.259
32No high school diploma eduleveldI1 eduleveldI1 1.005001 0.907
33>High school & <College eduleveldI3 eduleveldI3 0.9102592 0.07
34 College, College+ eduleveldI4 eduleveldI4 0.897591 0.37435 Missing eduleveldI5 eduleveldI5 0.6466536 036 Other langd2 langd2 0.9143542 0.41937 Missing langd3 langd3 0.4838919 038 Likely to have been in probmatch_doc probmatch_doc 0.8579192 0.009
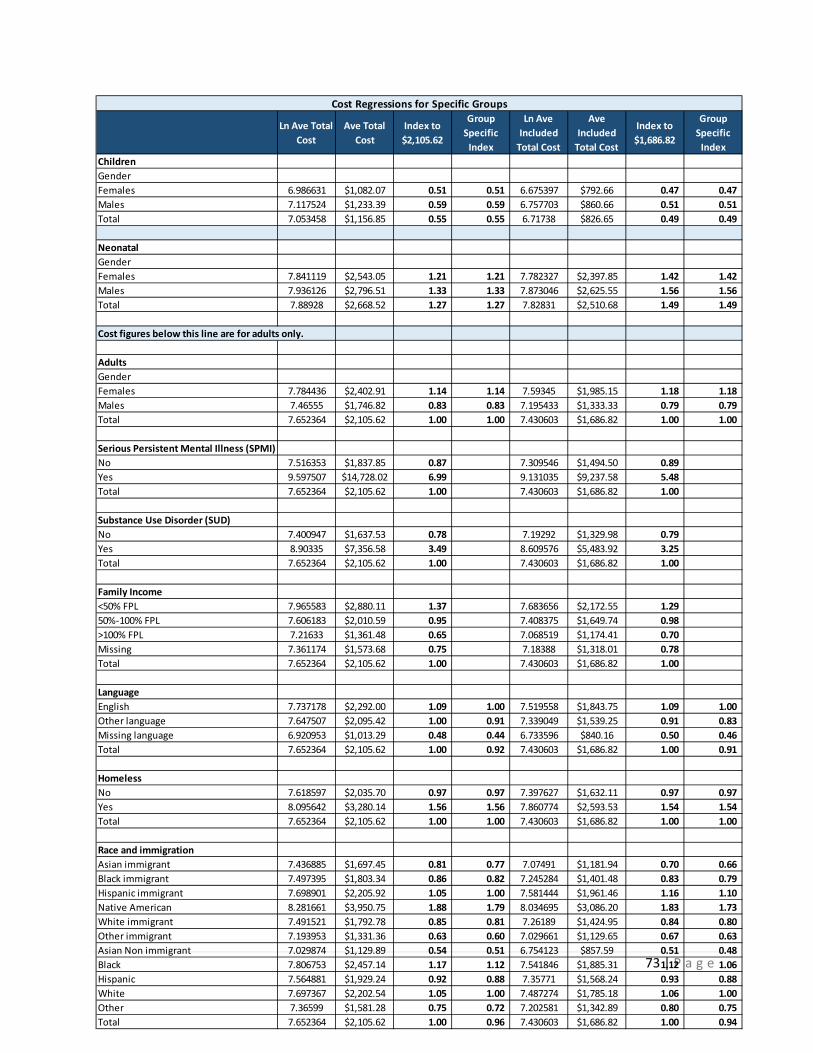
73 | P a g e
Ln Ave Total Cost
Ave Total Cost
Index to $2,105.62
Group Specific
Index
Ln Ave Included
Total Cost
Ave Included
Total Cost
Index to $1,686.82
Group Specific
IndexChildrenGenderFemales 6.986631 $1,082.07 0.51 0.51 6.675397 $792.66 0.47 0.47 Males 7.117524 $1,233.39 0.59 0.59 6.757703 $860.66 0.51 0.51 Total 7.053458 $1,156.85 0.55 0.55 6.71738 $826.65 0.49 0.49
NeonatalGenderFemales 7.841119 $2,543.05 1.21 1.21 7.782327 $2,397.85 1.42 1.42 Males 7.936126 $2,796.51 1.33 1.33 7.873046 $2,625.55 1.56 1.56 Total 7.88928 $2,668.52 1.27 1.27 7.82831 $2,510.68 1.49 1.49
Cost figures below this line are for adults only.
AdultsGenderFemales 7.784436 $2,402.91 1.14 1.14 7.59345 $1,985.15 1.18 1.18 Males 7.46555 $1,746.82 0.83 0.83 7.195433 $1,333.33 0.79 0.79 Total 7.652364 $2,105.62 1.00 1.00 7.430603 $1,686.82 1.00 1.00
Serious Persistent Mental Illness (SPMI)No 7.516353 $1,837.85 0.87 7.309546 $1,494.50 0.89 Yes 9.597507 $14,728.02 6.99 9.131035 $9,237.58 5.48 Total 7.652364 $2,105.62 1.00 7.430603 $1,686.82 1.00
Substance Use Disorder (SUD)No 7.400947 $1,637.53 0.78 7.19292 $1,329.98 0.79 Yes 8.90335 $7,356.58 3.49 8.609576 $5,483.92 3.25 Total 7.652364 $2,105.62 1.00 7.430603 $1,686.82 1.00
Family Income<50% FPL 7.965583 $2,880.11 1.37 7.683656 $2,172.55 1.29 50%-100% FPL 7.606183 $2,010.59 0.95 7.408375 $1,649.74 0.98 >100% FPL 7.21633 $1,361.48 0.65 7.068519 $1,174.41 0.70 Missing 7.361174 $1,573.68 0.75 7.18388 $1,318.01 0.78 Total 7.652364 $2,105.62 1.00 7.430603 $1,686.82 1.00
LanguageEnglish 7.737178 $2,292.00 1.09 1.00 7.519558 $1,843.75 1.09 1.00 Other language 7.647507 $2,095.42 1.00 0.91 7.339049 $1,539.25 0.91 0.83 Missing language 6.920953 $1,013.29 0.48 0.44 6.733596 $840.16 0.50 0.46 Total 7.652364 $2,105.62 1.00 0.92 7.430603 $1,686.82 1.00 0.91
HomelessNo 7.618597 $2,035.70 0.97 0.97 7.397627 $1,632.11 0.97 0.97 Yes 8.095642 $3,280.14 1.56 1.56 7.860774 $2,593.53 1.54 1.54 Total 7.652364 $2,105.62 1.00 1.00 7.430603 $1,686.82 1.00 1.00
Race and immigration Asian immigrant 7.436885 $1,697.45 0.81 0.77 7.07491 $1,181.94 0.70 0.66 Black immigrant 7.497395 $1,803.34 0.86 0.82 7.245284 $1,401.48 0.83 0.79 Hispanic immigrant 7.698901 $2,205.92 1.05 1.00 7.581444 $1,961.46 1.16 1.10 Native American 8.281661 $3,950.75 1.88 1.79 8.034695 $3,086.20 1.83 1.73 White immigrant 7.491521 $1,792.78 0.85 0.81 7.26189 $1,424.95 0.84 0.80 Other immigrant 7.193953 $1,331.36 0.63 0.60 7.029661 $1,129.65 0.67 0.63 Asian Non immigrant 7.029874 $1,129.89 0.54 0.51 6.754123 $857.59 0.51 0.48 Black 7.806753 $2,457.14 1.17 1.12 7.541846 $1,885.31 1.12 1.06 Hispanic 7.564881 $1,929.24 0.92 0.88 7.35771 $1,568.24 0.93 0.88 White 7.697367 $2,202.54 1.05 1.00 7.487274 $1,785.18 1.06 1.00 Other 7.36599 $1,581.28 0.75 0.72 7.202581 $1,342.89 0.80 0.75 Total 7.652364 $2,105.62 1.00 0.96 7.430603 $1,686.82 1.00 0.94
Cost Regressions for Specific Groups
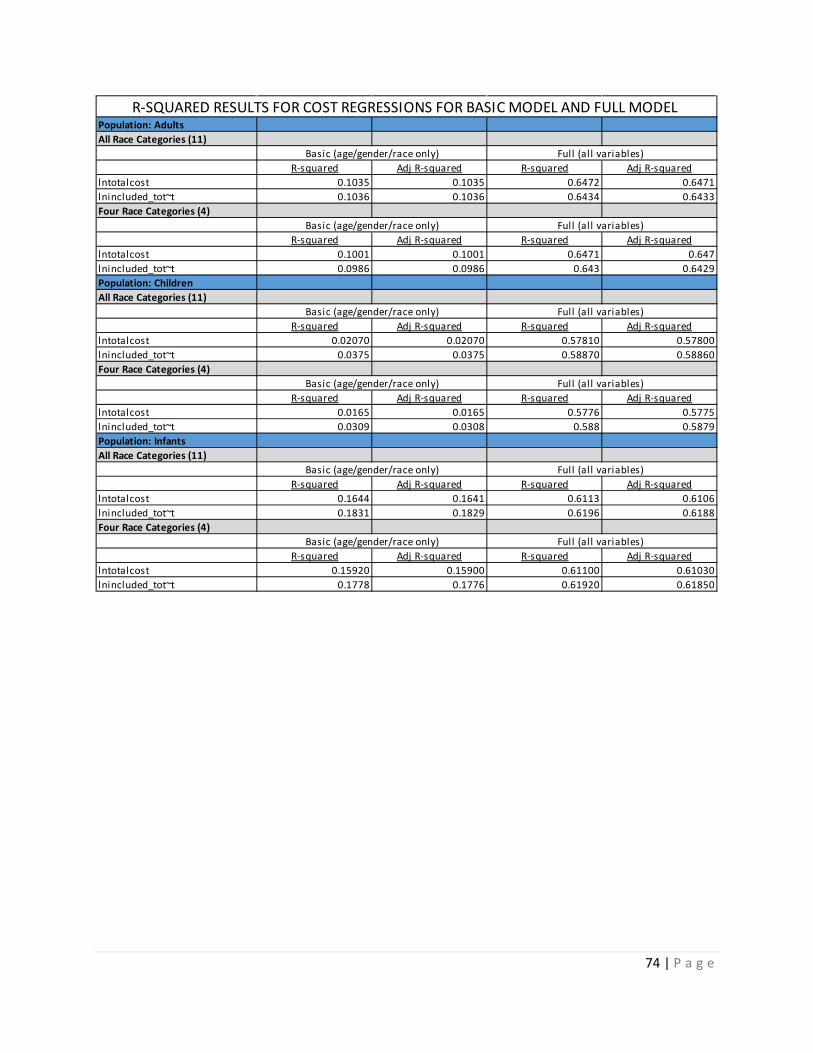
74 | P a g e
Population: Adults All Race Categories (11)
R-squared Adj R-squared R-squared Adj R-squaredlntotalcost 0.1035 0.1035 0.6472 0.6471lnincluded_tot~t 0.1036 0.1036 0.6434 0.6433Four Race Categories (4)
R-squared Adj R-squared R-squared Adj R-squaredlntotalcost 0.1001 0.1001 0.6471 0.647lnincluded_tot~t 0.0986 0.0986 0.643 0.6429Population: Children All Race Categories (11)
R-squared Adj R-squared R-squared Adj R-squaredlntotalcost 0.02070 0.02070 0.57810 0.57800lnincluded_tot~t 0.0375 0.0375 0.58870 0.58860Four Race Categories (4)
R-squared Adj R-squared R-squared Adj R-squaredlntotalcost 0.0165 0.0165 0.5776 0.5775lnincluded_tot~t 0.0309 0.0308 0.588 0.5879Population: InfantsAll Race Categories (11)
R-squared Adj R-squared R-squared Adj R-squaredlntotalcost 0.1644 0.1641 0.6113 0.6106lnincluded_tot~t 0.1831 0.1829 0.6196 0.6188Four Race Categories (4)
R-squared Adj R-squared R-squared Adj R-squaredlntotalcost 0.15920 0.15900 0.61100 0.61030lnincluded_tot~t 0.1778 0.1776 0.61920 0.61850
R-SQUARED RESULTS FOR COST REGRESSIONS FOR BASIC MODEL AND FULL MODEL
Basic (age/gender/race only) Full (all variables)
Basic (age/gender/race only) Full (all variables)
Basic (age/gender/race only) Full (all variables)
Basic (age/gender/race only) Full (all variables)
Basic (age/gender/race only) Full (all variables)
Basic (age/gender/race only) Full (all variables)